Back to Journals » Journal of Inflammation Research » Volume 16
Integration of RNA-Seq and Machine Learning Identifies Hub Genes for Empagliflozin Benefitable Heart Failure with Reduced Ejection Fraction
Authors Yang Q ![]() , Gao J, Wang TY, Ding JC, Hu PF
, Gao J, Wang TY, Ding JC, Hu PF
Received 27 July 2023
Accepted for publication 12 October 2023
Published 18 October 2023 Volume 2023:16 Pages 4733—4749
DOI https://doi.org/10.2147/JIR.S429096
Checked for plagiarism Yes
Review by Single anonymous peer review
Peer reviewer comments 3
Editor who approved publication: Professor Ning Quan
Qiang Yang,1,* Jing Gao,2,* Tian-Yu Wang,1 Jun-Can Ding,1 Peng-Fei Hu3
1Second Clinical Medical College, Zhejiang Chinese Medical University, Hangzhou, Zhejiang Province, 310053, People’s Republic of China; 2Department of Cardiology, Sir Run Run Shaw Hospital, College of Medicine Zhejiang University, Hangzhou, Zhejiang Province, 310018, People’s Republic of China; 3Department of Cardiology, the Second Affiliated Hospital of Zhejiang Chinese Medical University, Hangzhou, Zhejiang Province, 310005, People’s Republic of China
*These authors contributed equally to this work
Correspondence: Peng-Fei Hu, Department of Cardiology, the Second Affiliated Hospital of Zhejiang Chinese Medical University, Hangzhou, Zhejiang Province, 310005, People’s Republic of China, Tel +86 15267037741, Email [email protected]
Purpose: This study aimed to analyze the hub genes of heart failure with reduced ejection fraction (HFrEF) treated with Empagliflozin using RNA sequencing (RNA-seq) and bioinformatics methods, including machine learning.
Methods: From February 2021 to February 2023, nine patients with HFrEF were enrolled from our hospital’s cardiovascular department. In addition to routine drug treatment, these patients received 10 mg of Empagliflozin once daily for two months. Efficacy was assessed and RNA-seq was performed on peripheral blood before and after treatment with empagliflozin. HFrEF-related hub genes were identified through bioinformatics analyses including differential gene expression analysis, Gene Ontology (GO) and Kyoto Encyclopedia of Genes and Genomes (KEGG) enrichment analyses, immune infiltration analysis, machine learning, immune cell correlation analysis and clinical indicator correlation analysis.
Results: The nine patients included in this study completed a two-month treatment regimen, with an average age of 62.11 ± 6.36 years. By performing bioinformatics analysis on the transcriptome from the treatment groups, 42 differentially expressed genes were identified, with six being up-regulated and 36 being down-regulated (|log2FC|> 1 and adj.pvalue< 0.05). Immune infiltration analysis of these genes demonstrated a significant difference in the proportion of plasma between the pre-treatment and post-treatment groups (p< 0.05). Two hub genes, GTF2IP14 and MTLN, were finally identified through machine learning. Further analysis of the correlation between the hub genes and immune cells suggested a negative correlation between GTF2IP14 and naive B cells, and a positive correlation between MTLN and regulatory T cells and resting memory CD4+ T cells (p< 0.05).
Conclusion: Through RNA-seq and bioinformatics analysis, this study identified GTF2IP14 and MTLN as the hub genes of HFrEF, and their mechanisms may be related to immune inflammatory responses and various immune cells.
Keywords: HFrEF, empagliflozin, RNA-seq, machine learning, bioinformatics
Introduction
Heart failure (HF) is a complex clinical syndrome characterized by high mortality and hospitalization rates. Despite ongoing advancements in the prevention and diagnosis of cardiovascular diseases, the prevalence and mortality of HF remain high, making it a pressing public health issue.1
HF is categorized into three types based on left ventricular ejection fraction: HF with preserved ejection fraction (HFpEF), HF with mid-range ejection fraction (HFmrEF), and HF with reduced ejection fraction (HFrEF), among which HFrEF is the most detrimental, demonstrating the highest mortality rate.2 Regarding pharmacologic treatments for HF, specific medications have been recognized for their capacity to affect gene expression profiles, ultimately protecting heart function. These therapeutic agents, collectively termed epigenetic therapies, include hydralazine, metformin, statins, and sodium-glucose co-transporter 2 (SGLT2) inhibitors.3–5 Recently, SGLT2 inhibitors including Empagliflozin, Canagliflozin, and Dapagliflozin have been incorporated into the therapeutic options for HFrEF as a new class of antidiabetic drugs.6 Although large randomized studies, notably EMPEROR-Reduced and EMPA-REGOUTCOME, have confirmed the beneficial effects of Empagliflozin for treating HFrEF,7 the mechanism underlying Empagliflozin’s benefits for HFrEF patients remains elusive, making it crucial to explore Empagliflozin’s mode of action in HFrEF treatment.
With the advent of second-generation sequencing, it has become feasible to investigate the mechanisms of drug action at the molecular and genetic level. For example, RNA sequencing (RNA-seq) was applied in researching the preventive effects of japonica rice on lipopolysaccharide-induced acute lung injury,8 the protective effect of Dendrobium officinale alkaloids on hepatic toxicity of carbon tetrachloride in mice,9 as well as the cardiotoxicity of antipsychotic drugs and the underlying mechanisms involved.10,11 Additionally, single-cell RNA-seq analysis was performed to investigate the adverse effects of tamoxifen on adult neurogenesis.12 In light of these advancements, the objective of this study is to identify core gene targets associated with HFrEF in response to Empagliflozin treatment by recruiting clinically diagnosed patients and conducting comparative analyses of transcriptional gene changes before and after Empagliflozin administration using RNA-seq. This research endeavors to enhance the comprehension of Empagliflozin’s mechanisms in treating HFrEF and provide novel targets for improving HFrEF treatment.
Methods
Patients and Samples
This study enrolled patients diagnosed with HFrEF who visited our hospital’s cardiovascular department from February 2021 to February 2023. Initially, a total of 11 patients were strictly selected based on the diagnostic criteria outlined in the Chinese Guidelines for the Diagnosis and Treatment of Heart Failure 2018. These patients were subsequently divided into two groups: the “Before treatment” group (receiving standard treatment alone) and the “After treatment” group (receiving standard treatment plus Empagliflozin). Table 1 presents the basic information collected from these patients. During the follow-up, two patients were excluded from the study due to death and non-compliance with medication, resulting in a final cohort of nine patients. 10 mL of peripheral blood was extracted from the patients, and peripheral blood mononuclear cells (PBMCs) were isolated before and after Empagliflozin treatment.13
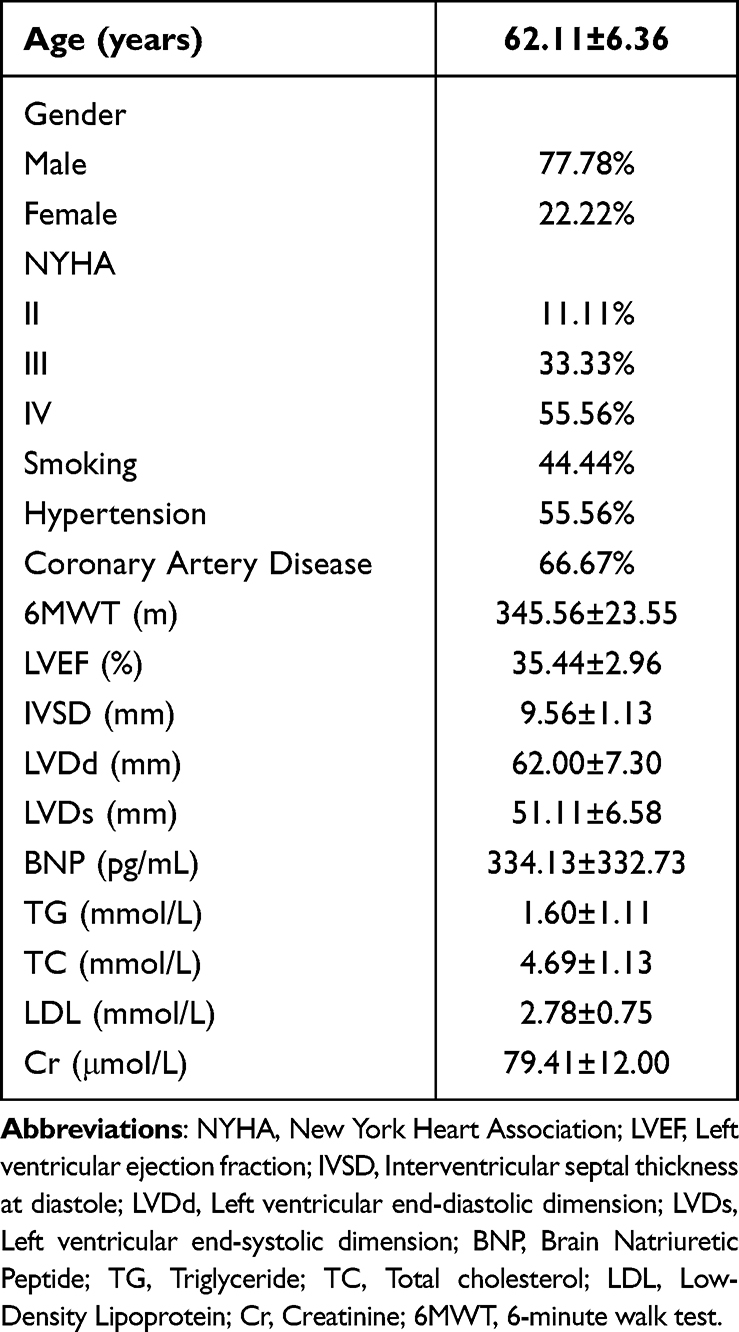 |
Table 1 General Information |
According to the Chinese Guidelines for the Diagnosis and Treatment of Heart Failure 2018, anti-HF drugs (ARNI/ACEI/ARB, β-blockers, MRA) and other conventional treatments such as cardiovascular secondary prevention, myocardial nutrition, improved myocardial perfusion are standard treatments. Empagliflozin, in this study, was orally administered once daily at a dose of 10 mg for two months.
This study was approved by the Ethics Committee of the Second Affiliated Hospital of Zhejiang Chinese Medical University (Approval No. 2022–045-IH01). Informed consent was obtained from all subjects prior to their enrollment.
Inclusion and Exclusion Criteria
Inclusion criteria: (1) Patients aged 18 years or above; (2) Patients diagnosed with HFrEF along with other co-morbidities in non-acute exacerbation; (3) Patients who had been on standardized HF treatment medications (ARNI/ACEI/ARB, β-blockers, MRA) for a minimum of 30 days.
Exclusion criteria: (1) Patients with cardiogenic shock, malignant arrhythmia and other critical or potentially life-threatening conditions; (2) Patients with severe renal insufficiency; (3) Patients with known allergies or intolerance to Empagliflozin; (4) Patients with a history of psychiatric illness or impaired consciousness, rendering them unable to cooperate.
Extraction of PBMCs
In this study, PBMCs were extracted from the collected human whole blood using the PBMC isolation solution (Solarbio P9010) within 2 h of sample collection according to the following steps: (1) The human whole blood was diluted with an equal volume of phosphate-buffered saline (PBS); (2) An equal volume of PBMC isolation solution was added into a centrifuge tube, the diluted blood was layered above the liquid level of the isolation solution, and centrifugation was carried out at room temperature with a horizontal rotor at 800 g for 30 min; (3) After centrifugation, clear stratification occurred, with the uppermost layer being the diluted plasma layer, the middle being the transparent isolate, and the white membrane layer between the plasma and the isolate containing PBMCs. Then, the PBMCs were carefully aspirated from the white membrane layer; (4) The obtained PBMCs were washed twice with 10 mL of PBS, and centrifuged for 10 min with a horizontal rotor at 250 g; (5) The resulting supernatant was discarded, leaving the precipitate, which were PBMCs.13
RNA Extraction and RNA-Seq
Total RNA was extracted using the Trizol reagent (Thermo Fisher, 15596018). In this study, RNA from all samples was isolated and purified. The RNA integrity was subsequently assayed, ensuring concentrations>50 ng/μL, RIN values>7.0, and total RNA>1 μg, thus meeting the requirements for downstream experiments. To specifically capture mRNA with polyadenylate (polyA), two rounds of purification was carried out using oligo (dT) magnetic beads (Dynabeads Oligo (dT), cat. 25–61005, Thermo Fisher, USA). The captured mRNA was fragmented at 94°C for 5–7 min, and subsequently served as a template for cDNA synthesis facilitated by reverse transcriptase (Invitrogen SuperScriptTM II Reverse Transcriptase, cat. 1896649, CA, USA). The obtained cDNA was subjected to PCR-pre-denaturation, involving a 3-min hold at 95°C, followed by denaturation at 98°C for a total of 8 cycles, each lasting 15s, along with annealing for 15s in each cycle. Afterwards, the cDNAs were amplified through PCR-pre-denaturation at 95°C for 3 min, followed by denaturation at 98°C for a total of 8 cycles, with each cycle lasting 15s, annealing at 60°C for 15s, extension at 72°C for 30s, and concluding with a final extension at 72°C for 5 min. This process resulted in libraries with a fragment size of 300 bp ± 50 bp (strand-specific libraries). Finally, bipartite sequencing was conducted using the Illumina NovaSeq™ 6000 following standard operating procedures, with the sequencing mode of PE150.
Statistical Mapping of Gene Expression Value Distribution
The gene expression values for each sample were visualized using FPKM box plots and violin plots. The abscissa represented the sample name, and the ordinate represented log10 (FPKM). Each box plot corresponded to five statistical measures: the maximum value, the upper quartile, the median value, the lower quartile, and the minimum value.
Volcano Maps and Heat Maps
Differential expression analysis was performed on the expression files of both the “Before treatment” and “After treatment” groups using the limma package in R (version 4.4.1). The threshold was set at |log2FC| > 1 and adj. Pvalue < 0.05. Visual analysis of the differential expression results was conducted using the ggplot2 and heatmap packages, which resulted in the generation of corresponding volcano maps and heatmaps.
Gene Ontology (GO) and Kyoto Encyclopedia of Genes and Genomes (KEGG) Enrichment Analyses
Enrichment analysis and visual representation of the differentially expressed genes were performed using the clusterProfiler, ggplot2, and GOplot packages in R.
Immune Infiltration Analysis
The CIBERSORT package (version 1.04) in R (version 4.2.2) was utilized for immune infiltration analysis. Parameters perm=1000 and QN=FALSE were set to filter the immune infiltration results, and samples with p<0.05 were selected for subsequent analysis. Based on the immune infiltration results, a bar graph representing the relative proportions of immune-infiltrated cells in the samples was generated. Additionally, the corrplot package (version 0.92) was employed for immune cell correlation analysis. The vioplot package (version 0.3.7) was applied to analyze and create violin plots between the control and UC groups.
Machine Learning
Lasso analysis was performed using the glmnet package (version 4.1–4), and random forest analysis was conducted using the randomForest package (version 4.7–1.1) based on MeanDecreaseGini > 0.5. Support vector machine-recursive feature elimination (SVM-RFE) analysis was carried out using the e1071 (version 1.7–11) and caret (version 6.0–92) packages. The intersection of results from these three types of machine learning analyses was visualized using a Venn diagram.
Hub Gene Expression and ROC Analysis
The ggplot2 package (version 3.3.6) and ggpubr package (version 0.4.0) were used to analyze hub gene expression between groups. P-values were obtained using the Wilcoxon method, and a gene expression box plot was generated. ROC analysis was conducted using the pROC package (version 1.18.0), and ROC curves were plotted. Finally, a histogram illustrating hub gene expression was plotted for each patient.
Correlation Analysis of Hub Genes and Immunity
The ggpubr package (version 0.4.0) and ggExtra package (version 0.10.0) were used to analyze the correlation between genes and immune cells using the Spearman method. Scatter plots were generated for statistically significant correlations (p<0.05), and a lollipop diagram was plotted using R, showing the correlation between genes and immune cells.
Correlation Analysis of Hub Genes and Clinical Indicators
In this study, we used the ggplot (v3.4.3) package and the ggExtra (v0.10) package to plot scatter plots of hub genes versus cardiac ultrasound indices and 6MWT. The fitted curves and equations were plotted using the stat_smooth function in them. The correlation between hub genes and cardiac ultrasound indexes and 6MWT was analyzed using the stat_cor function in the ggpubr package (v0.4.0) (the correlation analysis method was Pearson).
Statistical Analysis
In this study, data were preprocessed and analyzed using SPSS 22.0 and R software, including ID conversion and duplicate elimination. Paired t-tests were applied to calculate parameters before and after treatment, and P<0.05 was statistically significant between groups. Graphs were plotted using R software, GraphPad Prism, and online plotting tools to provide a comprehensive description of the statistical methods used throughout this study.
Results
General Information
All the nine patients enrolled in this study completed a two-month course of Empagliflozin treatment. There were seven male cases (77.78%) and two female cases (22.22%), with an average age of 62.11 ± 6.36 years. According to the New York Heart Association (NYHA) functional classification, the distribution of these patients was as follows: Grade IV (55.56%), Grade III (33.33%), and Grade II (11.11%). A history of smoking was reported in 44.44% of the patients, while 55.56% had a history of hypertension, and 66.67% had a history of coronary heart disease. These patients exhibited the following average clinical parameters: an ejection fraction (EF) of 35.44 ± 2.96%; a 6MWT of 345.56±23.55 m; interventricular septal thickness at end-diastole (IVSD) measuring 9.56 ± 1.13 mm, left ventricular internal diameter at end-diastole (LVDd) measuring 62.00 ± 7.30 mm, and left ventricular internal diameter at end-systole (LVDs) measuring 51.11 ± 6.58 mm; a B-type natriuretic peptide (BNP) level of 334.13 ± 332.73 pg/mL; a triglyceride (TG) level of 1.60 ± 1.11 mmol/L, a total cholesterol (TC) level of 4.69 ± 1.13 mmol/L, and a low-density lipoprotein (LDL) level of 2.78 ± 0.75 mmol/L; as well as a creatinine (Cr) level of 79.41 ± 12.00 μmol/L (Raw data can be found in Supplementary Table 1).
Observation on the Efficacy of Empagliflozin
In this study, we observed the indexes of cardiac ultrasound and 6MWT before and after two-month treatment with Empagliflozin. Compared with the “Before treatment” group, the cardiac ultrasound indexes improved in the “After treatment” group, with no significant difference (P>0.05) (Figure 1A-D), and the 6MWT increased significantly (P<0.05), suggesting the effectiveness of the treatment (Figure 1E). In order to clarify whether Empagliflozin exerts effects on cardiac ultrasound indexes, we recorded the indexes for an additional six months after treatment. As a result, the cardiac ultrasound indexes including EF, LVDd, LVDs and 6MWT all suggested Empagliflozin’s effects in significantly improving HFrEF (P < 0.01), except for IVSD, which showed no significant difference (P > 0.01) (Figure 1A-D). As expected, significant changes in 6MWT remained after six months of treatment (Figure 1E) (Raw data can be found in Supplementary Tables 2 and 3).
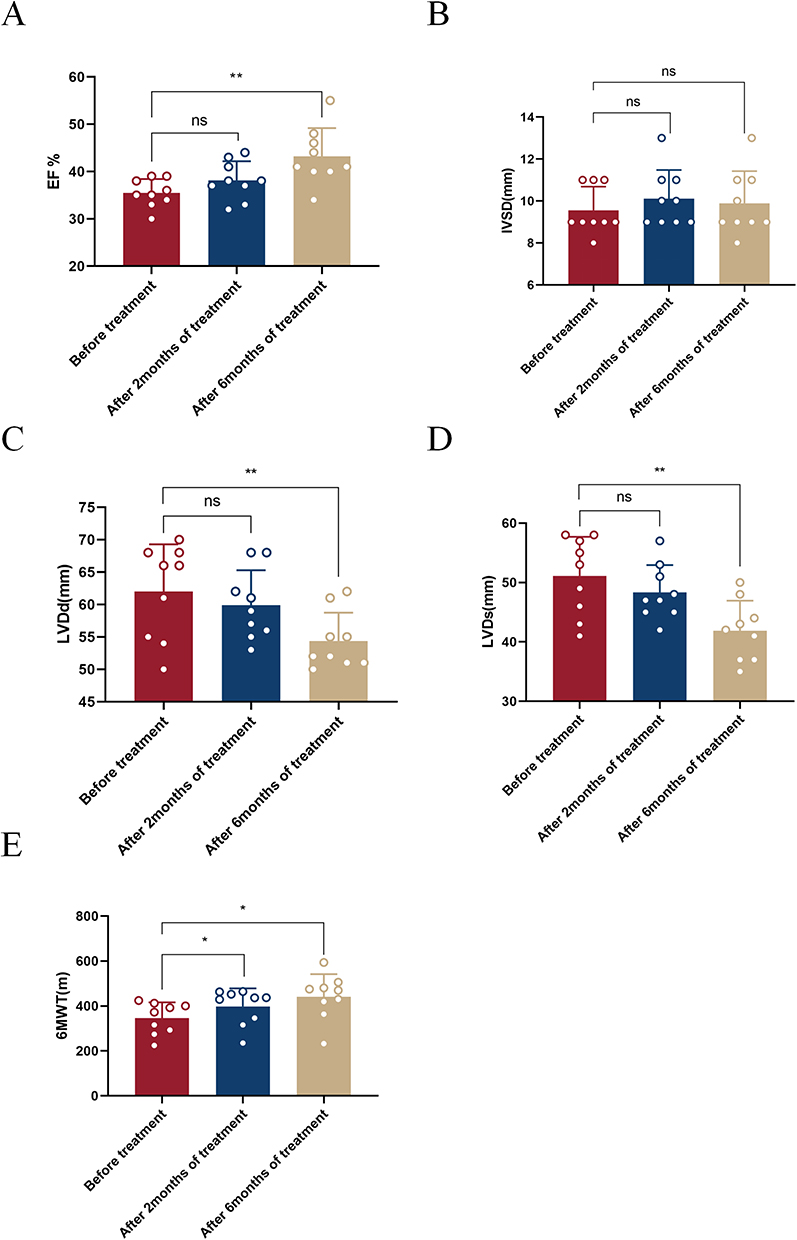 |
Figure 1 Observation on the efficacy of Empagliflozin. (A) Histogram comparing EF before treatment and after 2/6 months of treatment; (B) Histogram comparing IVSD before treatment and after 2/6 months of treatment; (C) Histogram comparing LVDd before treatment and after 2/6 months of treatment; (D) Histogram comparing LVDs before treatment and after 2/6 months of treatment; (E) Histogram comparing 6MWT before treatment and after 2/6 months of treatment (ns: P>0.05, *P<0.05, **P<0.01). |
Distribution Statistics of Gene Expression Values
The FPKM box plot (Figure 2A) and violin plot (Figure 2B) were generated based on the gene expression values of each sample. These plots revealed similar gene expression values across the samples, indicating the absence of biological replicate samples.
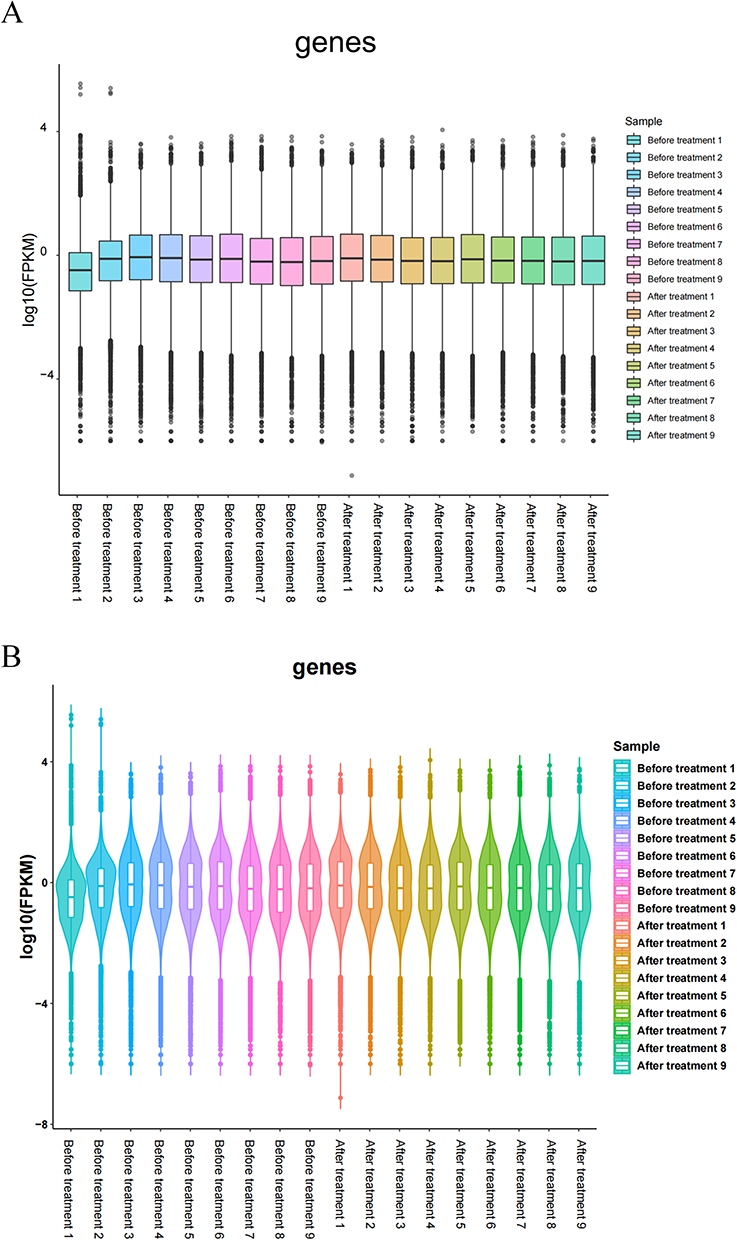 |
Figure 2 Distribution of gene expression values. (A) Box plot of FPKM values; (B) Violin map of FPKM values. |
Differential Gene Expression Analysis
Differential gene expression analysis was conducted on the peripheral blood gene expression data from both the “Before treatment” and “After treatment” groups. The count of differentially expressed genes, both up-regulated (log2FC≥1 and q<0.05) and down-regulated (log2FC≤-1 and q<0.05), was determined for each comparison group. A total of 42 differentially expressed genes were identified, with six being up-regulated and 36 being down-regulated. This analysis resulted in the generation of a volcano plot (Figure 3A) a histogram (Figure 3B), and a heatmap displaying all differentially expressed genes (Figure 3C).
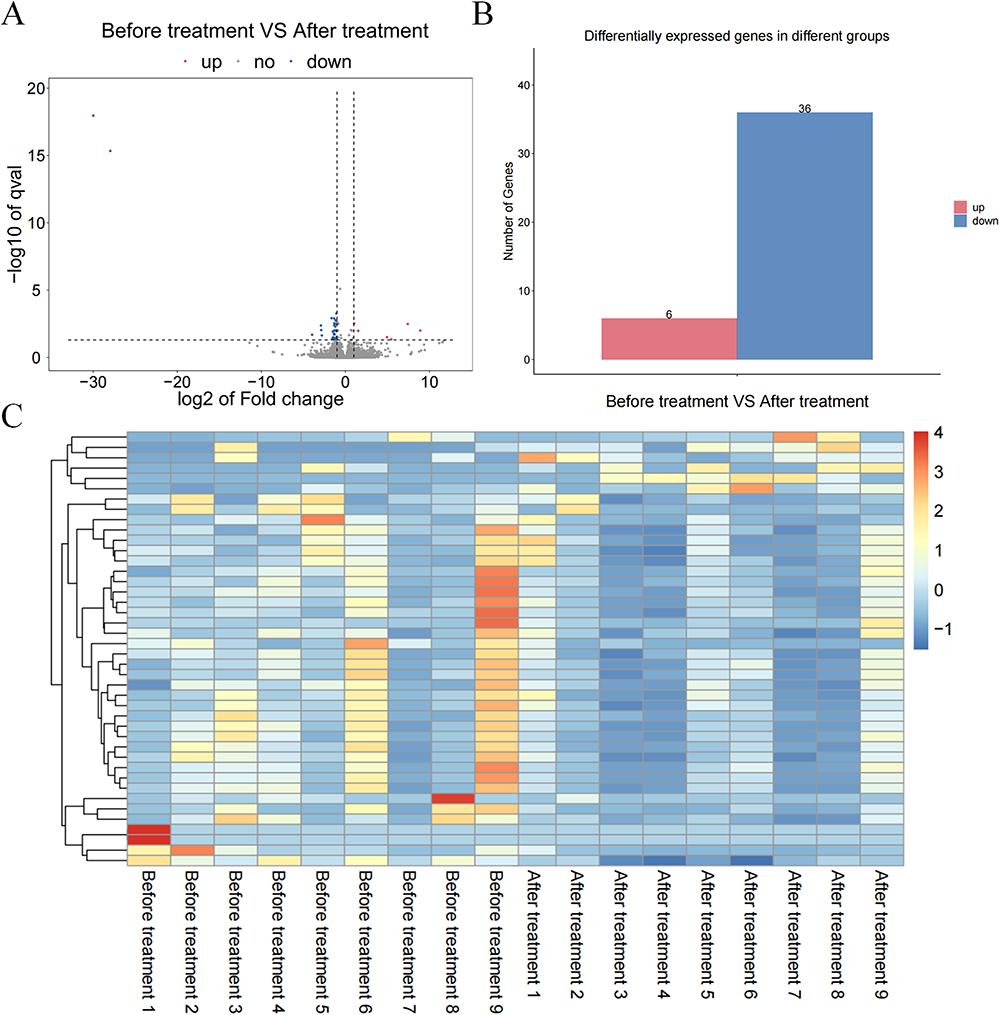 |
Figure 3 Analysis of the differentially expressed genes. (A) Volcano map of the Before treatment VS After treatment groups (| log2FC | > 1, P < 0.05); (B) Gene expression changes in the Before treatment VS After treatment groups; (C) Heat map of the Before treatment VS After treatment groups. |
GO & KEGG Enrichment Analyses
The 42 differentially expressed genes were subjected to GO and KEGG enrichment analyses. A histogram illustrating the results of GO enrichment analysis was generated (Figure 4A), which involved the categories of biological processes (BP), cellular components (CC), and molecular functions (MF). Additionally, bubble charts were drawn to visualize significant BP (Figure 4B). Specifically, GO enrichment analysis revealed significant enrichment of these differentially expressed genes in the immune system, adaptive immune response, and innate immune response (BP); as well as in the membrane and immunoglobulin complex (CC), and in antigen binding and immunoglobulin receptor binding (MF). Furthermore, a bubble diagram showing the results of KEGG enrichment analysis (Figure 4C) revealed enrichment of these differentially expressed genes in heparan sulfate/heparin and other related pathways.
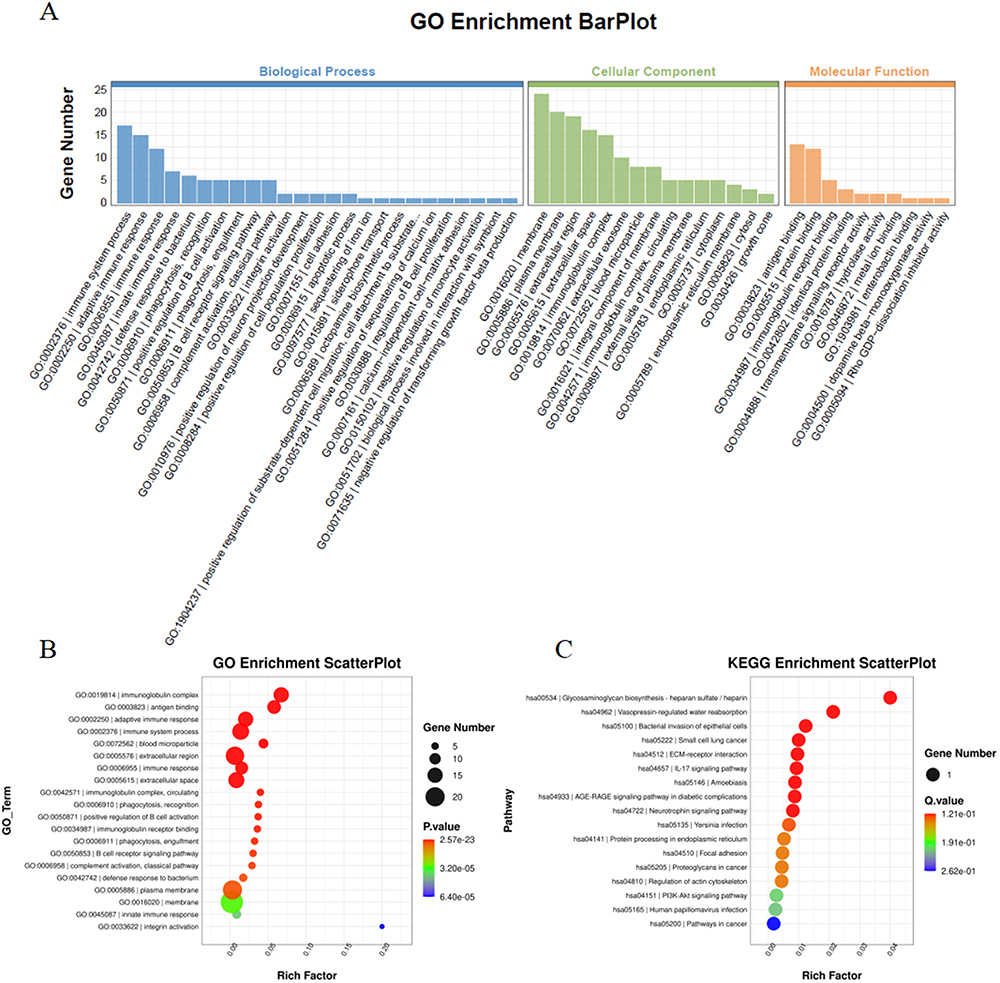 |
Figure 4 GO & KEGG enrichment analyses. (A) GO and KEGG enrichment analyses of the differentially expressed genes; (B) Bubble diagram showing the biological processes after GO enrichment analysis; (C) Bubble Diagram showing KEGG enrichment analysis results. |
Immune Infiltration Analysis
CIBERSORT was employed to analyze the immune infiltration in both the “Before treatment” and “After treatment” groups. The results of immune infiltration analysis were visualized through a bar graph, which illustrated the relative proportions of immune-infiltrating cells in the samples (Figure 5A). Furthermore, a correlation heatmap was created to demonstrate the relationship among different immune cells (Figure 5B). Subsequently, violin plots were drawn to facilitate group comparisons (Figure 5C). According to the results (P < 0.05), there was a significant difference in the proportion of plasma cells between the “After treatment” and “Before treatment” groups (P=0.011), while no significant differences were observed in other immune cells (P>0.05).
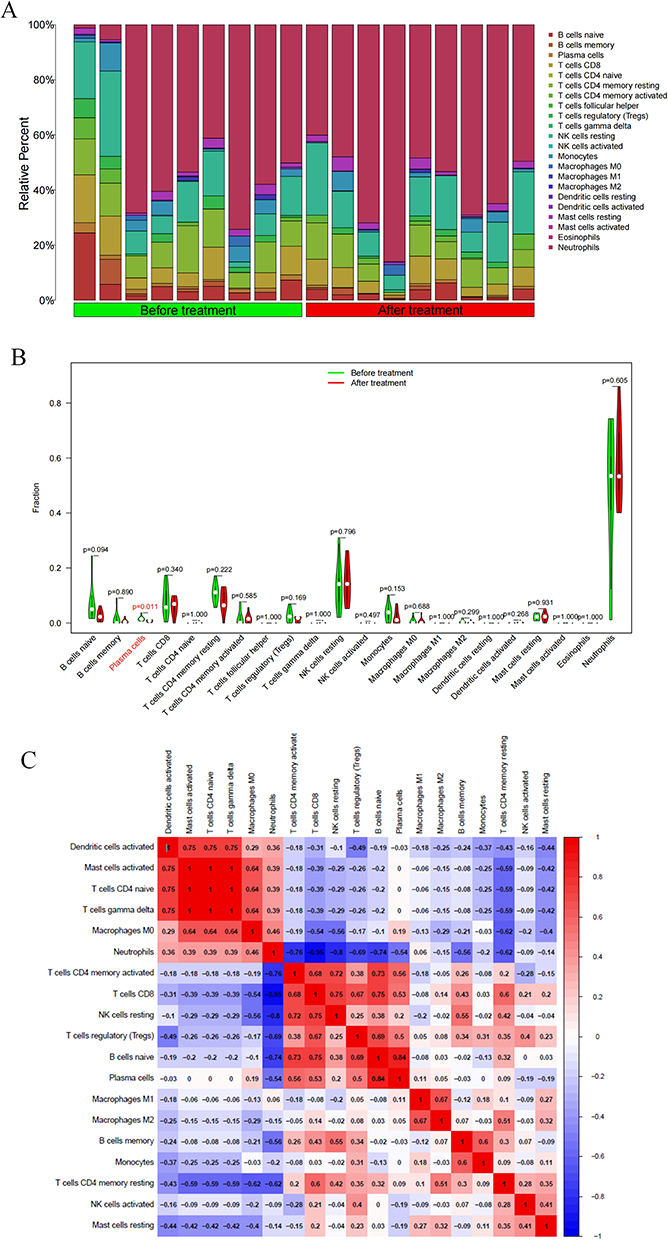 |
Figure 5 Immune correlation analysis. (A) Bar chart showing the immune infiltration analysis results in the Before treatment VS After treatment groups; (B) Violin chart showing the immune infiltration analysis results in the Before treatment VS After treatment groups (Cells with p < 0.05 have shown red color); (C) Heat map showing the correlation between immune cells. |
Screening of Hub Genes by Machine Learning
The results of lasso analysis on the 42 differentially expressed genes are shown in Figure 6A and B. Four genes (Figure 6C and D) were identified through random forest analysis, and 34 were obtained after SVM-RFE analysis (Figure 6E). To visualize the intersection of the results from these three machine learning analyses, a Venn diagram was drawn (Figure 6F). Ultimately, GTF2IP14 and MTLN were identified as hub genes.
 |
Figure 6 Machine learning. (A and B) Lasso analysis of the differentially expressed genes; (C and D) Random forest analysis of the differentially expressed genes; (E) SVM-RFE analysis of the differentially expressed genes; (F) Venn diagrams of the intersected results from lasso analysis, random forest analysis, and SVM-RFE analysis. |
Original Dataset Verification
The expression levels of the hub genes (GTF2IP14 and MTLN) in both the “After treatment” and “Before treatment” groups was analyzed, and corresponding gene expression box plots were generated (Figure 7A and B). Specifically, GTF2IP14 expression was up-regulated after treatment, while MTLN expression was down-regulated (Figure 7A and B). The P values for GTF2IP14 and MTLN were 0.021 and 0.00048, respectively. Subsequently, receiver operating characteristic (ROC) analysis was performed, after which ROC curves were plotted (Figure 7C and D). The area under the curve (AUC) for GTF2IP14 and MTLN was 0.604 and 0.977, respectively. Detailed information regarding GTF2IP14 and MTLN expression in individual patients can be found in the Supplementary Materials, revealing a consistent pattern of upregulation for GTF2IP14 and downregulation for MTLN after treatment (Supplementary Figure 1A and B).
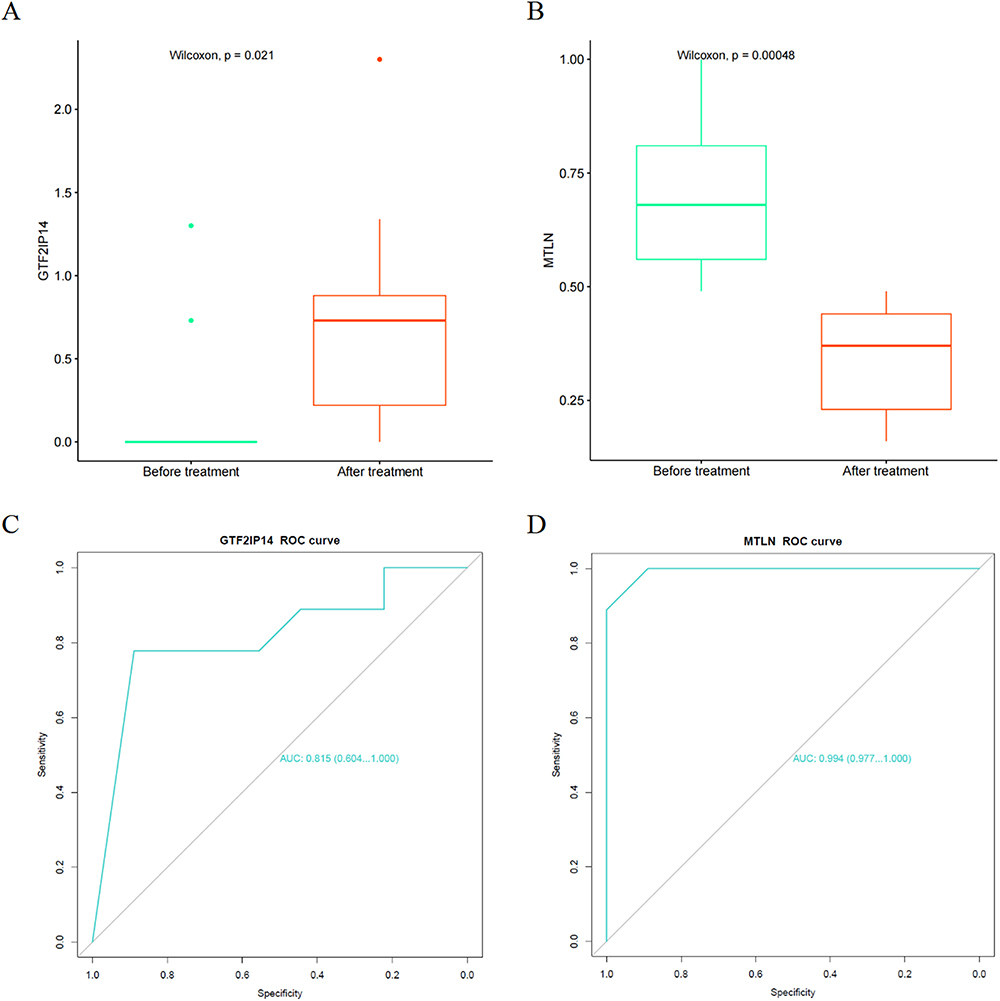 |
Figure 7 Verification of the hub genes. (A) GTF2IP14 expression in the Before treatment VS After treatment groups; (B) MTLN expression in the Before treatment VS After treatment groups; (C) ROC curve of GTF2IP14; (D) ROC curve of MTLN. |
Analysis of the Correlation Between Hub Genes and Immunity
The correlation between the hub genes (GTF2IP14 and MTLN) and immune cells was analyzed using the Spearman method, and a lollipop chart was generated to illustrate the analysis results (Figure 8A and B). GTF2IP14 was revealed to be significantly correlated with naive B cells, while MTLN exhibited significant correlations with regulatory T cells (Tregs) and resting memory CD4+ T cells. To further visualize these correlations, a scatter plot was created. GTF2IP14 was found to be negatively correlated with naive B cells (Figure 8C), whereas MTLN was positively correlated with Tregs as well as resting memory CD4+ T cells (Figure 8D and E).
 |
Figure 8 Correlation analysis of hub genes and immunity. (A) Lollipop map of the correlation between GTF2IP14 and immune cells (Values with p < 0.05 have been marked in red); (B) Lollipop map of the correlation between MTLN and immune cells (Values with p < 0.05 have been marked in red); (C) Scatter plot of the correlation between GTF2IP14 and naive B cells; (D) Scatter plot of the correlation between MTLN and Tregs; (E) Scatter plot of the correlation between MTLN and resting memory CD4+ T cells. |
Analysis of the Correlation Between Hub Genes and Clinical Indicators
In this study, GTF2IP14 was found to have no significant correlation with cardiac ultrasound indexes or the 6MWT (P > 0.05) (Supplementary Figure 2A, C, E, G and I), while MTLN demonstrated a correlation with the 6MWT (P < 0.05) but no correlation with cardiac ultrasound indexes (Supplementary Figure 2B, D, F, H and J).
Discussion
HF is a clinical syndrome characterized by dyspnea or limited movement due to ventricular filling and cardiac ejection dysfunction14 Although SGLT2 inhibitors like Empagliflozin have emerged as a novel treatment for HFrEF, the exact mechanism underlying their benefits remains elusive. Therefore, investigating the mechanism of Empagliflozin in the treatment of HFrEF is of great significance. In this study, we enrolled patients with HFrEF, and supplemented their existing treatment with oral Empagliflozin (10 mgqd). The blood samples before and after treatment were collected for peripheral blood RNA-seq. Moreover, the data of post-treatment cardiac ultrasound as well as the 6MWT were collected to assess the efficacy of Empagliflozin in treating HFrEF. By performing bioinformatics analysis on the RNA-seq results, 42 differentially expressed genes were obtained before and after treatment, with six being up-regulated and 36 being down-regulated. To further investigate the role of these genes, GO & KEGG enrichment analyses were respectively conducted. According to GO enrichment analysis, these genes were shown to be primarily enriched in the membrane and immunoglobulin complex (BP); the immune system, adaptive immune response, and innate immune response (CC); and antigen binding and immunoglobulin receptor binding (MF). The KEGG pathway revealed enrichment of these genes in heparan sulfate/heparin and other related pathways.
Our enrichment analysis results indicated a close correlation between Empagliflozin’s mechanism of action and the immune response. Patients with HF often exhibit a systemic pro-inflammatory state, involving both innate and adaptive immunity15 Hence, inflammation is a critical process of the immune response and reflects the initiation and activation of this response. According to relevant cell experiments, Empagliflozin was revealed to concurrently reduce pro-inflammatory cytokines such as IL-1β, IL-6 and chemokine through the IKK/NF-JATB, JAK2/STAT1/3, and MKK4/7-κ pathways, thereby inhibiting the inflammatory response of RAW264.7 macrophages16 Further animal experiments demonstrated Empagliflozin’s inhibitory effects on the inflammatory response mediated by the IL-17/IL-23 axis, thus reducing liver injury in type 2 diabetic mice with non-alcoholic fatty liver.17 Clinically, Empagliflozin has been observed to inhibit the activation of NLRP3 inflammasomes and decrease the secretion of IL1β by human macrophages, potentially reducing the incidence of HF.18 Based on the enrichment analysis results, the relationship between the differentially expressed genes and the distribution of 22 types of immune cell subtypes was further analyzed. A statistically significant difference was found in one immune cell subtype (plasma cells) before and after treatment. Plasma cells, also known as effector B cells, are a kind of immune cells that can secrete antibodies, and differentiate and proliferate upon antigen stimulation. In a healthy heart, approximately 10% of B cells are involved in regulating the transport of myocardial immune cells, as well as the structure and function of the left ventricle.19 Therefore, B cells play a crucial role in heart tissue. Current understanding of B cells’ role in HF is primarily centered in two aspects: (1) B cells secrete anti-myocardial antibodies, directly causing myocardial damage;20 (2) B cells activate the complement system and overexpress TNF-α in the myocardium, leading to cardiomyocyte hypertrophy, cardiac fibrosis, and apoptosis, which are all key factors in cardiomyocyte injury in HF.20 As reported in a study of myocardial tissue in end-stage heart failure, it was found that immunoglobulin G deposits in up to 70% of the heart tissue.21 In HF, injury-associated molecular patterns are released from damaged cardiomyocytes. These patterns then interact with B cells, subsequently activating T cells and establishing a comprehensive pro-inflammatory environment. This process results in poor ventricular remodeling and impaired function.21 Recent studies have revealed Empagliflozin’s cardioprotective effects against myocardial injury by regulating B cells, suggesting that B cells may be one of its target cells.22
In this study, two hub genes: GTF2IP14 and MTLN were identified by performing lasso analysis, random forest analysis, and SVM-RFE analysis. Then, to investigate whether GTF2IP14 and MTLN were correlated with the clinical data, a correlation analysis was conducted. Neither GTF2IP14 nor MTLN showed significant correlations with cardiac ultrasound, and a possible correlation was revealed between MTLN and 6MWT. Expression verification was performed in the original dataset and a corresponding ROC curve was plotted. GTF2IP14 is classified as a pseudogene of GTF2I, which is a DNA sequence in the genome resembling a normal gene but not expressed.23 Traditionally, pseudogenes were considered functionless. However, recent studies suggest that pseudogenes may play crucial roles in various diseases through true genes. For instance, pseudogene GTF2IP23 can inhibit the proliferation of breast cancer cells by affecting the expression of GTF2I.24 Another pseudogene PTENP1 may impact the onset and progression of prostate tumors by regulating the expression of tumor suppressor gene PTEN.25 GTF2I, the true gene of GTF2IP14, belongs to the family of general transcription factors. It resides in the cytoplasm, translocates to the nucleus during transcription, and is broadly expressed in human cells.26 GTF2I is involved in various autoimmune diseases, such as Sjogren’s syndrome, systemic lupus erythematosus, and rheumatoid arthritis, and is closely associated with heavy chain immunoglobulin transcription and T cell receptor signaling.26 MTLN encodes mitoregulatory proteins, which are highly expressed in myocardial and skeletal muscle and localized in the mitochondrial intima. They are associated with respiration, Ca2+ balance, and maintenance of cellular redox potential related to ATP production.27 MTLN can influence mitochondrial respiration, Ca2+ buffering capacity, as well as the levels of reactive oxygen species.28 Mitochondrial respiration and Ca2+ buffering are closely related to HF.29 After the onset of HF, the aerobic oxidation capacity of cardiomyocyte mitochondria is decreased, resulting in insufficient energy production of myocardial mitochondria respiration, ventricular remodeling, decrease of ejection fraction, and even the development of HFrEF.30 Additionally, cytoplasmic Ca2+ overload and decreased mitochondrial Ca2+ concentration in HF cardiomyocytes frequently lead to myocardial dysfunction.31 Therefore, Ca2+ homeostasis is closely related to cardiomyocyte contraction and HF. For example, medullary growth factors mitigate HF caused by stress overload by protecting the Ca2+ cycling capacity.32 CXCR4 enhances β-adrenergic-mediated calcium mobilization of cardiomyocytes and regulates cardiomyocyte contractility.33 Regrettably, there is still an absence of studies on researching the mechanism of GTF2IP14 and MTLN in HF, necessitating basic experiments to prove the relationship between GTF2IP14 and HF.
Lastly, through correlation analysis, GTF2IP14 was demonstrated to be significantly negatively correlated with naive B cells, and MTLN was significantly positively correlated with Tregs and resting memory CD4+ T cells. However, there is a lack of comprehensive studies on the correlation between GTF2IP14 and naive B cells. Given the effect of pseudogenes on true genes, it’s worth noting that GTF2I is closely involved in the transcription of heavy chain immunoglobulin, and antibodies secreted by B cells are critical immunoglobulins. Thus, it is speculated that GTF2IP14 may regulate the transcription level of immunoglobulins by influencing the expression of GTF2I, and affect the biological process of antibody secretion by naive B cells after maturation. Tregs become a Th1-like proinflammatory subgroup and contribute to poor ventricular remodeling in HF mice.34 Clinically, a lower frequency of Tregs is positively associated with a higher risk of cardiovascular disease and can serve an independent predictor of worsening re-hospitalization in patients with HF.35 Unfortunately, there is insufficient research regarding the relationship between MTLN and Tregs, as well as resting memory CD4+ T cells, necessitating further basic experiments to verify the correlation.
In summary, RNA-seq and bioinformatics analysis were applied in this study to gain insights into the mechanism of Empagliflozin in treating HFrEF, revealing its potential association with the immune inflammatory response. GTF2IP14 and MTLN were ultimately identified as hub genes that may interact with various immune cells. At the molecular and genetic levels, this study provides novel insights into Empagliflozin’s mechanism in treating HFrEF, which provide a new potential therapeutic target for HFrEF. However, this study has certain limitations. First, due to the unavailability of cardiac tissue samples, this study lacks specificity. Additionally, the results have not been verified through animal and cell experiments. Secondly, the relatively small sample size may impact the reliability of the results, necessitating further validation of the research findings.
Conclusion
In this study, through RNA-seq and various bioinformatics analyses, GTF2IP14 and MTLN were finally identified as hub genes for Empagliflozin-treated HFrEF. Based on our findings, it is proposed that the involved mechanism of action may be associated with the immune inflammatory response and various types of immune cells.
Ethics Approval and Informed Consent
This study was conducted in accordance with the Declaration of Helsinki and was approved by the Ethics Committee of the Second Affiliated Hospital of Zhejiang Chinese Medical University (Approval No. 2022-045-IH01). Informed consent was obtained from all subjects prior to enrollment.
Funding
This study was supported by the Zhejiang Medicine and Health Science and Technology Plan Project (project number: 2020KY205), the Natural Science Foundation of Zhejiang Province (project number: LY20H020005) and the Zhejiang TCM Science and Technology Planning Project (project number: 2022ZA082).
Disclosure
The authors report no conflicts of interest in this work.
References
1. Wang H, Chai K, Du M, et al. Prevalence and Incidence of Heart Failure Among Urban Patients in China: a National Population-Based Analysis. Circ Heart Fail. 2021;14(10):e008406. doi:10.1161/CIRCHEARTFAILURE.121.008406
2. Emmons-Bell S, Johnson C, Roth G. Prevalence, incidence and survival of heart failure: a systematic review. Heart. 2022;108(17):1351–1360. doi:10.1136/heartjnl-2021-320131
3. Napoli C, Bontempo P, Palmieri V, et al. Epigenetic Therapies for Heart Failure: current Insights and Future Potential. Vasc Health Risk Manag. 2021;17:247–254. doi:10.2147/VHRM.S287082
4. Sarno F, Benincasa G, List M, et al. Clinical epigenetics settings for cancer and cardiovascular diseases: real-life applications of network medicine at the bedside. Clin Epigenetics. 2021;13(1):66. doi:10.1186/s13148-021-01047-z
5. Gronda E, Lopaschuk GD, Arduini A, et al. Mechanisms of action of SGLT2 inhibitors and their beneficial effects on the cardiorenal axis. Can J Physiol Pharmacol. 2022;100(2):93–106. doi:10.1139/cjpp-2021-0399
6. McDonagh TA, Metra M, Adamo M, et al. 2021 ESC Guidelines for the diagnosis and treatment of acute and chronic heart failure. Eur Heart J. 2021;42(36):3599–3726. doi:10.1093/eurheartj/ehab368
7. Zannad F, Ferreira JP, Pocock SJ, et al. SGLT2 inhibitors in patients with heart failure with reduced ejection fraction: a meta-analysis of the EMPEROR-Reduced and DAPA-HF trials. Lancet. 2020;396(10254):819–829. doi:10.1016/S0140-6736(20)31824-9
8. Liu C, Yin Z, Feng T, et al. An integrated network pharmacology and RNA-Seq approach for exploring the preventive effect of Lonicerae japonicae flos on LPS-induced acute lung injury. J Ethnopharmacol. 2021;264(113364):113364. doi:10.1016/j.jep.2020.113364
9. Zhang Y, Zhou J, Liu J, et al. RNA-Seq analysis of the protection by Dendrobium nobile alkaloids against carbon tetrachloride hepatotoxicity in mice. Biomed Pharmacother. 2021;137(111307):111307. doi:10.1016/j.biopha.2021.111307
10. Li L, Gao P, Tang X, et al. CB1R-stabilized NLRP3 inflammasome drives antipsychotics cardiotoxicity. Signal Transduct Target Ther. 2022;7(1):190. doi:10.1038/s41392-022-01018-7
11. Wang J, Li X, Liu Z, et al. Second-generation antipsychotics induce cardiotoxicity by disrupting spliceosome signaling: implications from proteomic and transcriptomic analyses. Pharmacol Res. 2021;170(105714):105714. doi:10.1016/j.phrs.2021.105714
12. Lee CM, Zhou L, Liu J, et al. Single-cell RNA-seq analysis revealed long-lasting adverse effects of tamoxifen on neurogenesis in prenatal and adult brains. Proc Natl Acad Sci U S A. 2020;117(32):19578–19589. doi:10.1073/pnas.1918883117
13. Benincasa G, Maron BA, Affinito O, et al. Association Between Circulating CD4(+) T Cell Methylation Signatures of Network-Oriented SOCS3 Gene and Hemodynamics in Patients Suffering Pulmonary Arterial Hypertension. J Cardiovasc Transl Res. 2023;16(1):17–30. doi:10.1007/s12265-022-10294-1
14. Triposkiadis F, Xanthopoulos A, Parissis J, et al. Pathogenesis of chronic heart failure: cardiovascular aging, risk factors, comorbidities, and disease modifiers. Heart Fail Rev. 2022;27(1):337–344. doi:10.1007/s10741-020-09987-z
15. Paulus WJ, Zile MR. From Systemic Inflammation to Myocardial Fibrosis: the Heart Failure With Preserved Ejection Fraction Paradigm Revisited. Circ Res. 2021;128(10):1451–1467. doi:10.1161/CIRCRESAHA.121.318159
16. Lee N, Heo YJ, Choi SE, et al. Anti-inflammatory Effects of Empagliflozin and Gemigliptin on LPS-Stimulated Macrophage via the IKK/NF-κB, MKK7/JNK, and JAK2/STAT1 Signalling Pathways. J Immunol Res. 2021;2021(9944880):1–11. doi:10.1155/2021/9944880
17. Meng Z, Liu X, Li T, et al. The SGLT2 inhibitor empagliflozin negatively regulates IL-17/IL-23 axis-mediated inflammatory responses in T2DM with NAFLD via the AMPK/mTOR/autophagy pathway. Int Immunopharmacol. 2021;94(107492):107492. doi:10.1016/j.intimp.2021.107492
18. Kim SR, Lee SG, Kim SH, et al. SGLT2 inhibition modulates NLRP3 inflammasome activity via ketones and insulin in diabetes with cardiovascular disease. Nat Commun. 2020;11(1):2127. doi:10.1038/s41467-020-15983-6
19. Sun Y, Pinto C, Camus S, et al. Splenic Marginal Zone B Lymphocytes Regulate Cardiac Remodeling After Acute Myocardial Infarction in Mice. J Am Coll Cardiol. 2022;79(7):632–647. doi:10.1016/j.jacc.2021.11.051
20. Bermea K, Bhalodia A, Huff A, et al. The Role of B Cells in Cardiomyopathy and Heart Failure. Curr Cardiol Rep. 2022;24(8):935–946. doi:10.1007/s11886-022-01722-4
21. van den Hoogen P, de Jager SCA, Huibers MMH, et al. Increased circulating IgG levels, myocardial immune cells and IgG deposits support a role for an immune response in pre- and end-stage heart failure. J Cell Mol Med. 2019;23(11):7505–7516. doi:10.1111/jcmm.14619
22. Xu Y, Jiang K, Chen F, et al. Bone marrow-derived naïve B lymphocytes improve heart function after myocardial infarction: a novel cardioprotective mechanism for empagliflozin. Basic Res Cardiol. 2022;117(1):47. doi:10.1007/s00395-022-00956-1
23. Jia L, Zhang Y, Pu F, et al. Pseudogene AK4P1 promotes pancreatic ductal adenocarcinoma progression through relieving miR-375-mediated YAP1 degradation. Aging. 2022;14(4):1983–2003. doi:10.18632/aging.203921
24. Zhou SW, Su BB, Feng YQ, et al. Expression of GTF2IP23 in breast cancer and it mediated regulation of GTF2I. Zhonghua Zhong Liu Za Zhi. 2019;41(12):918–922. doi:10.3760/cma.j.issn.0253-3766.2019.12.007
25. Kerwin J, Khan I, Iorns E. Replication Study: a coding-independent function of gene and pseudogene mRNAs regulates tumour biology. Elife. 2020;9. doi:10.7554/eLife.51019
26. Nathany S, Tripathi R, Mehta A. Gene of the month: GTF2I. J Clin Pathol. 2021;74(1):1–4. doi:10.1136/jclinpath-2020-207013
27. Friesen M, Warren CR, Yu H, et al. Mitoregulin Controls β-Oxidation in Human and Mouse Adipocytes. Stem Cell Reports. 2020;14(4):590–602. doi:10.1016/j.stemcr.2020.03.002
28. Averina OA, Permyakov OA, Emelianova MA, et al. Mitochondrial peptide Mtln contributes to oxidative metabolism in mice. Biochimie. 2023;204(136):136–139. doi:10.1016/j.biochi.2022.09.009
29. Choi M, Kang KW. Mitoregulin controls mitochondrial function and stress-adaptation response during early phase of endoplasmic reticulum stress in breast cancer cells. Biochim Biophys Acta Mol Basis Dis. 2023;1869(1):166570. doi:10.1016/j.bbadis.2022.166570
30. Pereira GAR, Beck-da-Silva L. Iron Deficiency in Heart Failure with Reduced Ejection Fraction: pathophysiology, Diagnosis and Treatment. Arq Bras Cardiol. 2022;118(3):646–654. doi:10.36660/abc.20201257
31. Zhihao L, Jingyu N, Lan L, et al. SERCA2a: a key protein in the Ca(2+) cycle of the heart failure. Heart Fail Rev. 2020;25(3):523–535. doi:10.1007/s10741-019-09873-3
32. Tanai E, Frantz S. Pathophysiology of Heart Failure. Compr Physiol. 2015;6(1):187–214.
33. Pyo RT, Sui J, Dhume A, et al. CXCR4 modulates contractility in adult cardiac myocytes. J Mol Cell Cardiol. 2006;41(5):834–844. doi:10.1016/j.yjmcc.2006.08.008
34. Wei L. Immunological aspect of cardiac remodeling: t lymphocyte subsets in inflammation-mediated cardiac fibrosis. Exp Mol Pathol. 2011;90(1):74–78.
35. Duerr GD, Heine A, Hamiko M, et al. Parameters predicting COVID-19-induced myocardial injury and mortality. Life Sci. 2020;260:118400. doi:10.1016/j.lfs.2020.118400
 © 2023 The Author(s). This work is published and licensed by Dove Medical Press Limited. The
full terms of this license are available at https://www.dovepress.com/terms
and incorporate the Creative Commons Attribution
- Non Commercial (unported, 3.0) License.
By accessing the work you hereby accept the Terms. Non-commercial uses of the work are permitted
without any further permission from Dove Medical Press Limited, provided the work is properly
attributed. For permission for commercial use of this work, please see paragraphs 4.2 and 5 of our Terms.
© 2023 The Author(s). This work is published and licensed by Dove Medical Press Limited. The
full terms of this license are available at https://www.dovepress.com/terms
and incorporate the Creative Commons Attribution
- Non Commercial (unported, 3.0) License.
By accessing the work you hereby accept the Terms. Non-commercial uses of the work are permitted
without any further permission from Dove Medical Press Limited, provided the work is properly
attributed. For permission for commercial use of this work, please see paragraphs 4.2 and 5 of our Terms.
Recommended articles
Analysis of Staged Features of Gastritis-Cancer Transformation and Identification of Potential Biomarkers in Gastric Cancer
Jia R, Guo X, Liu H, Zhao F, Fan Z, Wang M, Sui J, Yin B, Wang Z, Wang Z
Journal of Inflammation Research 2022, 15:6857-6868
Published Date: 28 December 2022
Identification of Key Immune-Related Genes in the Treatment of Heart Failure After Myocardial Infarction with Empagliflozin Based on RNA-Seq
Zhang P, Wang TY, Luo ZY, Ding JC, Yang Q, Hu PF
Journal of Inflammation Research 2023, 16:4679-4696
Published Date: 18 October 2023
Identifying and Validating GSTM5 as an Immunogenic Gene in Diabetic Foot Ulcer Using Bioinformatics and Machine Learning
Shi H, Yuan X, Liu G, Fan W
Journal of Inflammation Research 2023, 16:6241-6256
Published Date: 20 December 2023
Comprehensive Analysis of Programmed Cell Death-Related Genes in Diagnosis and Synovitis During Osteoarthritis Development: Based on Bulk and Single-Cell RNA Sequencing Data
Zhou J, Jiao S, Huang J, Dai T, Xu Y, Xia D, Feng Z, Chen J, Li Z, Hu L, Meng Q
Journal of Inflammation Research 2025, 18:751-778
Published Date: 17 January 2025
Integrated Analysis of Ferroptosis and Immune Infiltration in Ulcerative Colitis Based on Bioinformatics
Cai D, Hu W, Cai Y, Fang T, Chen X
Journal of Inflammation Research 2025, 18:3535-3549
Published Date: 10 March 2025