Back to Journals » Journal of Inflammation Research » Volume 18
Identification and Experimental Validation of Oxidative Stress-Related Biomarkers in Ulcerative Colitis Using Machine Learning
Authors Duan S, Yi Q ![]() , Qiu M, Zhu Z
, Qiu M, Zhu Z ![]() , Zhang Z, Gao Y
, Zhang Z, Gao Y ![]() , Zhang D
, Zhang D ![]()
Received 5 February 2025
Accepted for publication 30 July 2025
Published 20 August 2025 Volume 2025:18 Pages 11415—11435
DOI https://doi.org/10.2147/JIR.S520874
Checked for plagiarism Yes
Review by Single anonymous peer review
Peer reviewer comments 2
Editor who approved publication: Professor Ning Quan
Siwei Duan,1,2 Qincheng Yi,3 Min Qiu,2 Zeming Zhu,2 Ziyi Zhang,2 Yong Gao,2 Dong Zhang1,4
1Gastroenterology Ward Department, the Fourth Clinical Medical College of Guangzhou University of Chinese Medicine, Shenzhen, Guangdong, People’s Republic of China; 2Gastroenterology and Metabolism Research Laboratory Department, Science and Technology Innovation Center, Guangzhou University of Chinese Medicine, Guangzhou, Guangdong, People’s Republic of China; 3Emergency Ward Department, The Second Clinical Medical College of Guangzhou University of Chinese Medicine, Guangzhou, Guangdong, People’s Republic of China; 4Gastroenterology Ward Department, Shenzhen Traditional Chinese Medicine Hospital, Shenzhen, Guangdong, People’s Republic of China
Correspondence: Yong Gao, Gastroenterology and Metabolism Research Laboratory Department, Science and Technology Innovation Center, Guangzhou University of Chinese Medicine, Guangzhou, 510000, People’s Republic of China, Email [email protected] Dong Zhang, Gastroenterology Ward Department, The Fourth Clinical Medical College of Guangzhou University of Chinese Medicine, Shenzhen, 518000, People’s Republic of China, Email [email protected]
Purpose: Ulcerative colitis (UC) remains challenging to diagnose and treat due to a lack of reliable biomarkers. This study investigates oxidative stress-related targets in UC using bioinformatics and experimental validation.
Methods: We analyzed four GEO datasets and oxidative-stress genes from MSigDB, applying differential analysis, LASSO regression (for feature selection), and random forest (for robust biomarker identification). An artificial neural network (ANN) diagnostic model was constructed, followed by chromosomal distribution analysis, immune infiltration assessment, and drug screening. Hub gene expression was validated in a 3% DSS-induced colitis mouse model via qPCR and Western blot.
Results: Ultimately there were 6 hub genes identified: DUOX2, ETFDH, GPX8, ITGA5, NPY, and PDK2, which were validated with 3 other datasets. In the DSS-colitis model, DUOX2 and ITGA5 were significantly upregulated (p < 0.05), whereas ETFDH, PDK2, and NPY were downregulated. GPX8 protein expression was elevated in colonic mucosa compared to controls. These findings were further validated in three independent datasets (GSE48958, GSE16879, GSE36807).
Conclusion: Our study identifies six oxidative stress-related biomarkers in UC using machine learning and experimental validation. These findings provide potential diagnostic and therapeutic targets for UC management, paving the way for further clinical investigations.
Keywords: inflammatory bowel diseases, bioinformatics, random forest, LASSO regression, artificial neural network, immune infiltration
Introduction
UC is an inflammatory bowel disease involving the colorectum that is prone to recurrent and intractable episodes. It is characterized by mucopurulent, bloody stools, and its central pathological feature is the disruption of the colonic mucosal barrier due to inflammation.1 In recent years, the prevalence of UC has grown significantly worldwide. An estimated 5 million cases of ulcerative colitis occurred worldwide in 2023.2 The number of UC patients in Asia is expected to exceed 2 million by 2035.3 The large and rapidly growing number of people suffering from the disease not only undermines people’s health but also seriously affects the development of social productivity.4 At the same time, there is a corresponding increased risk of colorectal cancer, posing serious challenges to patient health and the healthcare system.5,6
Ulcerative colitis (UC) pathogenesis involves complex interactions of genetic, immunological, microbial and environmental factors, though remains incompletely understood.7 Diagnosis currently requires comprehensive clinical, endoscopic and histological evaluation, yet existing methods suffer from limited specificity, poor mechanistic correlation, inadequate dynamic monitoring and relying heavily on invasive procedures and static biomarkers.(eg faecal MPO test).8 These diagnostic shortcomings highlight the urgent need for novel biomarker development. Therapeutically, management relies on 5-aminosalicylic acid as first-line therapy, with glucocorticoids, biologics and surgical options for refractory cases.9
Oxidative stress is the reaction of oxygen free radicals with tissues due to insufficient antioxidant capacity or bioavailability, leading to effects such as cellular damage and an increased inflammatory response. In ulcerative colitis, oxidative stress is one of the important pathogenic factors and may have numerous causes, including immune system anomalies, environmental influences, and gut bacteria imbalances.10 In the intestinal mucosa of UC patients, activated neutrophils, macrophages, and other inflammatory cells produce large amounts of Reactive Oxygen Species(ROS) via NADPH oxidase and myeloperoxidase (MPO). The ROS activate pathways such as NF-κB and NLRP3 inflammasome, which promotes release of proinflammatory factors, such as TNF-α, IL-1β, and IL-6, and exacerbates the inflammatory response.11 Along with the spread of inflammation, ROS lead to gut barrier damage, mitochondrial dysfunction, lipid peroxidation and tissue damage in a vicious cycle.12
The rapid development of machine learning has greatly contributed to the advancement of biomedicine, and the diagnosis and prediction of IBD has evolved accordingly.13 Due to its strong categorization ability, many researchers are using machine learning to learn representations of high-dimensional features from high-throughput data.14 Machine learning enables hypothesis-free discovery of UC therapeutic targets through high-dimensional feature selection, nonlinear pattern recognition, and multi-omics integration, outperforming traditional hypothesis-driven approaches in both efficiency and systems-level mechanistic insights.15
To explore the application of machine learning in the early diagnosis and treatment of UC, especially the potential advantages in gene expression data analysis, we integrated four GEO datasets and built a model for differential analysis, specific gene selection, and deep learning model construction. The GEO database and MSigDB database were used as the main sources of data acquisition and screening. We used bioinformatics methods such as LASSO regression analysis, random forest (RF), artificial neural network (ANN), immune infiltration analysis, transcription factor prediction, miRNA prediction, and drug prediction to screen and predict gene targets. We also validated the results using three independent GEO datasets. After identifying the core genes (hub genes), we localized them on the chromosomes, then conducted GO and KEGG analyses. We further explored the degree of immune infiltration of the core genes and predicted the core genes’ transcription factors, miRNAs, and drugs. Finally, we conducted animal experiments to validate the core genes. We mainly explored the gene expression using qPCR and Western blot.
Materials and Methods
Data Acquisition and Differential Gene (DEG) Analysis
Gene chip data containing UC cases were retrieved from the GEO database (https://www.ncbi.nlm.nih.gov/geo/). Four datasets, GSE38713, GSE59071, GSE87465, and GSE87466, were used as training sets to obtain gene expression profile data and associated annotation files. Additionally, GSE48958, GSE16879, and GSE36807 were used as validation sets, including 52 UC cases and 27 control cases, resulting in a total of 79 samples (Table 1). The combined training set (n=278, UC:Control=233:45) and validation set (n=79, UC:Control=52:27) provide >80% power to detect effect sizes ≥0.8 (Cohen’s d) at α=0.05, as calculated by RNA-seqPower (DOI:10.1093/bioinformatics/btz435). This exceeds the recommended 10:1 sample-to-feature ratio for LASSO regression (screening 258 oxidative stress genes).
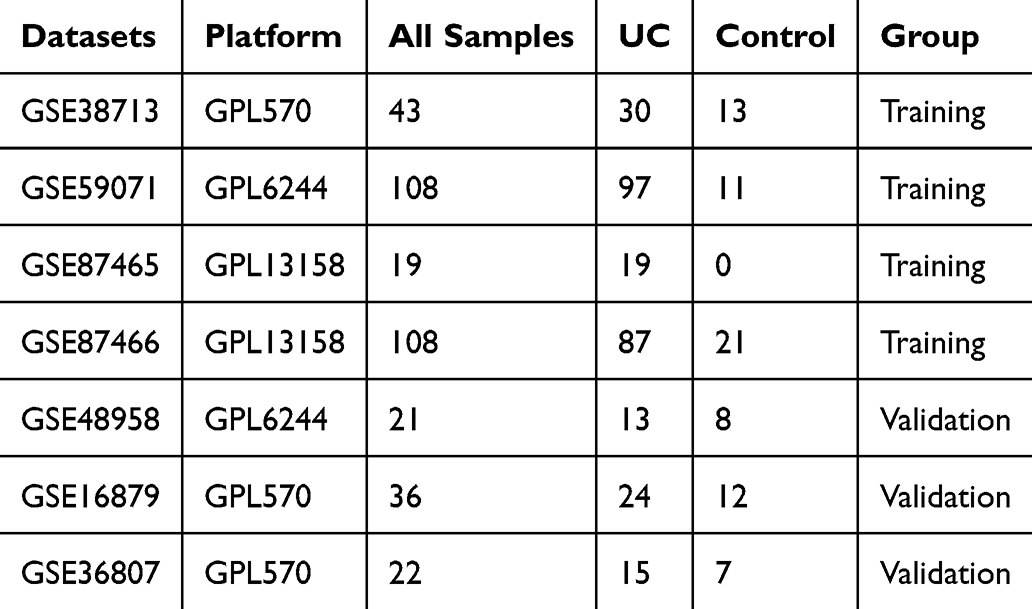 |
Table 1 GEO Datasets Used in This Study |
Principal component analysis (PCA) for differential analysis was performed using the “limma” package. Inter-batch differences were corrected using the “SVA” package, and the PCA plot for the four datasets was generated with the “ggplot” package. The “ggplot” package was also used to plot a volcano map of the common DEGs in the four GSE datasets, while the “pheatmap” package was used to create a heatmap. The volcano plot illustrated differential gene expression between UC and control groups. The criteria for identifying differential expression were |log2 fold change (FC)|>1 and P< 0.05, with the three dashed lines serving as cut-off thresholds.
Common DEGs from the four datasets were subjected to functional enrichment analysis using the “clusterProfiler” (v4.0) and “goplot” (v1.0.2) packages. For Gene Ontology (GO) and Kyoto Encyclopedia of Genes and Genomes (KEGG) analyses, we applied Benjamini-Hochberg false discovery rate (FDR) correction, retaining only terms with FDR < 0.05. The top 10 most significant terms (ranked by adjusted p-value) were visualized through GO gradient bubble plots and KEGG enrichment cluster plots. Gene set enrichment analysis (GSEA) was performed on the Hallmark gene set (MSigDB v7.5) using 1000 permutations, with significance determined by normalized enrichment score (|NES| > 1.5) and FDR q-value < 0.25, following MSigDB recommended thresholds. All enrichment results were filtered by both statistical significance and effect size to ensure biological relevance.
Oxidative Stress-Related Gene Screening and Machine Learning
Using “oxidative stress” as the keyword, genes related to oxidative stress (DEOSGs) were extracted from the MSigDB database (https://www.gsea-msigdb.org/gsea/msigdb/index.jsp). These genes were then overlapped with the DEGs obtained earlier to identify differentially expressed genes associated with oxidative stress (DEOSGs). A Venn diagram was generated using FunRich software (version 3.1.3) to visualize the intersection.
The DEOSGs gene set was subjected to LASSO regression analysis using the “glmnet” package, selected for its ability to perform feature selection in high-dimensional data while preventing overfitting through L1 regularization. Through ten-fold cross-validation, we identified the optimal λ value (0.007519232) that maintained model stability while preserving biological relevance, resulting in 12 key genes. This approach is particularly suited for oxidative stress studies where many correlated biomarkers may exist but only a subset are truly causative.
LASSO excels in dimensionality reduction and handling multicollinearity, enabling the extraction of concise biomarker panels (eg, 6 UC-related genes).16 Random Forest (RF) captures complex nonlinear interactions (eg, gene-environment interplay).17 Their combined use creates a tiered screening pipeline, overcoming limitations of PCA (ambiguity) and SVM (black-box nature), while balancing clinical utility and biological interpretability.18,19 This approach has been validated in independent cohorts.20 Therefore, this study selected LASSO and Random Forest (RF) as the machine learning screening methods.
Random forest analysis conducted with the ‘randomForest’ package generated a residual plot where black lines represented combined residuals. To determine the lowest error rate and the optimal number of stable trees as the best parameters, the error rate of 500 trees was calculated. The optimal tree number was determined to be 154 (minimum residual point). Gene importance was ranked by mean decrease in Gini index (threshold >2), yielding 13 significant genes.
The intersection of genes selected by both methods (visualized through Venn diagram) produced 6 robust biomarkers that were subsequently used for final model construction. This dual-filter approach ensured selection of genes with both strong diagnostic performance (random forest) and stable predictive value (LASSO).
Construction and Verification of Artificial Neural Network Model of DEGs
We constructed an ANN model to leverage its unique advantages in modeling complex non-linear relationships, hierarchical patterns, and gene-gene interactions in oxidative stress biomarkers, outperforming conventional classifiers.21 This model was constructed with 6 input neurons (representing the 6 hub genes) and 2 output neurons (classifying UC vs normal groups), by systematically adjusting the number of neurons in the hidden layer to optimize model performance. The entire process was implemented using the “neuralnet” and “neuralnettools” packages. Based on the six genes screened earlier, when the number of neurons in the hidden layer was set to 5, the prediction accuracy of the model reached 0.906, and the area under the AUC curve (AUC) was 0.938. Using the ANN constructed from the training set connections, three independent datasets—GSE48958, GSE16879, and GSE36807—were employed for validation (Table 1). The ROC curves for these datasets were plotted using the “proc” package.
Expression and Functional Analysis of Characteristic Genes in the Validation Dataset
The six characteristic genes were input into the initially screened DEGs to identify expression differences between the control group and the model group. A scatter boxplot was generated to visualize these differences. The “corrplot” package was used to analyze gene expression correlations, and a correlation heatmap was created. A value exceeding 0.5 was considered to indicate a strong coexpression relationship. The “rcircos” package was then used to generate a chromosome circle map, displaying the location and correlation of each gene. Following that, KEGG pathway enrichment analysis and Gene Ontology (GO) annotation were performed on the distinctive genes. Significant enrichment results were indicated by P-values less than 0.05, and the GO and KEGG results were visualized using circle plots.
Immune Infiltration of Hub Genes
Since the immune system plays a crucial role in the development and progression of ulcerative colitis, we evaluated the correlation between immune cells, immune-related pathways, and the characteristic genes. The “gsva” and “gseabase” packages in R were used for correlation analysis between the abundance of immune cells and characteristic genes, as well as the correlation between characteristic genes and immune processes. Additionally, the “hmisc” package was utilized to test the expression correlation of the six genes with HLA family molecules and chemokines.
Transcription Factor and Drug Prediction
Transcription factors (TFs) regulate gene transcription by binding to specific DNA sequence regions, thereby promoting or suppressing target gene expression. Through complementary pairing with mRNA, miRNAs can promote mRNA breakdown or decrease mRNA translation. Therefore, we conducted predictions regarding both aspects.
The Chea3 database (https://maayanlab.cloud/chea3/) integrates six databases: ENCODE, ReMap, GTEx, Enrichr, ARCHS4, and various ChIP databases. We calculated the average score of the characteristic genes to predict transcription factors (TFs), selected the top 10 TFs, and represented them in a histogram. The protein interaction relationships between the six genes and the top 10 potential TFs were analyzed using Cytoscape software (version 3.9.1).
For miRNA prediction, we utilized miRTarBase (https://mirtarbase.cuhk.edu.cn/~Mirtarbase/mirtarbase_2022/php/index.php) to create an interaction network diagram. Based on these predictions, we employed the DGIdb website (https://dgidb.genome.wustl.edu/) for drug prediction, visualizing the predicted drugs and their corresponding characteristic genes in a chord diagram.
Animals
We obtained 6-8-week-old male C57BL/6J mice from Zhuhai Best Biotechnology Co. Ltd. (certificate: SCXK (Guangdong) 002020–0051; China). The mice were housed in six cages (3–4 mice per cage) setted in a specific pathogen-free (SPF) environment, with sufficient food and water provided. The environment was a 12-hour light/dark cycle at a temperature of 22 ± 2°C.
Construction of 3% DSS Mouse Model
Dextran sodium sulfate (DSS) (cat. 160110) was purchased from MP Biomedicals (USA), and the mesalazine enteric-coated tablets (Salofalk) used were produced by Losan Pharma GmbH. Isoflurane was purchased from Shenzhen RWD Life Science Co., Ltd.
Following three days of acclimatization, 23 mice were randomly assigned using a random number table into three groups: 7 in the normal control group, 9 in the 3% DSS group, and 7 in the 3% DSS + mesalazine group. To maintain blinding, the researcher responsible for DSS administration and drug treatment was different from the investigator performing disease activity index (DAI) scoring, with the latter remaining unaware of group assignments throughout the study. The mice in the normal group drank purified water, those in the 3% DSS group drank 3% DSS, and the 3% DSS + mesalazine group was gavaged daily with 0.2 mL of mesalazine (100 mg/kg) while receiving 3% DSS. Mice were monitored daily for weight, fecal traits, and occult blood scores. The average score of these three parameters was calculated as the DAI score (Table 2).22 On the sixth day of DSS administration, the DSS solution was replaced with water for both treatment groups, and the mice were sacrificed on day 7 following anesthesia with isoflurane.
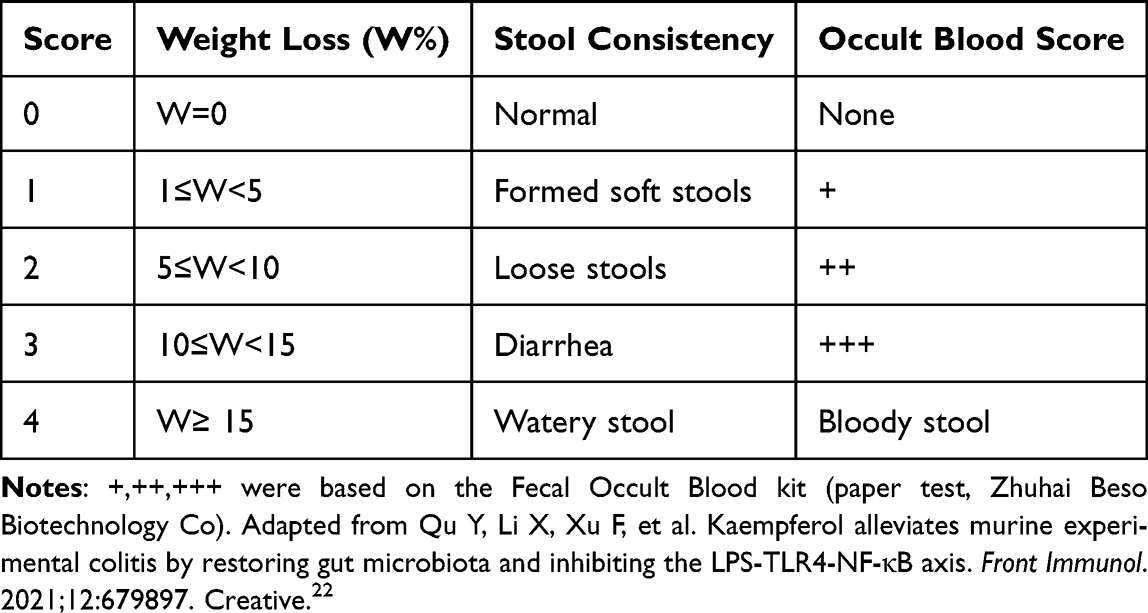 |
Table 2 DAI Scores |
HE Staining
A 0.3–0.5 cm segment of colon tissue was excised from 1 cm above the anus, soaked in 4% paraformaldehyde solution, and fixed for over 24 hours. The fixed sample was embedded in paraffin, and the entire wax block was sectioned into thin slices and mounted on glass slides. After dewaxing, the sections were stained with hematoxylin and eosin (HE). Images were captured using a Nikon microscope (Nikon Eclipse 80i) and evaluated based on the colon pathology score (Table 3).23
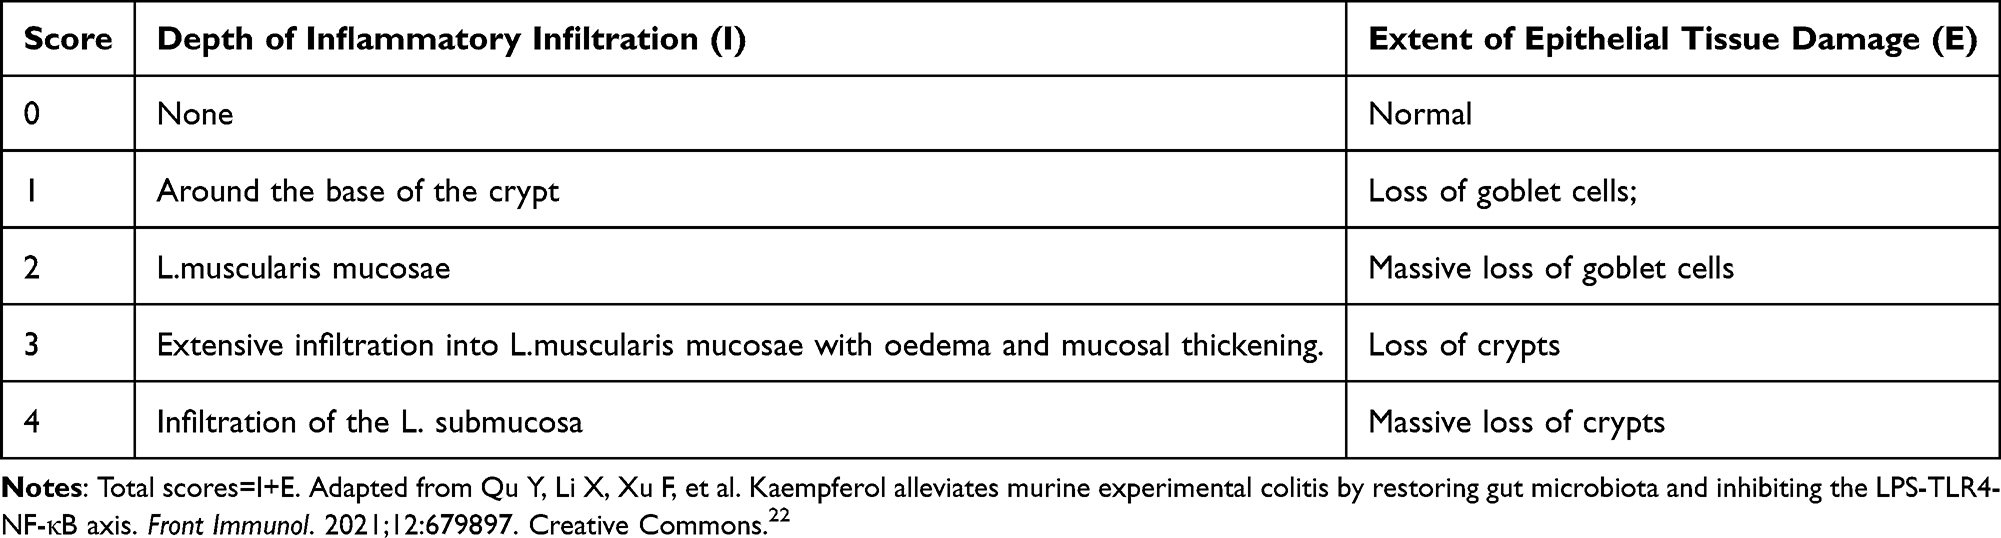 |
Table 3 Histopathological Scoring of Ulcerative colitis23 |
qPCR of Core Genes in Ulcerative Colitis Mice
RNA was extracted from mouse colon tissue using the Trizol method, followed by reverse transcription to obtain cDNA with the Reverse Transcription Kit (Abclonal, Wuhan, China). QPCR primers (Table 4) were designed via Primer-BLAST. The core parameters for Primer-BLAST should balance amplification efficiency and specificity: Product size 80–200 bp (for qPCR efficiency 90–110%), primer Tm 58–62°C (ΔTm≤2°C), GC content 40–60%, with mandatory exon-exon junction spanning to avoid gDNA contamination. Specificity checks require RefSeq mRNA database alignment, allowing ≤3 mismatches (≤2 consecutive) while excluding dimers (ΔG> −5 kcal/mol) and hairpins (stem-loop≤3 bp). Clinical studies must additionally account for common SNPs. The qPCR process was carried out using β-actin as the internal reference gene, cDNA as the template, SYBR Green qPCR mix (Abclonal, Wuhan, China), primers, and water. Reactions used SYBR Green Master Mix under standard cycling conditions (95°C/10min → [95°C/15s → 60°C/1min]×40).
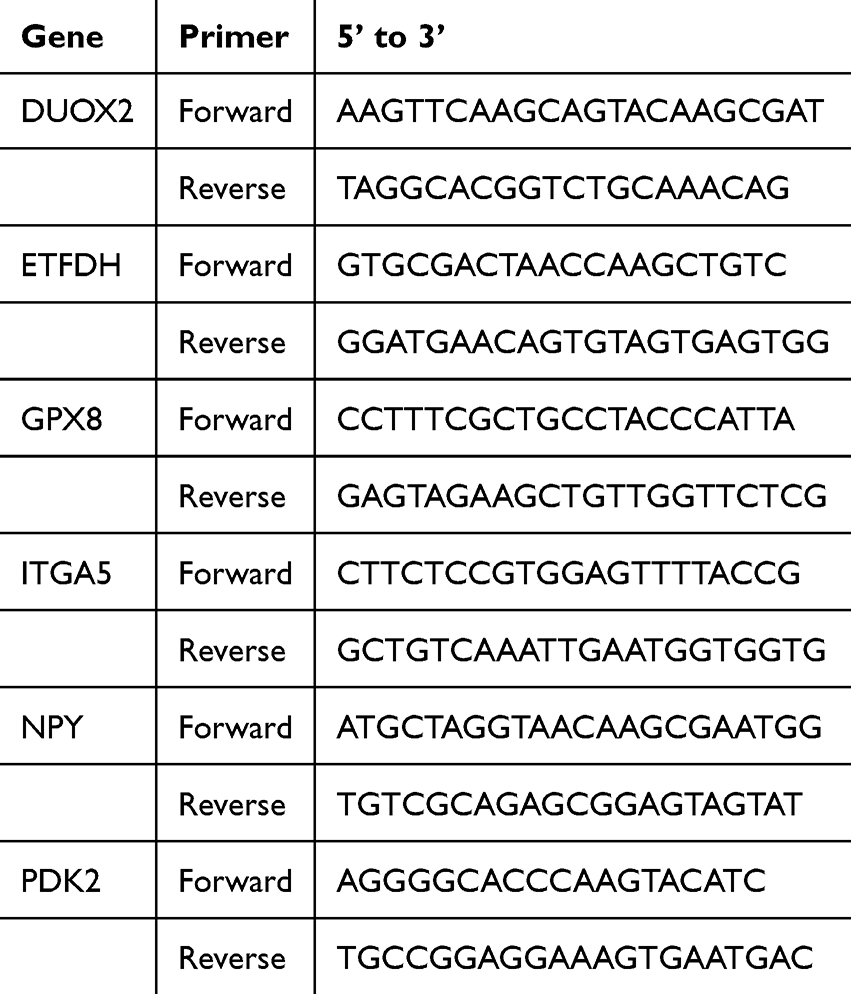 |
Table 4 Primer Sequences for qPCR |
Western Blot Results
An equal amount of colonic mucosa tissue was extracted, and RIPA lysis buffer containing 1% PMSF and 1% protease inhibitors was added. Small enzyme-free steel balls were added to homogenize the slurry, followed by centrifugation at 12,000 rpm for 10 minutes. The supernatant was collected, and the protein concentration was measured using the BCA Kit (Biosharp, Beijing, China). SDS-PAGE loading buffer 5×(with DTT) (Beijing Solarbio Science & Technology Co. Ltd., China) was added, mixed, and the samples were boiled for 10–15 minutes. The denatured protein samples were electrophoresed, transferred to membranes, and blocked with 5% skim milk for 1 hour. Primary antibodies GAPDH (1:5000, 60,004-1-Ig, Proteintech, Wuhan, China), DUOX2 (1:1000, M029894, Abmart, Shanghai, China), ETFDH (1:1000, 11,109-1-AP, Proteintech, Wuhan, China), GPX8 (1:1000, 16,846-1-AP, Proteintech, Wuhan, China), ITGA5 (1:1000, Abclonal), NPY (1:1000, 12,833-1-AP, Proteintech, Wuhan, China), and PDK2 (1:1000, 15,647-1-AP, Proteintech, Wuhan, China) were added and incubated overnight at 4°C. After washing the membranes with TBST, goat secondary antibodies were incubated at room temperature for 1 hour. Following another wash, the membranes were developed with ECST.
Statistical Analysis
R (version 4.2.1) was used for all machine learning studies and visualizations. GraphPad Prism software (version 9.5.0, San Diego, CA, USA) was used to examine the experimental data, and one-way analysis of variance (ANOVA) was employed for comparison. The statistical significance threshold was set at p < 0.05, and the data are displayed as mean ± SEM.
Results
Differential Expressed Genes (DEGs) Obtained From Differential Analysis
The flow chart of data screening process is shown in Figure 1. Four sets of ulcerative colitis-related datasets were retrieved from the GEO database (https://www.ncbi.nlm.nih.gov/geo/), including GSE38713, GSE59071, GSE87465, and GSE87466, amounting to a total of 278 samples and 233 UC cases (Table 1). A principal component analysis (PCA) was performed on the gene expression profile data of the four groups (Figure 2a). It was found that the datasets in each group were widely distributed, and the batch effect was obvious, which was not suitable for subsequent analysis. After the data were de-batched, the PCA plot was created again (Figure 2b). This time, the coincidence degree between samples in the dataset was high, indicating suitability for subsequent differential gene analysis.
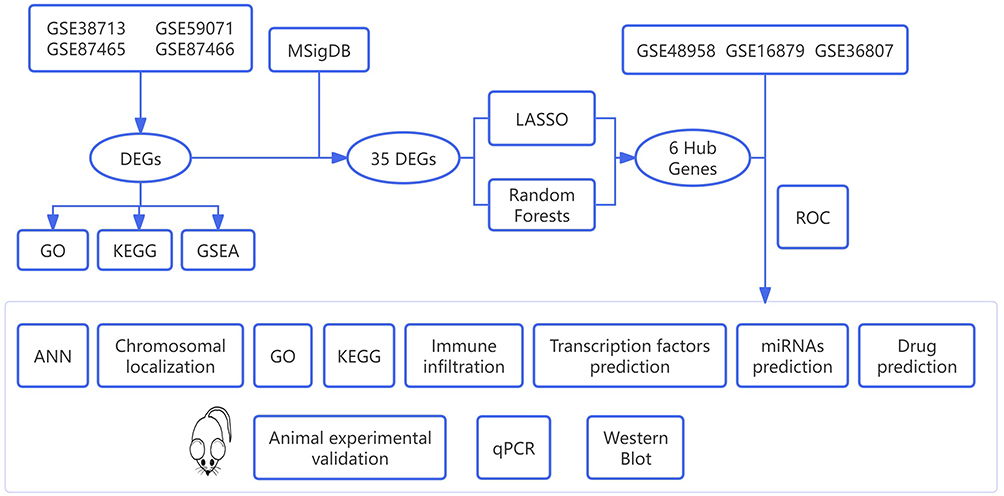 |
Figure 1 Flow chart of this study. |
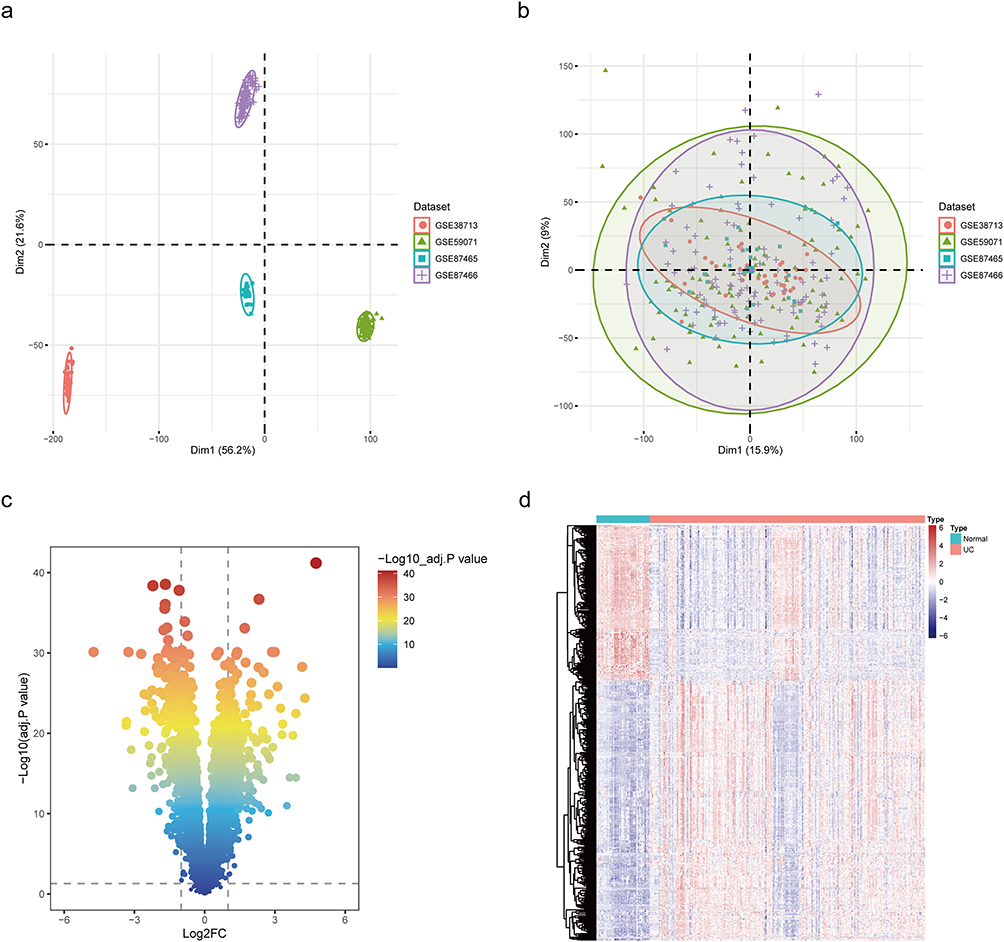 |
Figure 2 Data acquisition and pre-processing. (a) PCA analysis prior to de-batching. (b) PCA analysis after de-batching. (c) Volcano map of DEGs.(d) Heatmap of DEGs. |
The differential genes in the four datasets were screened based on |log2 fold change (FC) | > 1 and P <0.05 and displayed in a volcano plot (Figure 2c). A total of 562 differential expressed genes (DEGs) met the requirements, 353 genes were upregulated in UC, and 209 genes were downregulated. DEGs were displayed with a heatmap (Figure 2d).
Enrichment Analysis of DEGs
We performed GO analysis on the DEGs (Figure 3a) and annotated the top 10 results. We found that the top 10 biological processes (BPs) were basically enriched in the same process, focusing on anti-inflammatory related fields such as leukocyte migration and chemotaxis, neutrophil migration and chemotaxis, and response to bacterial derived molecules. In terms of cellular components (CCs), collagen-containing extracellular matrix played a very important role in the process of UC. For molecular function (MF), extracellular matrix structural components and chemokine activity ranked high. UC was also closely related to serine protease activity.
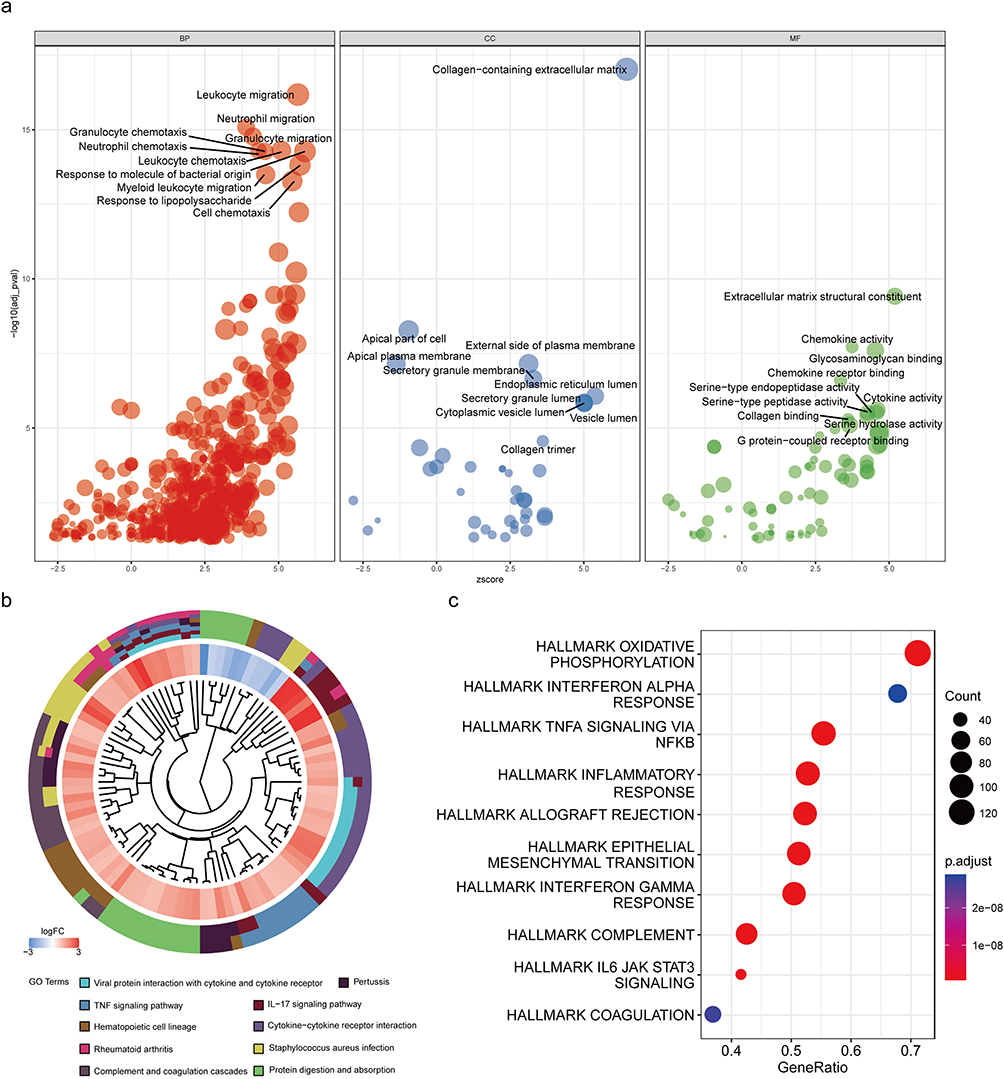 |
Figure 3 Enrichment analysis of DEGs. (a) GO results are shown as a gradient bubble chart. A positive z-score means that differential gene enrichment to that biological process is a positively correlated enrichment. Larger bubbles represent larger and more significant corrected p-values. (b) Results of KEGG are depicted on circle charts. (c) GSEA is presented in the form of a bubble chart. |
DEGs were subjected to KEGG analysis (Figure 3b), and the top ten signaling pathways were displayed according to the corrected p-value. Different colors in the lower circle represent different signaling pathways, and each grid in the inner circle represents a gene, where red is the upregulated gene and blue is the downregulated gene. It can be seen from the inner circle that the DEGs were mainly upregulated, and DEGs were significantly enriched in the signal pathways, such as viral protein interaction with cytokines and cytokine receptors, the IL-17 signaling pathway, and the TNF signaling pathway.
The dataset (hallmark gene set) used for GSEA analysis (Figure 3c) was derived from the msigdb database (https://www.gsea-msigdb.org/gsea/msigdb/index.jsp), which includes 50 of the most classical biological processes and signaling pathways. The top ten pathways are displayed according to the size of “GeneRatio”. From the figure, we can see that the oxidative phosphorylation pathway was the most enriched, and DEGs downregulated the expression of this pathway. The pathways of inflammatory response were upregulated.
Screening Oxidative Stress-Related Genes and Machine Learning
From the MSigDB database (https://www.gsea-msigdb.org/gsea/msigdb/index.jsp), 802 genes related to oxidative stress were extracted. Taking the intersection of these genes with 562 DEGs, 35 differentially expressed genes related to oxidative stress (DEOSGs) were obtained (Figure 4a). These 35 DEOSGs were analyzed using LASSO regression. When the λ value was minimized, six genes were identified (Figure 4b and c). Seven genes were effectively identified by means of ten-fold cross validation with the random forest (RF) algorithm (Figure 4d and e). Taking the intersection of these two results, we obtained six hub genes (Figure 4f), namely DUOX2, ETFDH, GPX8, ITGA5, NPY, and PDK2.
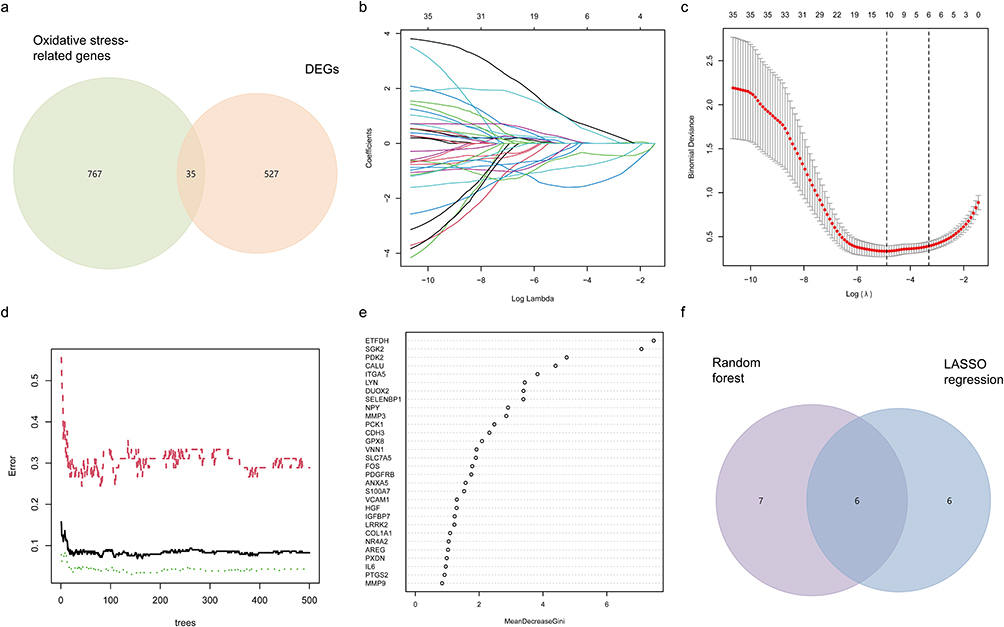 |
Figure 4 Characterized gene screening and machine learning. (a) Wayne diagrams for intersections of genes screened by means of LASSO and RF.(b) LASSO regression model. (c) LASSO regression ten-fold cross validation. (d) Random forest residual plot; red represents the diagnostic efficacy residuals of genes in disease, green represents those of controls, and black is the combined residuals of the first two. (e) Results of the Gini coefficient method in random forest classification. The horizontal coordinate is the importance index, and the vertical coordinate is the genetic variable. (f) Wayne plots of gene intersections predicted by means of RF and LASSO. |
Validation of Hub Genes by Constructing Artificial Neural Network Models
We used the obtained hub genes to build an artificial neural network model (ANN). The input layer neurons consisted of six diagnostic genes, the output layer neurons were divided into two groups (UC and normal group), and the middle layer was hidden. According to the modeling results, the model performed the best when the hidden layer was five neurons (Figure 5a). We selected three independent validation sets, namely GSE48958, GSE16879, and GSE36807. The ROC curve modeled by the training set was used to evaluate the discrimination and sensitivity of the model. The AUC of the area under the curve was 0.938, indicating high performance. The ROC curves of the three validation sets C-E proved the stability of the model (Figure 5b–e).
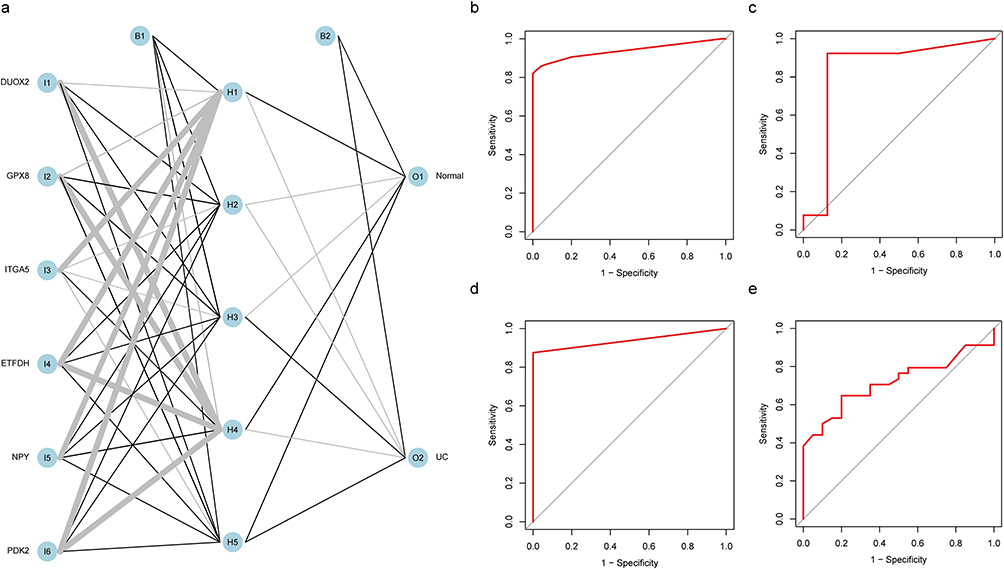 |
Figure 5 Validation of hub genes using artificial neural network models. (a) Artificial neural network modeling of DEGs. (b) ROC curve analysis of the training groups.(AUC: 0.938,95% CI: 0.913−0.960) (c) ROC curve analysis of the GSE48958.(AUC: 0.837,95% CI: 0.587−1.000) (d) ROC curve analysis of the GSE16879(AUC: 0.938,95% CI: 0.875−0.986) (e) ROC curve analysis of the GSE36807 datasets.(AUC: 0.718,95% CI: 0.580−0.841). |
Expression and Function Analysis of Hub Genes
We verified the six hub genes in three independent datasets, GSE48958, GSE16879, and GSE36807, and found that there were significant expression differences between the UC group and control group (Figure 6a). In contrast to the control group, DUOX2, GPX8, and ITGA5 upregulated the expression of UC, while ETFDH, NPY, and PDK2 downregulated expression. According to the correlation heatmap, DUOX2, GPX8, and ITGA5 were positively correlated, while ETFDH, NPY, and PDK2 were negatively correlated (Figure 6b). The six hub genes were mapped on chromosomes as follows: GPX8, IGTA5, DUOX2, and PDK2 are located on chromosomes 5,12,15, and 17, respectively. ETFDH and NPY were found to be highly linked on chromosome 4, indicating that these two genes are more likely to be transmitted or expressed together (Figure 6c).
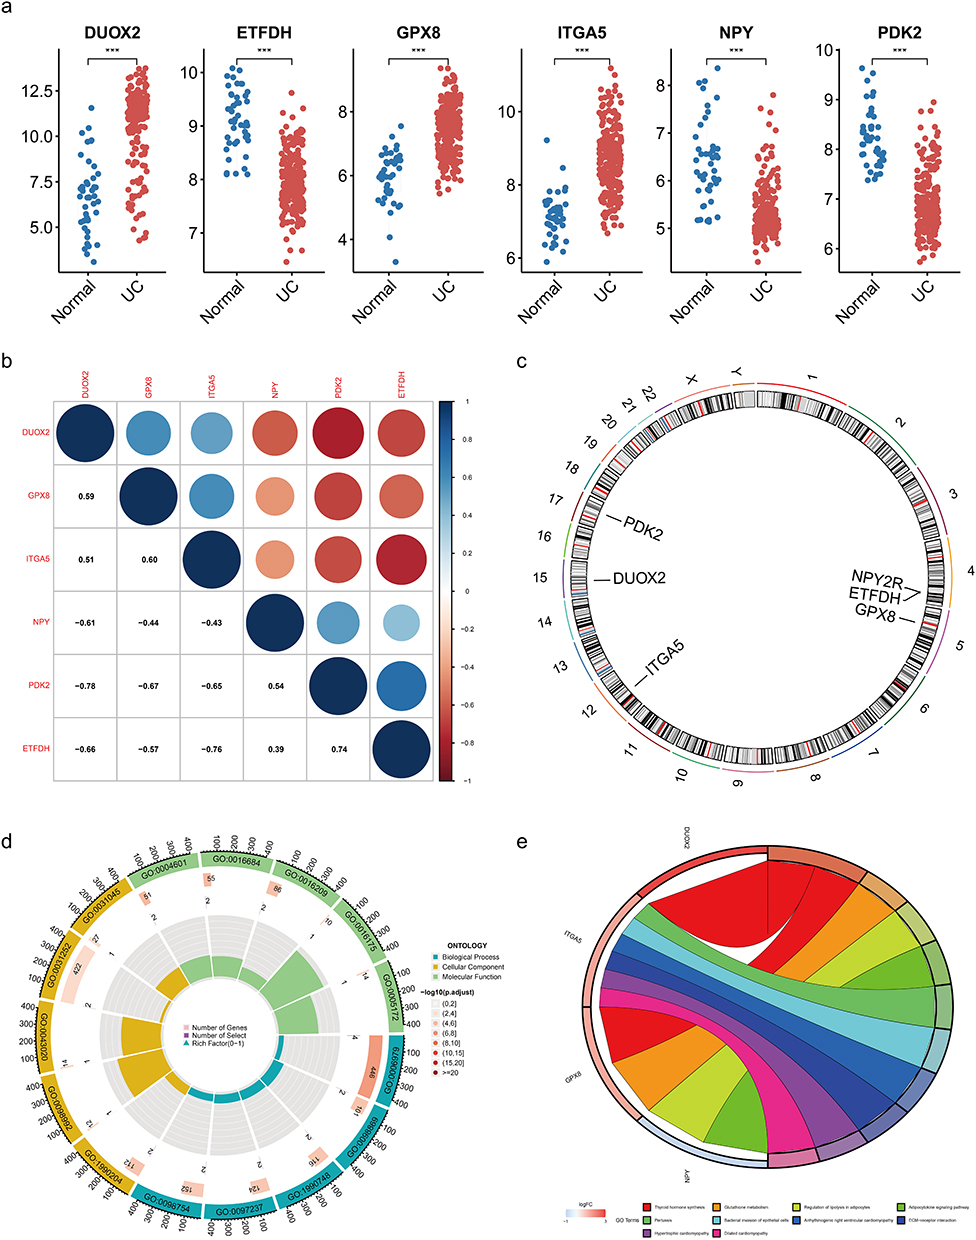 |
Figure 6 Expression and functional analysis of hub genes in the dataset. (a) External datasets validate the expression of hub genes. ***, p < 0.001. (b) Heatmap for correlation analysis of hub genes. (c) Chromosomal localization of hub genes. (d) GO analysis of hub genes (earthy yellow for CC, green for MF, blue for BP). (e) KEGG analysis of hub genes. |
The six genes were analyzed with GO analysis (Figure 6d). When evaluating the biological processes, the results showed that the core genes were significantly enhanced in “response to oxidative stress”. These genes were shown to be enriched in the cellular components of “NADPH oxidase complex” and “oxidase complex” and play an important role in molecular processes such as “superoxide generating NAD (P) H oxidase activity”. In KEGG results, DUOX2 and GPX8 were enriched in thyroid hormone synthesis, which was the first pathway (Figure 6e).
Hub Genes are Significantly Associated with Most Immune Cells and Immune Related Processes
Based on the core gene data, the enrichment scores of 16 immune cells and 13 immune-related processes were computed, and a correlation heatmap was created based on the enrichment score and gene expression level. P < 0.05 represented statistical significance (Figure 7a and b). The image shows that the majority of immune cells and immune-related activities were strongly correlated with the six core genes. When immunological expression patterns of DUOX2, GPX8, and ITGA5 were consistent, ETFDH, NPY, and PDK2 also had similar expression.
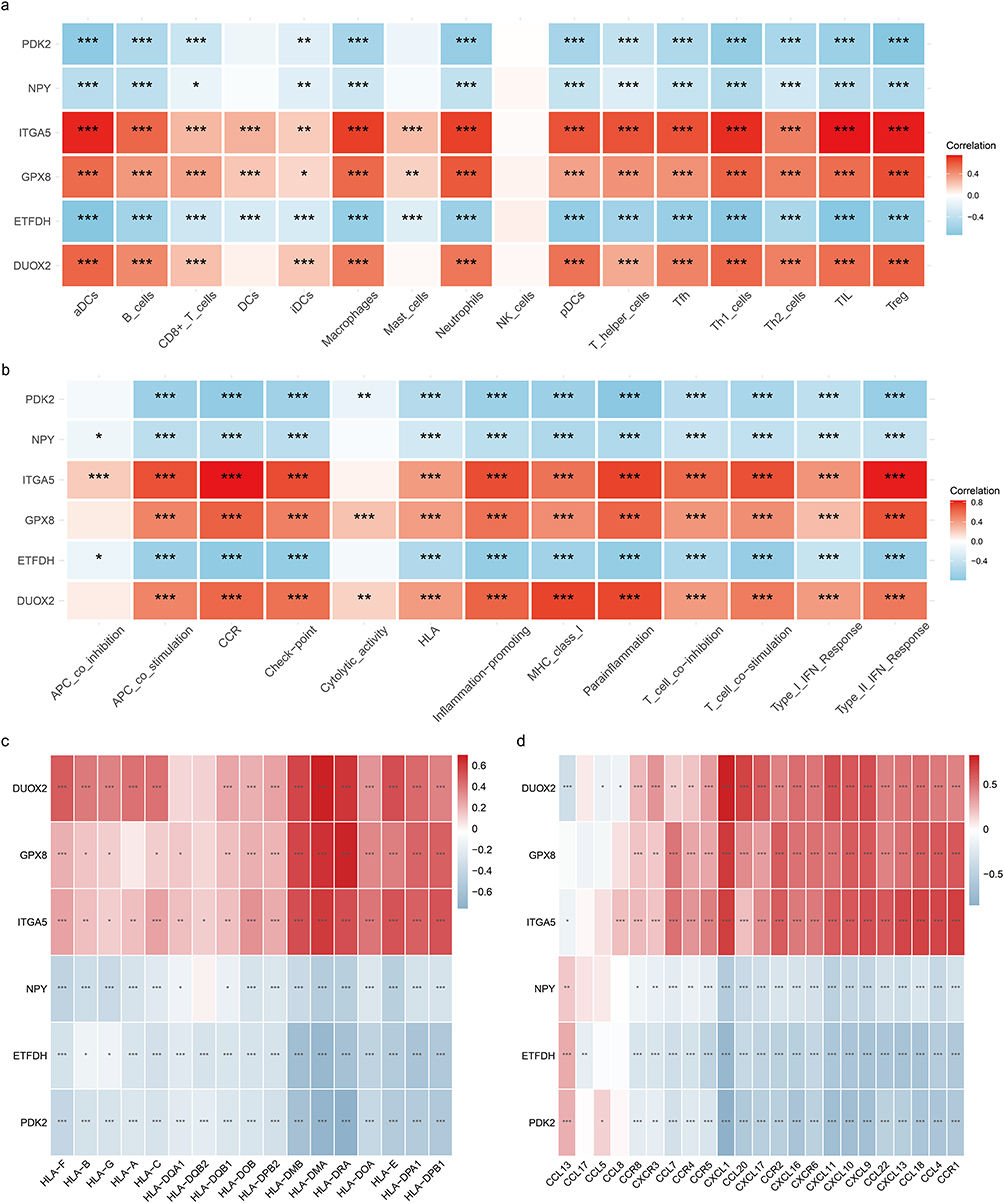 |
Figure 7 Immune infiltration of hub genes. (a) Heatmap of correlation between six hub genes and immune cell types. (b) Heatmap of correlation between six hub genes and immune-related processes. (c) Heatmap of expression correlation of hub genes with HLA family molecules. (d) Heatmap of correlation between expression of hub genes and chemokines. * p<0.05;** p<0.01;*** p<0.001. |
There is much potential for immunotherapy to treat UC in the future. HLA types and chemokines may play a key role in the effectiveness and tolerability of immunotherapy. Analyzing the expression of core genes can provide important information for disease prediction and treatment. From the figure below (Figure 7c and d), we can see that the enrichment trends seen in the six hub genes in the HLA family of molecules and chemokines were roughly the same as those shown in the figure below.
Transcription Factor (TF), miRNA Prediction and Drug Prediction
We predicted the potential transcription factors of core genes based on six databases, including ENCODE, ReMap, GTEx, Enrichr, ARCHS4, and Literature ChIP, and selected the top 10 transcription factors—ZNF469, TWIST2, PRRX1, FOXD1, RFX8, SNAI2, TWIST1, PRRX2, ELK3, and TEAD3 (Figure 8a). The 10 transcription factors and core genes were used to construct a protein interaction network (Figure 8b). In addition, we also predicted the interaction between hub genes and human miRNAs (Figure 8c). We used the DGIdb (https://dgidb.genome.wustl.edu/) website, combined with the core genes, to predict the following 13 drugs associated with ITGA5, NPY, and ETFDH: methylphenidate, cilengitide, cilmostim, dimethyl sulfide, etaracizumab, glpg-0187, pf-04605412, volaciximab, bromocriptine, ether, haloperidoi, k-252a, and rosiglitazone (Figure 8d).
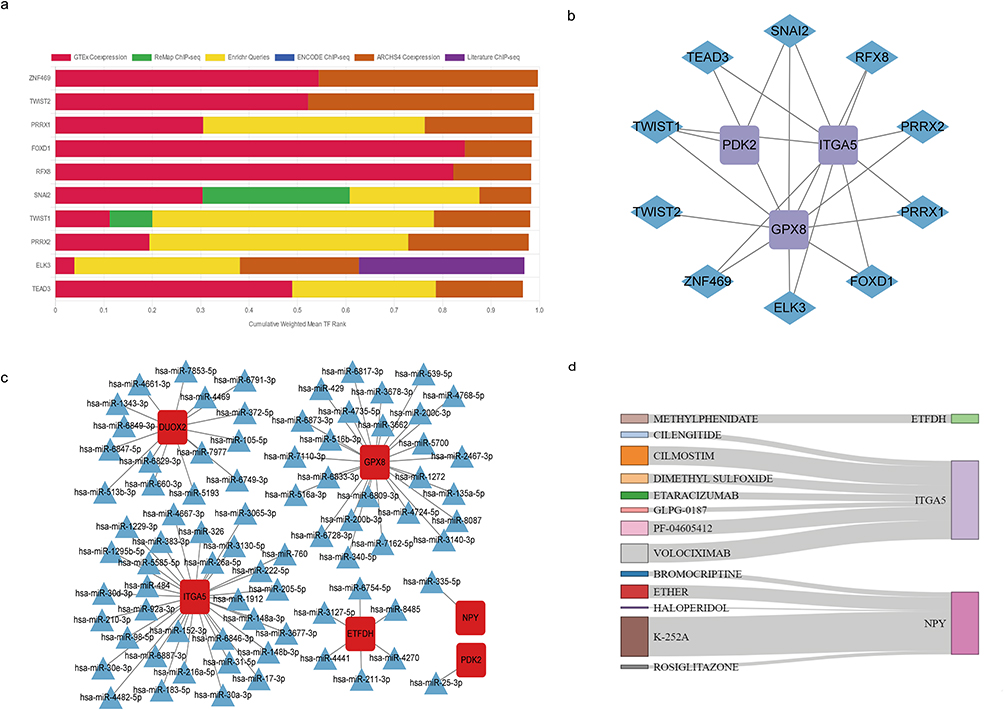 |
Figure 8 Transcription factors, miRNAs, and drug prediction. (a) Weighted Library Contribution to integrated MeanRank TF Ranks.Histogram of six major databases collectively predicting potential transcription factors for six hub genes. (b) Protein–protein interaction networks between the top ten potential transcription factors and the hub genes. (c) Interaction network diagram of six hub genes with predicted miRNAs. (d) Six hub genes with predicted drugs, shown in sankey diagrams. |
Animal Experimental Validation
Three groups of C57BL/6J mice were randomly assigned to a control group, a 3% DSS model group, and a mesalazine-positive medication group. After adaptive feeding for 3 days, the model group and the positive drug group drank 3% DSS freely every day, while the control group drank normally every day. The positive drug group was gavaged with 0.2 mL mesalazine (100 mg/kg) every day. Blood, colon, feces, and other samples were collected on day 9 (Figure 9a). The broken line chart of the daily disease activity index (DAI) (Table 2) is shown in Figure 9b. There was a significant difference between the model group and the control group (P < 0.05), and there was no significant difference between the drug treatment group and the control group. The DSS administration group showed significantly reduced colon length and increased colon and spleen indices. At the same time, the drug treatment group showed a significantly reduced colon index (Figure 9c and d). The above conclusions show that the control group mice and DSS-induced ulcerative colitis mice showed significant differences in mucosal ulcer, bleeding, diarrhea, inflammation, and other pathological aspects.
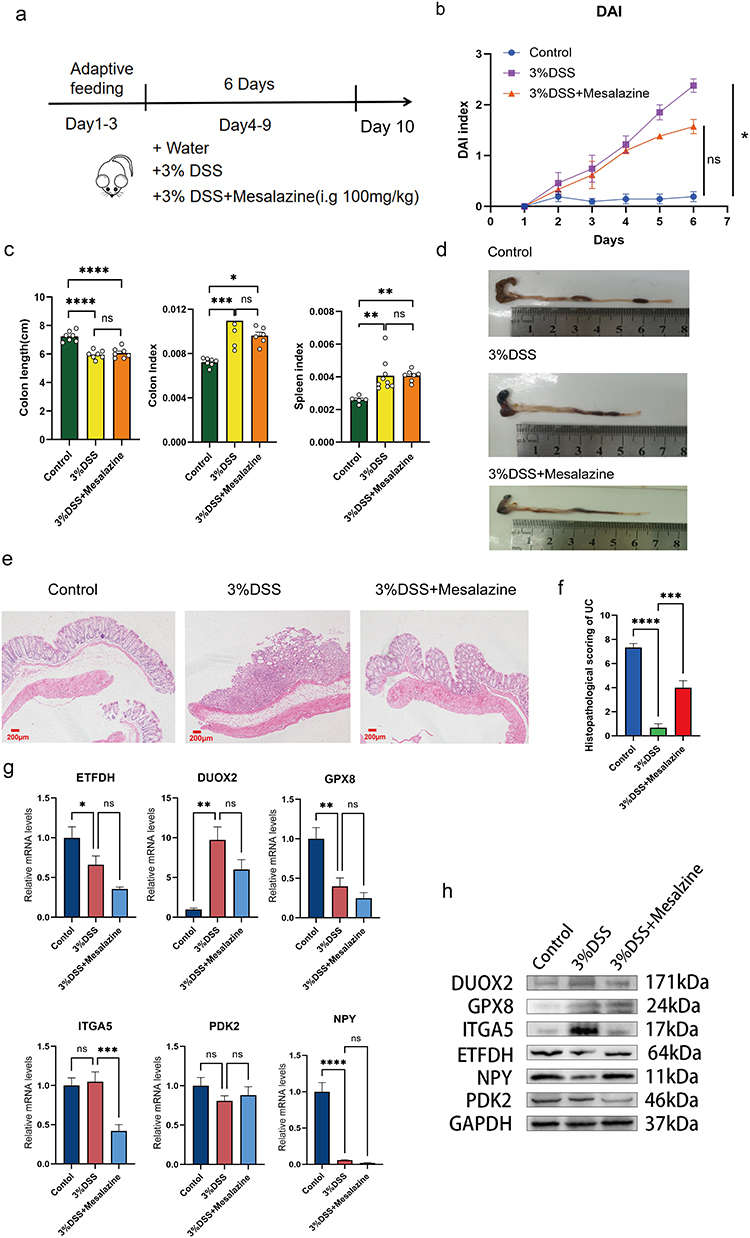 |
Figure 9 Animal experimental validation of hub genes. (a) Experimental design of DSS-induced colitis in mice. (b) Disease activity index (DAI) for each group of mice. (c) HE staining of the lower end of the colon. (d) Histopathological scoring of ulcerative colitis. (e) From left to right: bar graphs of colon length, colon index, and spleen index, respectively. (f) Colon length in each group of mice (Unit: cm). (g) qPCR validation of hub genes. (h) Western blot validation of hub genes. (In Figures d,e and g,results are expressed as mean±SEM; n≥ 6 for each treatment. ns—no significance, *p < 0.05, **p < 0.01, ***p < 0.001, ****p < 0.0001). |
HE Staining and Colon Pathological Scores
The pathological changes in colonic tissues were analyzed using HE staining and the colonic pathological score. Referring to the study by Obermeier et al19. The model group showed obvious ulceration of the colonic mucosal structure, a decreased number of goblet cells, a loss of crypt structure, and obvious infiltration of inflammatory cells, while the positive drug group was improved compared with the model group (Figure 9e and f).
qPCR of Core Genes in Ulcerative Colitis Mice
To verify the six core genes, we performed qPCR on the colonic mucosa of mice (Figure 9g). The findings demonstrated that the expression of the DUOX2 and ITGA5 genes in the model group were upregulated, while GPX8, ETFDH, NPY, and PDK2 genes were downregulated. The results of GPX8 were inconsistent with those of the dataset validation, which may be due to species differences or treatment time points, Mesalazine may not be able to reverse the trend in gene expression in the model group, and more data are needed to assist validation.
Western Blot Results
By detecting the Western blot of mouse colonic mucosa, we observed that the UC model group indeed upregulated the expression of DUOX2, GPX8, and ITGA5 and downregulated the expression of ETFDH, NPY, and PDK2 (Figure 9h).
Discussion
UC is defined as chronic, refractory inflammation of the colon, primarily characterized by mucus and bloody stools, with a high tendency for recurrence. Modern medical treatments can alleviate symptoms but cannot cure the disease. Surgical resection of the colon significantly impacts patients’ quality of life. Besides gastrointestinal symptoms, diagnosis primarily relies on pathological findings after a colonoscopy.24,25 This invasive diagnostic method is highly inconvenient, and no specific diagnostic marker exists for ulcerative colitis. Therefore, further exploration of biomarkers is essential to aid in diagnosing ulcerative colitis, which may also lead to the identification of therapeutic targets.
We first selected four data groups from the GEO database and analyzed the differential genes after correcting for batch effects. A total of 562 differentially expressed genes (DEGs) met the criteria. We conducted GO analysis, KEGG analysis, and GSEA on these genes to understand the biological processes and related pathways, particularly those enriched in the inflammatory response. Next, we intersected oxidative stress-related genes with DEGs and identified 35 consensus genes (DEOSGs). Using LASSO regression and random forest (RF) algorithms, we narrowed the scope to six and seven genes, took the intersection and identified 6 common genes: DUOX2, ETFDH, GPX8, ITGA5, NPY, and PDK2, which we considered core genes. Subsequently, we constructed an artificial neural network model and validated the core genes using ROC analysis with three additional GEO datasets. The expression of these six genes in these datasets showed significant differences (Figure 6a, ***p < 0.001). DUOX2, GPX8, and ITGA5 were upregulated in UC, while ETFDH, NPY, and PDK2 were downregulated. GO analysis revealed that these genes are enriched in NADPH oxidase-related molecules and biological processes, consistent with our screening of oxidative stress-related genes. In KEGG analysis, thyroid hormone synthesis was the top enriched pathway, primarily involving DUOX2 and GPX8. To mitigate overfitting risks in our machine learning models (LASSO, random forest), we employed 10-fold cross-validation during training and validated the final biomarker panel in three independent GEO datasets. However, we agree that larger cohorts are needed to improve generalizability.
Immune infiltration plays a crucial role in the pathogenesis of ulcerative colitis. Although the specific pathogenic mechanisms of ulcerative colitis remain unclear, studies have shown that once the colonic mucosal barrier is disrupted, innate immunity is activated, and adaptive immunity becomes dysregulated. The abnormal activation and infiltration of T cells and other immune cells subject the intestinal mucosa to continuous immune attacks, leading to ulcer formation and mucosal damage.7 We calculated the relative enrichment scores of six core genes across 16 immune cell types and 13 immune-related processes. The results indicate that these six core genes are significantly correlated with most immune cells and immune-related processes. DUOX2, GPX8, and ITGA5 showed positive correlations, while ETFDH, NPY, and PDK2 exhibited negative correlations. Among them, ITGA5 was found to be particularly strongly associated with immune cells, including ADCs, macrophages, neutrophils, Th1 cells, TILs, and Tregs. Additionally, it is enriched in immune processes such as CCR, inflammation promotion, parainflammation, and the type II IFN response. The immune infiltration results suggest that these six core genes are closely linked to immune cells and processes, making them highly promising targets for immune-related diagnosis and treatment in ulcerative colitis.
In addition, we performed transcription factor prediction and constructed a protein network interaction (PPI) using six databases. The top 10 transcription factors identified were ZNF469, Twist2, PRRX1, FoxD1, RFX8, Snai2, Twist1, PRRX2, Elk3, and TEAD3, providing a foundation for further research. We also predicted 13 drugs associated with ITGA5, NPY, and ETFDH, including methylphenidate, Cilengitide, Cilmotim, dimethyl sulfoxide, etaracizumab, GLPG-0187, PF-04605412, volociximab, bromocriptine, ether, haloperidol, K-252A, and rosiglitazone. These drugs have not yet been shown to be related to the treatment of ulcerative colitis, requiring further investigation.
To verify our findings in a mouse model, we selected mesalazine, a classic 5-aminosalicylic acid drug, to create a treatment group and used 3% DSS to establish the model group. These were compared to a control group. Samples were collected 7 days after modeling and treatment. Based on the results of colon length, spleen index, colon index, and HE staining, the colitis model was successfully established. We performed qPCR analysis on colonic mucosa and found that DUOX2 and ITGA5 were upregulated, while the other four genes were downregulated in ulcerative colitis (UC). Except for GPX8, the expression trends of the other genes were consistent with those observed in the previous dataset (Figure 6a), confirming the reliability of the previous analysis. Additionally, a Western blot analysis of the colon mucosa showed results consistent with the previous findings. DUOX2, GPX8, and ITGA5 were upregulated in UC, while ETFDH, NPY, and PDK2 were downregulated.
DUOX2, a protein located in the endoplasmic reticulum and cell membrane, is primarily responsible for encoding dual oxidase 2. Previous studies have shown that increased DUOX2 expression elevates the risk of inflammatory bowel disease (IBD).26 DUOX2 has also been implicated in the generation of reactive oxygen species (ROS), where dysregulation of ROS levels may be a contributing factor to IBD.27 Large-scale hydrogen peroxide production by DUOX2 and its maturation factor Duoxa2 can enhance ROS-induced genetic damage, potentially resulting in ulcerative colitis (UC) and associated colorectal cancer.28 Current bioinformatics analyses of other datasets suggest that DUOX2 could serve as a potential biomarker for the diagnosis and treatment of UC.29
ITGA5, a heterodimeric integral membrane protein involved in cell surface adhesion and signaling, is a member of the integrin alpha chain family. It binds to extracellular matrix proteins and plays a crucial role in cell adhesion, extracellular matrix interactions, and tumor progression.30,31 ITGA5 is actively involved in the immune pathogenesis of ulcerative colitis (UC) and plays a key role in its development. Zongbiao Tan et al32 identified high expression of ITGA5 in the colonic mucosa of UC patients through machine learning, and this was confirmed by means of immunohistochemistry.
Additionally, ITGA5 has been shown to be overexpressed in various gastrointestinal tumors and to significantly correlate with immune infiltration and poor prognosis.31 The association between ITGA5 and immune cell infiltration may be related to its role in fibroblasts regulating immune cell recruitment and function.33 In summary, ITGA5 is a biomarker with substantial potential in both UC and gastrointestinal tumors.
ETFDH is primarily located in mitochondria, and mutations in this gene are a known cause of glutaric acidemia type II (GA II), an autosomal recessive disorder.34 This condition, also called multiple acyl-CoA dehydrogenase deficiency (MADD), can also result from mutations in the ETFA and ETFB genes.35 The symptoms caused by mutations in these genes vary, but ETFDH mutations are associated with weight loss, episodic weakness, rhabdomyolysis, exercise intolerance, hepatomegaly, and gastrointestinal symptoms.36,37 The ETFDH gene is also involved in fat metabolism in the liver, where it can be induced by fasting and PPARα agonists to participate in the initial step of long-chain fatty acid (LCFA) β-oxidation in liver mitochondria, thereby improving LCFA utilization.38,39 Other studies have shown that ETFDH expression is significantly reduced in hepatocellular carcinoma (HCC), and it may become an independent biomarker for detection.37 Currently, no studies have explored the association between ETFDH and ulcerative colitis. In the validation dataset of this study, the ETFDH gene was lowly expressed in UC patients. In the qPCR and Western blot(WB) results of mouse colonic mucosa, the expression was decreased in the model group compared to the control group. This result indicates that the animal experiments are consistent with the results of data validation.
GPX8 is a non-specific antioxidant enzyme primarily located in the endoplasmic reticulum and plays a key role in protecting cells from oxidative stress. It regulates redox balance, shields cells from oxidative damage, and is crucial for antioxidation.40 Studies have demonstrated that H2O2 generated during the oxidative folding of endoplasmic reticulum proteins controls the signal transduction of nuclear factor E2-related factor 2 (Nrf2), forming the oxidative protein folding-Nrf2-ER calcium axis, which in turn controls downstream glutathione peroxidase 8 (GPX8) expression and reduces oxidative stress.41 GPX8 is aberrantly expressed in various tumor tissues, including breast cancer, gastric cancer, and lung cancer.42–44 This indicates that GPX8 may have a significant role in tumor migration, invasion, and immune microenvironment regulation. Studies have also revealed that GPX8 exhibits low expression in the colon tissue of ulcerative colitis patients and protects against colitis by inhibiting caspase-4/11 activation.45 However, in the dataset validation and WB validation of this study, GPX8 was highly expressed in colitis and lowly expressed in qPCR results. The increased expression of the anti-oxidative stress proteins in ulcerative colitis (UC) may be mainly due to the enhanced oxidative stress in UC patients, which leads to the upregulation of the expression of anti-oxidative stress proteins in response to this imbalance. The qPCR results may be explained by the small sample size. However, the reason for the difference and the specific mechanism need to be further explored.
PDK2 is a mitochondria-related gene. In the tricarboxylic acid cycle, pyruvate dehydrogenase kinase (PDK) inhibits pyruvate dehydrogenase, thereby hindering the conversion of pyruvate to acetyl-CoA. This mechanism has also been studied in the context of tumor suppression.46 Research has shown that the expression of PDK2 is reduced in colon tissue induced by DSS, and PDK2 is involved in immune response regulation, showing a negative correlation with M1 macrophage infiltration.47 The development of ulcerative colitis (UC) is significantly influenced by mitochondria. Because mitochondrial dysfunction affects ATP levels, mitochondrial reactive oxygen species (mtROS), mitochondrial damage-associated molecular patterns (DAMPs), and immunological function, it has a substantial impact on the onset and course of ulcerative colitis.48 These findings suggest that targeting mitochondria could be a therapeutic strategy for improving UC by reducing ROS production and oxidative damage.49
Neuropeptide Y (NPY) is a potent regulator of intestinal immune function. Through five G protein-coupled receptors (Y1, Y2, Y4, Y5, and Y6), it regulates physiological functions such as appetite, mood, and pain in the central nervous system, as well as vasoconstriction, immune response, and metabolism in peripheral tissues.50 A study showed that LPS can activate suprarenal and celiac ganglia (SrG-CG) neurons and upregulate NPY expression in rats. In a neuron and splenocyte coculture system and in vivo experiments, neuronal NPY in SrG-CG attenuated the splenic immune response. These suggested that NPY might be utilized to alleviate inflammatory storms during infection and to modulate immune balance in autoimmune diseases.51 A 2024 study published in Gut Microbes demonstrated that fecal transplantation from UC patients into mice led to a significant reduction in NPY levels in the colon, plasma, and hippocampus of the mice.52 In this study, NPY gene expression was significantly lower in UC compared to the control group, indicating its downregulation in UC, which is consistent with animal experiment findings.
According to the results of our study of six genes, ITGA5 and DUOX2 are highly expressed in UC. DUOX2 and GPX8 are associated with oxidative stress. In previous studies, GPX8 acted as an antioxidant in UC while DUOX2 increased ROS production. ITGA5 is a hub gene related to immune infiltration in UC, which plays a catalytic role in the development of colitis. ETFDH and PDK2, both mitochondria-related genes, are expressed at low levels in UC. Currently, there are numerous studies on PDK2, but research on the ETFDH gene mainly focuses on MADD, with limited studies investigating the relationship between ETFDH and UC. NPY is a neurotransmitter in the brain. NPY may directly act on the T cells and macrophages via NPY1R and subsequently inhibit the TNF signaling pathway.50 In an allergic airway inflammation model, NPY exerts an anti-inflammatory role by activating NPY1R on nociceptor neurons to suppress their excitability and limit T cell infiltration, counteracting the pro-inflammatory reprogramming driven by IL-13/STAT6 signaling.53 The above studies suggest that NPY has a role in inhibiting inflammatory responses. In this study, NPY gene expression in the colon tissue of UC-model mice was decreased, suggesting that its expression was inhibited. The specific mechanisms by which these genes affect UC remain to be explored.
Limitations and Future Directions
Although we validated hub gene expression changes in vivo, the causal roles of these genes in UC pathogenesis remain to be explored. Future studies should employ siRNA or CRISPR-based approaches in colonic cell lines to assess functional effects on oxidative stress pathways. While our models demonstrated robust performance in cross-validation and external datasets, the sample size (n=51 per cohort) may limit generalizability. Future studies should expand training data and incorporate multi-center cohorts to reduce potential overfitting. The mouse model results (eg, DUOX2 upregulation) showed statistical significance (p<0.05), but the sample size (n=6–8) may underpower subtle effects. A post-hoc power analysis is recommended in future work. Computational drug predictions (eg, targeting GPX8) are exploratory and should be validated by high-throughput screening or in vitro assays. Among the predicted drugs, CILENGITIDE, GLPG-0187, and ROSIGLITAZONE have documented anti-inflammatory effects via integrin inhibition or PPAR-γ activation, aligning with UC pathogenesis. We propose these as high-priority candidates for experimental validation in future studies. Next, we will detect these biomarkers in human feces and saliva to explore potential non-invasive biomarkers for UC.
Conclusions
Our multi-dataset analysis identified six oxidative stress-related genes (DUOX2, ETFDH, GPX8, ITGA5, NPY, PDK2) as potential biomarkers for ulcerative colitis (UC). DUOX2 and ITGA5 were upregulated in DSS-induced colitis, suggesting roles in inflammation and epithelial dysfunction, while ETFDH, PDK2, and NPY were downregulated, possibly reflecting metabolic and neuro-immune dysregulation. GPX8 protein increased in colonic mucosa, indicating an antioxidant response. Future work should validate these genes in human UC cohorts and test their functional mechanisms to bridge insights to translational utility.
Abbreviations
UC, Ulcerative colitis; GEO, Gene Expression Omnibus; DEGs, Diferentially expressed genes; DEOSGs, differentially expressed genes associated with oxidative stress; qPCR, Quantitative Real-time PCR; DSS, Dextran Sulfate Sodium Salt; IBD, inflammatory bowel disease; ROC, Receiver operating characteristic curve; GSEA, Gene Set Enrichment Analysis; LASSO, Least absolute shrinkage and selection operator; RF, random forest; GO, Gene Ontology; CC, cellular component; MF, molecular function; BP, biological process; KEGG, Kyoto Encyclopedia of Genes and Genomes; ANN, artificial neural networks.
Data Sharing Statement
The datasets used in this study can be accessed through the GEO database (https://www.ncbi.nlm.nih.gov/geo/). All raw data and code are available from the corresponding author Dong Zhang,with a reasonable request.
Ethics Declarations
In this study, we legally utilized the public database (GEO) for our research. In accordance with Item 1 and Item 2 of Article 32 of the “Measures for Ethical Review of Life Science and Medical Research Involving Human Subjects” issued in China on February 18, 2023, this study is eligible for ethical exemption.All animal experiments were conducted in accordance with animal ethics requirements and were approved by the Animal Ethics Committee of Guangzhou University of Traditional Chinese Medicine (Ethics No.20210903008).The experiments were conducted in accordance with the guidelines set forth in the Guide for the Care and Use of Laboratory Animals, which was developed by the National Academy of Sciences (NAS) and published by the National Institutes of Health (NIH).54
Funding
This research was supported by Basic and Applied Basic Research Foundation of Guangdong Province(2022A1515110851), Shenzhen Science and Technology Program (JCYJ20220531092005011), Tip-top Scientific and Technical Innovative Youth Talents of Guangdong Special Support Program (0620220209),National Natural Science Foundation of China, (82305105), and Sanming Project of Medicine in Shenzen Municipality (No.SZZYSM202211002).
Disclosure
The authors have no competing interests in this paper.
References
1. Ng SC, Shi HY, Hamidi N, et al. Worldwide incidence and prevalence of inflammatory bowel disease in the 21st century: a systematic review of population-based studies. Lancet. 2017;390(10114):2769–2778. doi:10.1016/S0140-6736(17)32448-0
2. Le Berre C, Honap S, Peyrin-Biroulet L. Ulcerative colitis. Lancet. 2023;402(10401):571–584. doi:10.1016/s0140-6736(23)00966-2
3. Olfatifar M, Zali MR, Pourhoseingholi MA, et al. The emerging epidemic of inflammatory bowel disease in Asia and Iran by 2035: a modeling study. Bmc Gastroenterol. 2021;21(1). doi:10.1186/s12876-021-01745-1
4. Zhao M, Gönczi L, Lakatos PL, Burisch J. The burden of inflammatory bowel disease in Europe in 2020. J Crohns Colitis. 2021;15(9):1573–1587. doi:10.1093/ecco-jcc/jjab029
5. Jess T, Rungoe C, Peyrin-Biroulet L. Risk of colorectal cancer in patients with ulcerative colitis: a meta-analysis of population-based cohort studies. Clin Gastroenterol H. 2012;10(6):639–645. doi:10.1016/j.cgh.2012.01.010
6. Eaden JA, Abrams KR, Mayberry JF. The risk of colorectal cancer in ulcerative colitis: a meta-analysis. Gut. 2001;48(4):526–535. doi:10.1136/gut.48.4.526
7. Du LL, Ha C. Epidemiology and pathogenesis of ulcerative colitis. Gastroenterol Clin N. 2020;49(4):643–+. doi:10.1016/j.gtc.2020.07.005
8. Conrad K, Roggenbuck D, Laass MW. Diagnosis and classification of ulcerative colitis. Autoimmun Rev. 2014;13(4–5):463–466. doi:10.1016/j.autrev.2014.01.028
9. Gros B, Kaplan GG. Ulcerative colitis in adults: a review. JAMA. 2023;330(10):951–965. doi:10.1001/jama.2023.15389
10. Karp SM, Koch TR. Oxidative stress and antioxidants in inflammatory bowel disease. Dis Mon. 2006;52(5):199–207. doi:10.1016/j.disamonth.2006.05.005
11. Aviello G, Knaus UG. NADPH oxidases and ROS signaling in the gastrointestinal tract. Mucosal Immunol. 2018;11(4):1011–1023. doi:10.1038/s41385-018-0021-8
12. Bourgonje AR, Feelisch M, Faber KN, Pasch A, Dijkstra G, van Goor H. Oxidative stress and redox-modulating therapeutics in inflammatory bowel disease. Trends Mol Med. 2020;26(11):1034–1046. doi:10.1016/j.molmed.2020.06.006
13. Olivera P, Danese S, Jay N, Natoli G, Peyrin-Biroulet L. Big data in IBD: a look into the future. Nat Rev Gastroenterol Hepatol. 2019;16(5):312–321. doi:10.1038/s41575-019-0102-5
14. Dai Q, Bao CH, Hai YB, et al. MTGIpick allows robust identification of genomic islands from a single genome. Brief Bioinform. 2018;19(3):361–373. doi:10.1093/bib/bbw118
15. Wang Y, Huang J, Zhang J, Wang F, Tang X. Identifying biomarkers associated with the diagnosis of ulcerative colitis via bioinformatics and machine learning. Math Biosci Eng. 2023;20(6):10741–10756. doi:10.3934/mbe.2023476
16. Xi LJ, Guo ZY, Yang XK, Ping ZG. Application of LASSO and its extended method in variable selection of regression analysis. Zhonghua Yu Fang Yi Xue Za Zhi. 2023;57(1):107–111. doi:10.3760/cma.j.cn112150-20220117-00063
17. Yaldız B, Erdoğan O, Rafatov S, Iyigün C, Aydın Son Y. Revealing third-order interactions through the integration of machine learning and entropy methods in genomic studies. BioData Min. 2024;17(1):3. doi:10.1186/s13040-024-00355-3
18. Feng CM, Xu Y, Liu JX, Gao YL, Zheng CH. Supervised discriminative sparse PCA for com-characteristic gene selection and tumor classification on multiview biological data. IEEE Trans Neural Netw Learn Syst. 2019;30(10):2926–2937. doi:10.1109/tnnls.2019.2893190
19. Charlton CE, Poon MTC, Brennan PM, Fleuriot JD. Development of prediction models for one-year brain tumour survival using machine learning: a comparison of accuracy and interpretability. Comput Methods Programs Biomed. 2023;233:107482. doi:10.1016/j.cmpb.2023.107482
20. Teng X, Han K, Jin W, et al. Development and validation of an early diagnosis model for bone metastasis in non-small cell lung cancer based on serological characteristics of the bone metastasis mechanism. EClinicalMedicine. 2024;72:102617. doi:10.1016/j.eclinm.2024.102617
21. Yamamura S. Clinical application of artificial neural network (ANN) modeling to predict pharmacokinetic parameters of severely ill patients. Adv Drug Deliv Rev. 2003;55(9):1233–1251. doi:10.1016/s0169-409x(03)00121-2
22. Qu Y, Li X, Xu F, et al. Kaempferol alleviates murine experimental colitis by restoring gut microbiota and inhibiting the LPS-TLR4-NF-κB axis. Front Immunol. 2021;12:679897. doi:10.3389/fimmu.2021.679897
23. Obermeier F, Kojouharoff G, Hans W, Schölmerich J, Gross V, Falk W. Interferon-gamma (IFN-gamma)- and tumour necrosis factor (TNF)-induced nitric oxide as toxic effector molecule in chronic dextran sulphate sodium (DSS)-induced colitis in mice. Clin Exp Immunol. 1999;116(2):238–245. doi:10.1046/j.1365-2249.1999.00878.x
24. Maaser C, Sturm A, Vavricka SR, et al. ECCO-ESGAR guideline for diagnostic assessment in IBD part 1: initial diagnosis, monitoring of known IBD, detection of complications. J Crohns Colitis. 2019;13(2):144–+. doi:10.1093/ecco-jcc/jjy113
25. Magro F, Gionchetti P, Eliakim R, et al. Third European evidence-based consensus on diagnosis and management of ulcerative colitis. part 1: definitions, diagnosis, extra-intestinal manifestations, pregnancy, cancer surveillance, surgery, and ileo-anal pouch disorders (publication with expression of concern). J Crohns Colitis. 2017;11(6):649–670. doi:10.1093/ecco-jcc/jjx008
26. Grasberger H, Noureldin M, Kao TD, et al. Increased risk for inflammatory bowel disease in congenital hypothyroidism supports the existence of a shared susceptibility factor. Sci Rep-Uk. 2018;8. doi:10.1038/s41598-018-28586-5
27. Dang PMC, Rolas L, El-Benna J. The dual role of reactive oxygen species-generating nicotinamide adenine dinucleotide phosphate oxidases in gastrointestinal inflammation and therapeutic perspectives. Antioxid Redox Sign. 2020;33(5):354–373. doi:10.1089/ars.2020.8018
28. Burgueño JF, Fritsch J, González EE, et al. Epithelial TLR4 signaling activates DUOX2 to induce microbiota-driven tumorigenesis. Gastroenterology. 2021;160(3):797–+. doi:10.1053/j.gastro.2020.10.031
29. Yang Y, Hua Y, Zheng H, et al. Biomarkers prediction and immune landscape in ulcerative colitis: findings based on bioinformatics and machine learning. Comput. Biol. Med. 2024;168:107778. doi:10.1016/j.compbiomed.2023.107778
30. Bianconi D, Unseld M, Prager GW. Integrins in the spotlight of cancer. Int J Mol Sci. 2016;17(12):2037. doi:10.3390/ijms17122037
31. Zhu H, Wang G, Zhu HX, Xu AA. ITGA5 is a prognostic biomarker and correlated with immune infiltration in gastrointestinal tumors. Bmc Cancer. 2021;21(1). doi:10.1186/s12885-021-07996-1
32. Tan ZB, Liu C, He PZ, et al. Based on weighted gene co-expression network analysis reveals the hub immune infiltration-related genes associated with ulcerative colitis. J Inflamm Res. 2024;17:357–370. doi:10.2147/Jir.S428503
33. Lu L, Xie RT, Wei R, et al. Integrin α5 subunit is required for the tumor supportive role of fibroblasts in colorectal adenocarcinoma and serves as a potential stroma prognostic marker. Mol Oncol. 2019;13(12):2697–2714. doi:10.1002/1878-0261.12583
34. Ou M, Zhu L, Zhang Y, et al. A novel electron transfer flavoprotein dehydrogenase (ETFDH) gene mutation identified in a newborn with glutaric acidemia type II: a case report of a Chinese family. Article Bmc Medical Genetics. 2020;21(1):98. doi:10.1186/s12881-020-00995-2
35. Prasun P. Multiple Acyl-CoA dehydrogenase deficiency. In: Adam MP, Feldman J, Mirzaa GM, editors. GeneReviews. 1993.
36. Liang WC, Lin YF, Liu TY, et al. Neurite growth could be impaired by mutation but restored by mitochondrial cofactors. Muscle Nerve. 2017;56(3):479–485. doi:10.1002/mus.25501
37. Wu YX, Zhang XS, Shen R, et al. Expression and significance of ETFDH in hepatocellular carcinoma. Pathol Res Pract. 2019;215(12):152702. doi:10.1016/j.prp.2019.152702
38. Nakamura MT, Yudell BE, Loor JJ. Regulation of energy metabolism by long-chain fatty acids. Prog lipid res. 2014;53:124–144. doi:10.1016/j.plipres.2013.12.001
39. Cheon Y, Nara TY, Band MR, Beever JE, Wallig MA, Nakamura MT. Induction of overlapping genes by fasting and a peroxisome proliferator in pigs: evidence of functional PPARalpha in nonproliferating species. Am J Physiol Regul Integr Comp Physiol. 2005;288(6):R1525–35. doi:10.1152/ajpregu.00751.2004
40. Pei J, Pan X, Wei G, Hua Y. Research progress of glutathione peroxidase family (GPX) in redoxidation. Front Pharmacol. 2023;14. doi:10.3389/fphar.2023.1147414
41. Granatiero V, Konrad C, Bredvik K, Manfredi G, Kawamata H. Nrf2 signaling links ER oxidative protein folding and calcium homeostasis in health and disease. Life Sci Alliance. 2019;2(5):e201900563. doi:10.26508/lsa.201900563
42. Chen H, Xu L, Shan ZL, Chen S, Hu H. GPX8 is transcriptionally regulated by FOXC1 and promotes the growth of gastric cancer cells through activating the Wnt signaling pathway. Cancer Cell Int. 2020;20(1):596. doi:10.1186/s12935-020-01692-z
43. Khatib A, Solaimuthu B, Ben Yosef M, et al. The glutathione peroxidase 8 (GPX8)/IL-6/STAT3 axis is essential in maintaining an aggressive breast cancer phenotype. Proc Natl Acad Sci USA. 2020;117(35):21420–21431. doi:10.1073/pnas.2010275117
44. Xu YL, Yuan LW, Jiang XM, et al. Glutathione peroxidase 8 expression on cancer cells and cancer-associated fibroblasts facilitates lung cancer metastasis. MedComm. 2022;3(3):e152. doi:10.1002/mco2.152
45. Hsu JL, Chou JW, Chen TF, et al. Glutathione peroxidase 8 negatively regulates caspase‐4/11 to protect against colitis. EMBO Mol. Med. 2019;12(1). doi:10.15252/emmm.201809386
46. Sun WH, Chen YH, Lee HH, Tang YW, Sun KH. PDK1- and PDK2-mediated metabolic reprogramming contributes to the TGFβ1-promoted stem-like properties in head and neck cancer. Cancer Metab. 2022;10(1):23. doi:10.1186/s40170-022-00300-0
47. Yang Q, Zhang P, Han L, et al. Mitochondrial-related genes PDK2, CHDH, and ALDH5A1 served as a diagnostic signature and correlated with immune cell infiltration in ulcerative colitis. Aging. 2024;16(4):3803–3822. doi:10.18632/aging.205561
48. Ho G-T, Theiss AL. Mitochondria and Inflammatory Bowel Diseases: toward a Stratified Therapeutic Intervention. Ann Rev Physiol. 2022;84(1):435–459. doi:10.1146/annurev-physiol-060821-083306
49. Ho GT, Aird RE, Liu B, et al. MDR1 deficiency impairs mitochondrial homeostasis and promotes intestinal inflammation. Mucosal Immunol. 2018;11(1):120–130. doi:10.1038/mi.2017.31
50. El-Salhy M, Hausken T. The role of the neuropeptide Y (NPY) family in the pathophysiology of inflammatory bowel disease (IBD). Neuropeptides. 2016;55:137–144. doi:10.1016/j.npep.2015.09.005
51. Yu J, Xiao K, Chen X, et al. Neuron-derived neuropeptide Y fine-tunes the splenic immune responses. Neuron. 2022;110(8):1327–1339.e6. doi:10.1016/j.neuron.2022.01.010
52. Joo M-K, Lee J-W, Woo J-H, Kim H-J, Kim D-H, Choi J-H. Regulation of colonic neuropeptide Y expression by the gut microbiome in patients with ulcerative colitis and its association with anxiety- and depression-like behavior in mice. Gut Microbes. 2024;16(1). doi:10.1080/19490976.2024.2319844
53. Crosson T, Bhat S, Wang JC, et al. Cytokines reprogram airway sensory neurons in asthma. Cell Rep. 2024;43(12):115045. doi:10.1016/j.celrep.2024.115045
54. Council NR, Earth Do, Studies, L. & Research, I. L. A. Care CftUotGft, Animals UoL. The national academies collection: reports funded by national institutes of health. Guide for the Care and Use of Laboratory Animals. 2011.
 © 2025 The Author(s). This work is published and licensed by Dove Medical Press Limited. The
full terms of this license are available at https://www.dovepress.com/terms
and incorporate the Creative Commons Attribution
- Non Commercial (unported, 4.0) License.
By accessing the work you hereby accept the Terms. Non-commercial uses of the work are permitted
without any further permission from Dove Medical Press Limited, provided the work is properly
attributed. For permission for commercial use of this work, please see paragraphs 4.2 and 5 of our Terms.
© 2025 The Author(s). This work is published and licensed by Dove Medical Press Limited. The
full terms of this license are available at https://www.dovepress.com/terms
and incorporate the Creative Commons Attribution
- Non Commercial (unported, 4.0) License.
By accessing the work you hereby accept the Terms. Non-commercial uses of the work are permitted
without any further permission from Dove Medical Press Limited, provided the work is properly
attributed. For permission for commercial use of this work, please see paragraphs 4.2 and 5 of our Terms.
Recommended articles
DOCK4 as a Potential Biomarker Associated with Immune Infiltration in Stomach Adenocarcinoma: A Database Analysis
Lu Y, Yu J, Dong Q, Du Y, Liang Z
International Journal of General Medicine 2022, 15:6127-6143
Published Date: 11 July 2022
Establishment of Risk Model and Analysis of Immunoinfiltration Based on Mitophagy-Related Associated Genes in Atrial Fibrillation
Sang W, Wang L, Yan X, Sun H, Han Y, Wang F, Tang B, Li Y
Journal of Inflammation Research 2023, 16:2561-2583
Published Date: 16 June 2023
Integrated Analysis of Immune Infiltration and Hub Pyroptosis-Related Genes for Multiple Sclerosis
Zhang S, Ma Y, Luo X, Xiao H, Cheng R, Jiang A, Qin X
Journal of Inflammation Research 2023, 16:4043-4059
Published Date: 13 September 2023
Role of Kinetochore Scaffold 1 (KNL1) in Tumorigenesis and Tumor Immune Microenvironment in Pan-Cancer: Bioinformatics Analyses and Validation of Expression
Ding Y, Wang K, Zhao S, Li Y, Qiu W, Zhu C, Wang Y, Dong C, Liu J, Lu Y, Qi W
International Journal of General Medicine 2023, 16:4883-4906
Published Date: 31 October 2023
Comprehensive Analysis of Programmed Cell Death-Related Genes in Diagnosis and Synovitis During Osteoarthritis Development: Based on Bulk and Single-Cell RNA Sequencing Data
Zhou J, Jiao S, Huang J, Dai T, Xu Y, Xia D, Feng Z, Chen J, Li Z, Hu L, Meng Q
Journal of Inflammation Research 2025, 18:751-778
Published Date: 17 January 2025