Back to Journals » Journal of Inflammation Research » Volume 16
Establishment of Risk Model and Analysis of Immunoinfiltration Based on Mitophagy-Related Associated Genes in Atrial Fibrillation
Authors Sang W, Wang L, Yan X ![]() , Sun H, Han Y, Wang F, Tang B
, Sun H, Han Y, Wang F, Tang B ![]() , Li Y
, Li Y
Received 21 April 2023
Accepted for publication 13 June 2023
Published 16 June 2023 Volume 2023:16 Pages 2561—2583
DOI https://doi.org/10.2147/JIR.S415410
Checked for plagiarism Yes
Review by Single anonymous peer review
Peer reviewer comments 2
Editor who approved publication: Dr Tara Strutt
Wanyue Sang,1,2,* Lu Wang,1,2,* Xiaoji Yan,3,* Huaxin Sun,1,2 Yafan Han,1,2 Feifei Wang,1,2 Baopeng Tang,1,2 Yaodong Li1,2
1Cardiac Pacing and Electrophysiology Department, The First Affiliated Hospital of Xinjiang Medical University, Urumqi, Xinjiang, People’s Republic of China; 2Xinjiang Key Laboratory of Cardiac Electrophysiology and Cardiac Remodeling, The First Affiliated Hospital of Xinjiang Medical University, Urumqi, Xinjiang, People’s Republic of China; 3Department of Emergency, Sir Run Run Shaw Hospital Affiliated to Zhejiang University School of Medicine, Hangzhou, Zhejiang, People’s Republic of China
*These authors contributed equally to this work
Correspondence: Yaodong Li; Baopeng Tang, Cardiac Pacing and Electrophysiology Department, The First Affiliated Hospital of Xinjiang Medical University, 137 Liyushan Road, Urumqi, Xinjiang, 830000, People’s Republic of China, Tel/Fax +86 15099538881 ; +86 9914362614, Email [email protected]; [email protected]
Objective: Atrial fibrillation (AF) is a common tachyarrhythmia whose pathogenesis remains elusive. In the present study, we aimed to investigate the pathological mechanism of mitophagy and immunoinfiltration in AF.
Methods: First, we identified differentially expressed mitophagy-related genes (DEMRGs) based on the GSE79768 and GSE115574 datasets, subjecting them to functional enrichment analysis. STRING, TRRUST, miRNet, miRwalk, and Cytoscape were used to explore the potential regulatory roles of downstream signaling pathways. Subsequently, the random forest method was used to construct the AF risk model, and the DEMRGs most correlated with AF risk were determined by combining the Gini index. ssGSEA algorithm, NMF algorithm, and unsupervised clustering were used to subdivide AF molecular types. We then studied the characteristics of mitophagy- and immune infiltration-related genes in AF. Ultimately, we detected the expression of key genes in canine atrial tissues and HL-1 cells by immunofluorescence and Western blot.
Results: Mitophagy and immune infiltration were significantly enriched and activated in AF samples. Thirty-seven DEMRGs were screened, of which MAPK1, VDAC1, MAPK14, and MTERF3 were most associated with AF risk. The risk model based on these could identify patients at a high risk of AF. The infiltration of immunocells such as mast cells and neutrophils was significantly different among AF types. Finally, expression verification indicated that the expression trend of four key genes in canine atrial muscle tissue and HL-1 cells was consistent.
Conclusion: We found that mitophagy may participate in AF progression through immune activation. In addition, the AF risk prediction model composed of VDAC1, MAPK1, MAPK14, and MTERF3 has a good AF prediction performance, which provides new ideas for the study of AF pathogenesis and potential therapeutic targets.
Keywords: atrial fibrillation, mitophagy, molecular subtypes, immune infiltration, random forest
Introduction
Atrial fibrillation (AF) is a tachyarrhythmia whose incidence and prevalence are steadily increasing with better chronic disease management in the aging global population. As of 2020, 37.5 million patients worldwide were affected by AF, accounting for 0.51% of the global population.1 As a common arrhythmia, AF greatly increases the incidence of life-threatening complications such as stroke events, embolism and heart failure,2–4 therefore, is significantly associated with high mortality.5 Several factors are involved in AF development, including inflammation, calcium overload, and oxidative stress.6,7 At present, AF treatment mainly includes heart rate control, catheter ablation, and thromboprophylaxis, among others. Although catheter ablation improves cardiac function significantly better than medical therapy alone,8 some patients experience AF recurrence even after treatment. Consequently, establishing a risk prediction model and identifying potential biomarkers and therapeutic targets for AF is of great significance for improving the accuracy of early diagnosis, early intervention and improving the prognosis of patients. Autophagy is an significant pathway for the initiation and development of AF.9 Considering the central role of mitochondria in cellular energy metabolism,10 we speculate that mitophagy should be implicated in AF. Mitophagy is a selective form of autophagy that specifically targets redundant and dysfunctional mitochondria to avoid their accumulation, suppress excessive reactive oxygen species (ROS) production, and optimize oxygen consumption.11 Regulation of energy metabolism and ion homeostasis by mitophagy plays a significant role in the pathogenesis and treatments of cardiovascular disorders including atherosclerosis as well as heart failure.12 He et al showed that peptide apelin-13 promotes vascular smooth muscle cell proliferation and atherosclerotic lesions by activating PINK1/parkin-dependent mitochondrial autophagy.13 In addition, OPA1-induced mitophagy activation protects against cardiomyocyte damage following myocardial infarction by reducing cardiomyocyte inflammation, oxidative stress, and mitochondrial dysfunction.14 However, the relationship between mitophagy and AF remains elusive.
Increasingly evidence shows that immune cell infiltration is involved in AF pathophysiology.15,16 Hohmann et al observed immune infiltration in the left atrial appendage tissue of patients with persistent AF.17 Furthermore, immune homeostasis dysregulation has been implicated in the development of atrial conduction abnormalities and arrhythmogenic substrates in AF,18 with multiple bioinformatics analyses having confirmed the relevance between immunoinfiltration and AF.17 However, the characteristics of immune cell infiltration in AF remain unclear. Therefore, understanding the function of and interplay between mitophagy-related genes and immune cells in AF would be immensely significant for identifying potential biomarkers for AF therapy.
Although several bioinformatics studies have been conducted on AF to identify key mediators and therapeutic targets, most remained at the speculative level without verification,19 with single-dimensional verification,20 or included only one dataset.21 In addition, none of these studies addressed the correlation between mitophagy and AF.
In the present study, multiple gene expression data sets from GEO were used for systematic analysis. A series of bioinformatics methods were applied to analyze changes in mitophagy-related gene expression in AF. Subsequently, a differentially expressed mitophagy-related gene (DEMRG)-based AF risk model was constructed, and AF samples were divided into two molecular subtypes according to the expression of DEMRGs by further analyzing the differences in mitophagy and immune infiltration. Finally, immunofluorescence (IF) and Western blot (WB) were used to validate the differential expression of the four DEMRGs (VDAC1, MAPK1, MAPK14, and MTERF3) most associated with AF risk in canine atrial tissue and HL-1 atrial myocytes. Our findings provide insight into altered expression of mitophagy-related genes and potential immune infiltration processes involved in AF pathogenesis and suggest new therapeutic targets.
Materials and Methods
Data Acquisition
The R package GEOquery22 was used to download gene expression data from the GEO database23 for cardiac tissue of patients with AF. The specific datasets obtained were GSE7976824 and GSE11557425 (Supplementary Table S1). Data from the GSE79768 dataset based on the GPL570 [HG-U133_Plus_2] Affymetrix Human Genome U133 Plus 2.0 Array platform were extracted and divided into 12 sinus rhythm (SR) and 14 AF groups. Data from the GSE115574 dataset based on the GPL570 [HG-U133_Plus_2] Affymetrix Human Genome U133 Plus 2.0 Array platform were extracted to obtain 31 SR and 28 AF samples. The dataset was subjected to debatching, normalization, and probe annotation, among other processing steps. The expression matrix for analysis was obtained by extracting gene expression levels using the limma26 package, including 43 SR samples and 42 AF samples.
To evaluate the role of mitophagy in AF, 146 genes related to mitophagy were identified based on the Relevance score > 1.5 and Zhuo27 in Genecards. Then, we screened for differentially expressed genes (DEGs) with significant expression differences between SR and AF samples, with the threshold for differential expression set at logFC > 0.585 and P < 0.05 for up-regulated genes as well as at logFC < −0.585 and P < 0.05 for down-regulated genes; meanwhile, the data was presented in a volcano map. Furthermore, based on the Wilcoxon rank sum test, 37 mitophagy-associated DEGs were identified between the two groups. The pheatmap11 package was then used to plot a heat map showing expression differences between the SR and AF groups.
Gene Ontology (GO) Functional Enrichment and Kyoto Encyclopedia of Genes and Genomes (KEGG) Pathway Enrichment
GO is a commonly used method for performing large-scale functional enrichment studies and provides an ontology for describing the properties of gene products in three non-overlapping domains: biological process (BP), molecular function (MF), and cellular component (CC).28 KEGG is a widely used database that stores information on genomes, biological pathways, diseases, drugs and so on.14,29 We used the clusterProfiler package for GO functional enrichment and KEGG pathway enrichment analysis of mitophagy-associated DEGs,30 and P < 0.05 was considered statistically significant.
Gene Set Variation Analysis (GSVA) and Gene Set Enrichment Analysis (GSEA)
We performed GSVA enrichment analysis on DEMRGs using GSVA packages31 and set the threshold to 丨logFC丨> 0.1 and P < 0.05 by downloading the gene set “c2.cp.kegg.v7.5.1.symbols.gmt” to identify pathways significantly enriched for the DEMRGs between the HC and AF groups. GSVA is a nonparametric, unsupervised assay for evaluating the enrichment results of gene sets. It is predominantly used to evaluate whether different metabolic pathways are enriched between samples by converting the gene expression matrix into the expression matrix of gene sets.
Subsequently, we performed GSEA using the “clusterprofiler” R package pair. The distribution of genes from a predefined gene set was assessed using GSEA in order to determine their contribution to a phenotype.32 We obtained the MSigDB C2 curated KEGG gene set (c2.cp.v7.5.1.symbols.gmt)33 and set significance at P-value < 0.05.
Building Protein-Protein Interaction (PPI) Networks
STRING34 is a database that searches for known proteins and predicts interactions between them. We used STRING to construct PPI networks for DEMRGs. We imported the gene list into the STRING database (Version 11.5) and set the reliability to 0.4. Then, we imported the PPI tabular data into Cytoscape (version 3.9.1) to build a PPI network. Finally, hub genes in the PPI network were analyzed using the CytoHubba plugin,35 and the top 10 genes were selected as the core genes according to MCC score.
Hub-miRNAs and TF-Hub Network Construction
miRNAs are a type of noncoding single-stranded RNA molecules produced endogenously (approximately 19–25 nt long), and play important regulatory roles in the cell. miRNAs participate in the post-transcriptional regulation of genes, and have been concerned with tumorigenesis, development, organ formation, epigenetic regulation, and viral defense. As a part of complex regulatory networks, each miRNA regulates several target genes, and the same target gene is regulated by various miRNAs. To analyze the relationship between key genes and miRNAs, we obtained miRNAs associated with key genes from the miRNet miRwalk database36 (http://mirwalk.umm.uni-heidelberg.de/) and constructed an mRNA-miRNA regulatory network. We visualized the mRNA-miRNA regulatory network using Cytoscape software.
Transcription factors (TFs) control gene expression through their interaction with target genes. Transcriptional Regulatory Relationships Unraveled by Sentence-based Text Mining (TRRUST) is a human-annotated transcriptional regulatory network database.37 The TRRUST database contains 8444 pairs of transcription factors and transcription factor-target regulatory relationships for 800 individuals. To analyze the regulatory effect of TFs on expression of key genes, we searched for TFs bound to the hub gene from TRRUST (version 2) (https://www.grnpedia.org/trrust/) database. The relationship between transcription factors and DEGs was retrieved, and the interaction network between key genes and TFs was constructed. We visualized key gene-TF interaction networks using Cytoscape software.
Risk Model Construction
We used random forests (RF) and support vector machines (SVMs) to build risk models of AF based on the expression of DEMRGs. The receiver operating characteristic (ROC) curve is a coordinate schema analysis tool that can be used to select the best model, discard the next best model, or set the best threshold within the same model. The ROC curve is a comprehensive index reflecting the continuous variable of sensitivity and specificity, and the correlation between sensitivity and specificity is reflected by the composition method. The area value under the ROC curve is generally between 0.5 and 1; the closer the area under curve (AUC) is to 1, the better the diagnosis.38 The residual values of the models constructed by the two methods were compared, ROC curve was plotted, and the AUC was calculated to assess model performance. Finally, we selected RF, with a small residual value and a large AUC, for constructing the risk model. An RF tree was generated to determine the optimal number of DEMRGs needed for the model. To screen out DEMRGs with significant effects on AF and assess the significance of each DEG in AF risk, Gini index was used to calculate the influence of variables on the heterogeneity of observed values at each node of the classification tree, and the significance of each DEMRG was compared. A smaller Gini index indicates greater importance of the gene. After screening DEMRGs significantly correlated with AF risk, their effect on AF risk was visualized by drawing a nomogram, and a risk model of AF based on mitophagy-related genes was constructed.
Immunoinfiltration Analysis in SR and AF
First, we used the single-sample Gene Set Enrichment Analysis (ssGSEA) algorithm to quantify the infiltration of different immunocell types. The immune cell dataset was taken from Charoentong et al.39 Based on the results of ssGSEA, Spearman correlation coefficient between immune cell infiltration and DEMRGs was calculated, and correlation heat map was drawn. FRIENDS analysis determines the importance of a gene, which is defined as how much a gene interacts with other genes in a pathway. Therefore, we visualized the importance of mitophagy-related genes through FRIENDS analysis based on GOSemSim packages.28,40 Then, based on the non-negative matrix factorization algorithm in unsupervised clustering (NMF), we divided AF samples into different types according to the results of immunocell infiltration in the AF samples, and drew a boxplot to observe immune cell distribution differences between the samples. At the same time, the Wilcoxon rank sum test was used to verify differences in immunocell infiltration among different immunophenotypes, and the volcano map was drawn to visualize these differences.
AF-Related Molecular Subtype Construction
The unsupervised clustering method was used to divide samples of the AF group into different molecular subtypes according to the expression of DEMRGs using the ConsensusClusterPlus package.41 The ggplot2 package22 was used to perform principal component analysis (PCA) among different types to visualize subtypes. In addition, a heat map was drawn to visualize the expression of AF-related DEMRGs across different types.
Immunological Characteristics of AF Subtypes Based on DEMRGs
At the first, the ssGSEA algorithm was used to calculate and quantify the infiltration of immunocells among different types. The immune cell dataset was taken from Charoentong et al.39 Based on the results of ssGSEA, Spearman correlation coefficient was calculated between immune cell infiltration and DEMRGs, and a correlation heat map was drawn. We visualized immune cell infiltration between DEMRG expression groups using box plots.
In vivo AF Model
A total of 12 male beagles (16–20 kg) were purchased from the Laboratory Animal Center of Xinjiang Medical University and randomly assigned to two groups: SR group (n = 6) and AF group (n = 6). All animals were fasted for 8 h before surgery. Those in the AF group were anesthetized with pentobarbital intravenously, and an atrial pacing electrode was implanted into the atrium, with high-frequency pacing (600 beats/min for 8 weeks) in pacemaker AOO mode to induce AF. Beagles in the SR group were subjected to the same invasive procedure but did not have a pacemaker implanted. The hallmark of successful pacing is that on the ECG, the normal P-waves disappear and are replaced by a series of irregular high-frequency oscillations called F-waves, and the distance between R waves varies irregularly. When AF is maintained for 15 min after pacing is stopped, it indicates that the model has been successfully established. This protocol was approved by the Ethics Committee of the First Affiliated Hospital of Xinjiang Medical University (NO. IACUC201902-k05). Animal care and feeding schedule strictly followed the animal experiment guidelines issued by the First Affiliated Hospital of Xinjiang Medical University.
Cell Culture and Construction of an in vitro Model of AF
The mouse atrial muscle-derived cell line, HL-1, was purchased from Zhejiang Meison Cell Technology Co., Ltd. HL-1 cells were cultured in Dulbecco’s modified eagle’s medium (Hyclone) containing 10% fetal bovine serum (Lonsera, A511-001) and 1% penicillin-streptomycin solution (Biosharp, BL505A, China) in an incubator set at 37 °C and supplied with 5% CO2. When HL-1 cells reached a density of 5×10⁵ cells/mL, they were seeded in six-well plates and randomly divided into two groups (control and pacing). The cells of the control group were cultured without any stimulus for 24 h, while the pacing group underwent 24 h of high-frequency electrical stimulation at 1.5 V and 10 Hz/5 ms.
IF
HL-1 cell samples were subcultured on coverslips in 6-well tissue culture plates, rinsed with PBS once, fixed with 4% paraformaldehyde for 15 min, washed with PBS 3 times (5 min each), treated with 0.1% Triton-X at room temperature for 10 min, and washed with PBS 3 times (5 min each). Samples were blocked with 5% fetal bovine serum at 37 °C for 1 h, then incubated with anti-MAPK1 primary antibody (11257-1-AP, 1:1000, rabbit polyclonal, Proteintech, China), anti-MAPK14 primary antibody (14064-1-AP, 1:1000, rabbit polyclonal, Proteintech, China), anti-VDAC1 primary antibody (55259-1-AP, 1:1000, rabbit polyclonal, Proteintech, China), or anti-MTERF3 primary antibody (23296-1-AP, 1:1000, rabbit polyclonal, Proteintech, China) overnight. The cells were washed three times with PBS for 5 min each the next day and then incubated with a Goat anti-rabbit Cy3 secondary antibody (Proteintech, SA00009-2, China) in the dark for 1 h (37 °C), followed by 3 washes of 5 min each with PBS. Subsequently, samples were incubated with Hoechst (Biyuntian, C1017, China) at room temperature in the dark for 15 min, followed by washing with PBS 3 times, 5 min each. Finally, the cells were observed and photographed under a fluorescence microscope (OLYMPUS, IX7).
WB
Canine atrial muscle tissue and HL-1 cells were lysed using a 1:1 mixture of phosphatase inhibitors (Biyuntian, S1873), PMSF (Aladdin, P105539), and RIPA buffer (Biyuntian, P0013B, China). After centrifugation at 12,000 rpm and 4 °C for 5 min, the supernatant was collected, and the protein concentration was determined using a BCA kit (Biyuntian, P0010, China). The remaining protein supernatant was mixed with 5X protein loading buffer (volume ratio of 4:1), boiled and denatured for 10 min, and separated by SDS-PAGE electrophoresis using 12% resolving gel. Thereafter, the protein was transferred to a 0.45 μm PVDF membrane. TBST containing 5% skimmed milk powder was used to block the membrane at room temperature for 2 h, followed by incubation with anti-MAPK1 primary antibody (11257-1-AP, 1:1000, rabbit polyclonal, Proteintech, China), anti-MAPK14 primary antibody (14064-1-AP, 1:1000, rabbit polyclonal, Proteintech, China), anti-VDAC1 primary antibody (55259-1-AP, 1:1000, rabbit polyclonal, Proteintech, China), or anti-MTERF3 primary antibody (23296-1-AP, 1:1000, rabbit polyclonal, Proteintech, China) overnight at 4 °C; anti-β-actin antibody (66009-1-IG, 1:5000, rabbit polyclonal, Proteintech, China) was used as the loading control. The next day, the PVDF membrane was incubated with the secondary antibody at room temperature for 2 h, whereafter it was fully washed with TBST for 3 times 5 min each. After incubation with ECL substrate (Beijing Pulai Gene Technology Co., Ltd., P1050, China), protein bands were visualized using an all-in-one chemiluminescence instrument (ChemiScope 5300 Pr, China). Eventually, the relative protein expression was analyzed using ImageJ software.
Statistical Analysis
R software was used for all statistical analysis (https://www.r-project.org/,4.0.2 version). For the comparison of two sets of continuous variables, the independent Student’s t-test was used for normally distributed variables and the Mann–Whitney U-test was used for non-normally distributed variables (ie, Wilcoxon rank sum test). Two-sided P values of < 0.05 indicated statistically significant results.
Results
DEMRGs Between SR and AF Groups
In this study, the biological characteristics of AF were mainly explored by performing bioinformatics analysis, and Figure 1 displays a flowchart of the complete analysis. The subjects were divided into the AF and SR groups, the data were standardized, and data distribution was plotted before and after standardization (Figure 2A and B). Fifty-one DEGS in total, comprising 19 upregulated (positive logFC) and 32 downregulated (negative logFC), were obtained. We visualized DEGs using heat maps and volcano maps (Figure 2C and D). Based on the results of the Wilcoxon rank sum test, 37 DEMRGs were identified between the AF and SR groups. Heat maps (Figure 3A) were plotted to visualize expression differences between the two groups. The association was determined between groups and DEMRGs (Figure 3B). Additionally, boxplots (Figure 3C) were drawn to show the difference between the two groups more intuitively. Our results show that the screened DEMRGs could distinguish well between the AF and SR groups.
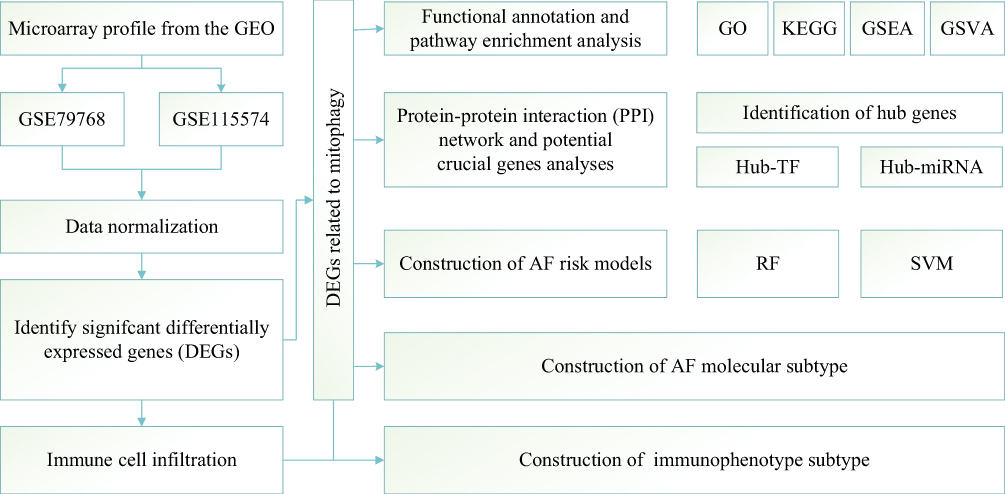 |
Figure 1 Flowchart summarizing overall bioinformatics analyses performed in this study to explore the biological characteristics of AF. Abbreviations: GO, Gene Ontology; KEGG, Kyoto Encyclopedia of Genes and Genomes; GSEA, Gene Set Enrichment Analysis; GSVA, Gene Set Variation Analysis; RF, Random Forests; SVM, Support Vector Machines; AF, Atrial Fibrillation. |
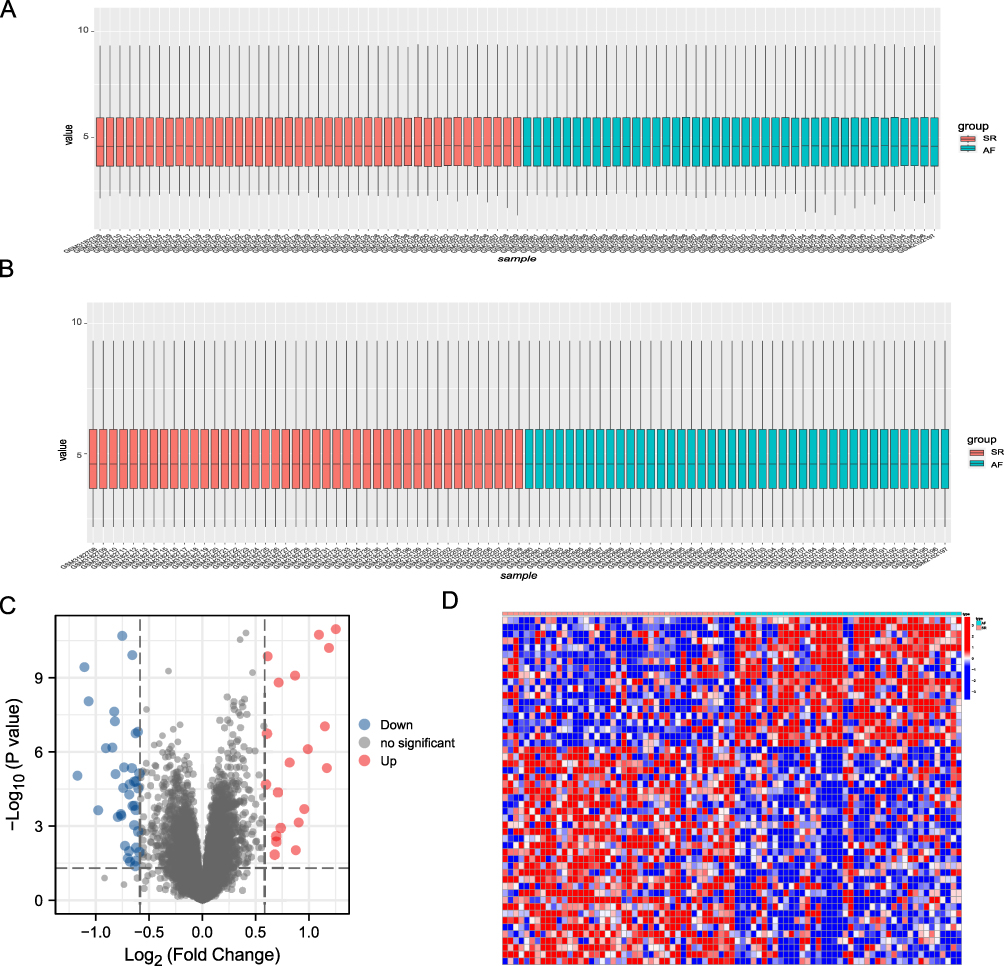 |
Figure 2 Analysis of DEGs in the studied dataset. (A) Distribution of expression profiles between samples before the adjustment of the two datasets. (B) Distribution of expression profiles between samples after the two datasets were combined and corrected. (C) Volcano map based on differential gene analysis, the abscissa shows log 2-fold change, the ordinate shows -log10 (P.adj), the red node represents up-regulated DEGs, the blue node represents down-regulated DEGs, and the black node represents genes with no significant expression difference. Heat map of differentially expressed genes. (D) Heat map showing differential gene expression between the atrial fibrillation (AF) and sinus rhythm (SR) groups. |
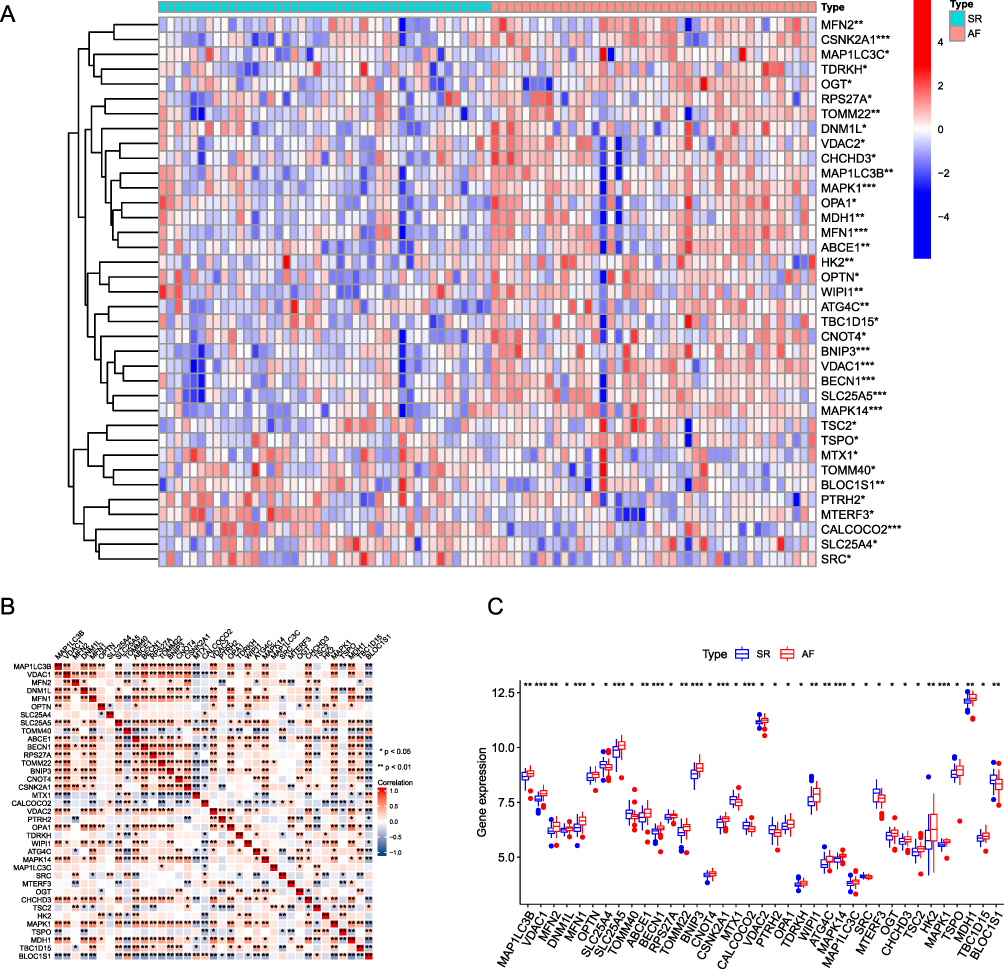 |
Figure 3 Differential expression of mitophagy-related genes between AF and SR groups. (A) Heat map analysis of mitophagy-related differential gene expression in the AF (atrial fibrillation) and SR (sinus rhythm) groups. (B) Correlation analysis between differentially expressed mitophagy-related genes, the upper left corner of each small square indicates the P-value, with a darker color indicating smaller P-value; the lower right corner of the small square indicates the correlation coefficient. (C) Box plot showing differential expression of mitophagy-related genes between the AF and SR groups. (*P ≤ 0.05, **P ≤ 0.01, ***P ≤ 0.001). |
Analysis of Immunoinfiltration in SR and AF
To explore the differences in immunocell infiltration between the SR and AF groups, we quantified the degree of immunocell infiltration using the ssGSEA algorithm and found that activated dendritic cells, immature B cells, myelopoietic suppressor cells (MDSCs), and regulatory T cells exhibited significant differential infiltration between the SR and AF groups (Figure 4A). FRIENDS analysis indicated the importance of DEMRGs (Figure 4B). Subsequently, the correlation between the AF group and immunocell infiltration was explored by plotting a correlation heat map (Figure 4C). Figure 4D–F shows differential infiltration based on different amounts of immune cells in some MRGs in AF.
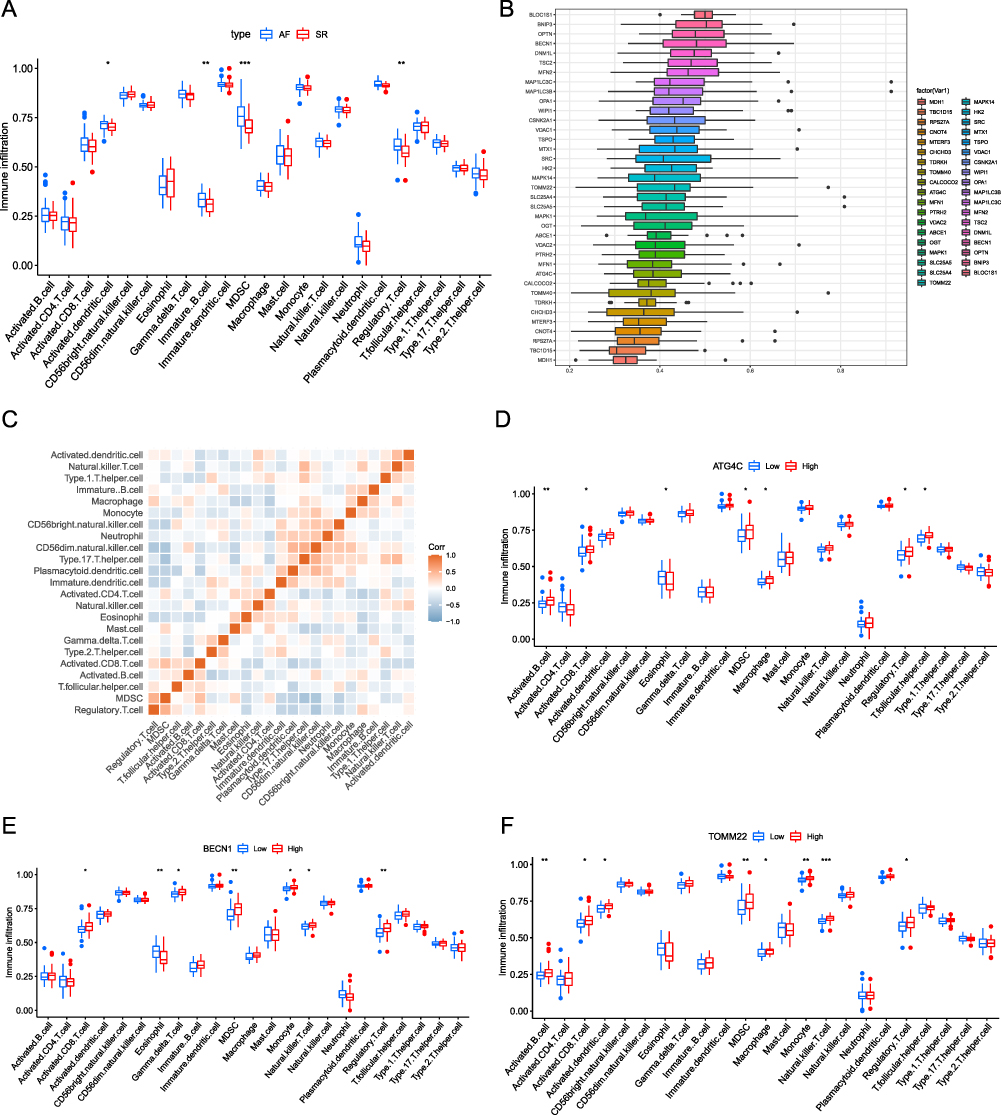 |
Figure 4 Immunoinfiltration analysis in SR and AF. (A) Differences in immunocell infiltration between AF (atrial fibrillation; blue) and SR (sinus rhythm; red) groups. (B) DEMRG FRIENDS analysis boxplot. Each box represents a DEMRG, the middle vertical line represents the median value of its expression, the ends of the line represent the maximum and minimum values, and the black dots represent outliers. (C) Correlation heat map of immunocells in the AF group. Red and blue represent a positive and negative correlation between immune cells, respectively. (D) The association between different expression groupings of ATG4C and immunoinfiltration. Blue and red represents the low and high expression groups of ATG4C, respectively. (E and F) Genes (BECN1, TOMM22) and immune infiltration in the high expression group. Blue and red represents the low and high expression groups, respectively. (*P ≤ 0.05, **P ≤ 0.01, ***P ≤ 0.001). |
Next, the AF component was divided into two immunophenotypes (Figure 5A–C), immunophenotype A and immunophenotype B, using the NMF algorithm. To explore the differential expression of genes between the two immunophenotypes, we set P < 0.05 and 丨logFC丨> 0.585 using the limma package and screened 48 DEGs, of which 17 were downregulated and 31 were upregulated (Figure 5D). We also plotted heat maps to show correlations between genes and immune cells based on differences between immunophenotypes (Figure 5E).
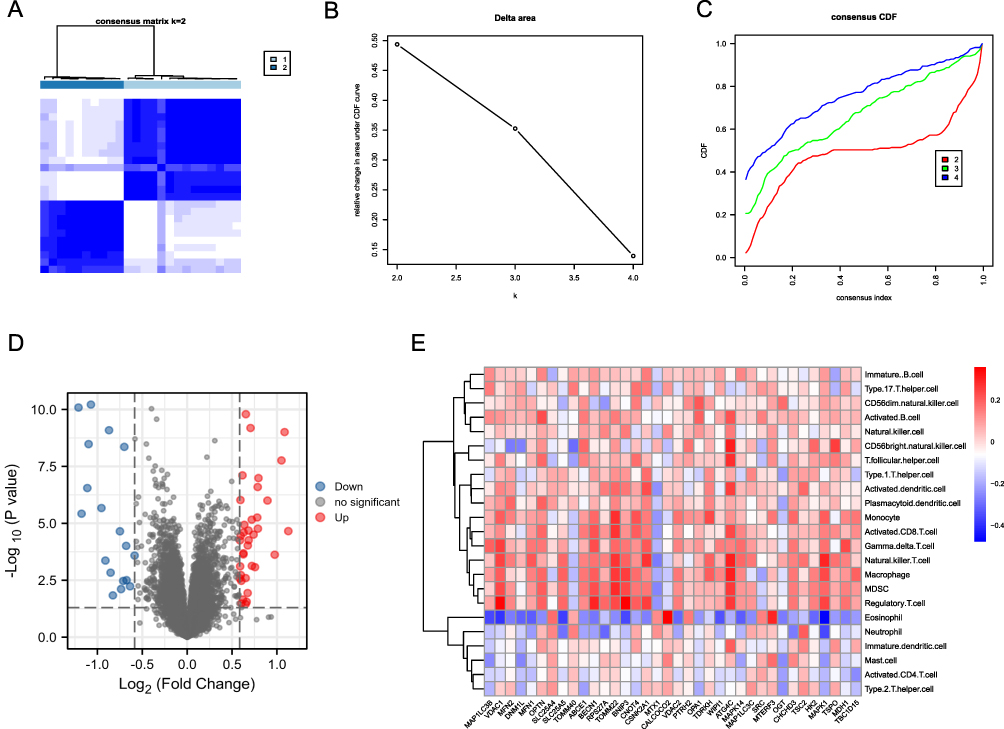 |
Figure 5 Immunophenotyping analysis. (A–C) AF immunophenotyping based on immune cell infiltration. (D) Volcano plot based on differential gene expression analysis between immunotypes, the abscissa shows log 2-fold change, the ordinate shows -log10 (P.adj), the red and blue nodes represent up-regulated and down-regulated DEGs, respectively, and the black node represents genes without significant differential expression. (E) Correlation heat map of immune cells with genes based on differences between immunophenotypes. Red and blue indicate that the gene is positively and negatively correlated with the corresponding infiltrating immune cell type, respectively. |
GO Functional and KEGG Pathway Enrichment Analyses
After screening for mitophagy-related DEGs, we performed GO and KEGG analyses to explore functional differences between the AF and SR groups (Figure 6 and Supplementary Tables S2 and S3). GO analysis indicated an enrichment in autophagy, process utilizing autophagic mechanism, autophagy of mitochondrion, and mitochondrion disassembly, among BP terms (Figure 6A, B and E). Enriched CC terms included mitochondrial outer membrane, organelle outer membrane, outer membrane, and mitochondrial membrane part, among others (Figure 6A, B and F). Enriched MF terms included ubiquitin-protein ligase binding, ubiquitin-like protein ligase binding, wide pore channel activity, and ATP molecular functions such as transmembrane transporter activity (Figure 6A, B and G).
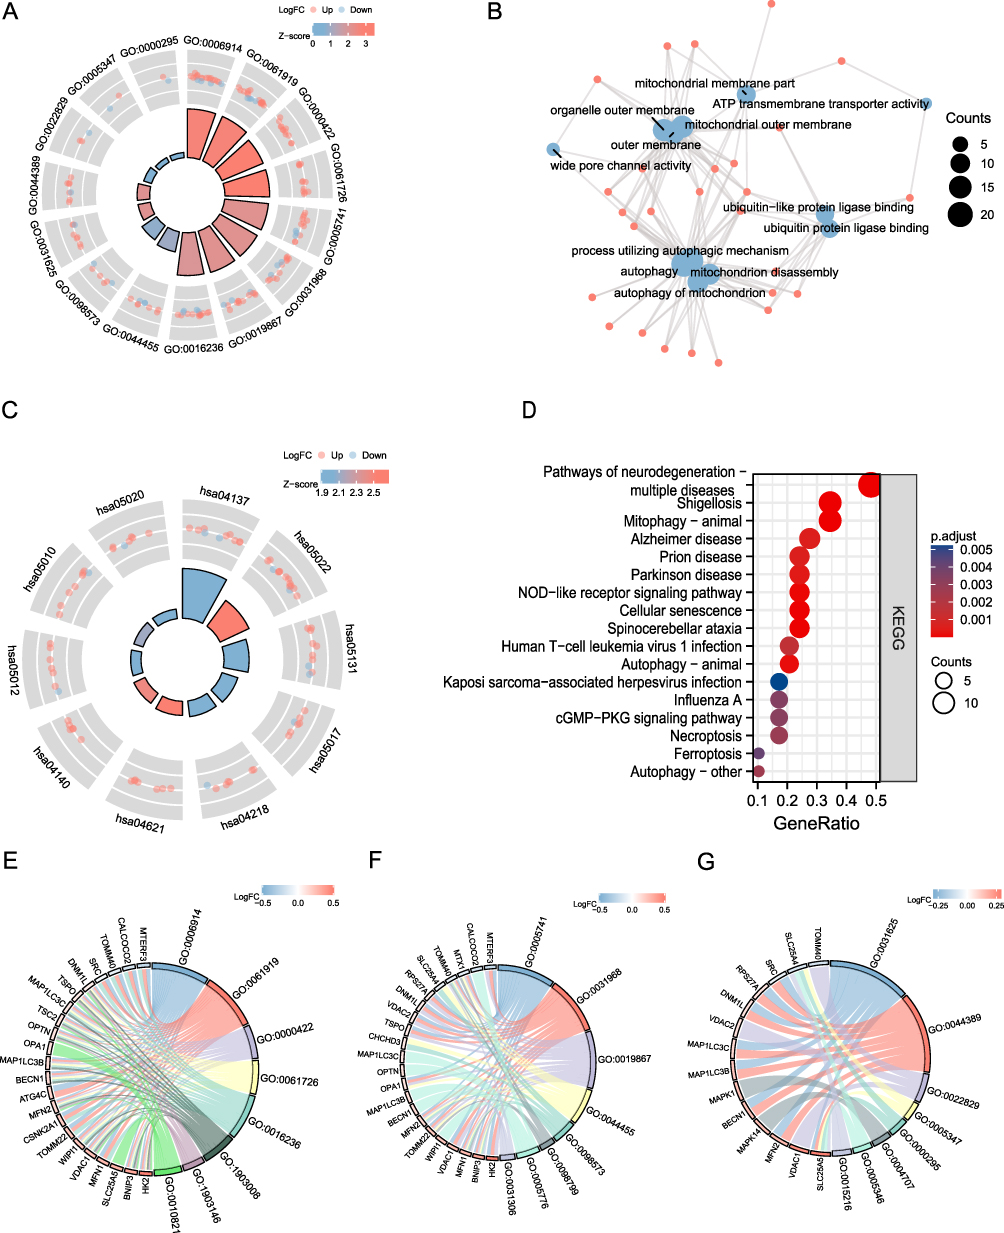 |
Figure 6 GO and KEGG enrichment analysis. (A) AF-related DEMRG GO enrichment analysis circle map visualization; the outer circle contains GO terms, red dots indicate up-regulated genes, blue dots indicate down-regulated genes, quadrilateral colors indicate the z-score of GO terms, blue indicates a negative z-score (these were more likely to be inhibited in the corresponding GO terms), red indicates a positive z-score, and their corresponding GO terms were more likely to be activated. (B) GO enrichment analysis network diagram of AF-related mitophagy genes, blue nodes represent entries, red nodes represent molecules, and wires represent the relationship between entries and molecules. (C) KEGG analysis of mitophagy-related genes in AF. In the quadrilaterals corresponding to differentially expressed genes on the left, blue indicates downregulation, and red indicates upregulation. (D) KEGG pathway enrichment diagram, the abscissa shows the gene proportion, the ordinate shows the pathway name, the node size represents the number of genes enriched in the pathway, and the node color represents P-value. (E–G) BP, CC, MF enrichment chord diagram, node color indicates gene expression level, red shows up-regulated genes, blue shows down-regulated genes. |
Next, KEGG analysis of DEMRGs in AF revealed enriched terms, which included Mitophagy-animal, Necroptosis, Autophagy-animal, NOD-like receptor signaling pathway, and NOD-Autophagy- other biological pathways (Figure 6C and D). We also showed some of the most significant enrichment pathways (Figure 6C and D).
GSEA and GSVA Enrichment Analysis
GSVA analysis results (Figure 7A) illustrated that the DEGs in the SR group were generally downregulated and involved in steroid biosynthesis, basal cell carcinoma, and Hedgehog signaling pathway, among others. Meanwhile, the RIG-I-like receptor signaling pathway, Leishmania infection, Toll-like receptor signaling pathway, Lysosome, and other pathway enrichment genes was upregulated.
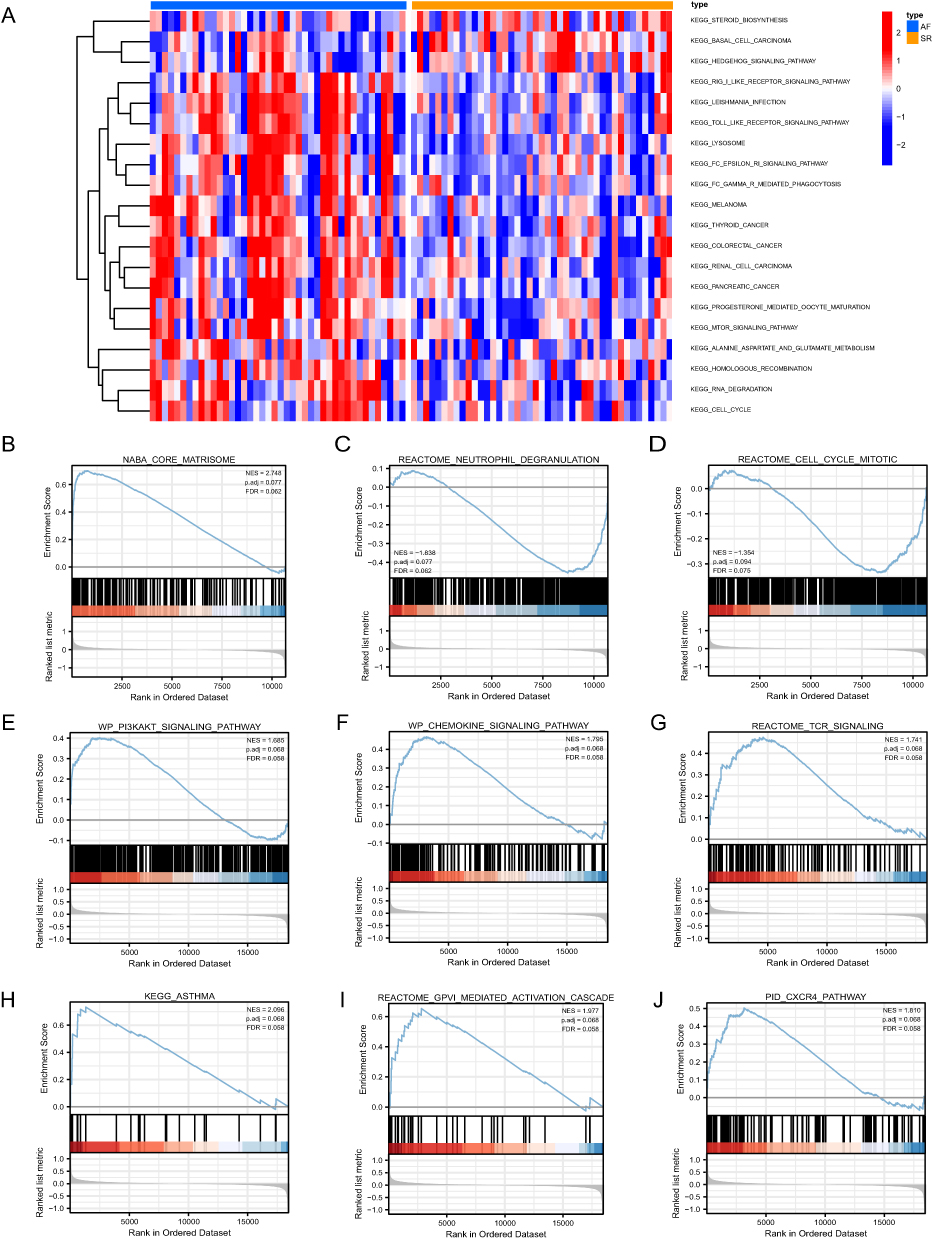 |
Figure 7 GSVA and GSEA results. (A) Heat maps of the main biological functions and pathways obtained via GSVA are displayed. (B–J) GSEA showed that genes upregulated in AF were mainly concentrated in NABA_CORE_MATRISOME (B), REACTOME_NEUTROPHIL_DEGRANULATION (C), REACTOME_CELL_CYCLE_MITOTIC (D), WP_PI3KAKT_SIGNALING_PATHWAY (E), WP_CHEMOKINE_SIGNALING_PATHWAY (F), REACTOME_TCR_SIGNALING (G), KEGG_ASTHMA (H), REACTOME_GPVI_MEDIATED_ACTIVATION_CASCADE (I), PID_CXCR4_PATHWAY (J). Error discovery rate (FDR) < 0.25 and p < 0.05 indicated significant enrichment. |
Furthermore, for the sake of determining the effect of gene expression levels on AF, we analyzed the link between gene expression, the biological processes, and the pathways involved by performing GSEA (Supplementary Table S4). NABA core matrisome, neutrophil degranulation, mitotic cell cycle, PI3K-Akt signaling pathway, chemokine signaling pathway, TCR signaling, biologically relevant functions and signaling pathways such as those involved in asthma, GPVI-mediated activation cascade, and CXCR4 pathway were altered (Figure 7B–J).
PPI, Hub-miRNAs, and TF Network Construction
The PPI network of AF-associated DEMRGs was constructed using the STRING website, and Cytoscape software was used for visualization (Figure 8A). Then, the cytoHubba plugin was used to analyze the top 10 genes in the MCC score selection as core genes, including MFN1, TOMM40, VDAC1, MFN2, and OPTN (Figure 8B). In this study, an mRNA-TF network of mitophagy-related hub genes using the TRRUST database, containing five mRNAs (MAP1LC3B, BNIP3, MFN2, BECN1, and OPTN) and nine TFs (Figure 8C). We then constructed an mRNA-miRNA network of the mitophagy hub gene was constructed using nine mRNAs (DNM1L, TOMM40, VDAC1, TOMM22, MFN2, MFN1, MAP1LC3B, BECN1, and OPTN) and 111 miRNAs (Figure 8D).
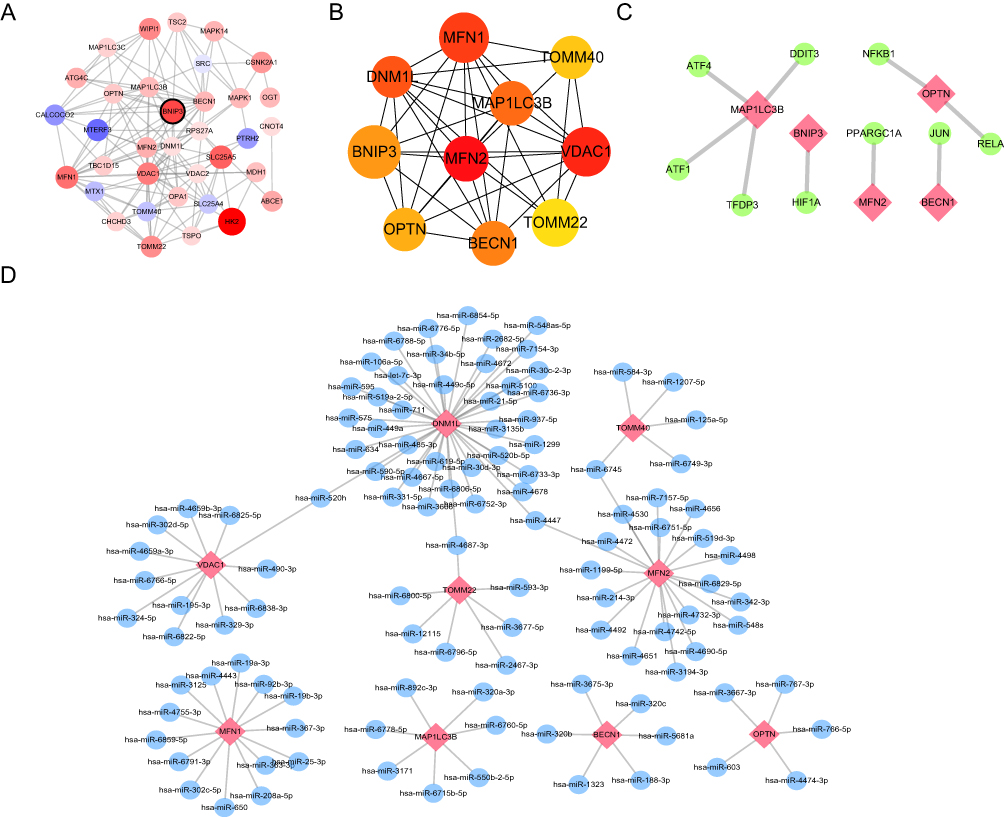 |
Figure 8 Protein-protein interaction network, hub-miRNA network, and hub-TF network based on mitophagy-related genes. (A) The protein-protein interaction of DEMRGs was analyzed using STRING database, and the interaction relationship is shown. The larger the circle, the greater the differential expression; Blue and red indicate down-regulated and up-regulated genes, respectively. (B) The top 15 hub genes were analyzed using the CytoHubba plugin. (C) The network of hub genes and TF transcription factors, where the hub genes are shown in red, and the yellow node indicates the TF (transcription factor). (D) The network of hub genes and miRNAs, where the red node represents the hub gene, and the blue nodes represent corresponding miRNAs. |
Construction of AF Risk Model
Both RF and SVM machine learning algorithms were used to construct an AF model. Figure 9A shows that the risk model constructed using the RF method had smaller residuals, indicating that its consistency was better than that of SVM. At the same time, the ROC curve and AUC showed higher accuracy of the risk model based on the RF method (Figure 9B).
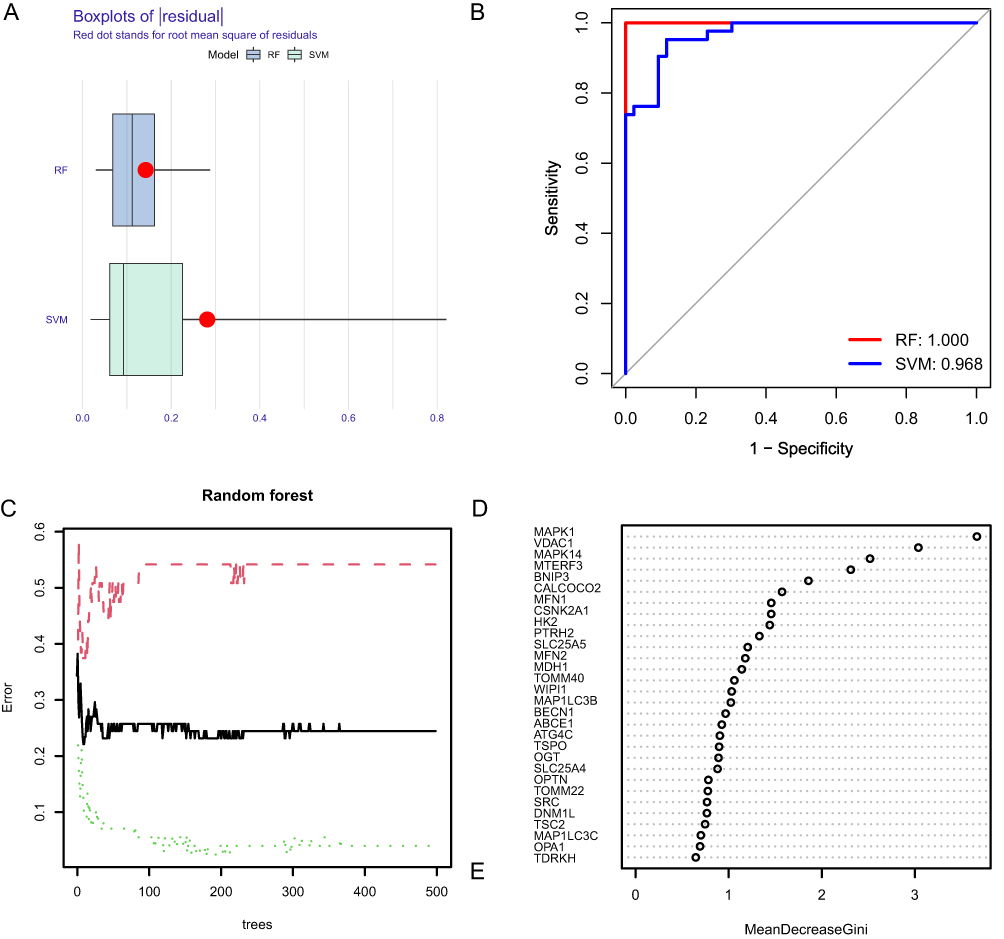 |
Figure 9 Comparison of model construction methods and DEG screening. (A) Histogram of RF (Random Forests) with SVM (Support Vector Machines) residuals, where green represents SVM and blue represents RF, with RF showing smaller residuals. (B) ROC curves and AUC of RF and SVM, where red represents RF and blue represents SVM. The AUC of RF and SVM are 1.00 and 0.968, respectively. (C) A random forest tree where green represents the training set, red represents the test set, and black represents all sample datasets. (D) The GINI index of DEMRGs, where the ordinate shows the gene name, and the abscissa shows the corresponding GINI index. |
Next, we plotted RF trees to determine the number of optimal DEMRGs needed to build a risk model (Figure 9C). Simultaneously, the GINI index was used to calculate the importance of each DEMRG for AF risk (Figure 9D). After determining the number of optimal DEMRGs and calculating their importance, we constructed a risk model for AF by plotting a nomogram to visualize the impact of each DEMRG on AF risk and assessing the AF risk for each sample based on their impact score (Figure 10A). The calibration curve indicated that our model had good consistency (Figure 10B). Decision curve analysis (DCA) showed that the AF risk model constructed based on the screened DEMRGs had significantly better predictive power than the model based on all DEGs, providing evidence that our model identified DEMRGs most associated with AF risk (Figure 10C).
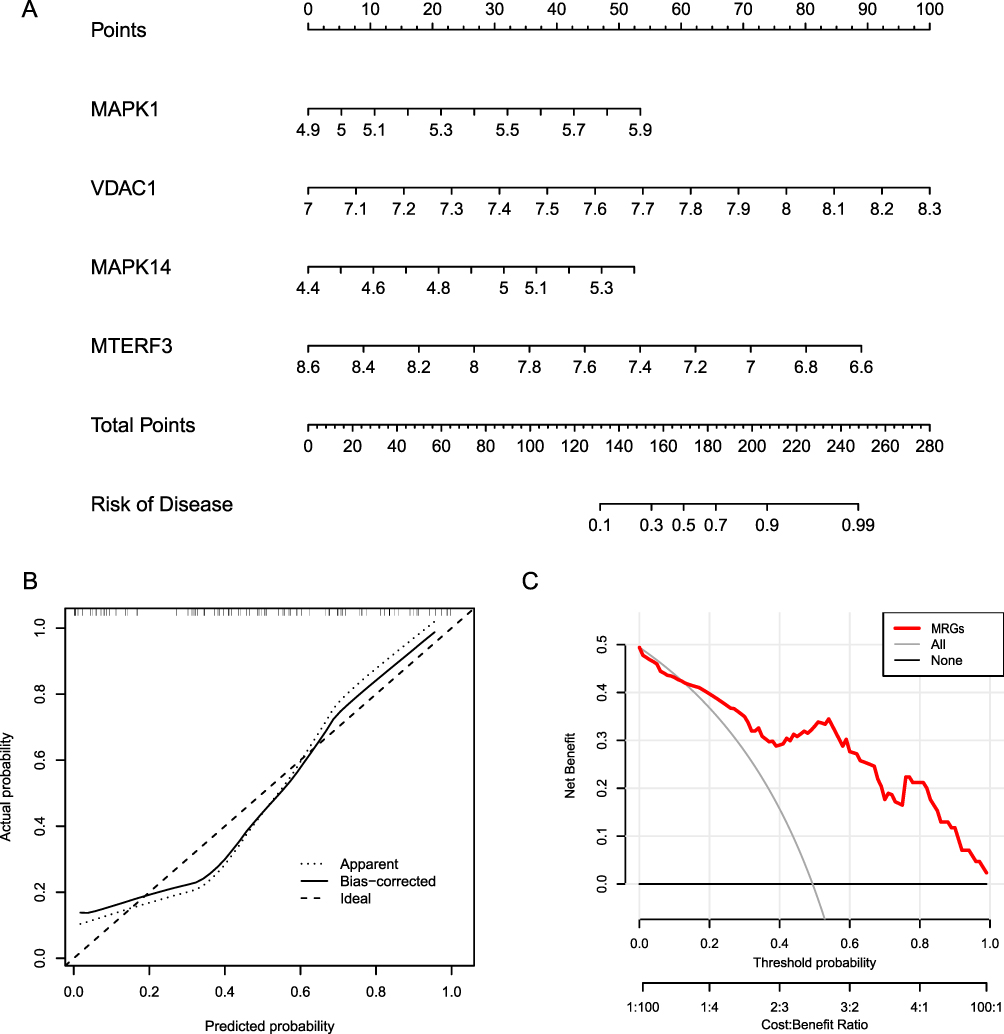 |
Figure 10 Construction of risk model. (A) Risk model nomogram. Each gene expression corresponds to a score, and the final total score corresponds to the AF risk. (B) Model calibration curve. The diagonal line shows the ideal curve, while the floating-point line and the solid line show the model curve before and after correction, respectively. The closer the two fit the diagonal, the better the model discrimination. (C) Clinical decision curve. Red is the decision curve after inclusion in the screening of DEMRGs, gray is the decision curve of all genes, and black is the decision curve without including any genes. After including screened DEMRGs, the model showed higher clinical relevance. |
Determination of AF-Related Molecular Isotypes
To further determine the influence of mitophagy-related genes on AF, unsupervised clustering was used to classify all AF samples into either MRG cluster A or MRG cluster B (Figure 11A–C) based on DEMRG expression. PCA showed that DEMRG expression levels distinguished well between different AF samples (Figure 11D). A boxplot was drawn to visualize the differences in the expression of DEMRGs (Figure 11E). A heat map was also drawn to visualize DEMRG expression between different types (Figure 11F). The heat map showed that genes, such as MAP1LC3B, DNM1L, VDAC2, and BNIP3, were upregulated in MRG cluster A, while TSPO, BLOC1S1, and HK2 were upregulated in cluster B. The boxplot revealed significant differences in DEMRG expression between different MRG clusters.
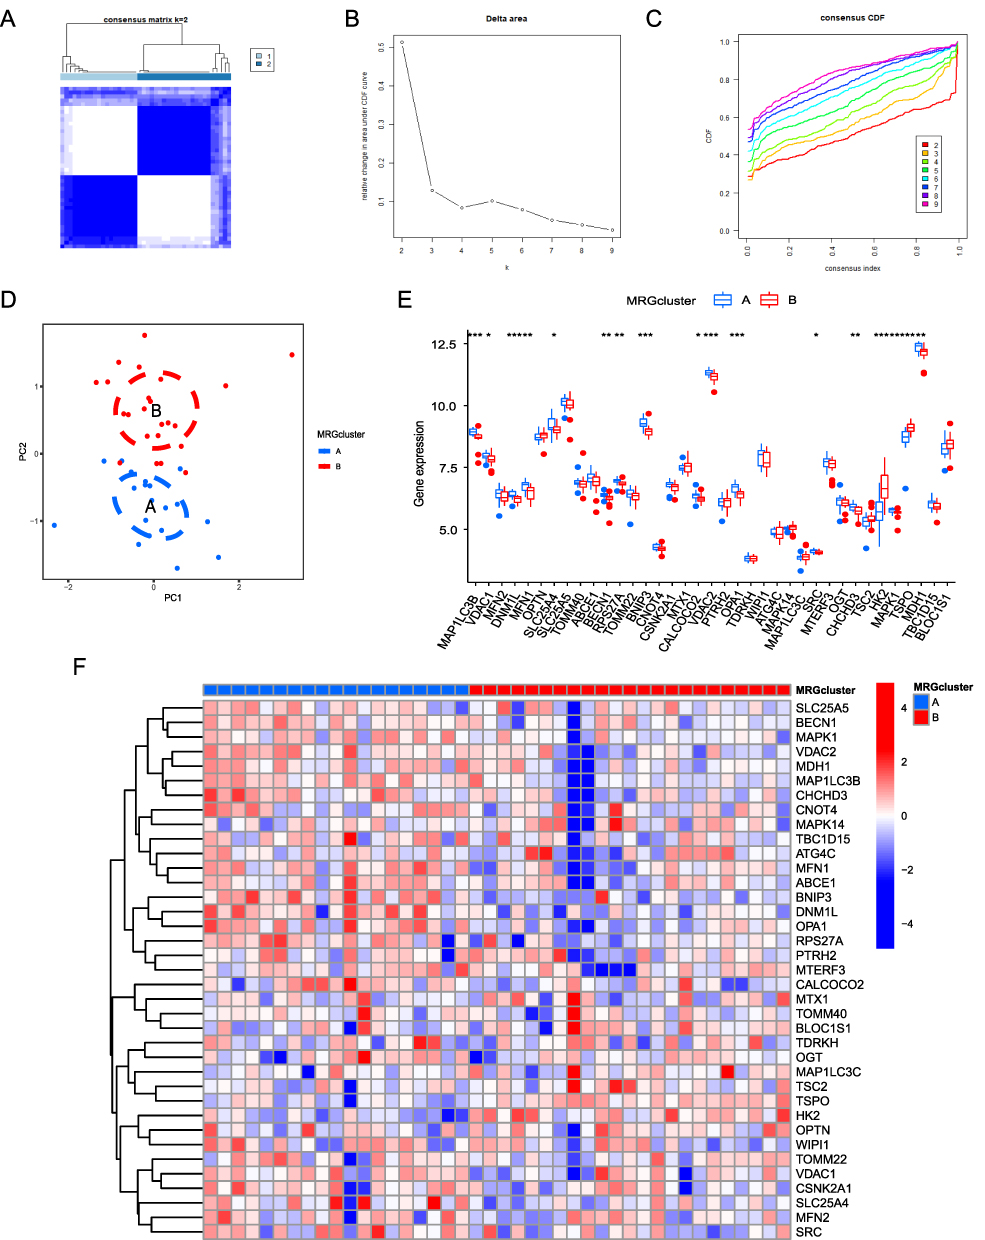 |
Figure 11 Determination of AF-related molecular subtypes. (A–C). Unsupervised clustering analysis of DEMRG expression in AF samples. (D) Principal component analysis among different AF types, where blue and red represent MRG cluster A and MRG cluster B, respectively. (E) Boxplot of differential DEMRG expression between different types, where blue and red represent MRG cluster A and MRG cluster B, respectively. (*P ≤ 0.05, **P ≤ 0.01, ***P ≤ 0.001). (F) Heat map showing DEMRG expression across different types. Blue and red indicate genes downregulated and upregulated in the corresponding sample, respectively. White indicates unchanged expression. |
Immunological Differences Between AF Subtypes
Figure 12A shows the correlation between immunocells and mitophagy-related DEGs in AF. To explore the differences in immunological characteristics between MRG cluster A and MRG cluster B, we used the ssGSEA to determine the differences in immunocell infiltration between different molecular subtypes (Figure 12B). Immunocells such as activated CD8 T cells, activated B cells, CD56dim natural killer cells, mast cells, neutrophil cells, and follicular helper T cells showed significant differential infiltration between the molecular subtypes. To explore the correlation between DEMRG expression and immunocells, we evaluated differential immune cell infiltration in relation to each DEMRG. Figure 12C–G shows the relationship between of BIRC2, CFLAR, KLHDC10, MAPK14, and PANX1 expression with immune cell infiltration.
 |
Figure 12 Differences in immunological characteristics between AF molecular subtypes. (A) Correlation heat map between immune cells and DEMRGs. Red and blue indicates that the gene is positively and negatively correlated with the corresponding infiltrating immune cell type, respectively. (B) Differential immune infiltration between different AF-related subtypes. Blue and red represent MRG cluster A and MRG cluster B, respectively. (C–G) Correlation between genes (OPA1, SLC25A4, SRC, TSPO, OGT) and immune infiltration. Blue and red represent the low and high expression group, respectively. (*P ≤ 0.05, **P ≤ 0.01, ***P ≤ 0.001). |
Validation of DEMRG Expression Using Relevant Models
To verify the expression of four key genes (MAPK1, MAPK14, MTERF3, and VDAC1) in different species, we performed WB and IF in canine atrial muscle tissue and HL-1 cells, respectively (Figure 13). Compared with the control group, MAPK1, MAPK14, and VDAC1 were up-regulated in AF canine atrial muscle tissue (Figure 13A–D), while MTERF3 expression could not be validated, as none of the purchased antibodies were canine-specific. Furthermore, IF (Figure 13F–I) and WB (Figure 13E and J) results indicated that MAPK1, MAPK14, and VDAC1 of HL-1 cells in pacing group was significantly up-regulated compared with control group, while MTERF3 expression was decreased significantly, making the results consistent with those obtained by performing bioinformatics analysis.
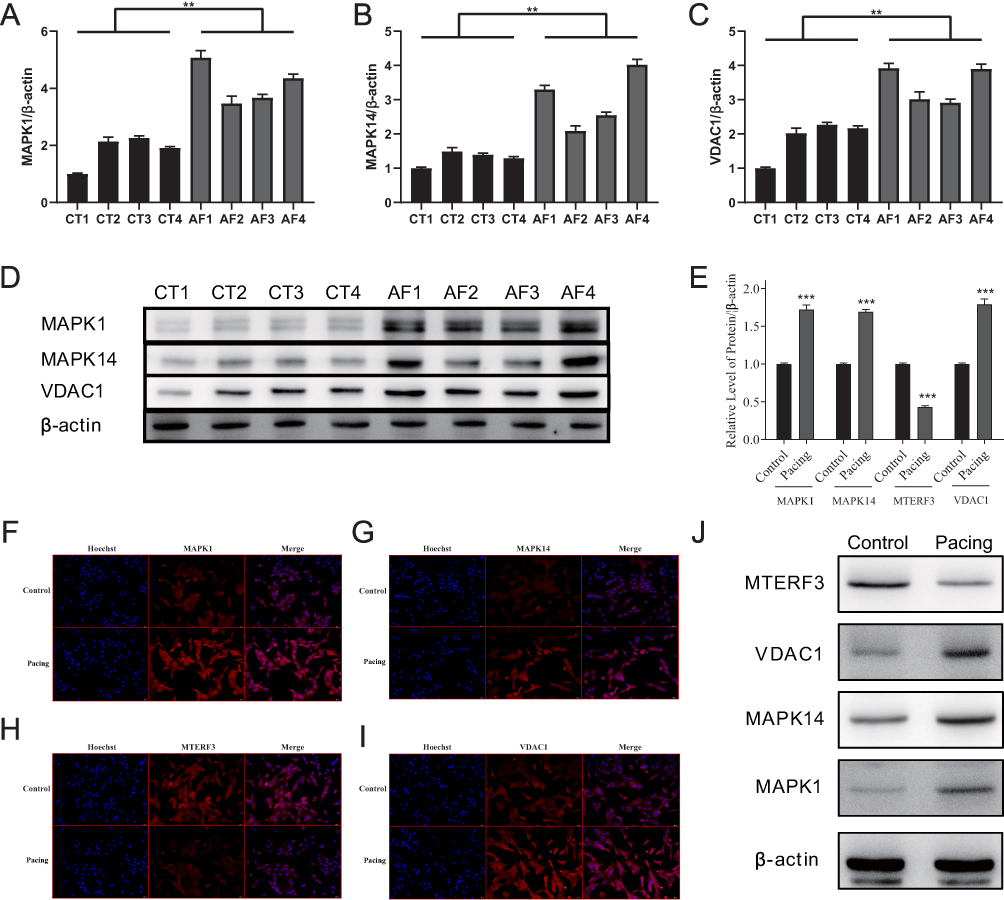 |
Figure 13 Expression of four key DMREGs in the atria of dogs and mouse cells. (A–C) shows the quantification of the results shown in (D), which presents MAPK1, MAPK14, and VDAC1 protein expression in canine atrial muscle tissue. (E) shows the quantification of results shown in (J), which presents MTERF3, VDAC1, MAPK14, and MAPK1 protein expression in the mouse atrial muscle HL-1 cell line. (F-I) presents the results of IF for the four key proteins in HL-1 cell lines. (**P ≤ 0.01, ***P ≤ 0.001). Abbreviations: CT, Control; AF, atrial fibrillation. |
Discussion
AF is the most common arrhythmia, with a high prevalence and various complications. Although experts in the field have continuously optimized the efficacy of AF surgery, some patients still experience postoperative recurrence,42 necessitating the identification of prognostic AF indicators and novel treatment approaches.
Mitophagy has been the hot topic in the field of cancer and neurodegenerative diseases for nearly a decade, and has been proposed as a therapeutic target for non-small cell lung cancer, liver cancer,43 and Parkinson’s disease.44 However, none of the studies have reported the use of mitophagy-related genes as biomarkers or therapeutic targets for AF. The main pathological mechanisms of AF are reentry and ectopically triggered electrical activity. Ca2+ handling-related abnormalities form the underlying molecular basis for focal ectopic activity and atrial electrical remodeling, thereby playing a central role in AF pathophysiology.45 Mitochondria are the main sites of Ca2+ handling and reactive oxygen species production, with impaired mitochondrial function leading to abnormal Ca2+ handling and oxidative stress, both of which are a prerequisite for AF occurrence. In addition, mitochondria can coordinate immunity by regulating the metabolic and physiological states of different immune cell types.46 Therefore, to clarify the roles of mitophagy and immune infiltration in AF, we explored the relationship between the expression of mitophagy-related genes and immunoinfiltration in AF.
Based on the comprehensive analysis of GEO datasets and a mitophagy gene set, we identified 37 DEMRGs in patients with AF. GO, KEGG, GSEA, and GSVA enrichment analysis of DEMRGs revealed that AF-related DEMRGs were closely related to autophagy and immune infiltration and were significantly enriched in Mitophagy-animal, Necroptosis, Autophagy-animal, TCR signaling, CXCR4 pathway, and Toll like receptor signaling pathway. To further explore the interaction networks of DEMRGs, we constructed PPI, mRNA-miRNA, and mRNA-TF interaction networks of hub genes. To determine the potential of DEMRGs for AF risk assessment, we also constructed an AF risk model consisting of four DEMRGs (VDAC1, MTERF3, MAPK1, MAPK14) and verified their expression in dog AF tissue and HL-1 cells. Immune infiltration analysis revealed that immunocells such as activated dendritic cells, immature B cells, MDSCs, and regulatory T cells were differentially abundant between the SR and AF groups. Thus, we used the NMF algorithm to divide AF tissue into two immunophenotypes and explored DEMRG expression between immunophenotypes to identify possible therapeutic targets for AF. Finally, AF was divided into two molecular subtypes according to DEMRG expression, and differences in immunocell infiltration were found between the two groups.
Among the four genes included in the AF risk model, studies have shown that VDAC1, MAPK1, and MAPK14 are significantly correlated with AF. The voltage-dependent anion channel (VDAC) protein is the most abundant protein in the outer mitochondrial membrane, of which VDAC1 is the most common subtype, and is mainly responsible for the bidirectional transport of ions and metabolites in mitochondria.47 VDAC1 is involved in calcium transport between the endoplasmic reticulum and mitochondria, with VDAC1 expression being upregulated in mice susceptible to AF compared with the control group,48 which is consistent with VDAC1 expression in dogs with AF and HL-1 cell-based results. With the development of artificial intelligence, this molecular-based disease prediction model may facilitate clinical translation.49
MAPK1 and MAPK14 are members of the mitogen-activated protein kinase family. MAPK1 is involved in a variety of cellular events, such as proliferation, growth, differentiation, migration, and apoptosis. It acts by activating a phosphorylation cascade through the ERK1/2 signaling pathway.50 MAPK1 has been suggested as a potential biomarker for AF,51 with increased MAPK1 in atrial blasts potentially contributing to AF.52 MAPK14 has four subtypes, namely, α, β, γ, and δ, of which MAPK14α is the most widely distributed and can be activated by a variety of stimulating factors, such as cytokines, hormones, and ligands of G protein-coupled receptors, which play an important role in the immune response and cellular aging.53 Aschar-Sobbi et al showed increased MAPK14 phosphorylation in mouse models of exercise-induced AF, and reported that MAPK14 inhibition prevented atrial remodeling after AF.54 In our study, MAPK1 and MAPK14 levels were significantly increased in canine atrial tissue and pacing HL-1 cells, which is consistent with previous findings.
Mitochondrial transcription termination factor 3 (MTERF3) is an important member of the MTERF family, whose main function is to inhibit mitochondrial DNA transcription initiation55 and act as a regulator of mitochondrial ribosome biogenesis.56 Studies on MTERF3 have focused on diseases associated with mitochondrial dysfunction, such as cancer and Parkinson’s,48,57 but its role in AF has not been reported. MTERF3 knockout mice exhibit an increased sarcoplasmic reticulum Ca2+ load, enhanced myocardial contractility, and showed progressive bradycardia as well as atrioventricular block on end-stage ECG.58 This evidence strongly suggests that MTERF3 might be involved in Ca2+ regulation in cardiomyocytes, and Ca2+ overload may be a key link in triggering AF. Herein, MTERF3 expression in the atrial appendage of patients with AF was lower than that in the control group and was confirmed in HL-1 cells. However, the specific regulatory mechanism of MTERF3 in AF remains to be confirmed in further studies.
Due to the significant enrichment of DEMRGs in immune-related pathways, we reviewed the scientific literature and found substantial evidence that immune dysregulation is not only present in AF, but through the entire process of AF occurrence and development.59 The number of peripheral CD45 cells, atrial CD3 T cells, and dendritic cells is significantly increased in patients with AF compared to in patients with SR,60,61 although the mechanism of immune activation of AF remains unknown. To further explore the role of immunoinfiltration in AF, we used the ssGSEA algorithm to comprehensively analyze the degree of immune cell invasion. We found that activated dendritic cells were significantly more abundant in patients with AF than in controls, consistent with the above findings. Immature B cells, MDSCs, and regulatory T cells were also significantly higher than those in the control group, which has not been reported previously. Furthermore, we divided the AF samples into immunophenotype A and immunophenotype B based on the results of immunocell infiltration in AF samples. HTR2B was significantly and positively correlated with MDSCs, regulatory T cells, and type 1 T helper cells, suggesting that this gene could play an important role in the relationship between AF and immune infiltration.
The elimination of dysfunctional mitochondria is important for immunity regulation, with mitophagy directly regulating mitochondrial antigen presentation and immunocell homeostasis by restricting inflammatory cytokine secretion.62,63 Therefore, we classified patients with AF according to the expression of DEMRGs, used unsupervised clustering to obtain two mitophagy-based clusters (MRG cluster A and MRG cluster B), and then analyzed the differences in immunocell infiltration between them. Activated CD8 T cells, activated B cells, CD56dim natural killer cells, mast cells, neutrophils, and T follicular helper cell exhibited significant differential infiltration between the two types, and the immune cells in AF samples were correlated with DEMRGs, suggesting an interaction between mitophagy and the immune response in AF. However, these findings require further studies to elucidate the specific molecular mechanisms underlying such interaction.
Although this study provides new ideas for elucidating the pathogenesis and potential therapeutic targets of AF, it also had some limitations. First of all, in terms of sample size, the GEO data we included is not enough, power analysis is needed to evaluate and expand the sample size for verification. Second, our study lacks clinical validation. Finally, the relationship between mitophagy and immune infiltration and AF remains to be further verified. Post-HOC analysis and further studies should be designed to overcome these limitations.
Conclusions
We evaluated the roles of mitophagy and immune infiltration in AF. For the first time, an AF risk prediction model was established based on DEMRGs, and the four mitophagy-related genes (VDAC1, MAPK1, MAPK14, and MTERF3) most correlated with AF risk were identified. AF was divided into two subtypes according to DEMRGs, and AF subtypes were found to be closely related to immune characteristics, suggesting that immune infiltration may be involved mitophagy in AF. The information presented herein adds significantly to our understanding of AF molecular pathophysiology, and presents potential molecular targets for AF treatment.
Abbreviations
GO, Gene Ontology; KEGG, Kyoto Encyclopedia of Genes and Genomes; GSEA, Gene Set Enrichment Analysis; GSVA, Gene Set Variation Analysis; RF, random forests; SVM, Support Vector Machines; AF, atrial fibrillation; DEMRGs, differentially expressed mitophagy-related genes; IF, immunofluorescence; WB, Western blot; SR, sinus rhythm; BP, biological process; MF, molecular function; CC, cellular component; PPI, protein-protein interaction; TF, transcription factor; ROC, receiver operating characteristic; AUC, area under curve; ssGSEA, single-sample Gene Set Enrichment Analysis; PCA, principal component analysis.
Acknowledgments
We are grateful to the beagles for their contributions to this study.
Funding
This study was supported by the Natural Science Foundation of Xinjiang Uygur Autonomous Region (2022D01E22).
Disclosure
The authors declare that there are no conflicts of interest.
References
1. Lippi G, Sanchis-Gomar F, Cervellin G. Global epidemiology of atrial fibrillation: an increasing epidemic and public health challenge. Int J Stroke. 2021;16(2):217–221. doi:10.1177/1747493019897870
2. Guzel T, Aktan A, Kilic R, et al. Oral anticoagulant use and long-term follow-up results in patients with non-valvular atrial fibrillation in Turkey AFTER-2 study. Anatol J Cardiol. 2022;26(7):567–576. doi:10.5152/AnatolJCardiol.2022.1597
3. Aktan A, Güzel T, Aslan B, et al. Comparison of the real-life clinical outcomes of warfarin with effective time in therapeutic range and non-vitamin K antagonist oral anticoagulants: insight from the AFTER-2 trial. Kardiol Pol. 2023;81(2):132–140. doi:10.33963/KP.a2022.0287
4. Orhan AL, Çınar T, Hayıroğlu Mİ, et al. Atrial fibrillation as a preoperative risk factor predicts long-term mortality in elderly patients without heart failure and undergoing hip fracture surgery. Rev Assoc Med Bras. 2021;67(11):1633–1638. doi:10.1590/1806-9282.20210686
5. Chung MK, Refaat M, Shen WK, et al. Atrial fibrillation: JACC council perspectives. J Am Coll Cardiol. 2020;75(14):1689–1713.
6. Hu YF, Chen YJ, Lin YJ, Chen SA. Inflammation and the pathogenesis of atrial fibrillation. Nat Rev Cardiol. 2015;12(4):230–243.
7. Jalife J, Kaur K. Atrial remodeling, fibrosis, and atrial fibrillation. Trends Cardiovasc Med. 2015;25(6):475–484.
8. Saylik F, Çınar T, Akbulut T, et al. Comparison of catheter ablation and medical therapy for atrial fibrillation in heart failure patients: a meta-analysis of randomized controlled trials. Heart Lung. 2023;57:69–74. doi:10.1016/j.hrtlng.2022.08.012
9. Wiersma M, Meijering RA, Qi XY, et al. Endoplasmic reticulum stress is associated with autophagy and cardiomyocyte remodeling in experimental and human atrial fibrillation. J Am Heart Assoc. 2017;6(10):e006458.
10. Nunnari J, Suomalainen A. Mitochondria: in sickness and in health. Cell. 2012;148(6):1145–1159.
11. Galluzzi L, Baehrecke EH, Ballabio A, et al. Molecular definitions of autophagy and related processes. EMBO J. 2017;36(13):1811–1836.
12. Zhou H, He L, Xu G, Chen L. Mitophagy in cardiovascular disease. Clin Chim Acta. 2020;507:210–218.
13. He L, Zhou Q, Huang Z, et al. PINK1/Parkin-mediated mitophagy promotes apelin-13-induced vascular smooth muscle cell proliferation by AMPKα and exacerbates atherosclerotic lesions. J Cell Physiol. 2019;234(6):8668–8682. doi:10.1002/jcp.27527
14. Xin T, Lu C. Irisin activates Opa1-induced mitophagy to protect cardiomyocytes against apoptosis following myocardial infarction. Aging. 2020;12(5):4474–4488.
15. Liao C-H, Akazawa H, Tamagawa M, et al. Cardiac mast cells cause atrial fibrillation through PDGF-A–mediated fibrosis in pressure-overloaded mouse hearts. J Clin Invest. 2010;120(1):242–253. doi:10.1172/JCI39942
16. Zhang Y-L, Cao H-J, Han X, et al. Chemokine receptor CXCR-2 initiates atrial fibrillation by triggering monocyte mobilization in mice. Hypertension. 2020;76(2):381–392. doi:10.1161/HYPERTENSIONAHA.120.14698
17. Hohmann C, Pfister R, Mollenhauer M, et al. Inflammatory cell infiltration in left atrial appendageal tissues of patients with atrial fibrillation and sinus rhythm. Sci Rep. 2020;10(1):1685.
18. Parahuleva MS, Kockskämper J, Heger J, et al. Structural, pro-inflammatory and calcium handling remodeling underlies spontaneous onset of paroxysmal atrial fibrillation in JDP2-overexpressing mice. Int J Mol Sci. 2020;21(23):9095. doi:10.3390/ijms21239095
19. Xiao S, Zhou Y, Liu A, et al. Uncovering potential novel biomarkers and immune infiltration characteristics in persistent atrial fibrillation using integrated bioinformatics analysis. Math Biosci Eng. 2021;18(4):4696–4712.
20. Wang Y, Liu Z, Du Y, et al. Comprehensive analysis of pertinent genes and pathways in atrial fibrillation. Comput Math Methods Med. 2021;2021:4530180. doi:10.1155/2021/4530180
21. Yu S-D, Yu J-Y, Guo Y, et al. Bioinformatic analysis for the identification of potential gene interactions and therapeutic targets in atrial fibrillation. Eur Rev Med Pharmacol Sci. 2021;25(5):2281–2290. doi:10.26355/eurrev_202103_25260
22. Davis S, Meltzer PS. GEOquery: a bridge between the Gene Expression Omnibus (GEO) and BioConductor. Bioinformatics. 2007;23(14):1846–1847. doi:10.1093/bioinformatics/btm254
23. Barrett T, Troup DB, Wilhite SE, et al. NCBI GEO: mining tens of millions of expression profiles--database and tools update. Nucleic Acids Res. 2007;35(Database):D760–D765. doi:10.1093/nar/gkl887
24. Tsai F-C, Lin Y-C, Chang S-H, et al. Differential left-to-right atria gene expression ratio in human sinus rhythm and atrial fibrillation: implications for arrhythmogenesis and thrombogenesis. Int J Cardiol. 2016;222:104–112. doi:10.1016/j.ijcard.2016.07.103
25. Cubukcuoglu DG, Durdu S, Doğan Y, et al. Molecular signatures of human chronic atrial fibrillation in primary mitral regurgitation. Cardiovasc Ther. 2021;2021:5516185. doi:10.1155/2021/5516185
26. Ritchie ME, Phipson B, Wu D, et al. limma powers differential expression analyses for RNA-sequencing and microarray studies. Nucleic Acids Res. 2015;43(7):e47. doi:10.1093/nar/gkv007
27. Zhuo Z, Lin H, Liang J, et al. Mitophagy-related gene signature for prediction prognosis, immune scenery, mutation, and chemotherapy response in pancreatic cancer. Front Cell Dev Biol. 2022;9:802528. doi:10.3389/fcell.2021.802528
28. Yu G. Gene ontology semantic similarity analysis using GOSemSim. Methods Mol Biol. 2020;2117:207–215.
29. Kanehisa M, Goto S. KEGG: kyoto encyclopedia of genes and genomes. Nucleic Acids Res. 2000;28(1):27–30. doi:10.1093/nar/28.1.27
30. Yu G, Wang L-G, Han Y, et al. ClusterProfiler: an R package for comparing biological themes among gene clusters. OMICS. 2012;16(5):284–287. doi:10.1089/omi.2011.0118
31. Hanzelmann S, Castelo R, Guinney J. GSVA: gene set variation analysis for microarray and RNA-seq data. BMC Bioinform. 2013;14(1):7. doi:10.1186/1471-2105-14-7
32. Subramanian A, Tamayo P, Mootha VK, et al. Gene set enrichment analysis: a knowledge-based approach for interpreting genome-wide expression profiles. Proc Natl Acad Sci U S A. 2005;102(43):15545–15550. doi:10.1073/pnas.0506580102
33. Liberzon A, Birger C, Thorvaldsdóttir H, et al. The Molecular Signatures Database (MSigDB) hallmark gene set collection. Cell Syst. 2015;1(6):417–425. doi:10.1016/j.cels.2015.12.004
34. Szklarczyk D, Gable AL, Lyon D, et al. STRING v11: protein-protein association networks with increased coverage, supporting functional discovery in genome-wide experimental datasets. Nucleic Acids Res. 2019;47(D1):D607–D613. doi:10.1093/nar/gky1131
35. Chin CH, Chen S-H, Wu -H-H, et al. CytoHubba: identifying hub objects and sub-networks from complex interactome. BMC Syst Biol. 2014;8 Suppl 4:S11. doi:10.1186/1752-0509-8-S4-S11
36. Sticht C, De La Torre C, Parveen A, et al. miRWalk: an online resource for prediction of microRNA binding sites. PLoS One. 2018;13(10):e0206239. doi:10.1371/journal.pone.0206239
37. Han H, Cho J-W, Lee S, et al. TRRUST v2: an expanded reference database of human and mouse transcriptional regulatory interactions. Nucleic Acids Res. 2018;46(D1):D380–D386. doi:10.1093/nar/gkx1013
38. Nahm FS. Receiver operating characteristic curve: overview and practical use for clinicians. Korean J Anesthesiol. 2022;75(1):25–36. doi:10.4097/kja.21209
39. Charoentong P, Finotello F, Angelova M, et al. Pan-cancer immunogenomic analyses reveal genotype-immunophenotype relationships and predictors of response to checkpoint blockade. Cell Rep. 2017;18(1):248–262. doi:10.1016/j.celrep.2016.12.019
40. Yu G, Li F, Qin Y, et al. GOSemSim: an R package for measuring semantic similarity among GO terms and gene products. Bioinformatics. 2010;26(7):976–978. doi:10.1093/bioinformatics/btq064
41. Wilkerson MD, Hayes DN. ConsensusClusterPlus: a class discovery tool with confidence assessments and item tracking. Bioinformatics. 2010;26(12):1572–1573. doi:10.1093/bioinformatics/btq170
42. Andrade JG, Wells GA, Deyell MW, et al. Cryoablation or drug therapy for initial treatment of atrial fibrillation. N Engl J Med. 2021;384(4):305–315. doi:10.1056/NEJMoa2029980
43. Aventaggiato M, Vernucci E, Barreca F, et al. Sirtuins’ control of autophagy and mitophagy in cancer. Pharmacol Ther. 2021;221:107748. doi:10.1016/j.pharmthera.2020.107748
44. Katayama H, Hama H, Nagasawa K, et al. Visualizing and modulating mitophagy for therapeutic studies of neurodegeneration. Cell. 2020;181(5):1176–1187.e16. doi:10.1016/j.cell.2020.04.025
45. Heijman J, Voigt N, Nattel S, et al. Cellular and molecular electrophysiology of atrial fibrillation initiation, maintenance, and progression. Circ Res. 2014;114(9):1483–1499. doi:10.1161/CIRCRESAHA.114.302226
46. Breda C, Davanzo GG, Basso PJ, et al. Mitochondria as central hub of the immune system. Redox Biol. 2019;26:101255. doi:10.1016/j.redox.2019.101255
47. Najbauer EE, Tekwani Movellan K, Giller K, et al. Structure and gating behavior of the human integral membrane protein VDAC1 in a lipid bilayer. J Am Chem Soc. 2022;144(7):2953–2967. doi:10.1021/jacs.1c09848
48. Yuan M, Gong M, He J, et al. IP3R1/GRP75/VDAC1 complex mediates endoplasmic reticulum stress-mitochondrial oxidative stress in diabetic atrial remodeling. Redox Biol. 2022;52:102289. doi:10.1016/j.redox.2022.102289
49. Hayiroglu Mİ, Altay S. The role of artificial intelligence in coronary artery disease and atrial fibrillation. Balk Med J. 2023;40(3):151–152. doi:10.4274/balkanmedj.galenos.2023.06042023
50. Lu N, Malemud CJ. Extracellular signal-regulated kinase: a regulator of cell growth, inflammation, chondrocyte and bone cell receptor-mediated gene expression. Int J Mol Sci. 2019;20(15):3792. doi:10.3390/ijms20153792
51. Zhang P, Miao Q, Wang X, et al. Identification of a novel 4-gene diagnostic model for atrial fibrillation risk based on integrated analysis across independent data sets. Comb Chem High Throughput Screen. 2022;25(2):229–240. doi:10.2174/1386207324666210121103304
52. Goette A, Staack T, Röcken C, et al. Increased expression of extracellular signal-regulated kinase and angiotensin-converting enzyme in human atria during atrial fibrillation. J Am Coll Cardiol. 2000;35(6):1669–1677. doi:10.1016/S0735-1097(00)00611-2
53. Johnson GL, Lapadat R. Mitogen-activated protein kinase pathways mediated by ERK, JNK, and p38 protein kinases. Science. 2002;298(5600):1911–1912. doi:10.1126/science.1072682
54. Aschar-Sobbi R, Izaddoustdar F, Korogyi AS, et al. Increased atrial arrhythmia susceptibility induced by intense endurance exercise in mice requires TNFalpha. Nat Commun. 2015;6(1):6018. doi:10.1038/ncomms7018
55. Park CB, Asin-Cayuela J, Cámara Y, et al. MTERF3 is a negative regulator of mammalian mtDNA transcription. Cell. 2007;130(2):273–285. doi:10.1016/j.cell.2007.05.046
56. Wredenberg A, Lagouge M, Bratic A, et al. MTERF3 regulates mitochondrial ribosome biogenesis in invertebrates and mammals. PLoS Genet. 2013;9(1):e1003178. doi:10.1371/journal.pgen.1003178
57. Zhu S, Xu N, Han Y, et al. MTERF3 contributes to MPP+-induced mitochondrial dysfunction in SH-SY5Y cells. Acta Biochim Biophys Sin. 2022;54(8):1113–1121. doi:10.3724/abbs.2022098
58. Andersson DC, Fauconnier J, Park CB, et al. Enhanced cardiomyocyte Ca 2+ cycling precedes terminal AV-block in mitochondrial cardiomyopathy Mterf3 KO mice. Antioxid Redox Signal. 2011;15(9):2455–2464. doi:10.1089/ars.2011.3915
59. Miyosawa K, Iwata H, Minami-Takano A, et al. Enhanced monocyte migratory activity in the pathogenesis of structural remodeling in atrial fibrillation. PLoS One. 2020;15(10):e0240540. doi:10.1371/journal.pone.0240540
60. Aguiar CM, Gawdat K, Legere S, et al. Fibrosis independent atrial fibrillation in older patients is driven by substrate leukocyte infiltration: diagnostic and prognostic implications to patients undergoing cardiac surgery. J Transl Med. 2019;17(1):413. doi:10.1186/s12967-019-02162-5
61. Smorodinova N, Bláha M, Melenovský V, et al. Analysis of immune cell populations in atrial myocardium of patients with atrial fibrillation or sinus rhythm. PLoS One. 2017;12(2):e0172691. doi:10.1371/journal.pone.0172691
62. Xu Y, Shen J, Ran Z. Emerging views of mitophagy in immunity and autoimmune diseases. Autophagy. 2020;16(1):3–17. doi:10.1080/15548627.2019.1603547
63. Patoli D, Mignotte F, Deckert V, et al. Inhibition of mitophagy drives macrophage activation and antibacterial defense during sepsis. J Clin Invest. 2020;130(11):5858–5874. doi:10.1172/JCI130996
 © 2023 The Author(s). This work is published and licensed by Dove Medical Press Limited. The
full terms of this license are available at https://www.dovepress.com/terms
and incorporate the Creative Commons Attribution
- Non Commercial (unported, 3.0) License.
By accessing the work you hereby accept the Terms. Non-commercial uses of the work are permitted
without any further permission from Dove Medical Press Limited, provided the work is properly
attributed. For permission for commercial use of this work, please see paragraphs 4.2 and 5 of our Terms.
© 2023 The Author(s). This work is published and licensed by Dove Medical Press Limited. The
full terms of this license are available at https://www.dovepress.com/terms
and incorporate the Creative Commons Attribution
- Non Commercial (unported, 3.0) License.
By accessing the work you hereby accept the Terms. Non-commercial uses of the work are permitted
without any further permission from Dove Medical Press Limited, provided the work is properly
attributed. For permission for commercial use of this work, please see paragraphs 4.2 and 5 of our Terms.
Recommended articles
Comprehensive Analysis of Immune Cell Infiltration and M2-Like Macrophage Biomarker Expression Patterns in Atrial Fibrillation
Yang M, Xu X, Zhao XA, Ge YN, Qin J, Wang XY, Dai HL, Jia J, Tao SM
International Journal of General Medicine 2024, 17:3147-3169
Published Date: 17 July 2024
Identification and Experimental Validation of Oxidative Stress-Related Biomarkers in Ulcerative Colitis Using Machine Learning
Duan S, Yi Q, Qiu M, Zhu Z, Zhang Z, Gao Y, Zhang D
Journal of Inflammation Research 2025, 18:11415-11435
Published Date: 20 August 2025