")
Back to Journals » International Journal of General Medicine » Volume 16
Role of Kinetochore Scaffold 1 (KNL1) in Tumorigenesis and Tumor Immune Microenvironment in Pan-Cancer: Bioinformatics Analyses and Validation of Expression
Authors Ding Y, Wang K , Zhao S, Li Y, Qiu W, Zhu C, Wang Y, Dong C, Liu J, Lu Y, Qi W
Received 28 June 2023
Accepted for publication 24 October 2023
Published 31 October 2023 Volume 2023:16 Pages 4883—4906
DOI https://doi.org/10.2147/IJGM.S424245
Checked for plagiarism Yes
Review by Single anonymous peer review
Peer reviewer comments 3
Editor who approved publication: Dr Scott Fraser
Yixin Ding,1,* Kongjia Wang,2,* Shufen Zhao,1 Yu Li,3 Wensheng Qiu,1 Chunyang Zhu,1 Yan Wang,1 Chen Dong,1 Jiani Liu,1 Yangyang Lu,1 Weiwei Qi1
1Department of Oncology, the Affiliated Hospital of Qingdao University, Qingdao, People’s Republic of China; 2Department of Urology, Qingdao Municipal Hospital, Qingdao University, Qingdao, People’s Republic of China; 3Department of Gastrointestinal Surgery, the Affiliated Hospital of Qingdao University, Qingdao, People’s Republic of China
*These authors contributed equally to this work
Correspondence: Weiwei Qi, Email [email protected]
Purpose: Kinetochore scaffold 1 (KNL1), a crucial protein during cell mitosis participating in cell division, was widely expressed in multiple kinds of cancers. However, the expression profile, the effect on cell biological function, tumor immune microenvironment, and predictive value of clinical prognosis in pan-cancer of KNL1 still require a comprehensive inquiry.
Methods: The mRNA and protein expression profile of KNL1 was validated in pan-cancer using different databases. Six algorithms were used to explore the correlation between KNL1 and immune infiltration and the relationship between KNL1 and tumor mutation burden (TMB), microsatellite instability (MSI), and TIDE score were calculated. The diagnostic and clinical prognostic predictive ability of KNL1 was assessed. Differentially expressed genes (DEGs) of KNL1 were screened out and function enrichment analyses were performed in pancreatic adenocarcinoma (PAAD), stomach adenocarcinoma (STAD), and bladder urothelial carcinoma (BLCA). Finally, 8 cases of pancreatic adenocarcinoma tissues and paired adjacent tissues were collected for immunohistochemical (IHC) staining and the histological score (H-score) was calculated. Real-time PCR was performed in gastric cancer and bladder cancer cell lines.
Results: KNL1 was abnormally upregulated in more than half of cancers across different databases. IHC and real-time PCR verified the up-regulated expression in cancer tissues in PAAD, gastric cancer, and BLCA. The satisfactory diagnostic value of KNL1 was indicated in 30 cancers and high KNL1 expression was associated with poorer overall survival (OS) in 12 cancers. The prognostic role of KNL1 as a predictive biomarker of PAAD was clarified. KNL1 played an active part in the cell cycle and cell proliferation. Moreover, KNL1 was likely to mold the Th2-dominant suppressive tumor immune microenvironment and was associated with TMB, MSI, and immune checkpoint-related genes in pan-cancer.
Conclusion: Our study elucidated the anomalous expression of KNL1 and revealed that KNL1 was a promising prognostic biomarker in pan-cancer.
Keywords: KNL1, bioinformatics, pan-cancer, immune infiltration, prognosis, clinical prognostic model
Introduction
Cancer is a diverse group of diseases characterized by aberrant cellular proliferation, which possesses the capacity to infiltrate adjacent tissues or metastasize to distant anatomical sites.1 Cancer is the first or second causes of mortality for people under the age of 70 in more than 100 nations around the world, making it a global health issue that is gaining more and more attention.2 The most deadly cancers, such as lung, colorectal, breast, and stomach tumors, have limited surgical removal options. Cancer sufferers now have new hope thanks to targeted therapy. The effectiveness of targeted medications against already established therapeutic targets (eg, HER-2, EGFR and RAS) differs significantly between various malignancies, indicating that there are variations in the carcinogenesis of various tumors.3–5 Medication therapy is also characterized by a significant financial cost, severe side effects, and medication resistance. Therefore, the solution to this global health issue lies in discovering potent cancer therapeutic targets.
Mutations in genes that are essential for chromosomal segregation during mitosis, such as those responsible for encoding kinetochore components, can cause mistakes in chromosome segregation.6 These errors can result in chromosome instability (CIN), characterized by the erroneous separation of sister chromatids and subsequent occurrence of aneuploidy.7 CIN is present in a variety of cancers and leads to aberrant expression of oncogenes and oncogenes, which may be closely related to tumorigenesis and cancer progression.8,9 Kinetochore scaffold 1 (KNL1 or CASC5) is one of the largest kinetochore components and is widely expressed in normal testis tissue and various tumor cells.10 Previous studies indicated that high expression levels of KNL1 were found to promote tumorigenesis.11–14 However, the effects of abnormal KNL1 expression on cell proliferation and tumorigenesis in pan-cancer require further research, and the clinical prognostic value of KNL1 in pan-cancer remains unknown. In our study, data from multiple databases were collected for bioinformatic analysis to explore the multi-omics expression profile of KNL1 in pan-cancer. Receiver operating characteristic (ROC) curves and K-M analysis were used to evaluate the diagnostic and clinical prognostic predictive ability of KNL1 in pan-cancer. Six types of immune infiltration algorithms were employed to explore the correlation between KNL1 and immune cells. Subsequently, the relationship between KNL1 and tumor mutation burden (TMB), microsatellite instability (MSI), and Tumor Immune Dysfunction and Exclusion (TIDE) scores in pan-cancer was investigated, which may provide new ideas for anti-tumor treatment. Hub genes were screened across the three cancers by protein-to-protein (PPI) network, and functional enrichment analysis was performed to determine the biological function of KNL1 in cancer. Particularly, immunohistochemical (IHC) and real-time PCR were performed to confirm the high expression of KNL1 in cancer tissues in PAAD, gastric cancer, and BLCA. Univariable and multivariable Cox regression analyses revealed that KNL1 could be an independent risk factor for prognosis in PAAD. This study provided comprehensive and deep research on the role of KNL1 and gathered new insights into new pan-cancer biomarkers.
Materials and Methods
Data Procession and Multi-Omics Expression Profile of KNL1
In this study, we investigated the expression of KNL1 in pan-cancer, examining both the mRNA expression level and the protein expression level. The University of Alabama at Birmingham Cancer Data Analysis Portal (UALCAN) (https://ualcan.path.uab.edu/), TIMER (http://timer.cistrome.org/), The Cancer Genome Atlas (TCGA), and the Cancer Cell Line Encyclopedia (CCLE) (https://sites.broadinstitute.org/ccle/) databases encompass mRNA expression data pertaining to genes across various tumour types. UALCAN database is an interactive web resource for available cancer OMICS data including protein-coding data. We analyzed the pan-cancer view of mRNA expression level of KNL1 after log2 transformation in normal tissues and 33 kinds of tumors on the web of UALCAN. The Gene_DE module in the TIMER database was used to investigate the differential expression patterns of KNL1 in cancers and normal tissue by the utilisation of the Wilcoxon test. Unpaired and paired sequencing data of mRNA in pan-cancer and clinical characters were downloaded from TCGA database and expression matrices of normal tissues were downloaded from the Genotype Tissue Expression Project (GTEx) database (https://gtexportal.org/home/). The RNA-seq data in TPM format and Wilcoxon rank sum test were used for comparison analysis after log2 transformation using R (v3.6.3). In addition, CCLE database was used for analyzing the mRNA expression information of KNL1 in 32 cancer cell lines.
In this study, Databases Human Protein Atlas (HPA) database (https://www.proteinatlas.org/) and the Clinical Proteomic Tumor Analysis Consortium (CPTAC) database (https://proteomics.cancer.gov/programs/cptac) were utilised to investigate the protein expression of KNL1 in pan-cancer. HPA database is an open access and license-free database and offers visual representations of protein expression in human tissues following immunohistochemistry (IHC) labelling. CPTAC database is an extensive repository of tumour proteomics data, which aims to comprehensively catalogue proteins originating from cancer genomes that have undergone alterations, as well as the associated biological processes. The online utilisation of the CPTAC database enables the examination of relative expression levels of KNL1 proteins in both tumour and normal tissues.
Genetic Alteration and Promoter Methylation Analyses of KNL1
Copy Number Variations (CNV) are a structural variation phenomenon that is widely present in the genome. Gene alterations data of pan-cancer were obtained from the Pan-cancer analysis of whole genomes (2922 samples, ICGC/TCGA, Nature 2020) in the cBio Cancer Genomics Portal (cBioPortal) database to display the genetic alterations profile of KNL1 and its correlation with mRNA expression.
The promoter methylation level of KNL1 was analyzed using the UALCAN database. The Beta value, a quantitative measure that indicates the degree of DNA methylation, is the ratio of the methylated probe intensity and the sum of methylated and unmethylated probe intensity. The Beta value ranges from 0 (unmethylated) to 1 (fully methylated).15,16
Immune Infiltration and Immune-Related Analyses
We used the “immunedeconv” package to evaluate the immune score and KNL1 expression with six types of immune infiltration algorithms. The TIMER algorithm uses linear least square regression to explore the infiltration level of 6 immune cells.17 xCell algorithm uses the single sample gene set enrichment analysis (ssGSEA) method to explore the infiltration level of 64 immune and non-immune cells.18 MCP-counter algorithm uses the geometric mean of expression of marker genes to explore the infiltration of eight immune cells, fibroblasts, and epithelial cells.19 CIBERSORT algorithm uses nu support vector regression to explore the infiltration of 22 immune cells.20 EPIC algorithm uses constrained least regression method to explore the degree of infiltration of six immune cells, fibroblasts, epithelial cells and unclassified cells.21 quanTIseq algorithm uses constrained least regression method to explore the degree of infiltration of 10 immune cells.
The TIDE score is a computational tool used to evaluate the likelihood of immune evasion in a tumor sample’s gene expression profile. The treatment response of ICI was explored using the TIDE algorithm, ggplot2 (v3.3.3), and ggpubr (v0.4.0) package.
RNA-seq data from TCGA was subjected to Spearman correlation analysis of TMB, MSI, immune checkpoint-related genes, and KNL1 expression using R software (v4.2.2).
Evaluating the Clinical Predictive Value of KNL1 in Pan-Cancer
The RNAseq and clinical data in 33 tumors from TCGA were analyzed, and a correlation analysis was performed on KNL1 expression and clinical factors, including age, gender, stage, histologic grade, and personal history. Cancer and normal tissue data from TCGA and GTEx were processed to evaluate the prognostic predictive ability of KNL1. The pROC package (v1.17.0.1) was used to display the ROC curve and calculate the area under the curve (AUC) of the accumulated survival rate.
To further investigate whether the expression level of KNL1 influences survival outcomes, prognostic analysis was performed. The observing target was overall survival (OS), and a K-M survival analysis was carried out to explore the survival difference between KNL1-low and KNL1-high groups. Furthermore, we performed the survival analysis based on differential expression levels of KNL1 in PAAD subgroups, including gender, age, TNM stage, pathologic or histologic stage, therapy, and personal history.
Screening the DEGs Based on KNL1 Expression Levels
TCGA patients’ data of PAAD, STAD, and BLCA were sorted from low to high KNL1 expression, and the median KNL1 expression value was calculated. The group above the median value was defined as the KNL1-high group, and the reverse was the KNL1-low group. Then, the DEGs were selected using the DESeq2 package (v1.26.0)22 with adjusted p-value <0.05 and |log2 fold-change (FC)|>1.
The STRING database was used to construct the preliminary mutual association network and correlation degree coefficient of protein coding by DEGs. Furthermore, DEGs with high confidence (0.700) were screened in the STRING database. The visualization of the interaction network was performed by Cytoscape software (3.8.2 version). DEGs were assigned and ranked to predict the vital hub genes by the Cytoscape plugin CytoHubba “MCC” in PAAD, STAD, and BLCA.
Functional Enrichment Analysis of KNL1-Related Genes or DEGs
Pearson correlation analysis was performed to screen out the KNL1-related genes for The Gene Ontology (GO) and The Kyoto Encyclopedia of Genes and Genomes (KEGG) analyses in PAAD, STAD, and BLCA. The GO analysis was used to display the location and biological processes of gene products. The KEGG analysis further recapitulated signaling pathways in which the related genes were involved. In addition, functional enrichment analysis was performed using the clusterprofiler package (v3.14.3).
To explore the potential signaling pathways of DEGs, the DEGs were ranked by |Log2FC| for Gene Set Enrichment Analysis (GSEA). The gene set from MSigDB and the clusterprofiler package were used for analysis. False discovery rate (FDR) <0.25 and p. adjust <0.05 were regarded as the criterion of significant enrichment. Molecules that meet the criteria of having a normalized enrichment score (NES) that ranks them among the top values below the criterion of significant enrichment and are associated with the gene set were chosen for the creation of ridge plots.
Constructing the Prognostic Prediction Model in PAAD
In the univariable Cox regression analysis, clinicopathological variables and KNL1 expression levels with a p-value of less than 0.05 were considered to be associated with survival outcomes, which were then admitted into multivariable Cox regression analysis. Furthermore, a prognostic prediction model and the 1-year, 2-year, and 3-year OS nomogram were constructed using the rms package (v6.2–0) and survival package (v3.2–10). The concordance index (C-index) was able to truly reflect the prediction accuracy of the model. Calibration analysis was performed to appraise the predictive ability and imitative effect. Finally, decision curve analysis (DCA) was carried out to characterize the net clinical benefits of the model.
Immunohistochemistry
The proteomics data was obtained from the Human Protein Atlas (HPA) database. Moreover, 8 paraffin-embedded PAAD specimens were collected from the Affiliated Hospital of Qingdao University. All the samples were pathologically diagnosed as pancreatic adenocarcinoma after surgical excision and were subjected to IHC staining. The samples were dried and made transparent using an automatic tissue dehydrator after being treated with formaldehyde solution for 24 hours. The tissue embedding machine received the dehydrated tissues and proceeded to dip and embed them in wax, which were placed in −20°C for one hour. Taken out for serial sectioning (10–15 slices per block, 5μm thick) and air drying. The paraffin sections were first heated to a continuous 72C for 1 hour before being dewaxed using a machine that used xylene for 10 minutes twice, 100% ethanol for 5 minutes, 95% ethanol for 5 minutes, 70% ethanol for 5 minutes, deionized water wash for 5 minutes, and deionized water wash for 2 minutes. Endogenous peroxidase blocker was applied dropwise. Horseradish peroxidase (HRP)-conjugated secondary antibody was added dropwise, and the sections were then incubated for 30 minutes at room temperature after being rinsed and incubated with diluted primary antibody (anti-KNL1, ABclonal, Rabbit pAb 1:100 A13108) overnight at 4°C. At room temperature, the reaction was incubated for 30 minutes. The DAB chromogenic solution was used to observe the colour change using a light microscope.
The Sideview software was used and the area to be analyzed (epithelial part) was manually marked. Then, the QuantCenter2.2 DensitoQuant module was used to adjust the parameters until the stained areas and negative nuclei were fully labeled. The DensitoQuant module parameter setting file was imported into Sideview software and batch analysis was performed to obtain the H-score of all slides. H-score = 1× (counts of weak-positive pixels/counts of total pixels) +2× (counts of moderate-positive pixels/counts of total pixels) + 3× (counts of strong-positive pixels/counts of total pixels).23 Analysis data was exported for further statistical analysis.
Real-Time PCR
Total RNA was extracted from AGS/HGC27 (human gastric cells), GES1 (human normal gastric epithelial cells), T24/5637/J82/UMUC3 (human bladder transitional cell carcinoma cells), and SV-HUC-1 (human normal ureteral epithelial cells) cell lines by using RNA-easy Isolation Reagent (Vazyme #R701). All cell lines were supplied by the cell bank of the Chinese Academy of Sciences. The following are the steps for obtaining total RNA: Add 2–3 mL of RNA easy to cells cultivated in a 10 cm cell culture dish, then mix well and add 2/5 volume of RNase free ddH2O upside down. After 15 minutes of centrifugation at 11,200 rpm, pipette the upper liquid into a 1.5 mL centrifuge tube, add an equal volume of isopropanol, mix upside down, and let aside for 10 minutes. Centrifuge at 11,200 rpm for 10 minutes and discard the supernatant. Add 75% ethanol to suspend the precipitate and invert it several times. Centrifuge at 9100 rpm for 3 minutes and discard the supernatant to obtain RNA. Subsequently, the cDNA of all the cell lines was synthesized using ABScript III RT Master Mix for qPCR with gDNA Remover (ABclonal, RK20429). The reverse transcription process is as follows: 5X ABScript III RT Mix(4 μL), 20X gDNA Remover Mix (1 μL), Total RNA (1000 pg) and Nuclease free H2O (replenished to 20 μ L) Mix well and perform reverse transcription reaction on the PCR machine according to the following reaction procedure: 37 °C (2 min), 55 °C (15 min), and 85 °C (5 min). 2X Universal SYBR Green Fast qPCR Mix (ABclonal, RK21203) was applied to perform real-time PCR. The qPCR reaction system is as follows: 2X Universal SYBR Green Fast qPCR Mix (4 μL), cDNA (2 μL), Forward Primer (0.4 μL), Reverse Primer (0.4 μL) and Nuclease free H2O (replenished to 20 μ L). The qPCR reaction procedure is as follows: pre denature at 95 °C for 3 minutes, cycle 40 times during 5 seconds at 95 °C and 30 seconds at 60 °C to collect fluorescence signals. Each amplification’s gene expression levels were determined using the ΔΔCT technique and adjusted against GAPDH mRNA. All experiments were carried out in triplicate. Real-time PCR primer sequences: KNL1: 5’-CTTCACACCGAGGACTCAAGA-3’ and 5’-TTTGATGTGTAGAAGAGGCACTG-3’
Results
mRNA and Protein of KNL1 Were Over-Expressed in Tissues or Cell Lines of Multiple Cancers
The HPA database revealed that KNL1 was mainly located in the nucleoplasm in A-431, U-251MG, and U2OS human cell lines (Figure 1A-C). Peak KNL1 RNA and protein expression were observed in the G2 phase (Figure 1D and E). The mRNA expression of KNL1 was higher in bladder urothelial carcinoma (BLCA), breast invasive carcinoma (BRCA), cholangiocarcinoma (CHOL), colon adenocarcinoma (COAD), esophageal carcinoma (ESCA), head and neck squamous cell carcinoma (HNSC), liver hepatocellular carcinoma (LIHC), lung adenocarcinoma (LUAD), lung squamous cell carcinoma (LUSC), prostate adenocarcinoma (PRAD), rectum adenocarcinoma (READ), stomach adenocarcinoma (STAD) and uterine corpus endometrial carcinoma (UCEC) tumor than normal tissues, while lower expressed in kidney chromophobe (KICH), kidney renal clear cell carcinoma (KIRC) and kidney renal papillary cell carcinoma (KIRP) tumor than normal tissues in the TIMER databases (Figure 1F). Similarly, the mRNA expression of KNL1 was higher in BLCA, BRCA, cervical squamous cell carcinoma and endocervical adenocarcinoma (CESC), CHOL, COAD, ESCA, glioblastoma multiforme (GBM), HNSC, LIHC, LUAD, LUSC, PRAD, READ, STAD and UCEC tumor than normal tissue in the UALCAN databases (Figure 1J). Higher mRNA expression of KNL1 was shown in ACC, BLCA, BRCA, CESC, COAD, DLBC, ESCA, GBM, HNSC, LIHC, LUAD, LUSC, brain lower grade glioma (LGG), ovarian serous cystadenocarcinoma (OV), pancreatic adenocarcinoma (PAAD), PRAD, READ, skin cutaneous melanoma (SKCM), STAD, thyroid carcinoma (THCA), thymoma (THYM), uterine corpus endometrial carcinoma (UCS) and UCEC, while lower expression was shown in acute myeloid leukemia (LAML), testicular germ cell tumors (TGCT), KIRC and KIRP tumor tissues than para-carcinoma tissues of TCGA unpaired samples (Figure 1H). Higher mRNA expression of KNL1 was shown in BLCA, BRCA, COAD, ESCA, HNSC, LIHC, LUAD, LUSC, PRAD, STAD and UCEC, while lower expression was shown in KIRC and KIRP tumor tissues than para-carcinoma tissues of TCGA paired samples (Figure 1I). Figure 1J displayed the mRNA expression of KNL1 in multiple cancer cell lines according to data from CCLE database. Figure 1 Continued. Figure 1 Continued. Figure 1 High mRNA expression level of KNL1 in pan-cancer. (A–C) KNL1 was mainly located in the nucleoplasm in A-431, U-251MG, and U2OS human cell lines. (D) Protein expression of KNL1 across cell cycle from the HPA database. Protein expression in individual U2Os cells, as determined from the fluorescence intensity of the protein of interest, is plotted along a linear representation of cell cycle pseudotime, as determined from the fluorescence intensities of the cell cycle markers. (E) RNA expression of KNL1 across cell cycle from the HPA database. Single-cell RNA sequencing of U2OS cell lines determines RNA expression levels and cell cycle in single cells. Normalized RNA expression in single cells was plotted along a linear representation of cell cycle pseudotimes based on the fluorescence intensity of cell cycle markers. Expression levels of KNL1 in different types of cancer in the TIMER database (F), UALCAN (G), TCGA unpaired samples (H) and TCGA paired samples (I). (J) The CCLE database showed the mRNA expression of KNL1 in different cancer cell lines. (K) IHC of KNL1 in pan-cancer from the HPA database. The staining intensity of KNL1 was stronger in most tumors except kidney cancer. ns, p≥0.05; *p< 0.05; **p<0.01; ***p<0.001.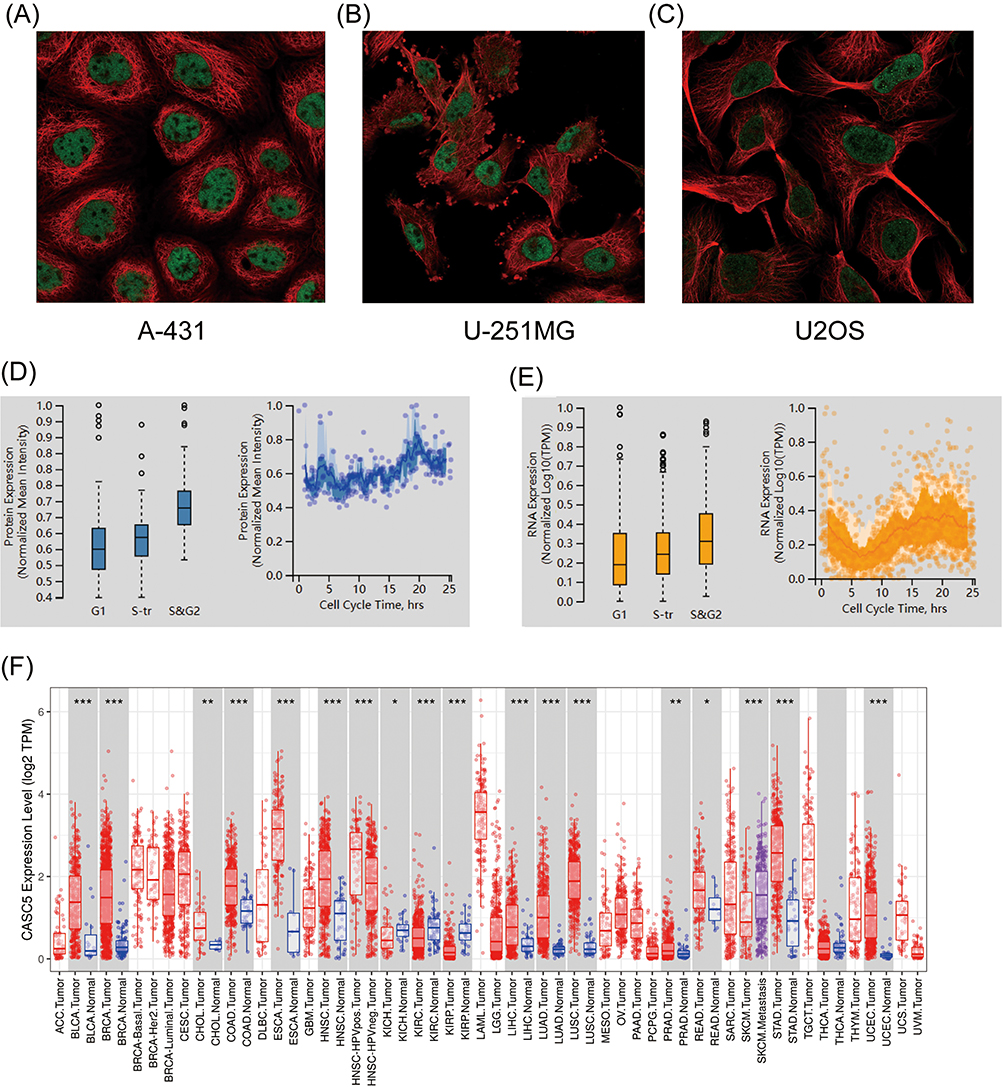

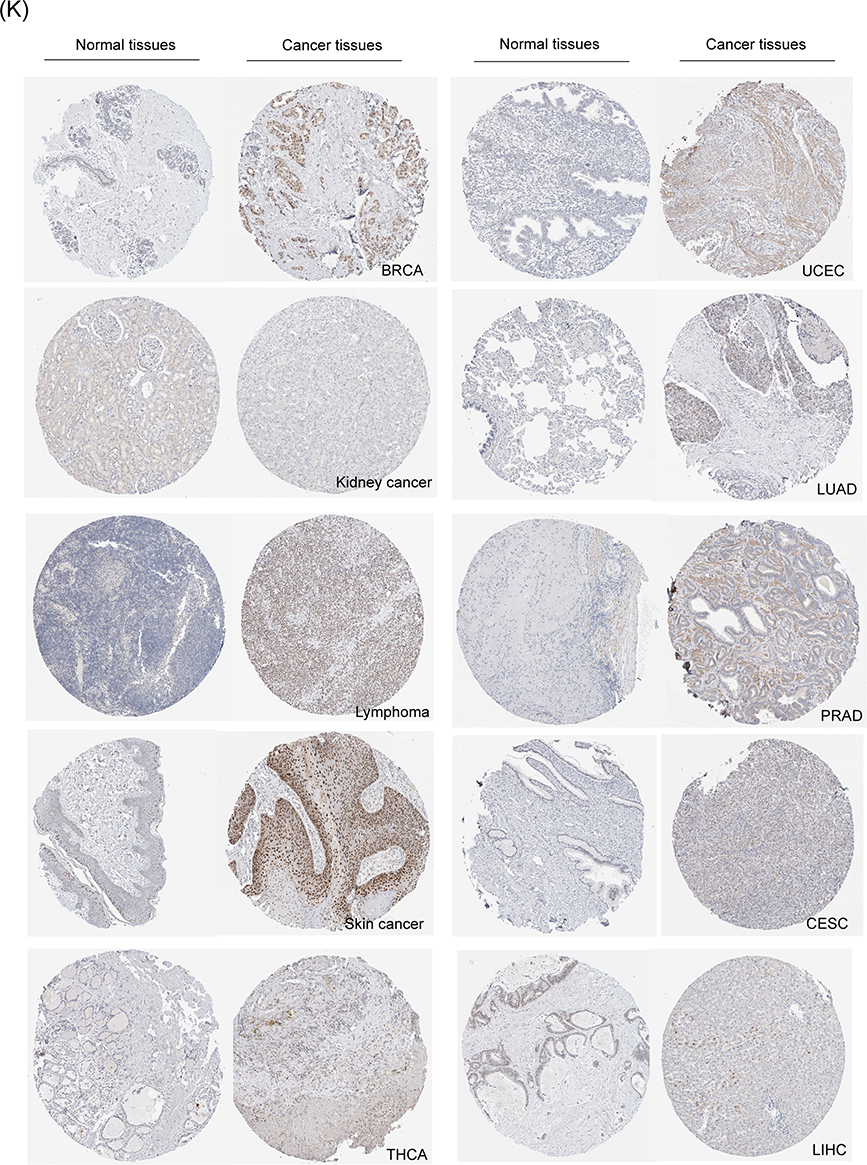
The protein expression of KNL1 was initially verified using the CPTAC database (Supp Figure 1). Given the limited data, the immunohistochemical staining results of KNL1 in different tumors were further verified using the HPA database, suggesting that the staining intensity of KNL1 was stronger in most cancer tissues than in normal tissues (Figure 1K).
Diverse Genetic Alterations and Promoter Hypomethylation Levels of KNL1 in Pan-Cancer
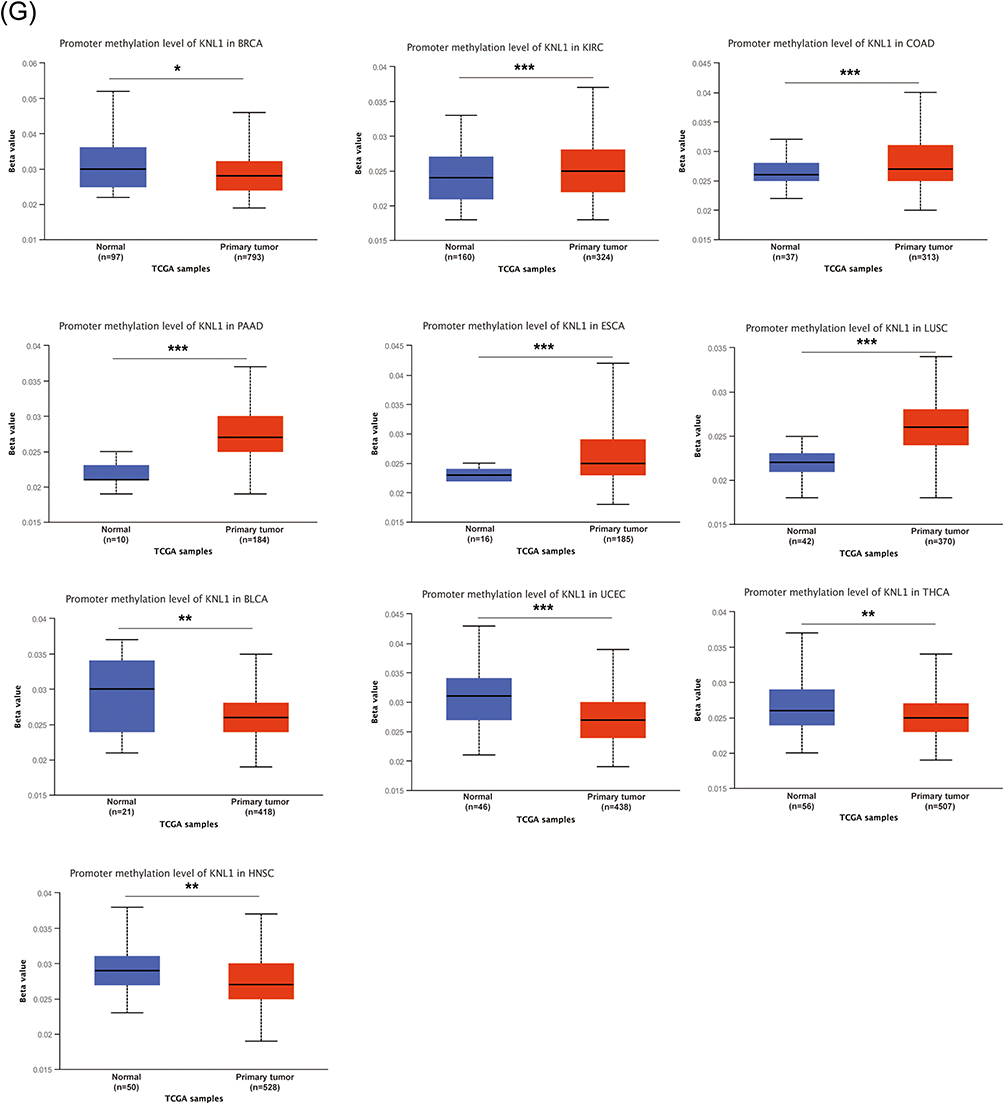
The genetic alterations profile of KNL1 was constructed by cBioPortal. The results showed that 3% of KNL1 was altered in pan-cancer samples. The missense mutation, splice mutation and truncation mutation were of unknown significance but still affected mRNA expression and tumor mutational burden (TMB) along with the amplification and deep deletion (Figure 2B-D). Mutation sites of KNL1 and changes in amino acids are shown in Figure 2F, which indicated 56 variants of uncertain (or unknown) significance (VUS) including 41 missense, 13 truncation and 2 splice of KNL1 were detected between amino acids 0 to 2342 in pan-cancer. The alteration frequency of KNL1 in pan-cancer showed that gene mutation was the most frequent genetic alteration of KNL1. The five cancer types exhibiting the highest prevalence of KNL1 changes were identified as leiomyosarcoma, uterine endometrioid carcinoma, ovarian epithelial tumor, stomach adenocarcinoma and colorectal adenocarcinoma (Figure 2F). Finally, lower level of methylation of the KNL1 promoter was found in 14 types of tumors than normal, while higher level of methylation was observed in 10 types of tumors than normal (Figure 2G). Figure 2 Continued. Figure 2 Gene alteration of KNL1 in pan-cancer. (A) The gene alteration profile of KNL1 in pan-cancer of 2922 samples. (B) The relation between mRNA expression levels and mutations in pan-cancer. (C) The relation between mRNA expression levels and consensus putative gene level copy-number calls in pan-cancer of 1210 samples. (D) The TMB of the KNL1 gene-altered group was higher than the unaltered group in pan-cancer. (E) Mutation sites of KNL1 and changes in amino acids. Different changes are shown on the gene’s domain structure as lollipops. How many changes are found at an amino acid is shown by the height of the lollipop. (F) Frequency of alteration of KNL1 in the detailed cancer types. (G) The promoter methylation level of KNL1 in 10 cancers with a significant statistical difference. The boxplot above represents the beta value for a CpG probe located 1500bp upstream of the gene start site. ns, p≥0.05; *p< 0.05; **p<0.01; ***p<0.001.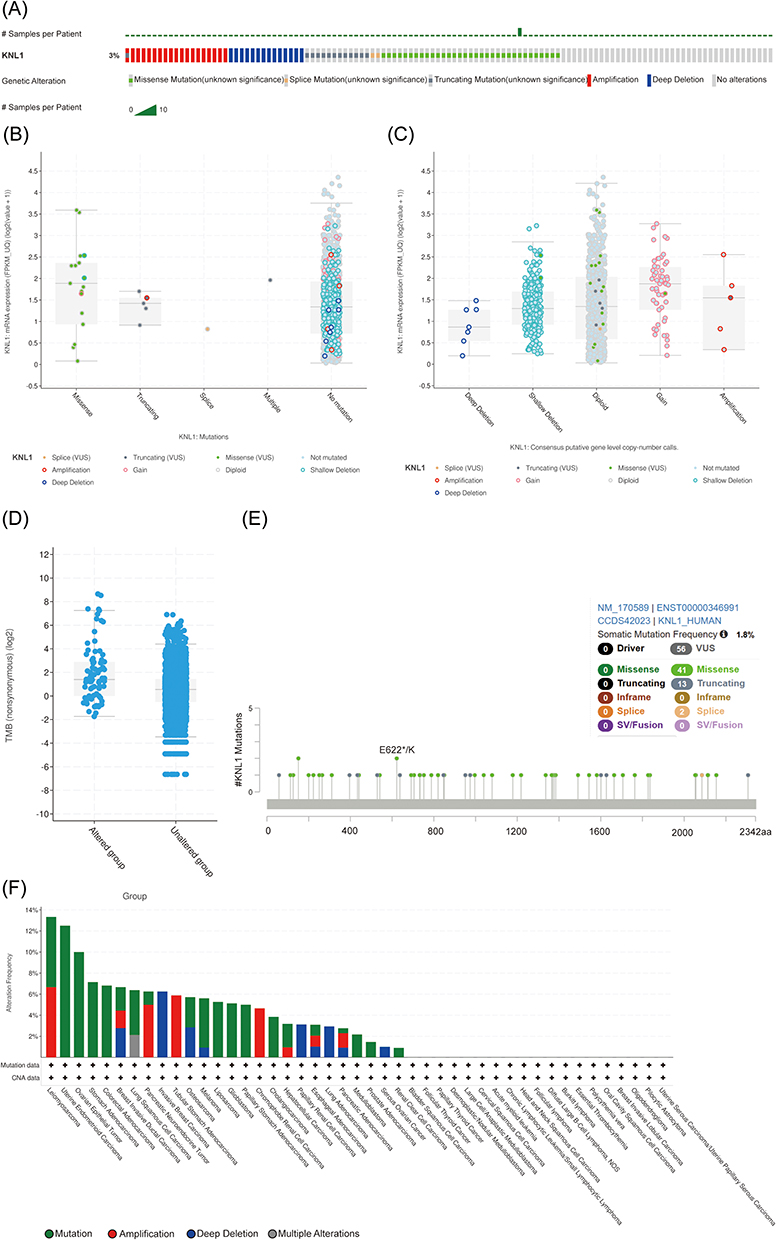
KNL1 Induced a Suppressive Tumor Immune Microenvironment
KNL1 was positively related to Th2 and neutrophils but negatively related to M2 macrophages according to 6 algorithms. The KNL1 gene has been found to exhibit a strong correlation with immune cells in several tumor types, including KIRC, KIRP, LGG, LUAD, LUSC, TGCT, THCA and THYM. A positive correlation between elevated KNL1 expression and increased infiltration of immune cells was found in KIRC, KIRP, PRAD, THCA and THYM, while a negative correlation was found in LUSC, MESO, UCEC and SARC (Figure 3A-C, Supp Figure 2A-C). High KNL1 expression was also associated with high immune scores in KIRC, THYM and TGCT (Figure 3C). Eight major immune checkpoint genes were selected, including SIGLEC15, and were found to be positively related to KNL1 expression in the majority of cancers, especially in THCA, STAD, LGG, KIRP, KIRC, and HNSC. In contrast, a negative correlation was found in LUSC, CESC, and BLCA (Figure 3D). KNL1 expression was significantly positively correlated with MSI in LUSC, OV, SKCM, and UCEC. In addition, KNL1 expression was positively related to TMB in BRCA, COAD, KICH, LGG, LUAD, PRAD, READ, UCEC, and SKCM, while negatively related in THYM (Figure 3E and F). Figure 3 Continued. Figure 3 Continued. Figure 3 Unique tumor immune microenvironment associated with KNL1 in pan-cancer. (A-C) EPIC, quantTIseq, and XCELL algorithms were used to evaluate the correlation between the infiltration of different immune cells and high KNL1 expression. (D) KNL1 expression was positively related mostly to immune checkpoint related-genes. Correlation between KNL1 expression, MSI (E), and TMB (F). (G–J) TIDE scores of LUAD, STAD, THCA, and BRCA showing statistically significant differences in the KNL1-low group and the KNL1-high group. ns, p≥0.05; *p< 0.05; **p<0.01; ***p<0.001.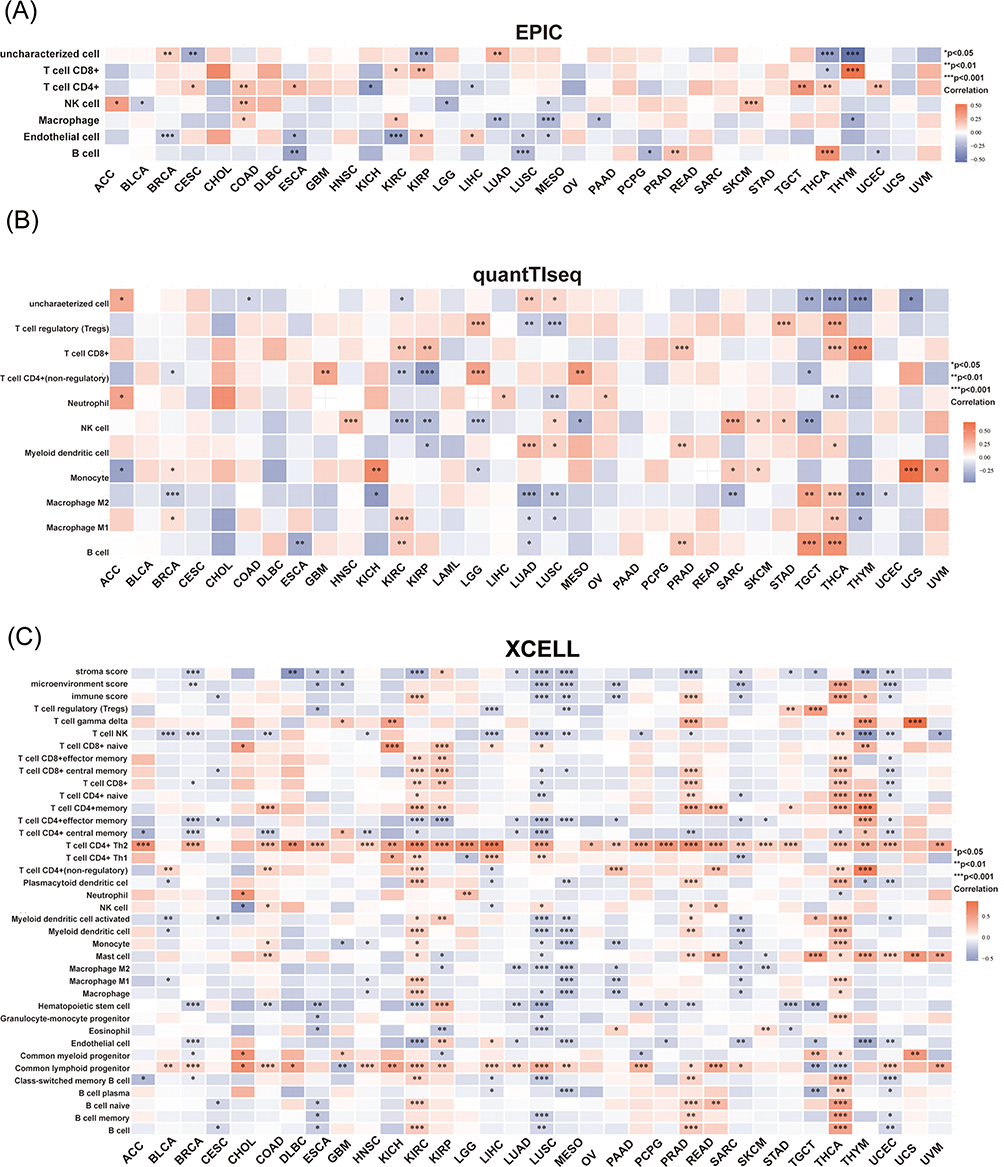


The TIDE score can be used as a proxy biomarker to predict the response to immune checkpoint inhibition. Moreover, genes with higher scores may play a regulatory function in immune evasion and cancer immunotherapy resistance. We evaluated immune response scores between the KNL1-low (G1) and KNL-high (G2) groups in pan-cancer. The KNL1-low group exhibited lower TIDE scores in LUAD and THCA, meaning that lower KNL1 expression levels predicted a better ICI treatment response in these cancers. However, in BRCA and STAD, the KNL1-high group would benefit more from ICI treatment (Figure 3G-J).
Abnormally Upregulated Expression of KNL1 Related to Poor Prognosis
First, the association between KNL1 expression, tumor grade and stage were explored in 30 tumors (Supp Figure 3A-B). The ROC curve indicated that KNL1 had a great prognostic predictive ability for 28 tumors (Figure 4A, Supp Figure 3C). Furthermore, the KNL1-high group exhibited poorer OS than the KNL1-low group in ACC, glioma (GBMLGG), KICH, KIRC, KIRP, LGG, LUAD, mesothelioma (MESO), OSCC, PAAD, PRAD and sarcoma (SARC), while the opposite was observed in esophageal squamous cell carcinoma (ESCC) and THYM (Figure 4B, Supp Figure 4A). It was also found that KNL1-high group was related to better disease-specific survival (DSS) and progression-free interval (PFI) in ESCC (Supp Figure 4B-C)
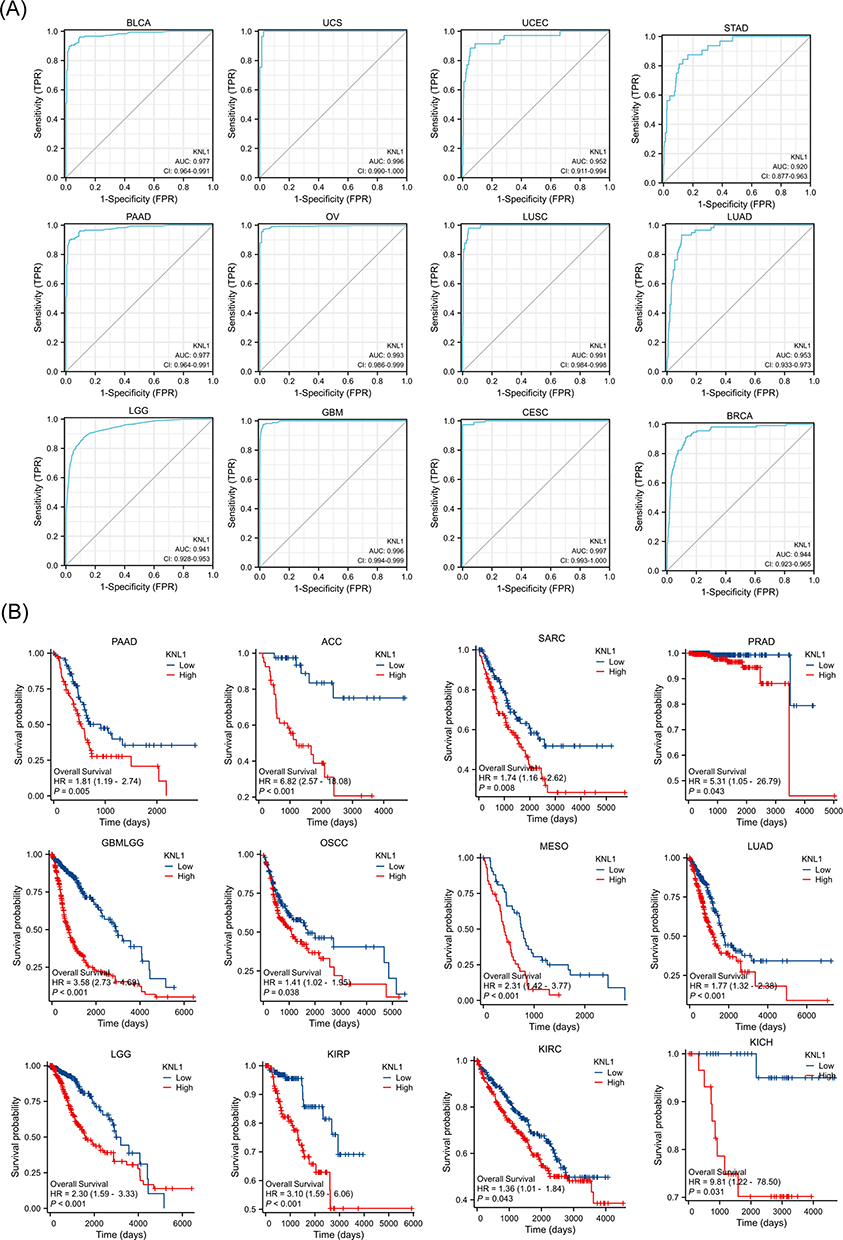 |
Figure 4 Prognostic values of KNL1 expression in pan-cancer. (A) Diagnostic ROC curves were used to predict the diagnostic value of KNL1 in pan-cancer. (B) Survival difference of OS between KNL1-low and KNL1-high in pan-cancer. |
Screening for DEGs and Constructing the PPI Network for PAAD, STAD, and BLCA
According to the thresholds mentioned above, 1242 protein-coding DEGs were obtained in PAAD, including 280 up-regulated and 962 down-regulated DEGs. There were 280 up-regulated and 1444 down-regulated DEGs in STAD, and 714 up-regulated and 436 down-regulated DEGs in BLCA (Figure 5A-C).
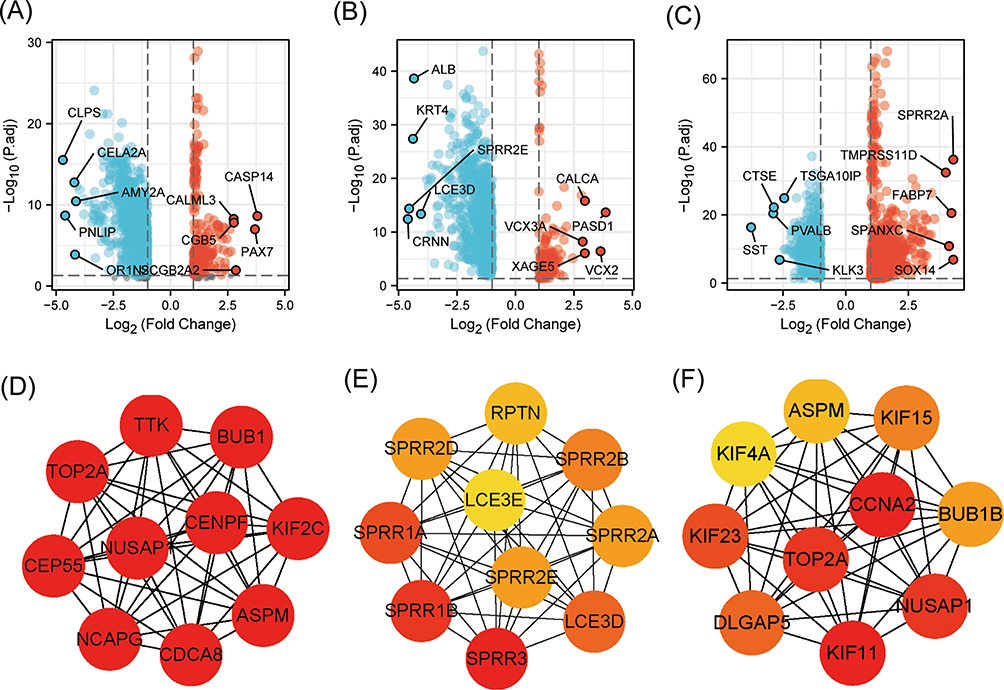 |
Figure 5 KNL1 and related DEGs in PAAD, STAD, and BLCA. Volcano Plot of DEGs between the KNL1-low group and the KNL1-high group in PAAD (A), STAD (B), and BLCA (C). The interaction network of the 10 hub genes most associated with KNL1 in PAAD (D), STAD (E), and BLCA (F). |
A PPI network was constructed using STRING database and Cytoscape to investigate the interaction of protein-coding DEGs in PAAD, STAD, and BLCA. Subsequently, the Cytoscape plugin cytoHubba was used to select the top 10 nodes, as well as the hub DEGs in the three tumors. Furthermore, NCAPG, TTK, NUSAP1, CDCA8, KIF2C, CENPF, TOP2A, ASPM, CEP55, and BUB1 were confirmed as the hub genes in PAAD (Figure 5D). SPRR3, SPRR1B, SPRR1A, LCE3D, SPRR2B, SPRR2E, SPRR2D, SPRR2A, RPTN, and LCE3E were confirmed as the hub genes in STAD (Figure 5E). KIF11, CCNA2, NUSAP1, TOP2A, KIF23, DLGAP5, KIF15, BUB1B, ASPN and KIF4A were the hub genes in BLCA (Figure 5F).
KNL1, DEGs and Related Genes Were Involved in the Cell Proliferation Process
The cellular functional pathways in which KNL1 is involved in PAAD, STAD, and BLCA were investigated. The top 50 KNL1-related genes were included for visualization (Supp Figure 5A). We found that the pathways enriched were highly similar among the three tumors. Enrichment analysis of the GO database indicated the activated biological function of related genes in organelle fission, nuclear division, and chromosome segregation. In molecular functions (MF), they regulated the activity of enzymes involved in DNA replication and energy metabolism; in cellular compositions (CC), they were related to the chromosomal region, spindle, and condensed chromosome. KEGG pathway analysis indicated that the related KNL1-related genes were mainly participated in the signaling pathways of cell proliferation, such as the cell cycle, oocyte meiosis, homologous recombination, and DNA replication pathway (Figure 6A-C). Additionally, GSEA analysis indicated the difference of enriched pathways between KNL1-high and KNL1-low groups. When the NES is positive, there is an enrichment of genes associated with high gene concentration in the KNL1-high group. Conversely, when the NES is negative, there is an enrichment of genes associated with low gene concentration in the KNL1-low group. The results indicated that the KNL1-high group was enriched in the TNF-α/Nf-κB, P53, mTORC1, epithelial mesenchymal transition (EMT) and KRAS activation-related pathways (Figure 6D and E, Supp Figure 6A-C).
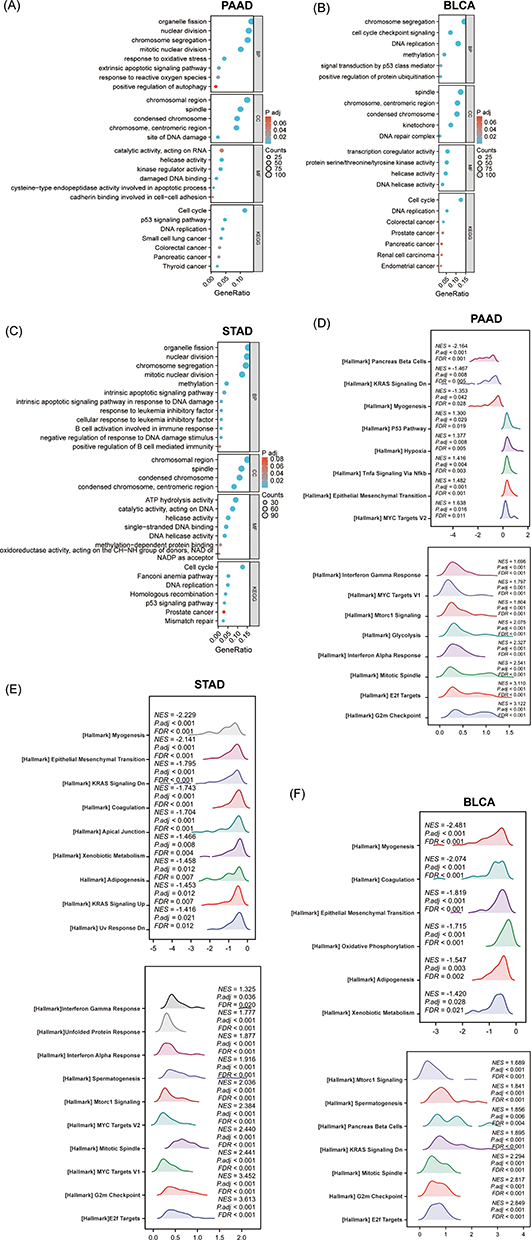 |
Figure 6 The function enrichment analysis of related DEGs of KNL1 in PAAD, STAD, and BLCA. GO and KEGG enrichment analysis of related DEGs of KNL1 in biological functions (BP), cellular components (CC), molecular functions (MF), and signal pathways in PAAD (A), BLCA (B), and STAD (C). (G-I) Ridge plots of the most significantly enriched pathways between KNL1-low and KNL1-high using GSEA analysis in PAAD (D), STAD (E), and BLCA (F). The Y-axis is the name of the gene set, and the X-axis is the distribution of the values of the genes of core_enrichment in the corresponding gene set. GeneRatio: Ratio of the number of genes enriched in the pathway to the number of KNL1-related genes; Counts: Number of genes included in the pathway. Abbreviations: NES, Normalized enrichment score; FDR, false discovery rate; P adj, Adjusted P value. |
KNL1 Served as an Independent Risk Factor of PAAD
Survival analysis of different clinicopathological subgroups in PAAD indicated that high expression of KNL1 was associated with unsatisfactory survival outcomes (OS, DSS, or PFI) based on race, radiation therapy, chronic pancreatitis history, smoking, and alcohol history (Figure 7A, Supp Figure 7A-B). The expression levels of KNL1 based on clinicopathological characteristics were strongly associated with PAAD outcomes. The results revealed higher KNL1 expression in the T3&T4 stage, stage II/III/IV, G3&G4, and in patients with chronic pancreatitis history. Moreover, patients that passed away showed higher KNL1 expression (Figure 7B). Figure 7 Continued. Figure 7 Prognostic values of KNL1 and prognostic nomogram model in PAAD. (A) Survival difference of OS between KNL1-low and KNL1-high in PAAD. (B) The expression difference of KNL1 in different clinicopathological subgroups. (C and D) Forest map based on univariate and multivariate Cox analyses for overall survival. (E) A nomogram for predicting 1-, 2-, and 3-year OS survival of PAAD. (F) The calibration curve for the 1-, 2-, and 3-year OS survival nomogram. (G) The DCA curve for the prognostic model. ns, p≥0.05; *p< 0.05; **p<0.01; ***p<0.001.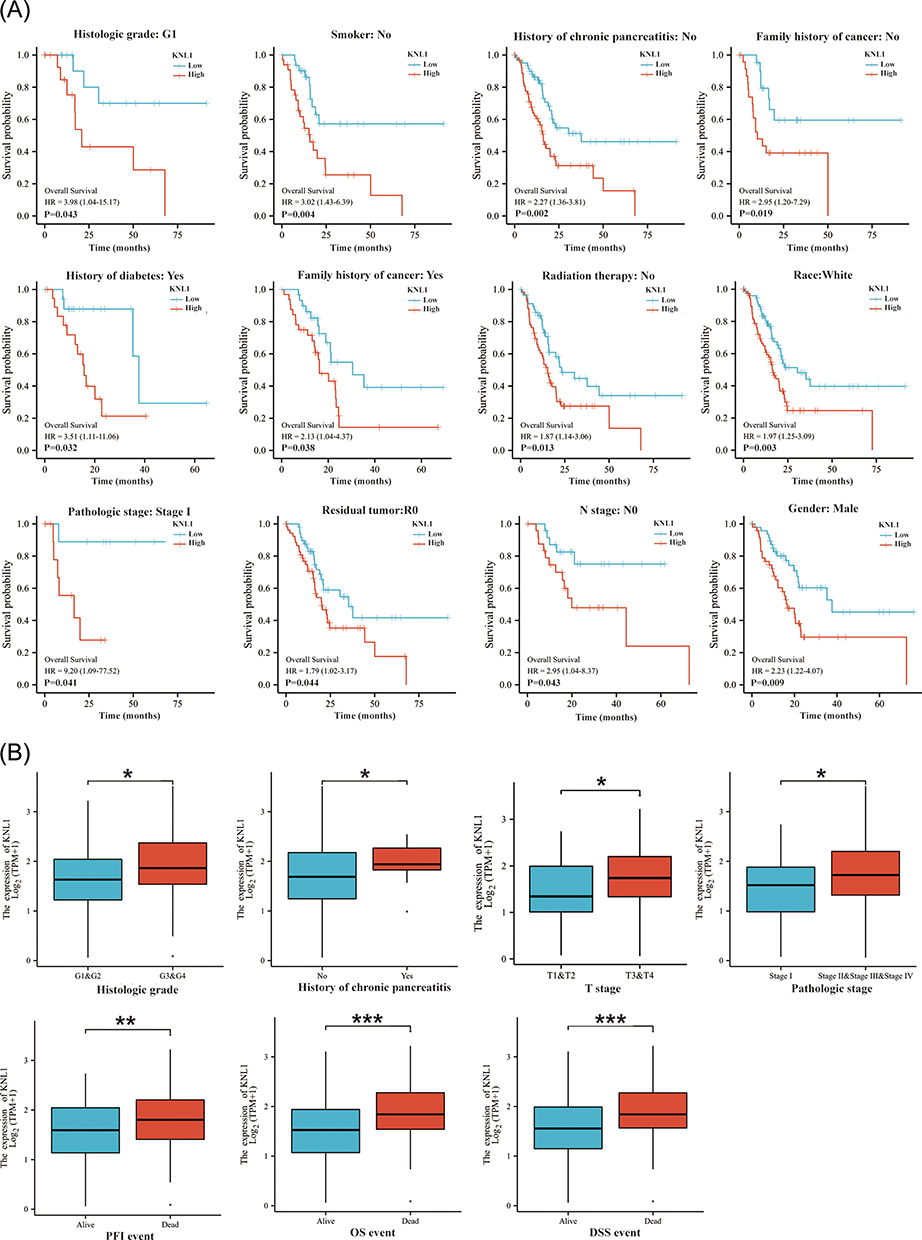
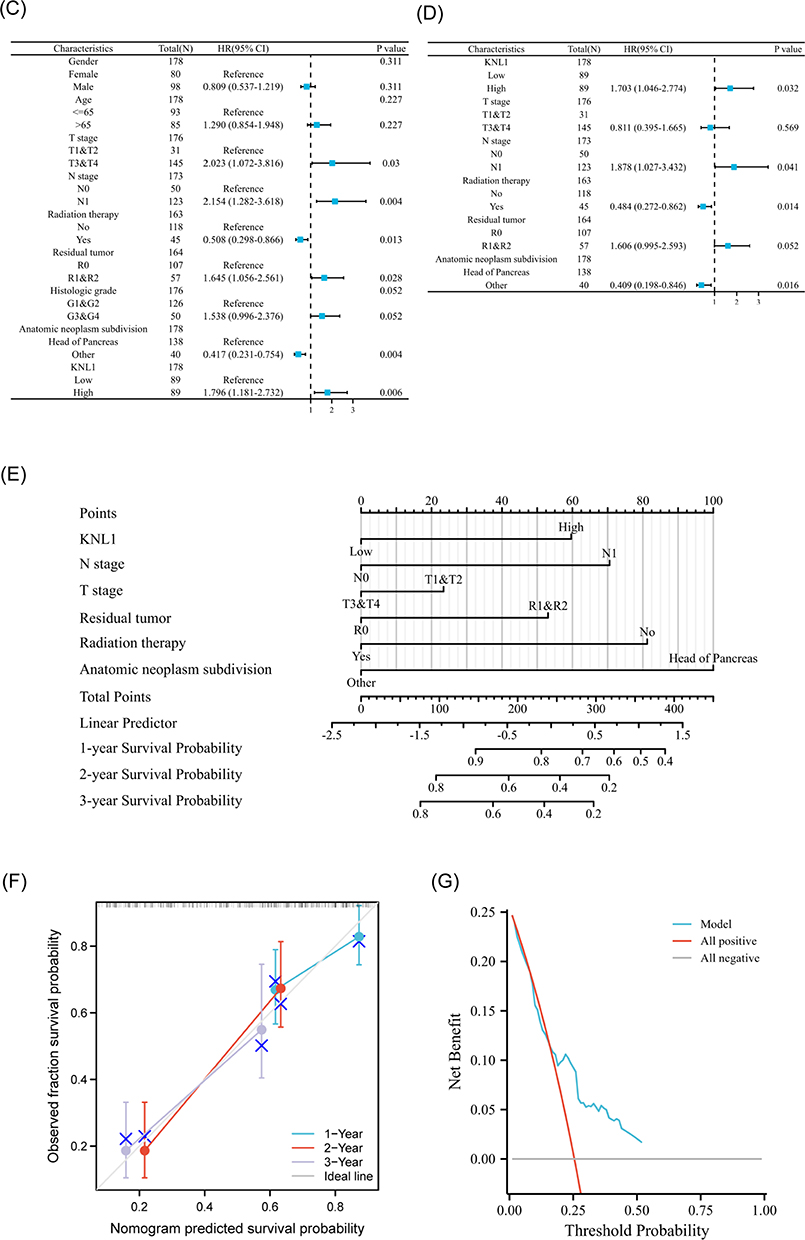
Univariable Cox regression analysis revealed that KNL1, T stage, N stage, radiation therapy status, residual situation, and tumor anatomic location were significant predictive factors (Figure 7C and D). Subsequently, multivariable Cox regression analysis indicated that KNL1, N stage, radiation therapy status, and anatomic neoplasm subdivision were independent prognostic factors of PAAD. These factors were then used to construct the 1-year, 2-year, and 3-year OS nomogram, showing a c-index of 0.691 (95% CI 0.655–0.726) (Figure 7E). The 1-year, 2-year, and 3-year OS calibration curves indicated that the model was highly accurate (Figure 7F). The line of the model can be stably higher than the positive and negative line in a certain range of x values, indicating great clinical net benefit and patient benefit of the model (Figure 7G).
Validation of KNL1 Expression in Cell Lines and Clinical Samples in vitro
Real-time PCR was performed in bladder transitional cell carcinoma and gastric cancer to validate the high expression of KNL1 in cancer tissues in vitro. mRNA expression of KNL1 was higher in AGS/HGC27 cell lines than in GES1. Similarly, mRNA expression of KNL1 was higher in T24/5637/J82 than in SV-HUC-1 (Figure 8A, Supplementary Table 1). Data from HPA showed stronger KNL1 staining intensity in most cancer tissues compared to normal tissues (Figure 8B). Furthermore, cancerous and paracancerous tissue specimens were collected from PAAD patients for IHC. The representative images of IHC staining are shown in Figure 8C. The H-score of each species was calculated after IHC staining (Supplementary Table 2). The H-score indicated higher expression of KNL1 in cancerous tissues (mean H-score 150.58±16.75) than in paracancerous tissues (mean H-score 132.82±12.35) using matched samples t-test (t = 3.828, P=0.006) (Figure 8D).
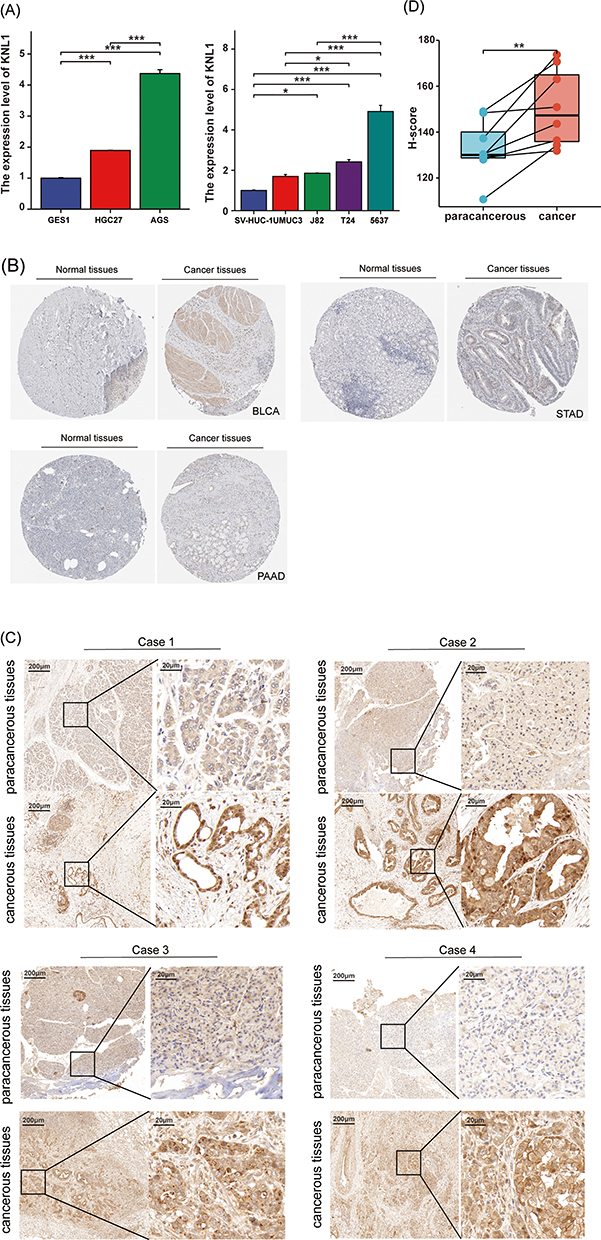 |
Figure 8 Validation of KNL1 expression in PAAD, STAD, and BLCA. (A) Real-time PCR was performed in gastric cancer, BLCA, and their corresponding normal tissue cell lines. (B) Stronger KNL1 IHC staining intensity was observed in cancer tissues in PAAD, STAD, and BLCA from the HPA database. (C) IHC staining of KNL1 in paracancerous and cancerous tissues of PAAD patients. (D) Matched samples t-test showed cancerous tissues had a higher H-score than paracancerous tissues, ns, p≥0.05; *p< 0.05; **p<0.01; ***p<0.001. |
Discussion
Mitosis is an accurate and stringently coordinated process that requires synergy between a wide range of proteins. KNL1 contributes to microtubule stability and mitosis error correction during cell division. Specifically, in the process of mitosis, KNL1 offers the binding site to Bub3 (one of the spindle assembly checkpoint components) to recruit the Bub3-BubR1 complex binding to the kinetochore after phosphorylation.10,24–26 Moreover, to ensure the precision of mitosis, KNL1 combines with the MIS12 and NDC80 complex, and other important proteins such as the spindle assembly checkpoint proteins and tubulin.27–31
Spindle assembly checkpoint proteins modify the attachment of kinetochores and microtubules (KT-MT) and are activated by an unattachment or incorrect attachment of KT-MT. Activated SAC delays mitosis until complete attachment of all KT-MTs, thus assuring the accuracy of the cell cycle. This indicates the vital effect of KNL1 on the regulation of cell proliferation.32,33 Based on the above basic theories, more studies have investigated the role of KNL1 expression in tumorigenesis. Higher KNL1 expression was found in three kinds of brain tumors and normal brain tissues.34 Moreover, KNL1 was found to promote cell proliferation and cancer through interaction with tumor suppressor genes pRb.35 The loss of KNL1 can slow down proliferation and promote apoptosis in cell lines and xenograft tumor models.13
Alteration proportion accounted for about 3% of the whole KNL1 gene, in which missense mutations accounted for the highest proportion, followed by amplification and deep deletion. In contrast, mutation and deep deletion were also observed in some mRNA up-regulated cancers. The mRNA expression level of KNL1 was explored in pan-cancer. Up-regulated expression of KNL1 was found in 13 and 18 cancers in the TIMER and UALCAN databases, respectively. Higher mRNA expression of KNL1 was also confirmed in 23 and 11 cancers across unpaired and paired samples from the TCGA database, respectively. In conclusion, KNL1 mRNA was always up-regulated in BLCA, BRCA, CESC, COAD, HNSC, LIHC, STAD, and UCEC cancer tissues, while down-regulated in KIRC, KICH, and KIRP. In terms of protein expression level, a stronger KNL1 staining intensity was observed in cancer tissues compared to normal tissues in the majority of cancers. Especially, lower KNL1 protein expression was observed in kidney cancers, matching with their mRNA expression.
DNA CpG island undergoes methylation under the catalysis of DNA methyltransferase. Studies showed that hypermethylation of DNA CpG island led to gene silencing, while hypomethylation of DNA led to gene activation. A greater number of alterations of CpG island methylation phenotypes were observed in cancer cells compared to somatic cells, which indicated that abnormal methylation was associated with tumorigenesis.36 Furthermore, the promoter methylation level of 24 kinds of cancer tissues and their corresponding normal tissues was investigated, revealing lower methylation levels in 14 cancers than normal, of which 5 cancers showed statistically significant methylation levels. Paradoxically, in addition to KIRC, four other cancer mRNAs were up-regulated in cancer tissues, which may be attributed to the low number of normal tissue samples included in methylation studies.
EPIC and quantTIseq are the exclusive algorithms that offer a “absolute score” which accurately represents the proportion of cells. Sturm et al suggested that EPIC and quantTIseq were suitable for regular assessment of immune cell function because to their robust performance.37 The xCELL algorithm encompasses a comprehensive range of immune cell types, making it the most extensive in its class. Based on the aforementioned considerations, the aforementioned three methods have been chosen for inclusion in the main body of the book.
Our study suggested KNL1 was positively related to Th2 in 25 cancers and common lymphoid progenitor in 19 cancers, while negatively related to stroma score in 16 cancers. The correlation analysis showed a strong relationship between KNL1 and Th2. Th2 cells exert an ambivalent effect on TME and active with other immune cells by releasing cytokines.38 Previous studies reported that Th2 modulates immune responses to promote tumor development. For example, the transformation of Th2 cells into Th1 cells was observed while the lung transplant tumor in mice was in remission. The predominance of Th2 cells in TME is associated with poor prognosis.39 Furthermore, studies also reported that the immune response conducted by Th2 cells is related to tumor progression in multiple tumors.40–43 This also suggests that KNL1 may promote TME-mediated Th2 cell-type immune response-mediated immune escape, and promote tumor occurrence and cancer development. Furthermore, apart from thyroid carcinoma (TGCA), THCA, and KIRC, there was a negative correlation observed between high KNL1 expression and the degree of invasion by M0 and M1 macrophages. This observation implies that the elevated expression of KNL1 in these cancer cells might impede the process of macrophage differentiation and hinder their ability to carry out their typical physiological tasks.44 CD8+ T cells have cytotoxic activity against tumor cells inside the localized tumor microenvironment.45 The expression levels of KNL1 are quite low in KIRC and KIRP. The downregulation of KNL1 was found to be associated with notable reductions in the infiltration of CD8+ T cells and B cells in KIRC and KIRP. This finding implies that the decreased expression of KNL1 in these tumors may not confer a protective effect.
Immune checkpoint inhibitors play an extremely important role in anti-tumor immunotherapy. A significant correlation was found between KNL1 and immune checkpoint-related genes in the vast majority of tumors. KNL1 was also associated with the immune escape microenvironment and promoted tumorigenesis and progression. It also validated our prediction of ICI treatment sensitivity. In THYM and LUAD, higher KNL1 expression was associated with poorer efficacy of ICI treatment due to lower immune checkpoint expression.
Cancers with higher expression of KNL1 and a worse survival outcome in KNL1-high group accounts for the majority, such as PAAD, ACC, PRAD, GBMLGG, LUAD and LGG. While the expression of KNL1 was lower in cancers of kidney, including KICH, KIRC and KIRP, and the survival outcome of the three cancers was better in the KNL1-low group. In the above stated cancers, KNL1 expression levels were adversely linked with prognosis, suggesting a tumor-promoting effect of KNL1. However, there were two exceptions. While KNL1-high group indicated better OS in ESCC and THYM, in which the expression of KNL1 was higher than normal tissues. It is probable that genes exhibiting high expression levels in tumor tissue, as determined by RNA-seq, correspond to molecules that are highly expressed on immune cells. An alternative explanation could be attributed to the varying forms of pathology. During our investigation into the levels of KNL1 expression, we acquired expression data pertaining to ESCA (encompassing all pathological kinds such as squamous and adenocarcinoma), while the prognostic analysis employed data pertaining to ESCC.
The above analysis was based on pan-cancer. Single-gene differential analysis was further performed on BCLA, STAD, and PAAD to explore the mechanism of KNL1 carcinogenesis. The DEGs and related genes were screened out and the hub genes substantially positively associated with KNL1 in biological function were selected by correlation analysis and protein-to-protein interaction network. GO and KEGG analyses showed that KNL1-related genes were enriched in a number of cancer pathways, including colorectal cancer, prostate cancer, pancreatic cancer, renal cell carcinoma, and endometrial cancer, etc. GESA enrichment analysis revealed that the high expression of KNL1 was positively linked with pathways of uncontrolled cellular proliferation, such as the TNF-α/Nf-κB, P53 and the mTORC1 signaling pathway.46–48 In addition, KNL1 was positively correlated with EMT and KRAS activation-related pathways. EMT plays a significant role in enhancing the aggressiveness of cancer metastasis.49 KRAS belongs to the three rat sarcoma (RAS) family of hyperproteins, and is in an inactivated state in most cells.50 When it is activated, it can activate various downstream signaling pathways (including the MAPK signaling and the PI3K signaling pathways), increasing cell proliferation, migration, and ultimately leading to cancer.51,52 The analysis showed that KNL1 was connected with IFN-γ and IFN-α responses, which may be related to the fact that KNL1-related genes are also engaged in antiviral immune responses,53 as validated by our earlier GO analysis. In addition, pathways associated with KNL1 to ensure the normal course of mitosis were also enriched, such as the G2/M checkpoint route, which inhibits cells with DNA damage from entering mitosis, and the E2f pathway, which is intimately related to the cell cycle.54,55
Normal gastric and bladder epithelial cells and cancer cells were analyzed to validate the expression level of KNL1. Two gastric cancer cell lines and three bladder cancer cell lines showed a tendency towards high KNL1 expression, but no significant difference in KNL1 expression was observed between UMUC3 and normal bladder ureteral epithelial cells. In addition to tumor heterogeneity, we hypothesized that this might be due to the fact that the different cancer cell lines were derived from different patients.
Considering that there was no satisfactory statistical difference between KNL1 and OS in STAD and BLCA, PAAD was selected to construct the KNL1 survival model, which suggested that KNL1 could be used as a prognostic biomarker for PAAD.
Nevertheless, the limitations of the current study should be acknowledged. Firstly, the role of KNL1 as an oncogene promoting tumor development in its specific signaling pathway still needs to be verified by in vitro and in vivo experiments. Furthermore, whether there is a direct or indirect regulatory relationship between KNL1 and Th2 cells in TME needs to be confirmed by rigorous experiments.
Conclusion
KNL1 demonstrated a significant prognostic value in pan-cancer. High KNL1 expression levels were observed in most cancers and were related to suppressive TME and cell proliferation. Our pan-cancer analysis of KNL1 suggested that it may serve as a reliable factor for tumor prognosis prediction and might be a novel immunotherapy target.
Ethical Approval and Consent
This study was performed in line with the principles of the Declaration of Helsinki. Approval was granted by the Ethics Committee of The Affiliated Hospital of Qingdao University (APPROVAL NUMBER: No. QYFY-WZLL-27531). All included patients gave their oral and written informed consent.
Disclosure
The authors report no conflicts of interest in this work.
References
1. Kocarnik JM, Compton K, Dean FE. Cancer Incidence, Mortality, Years of Life Lost, Years Lived With Disability, and Disability-Adjusted Life Years for 29 Cancer Groups From 2010 to 2019: a Systematic Analysis for the Global Burden of Disease Study 2019. JAMA Oncol. 2022;8:420–444. doi:10.1001/jamaoncol.2021.6987
2. Sung H, Ferlay J, Siegel RL, et al. Global Cancer Statistics 2020: GLOBOCAN Estimates of Incidence and Mortality Worldwide for 36 Cancers in 185 Countries. CA Cancer J Clin. 2021;71(3):209–249. doi:10.3322/caac.21660
3. Housini M, Dariya B, Ahmed N, et al. Colorectal cancer: Genetic alterations, novel biomarkers, current therapeutic strategies and clinical trials. Gene. 2023;892:147857. doi:10.1016/j.gene.2023.147857
4. Remon J, Saw SPL, Cortiula F, et al. Perioperative treatment strategies in EGFR-mutant early-stage NSCLC: current evidence and future challenges. J Thorac Oncol. 2023. doi:10.1016/j.jtho.2023.09.1451
5. Montazeri Aliabadi H, Manda A, Sidgal R, Chung C. Targeting Breast Cancer: the Familiar, the Emerging, and the Uncharted Territories. Biomolecules. 2023;13(9):1306. doi:10.3390/biom13091306
6. Fukagawa T. Assembly of kinetochores in vertebrate cells. Exp Cell Res. 2004;296(1):21–27. doi:10.1016/j.yexcr.2004.03.004
7. Orr-Weaver TL, Weinberg RA. A checkpoint on the road to cancer. Nature. 1998;392(6673):223–224. doi:10.1038/32520
8. Cahill DP, Kinzler KW, Vogelstein B, Lengauer C. Genetic instability and Darwinian selection in tumours. Trends Cell Biol. 1999;9(12):M57–60. doi:10.1016/S0962-8924(99)01661-X
9. Lengauer C, Kinzler KW, Vogelstein B. Genetic instabilities in human cancers. Nature. 1998;396(6712):643–649. doi:10.1038/25292
10. Shepperd LA, Meadows JC, Sochaj AM, et al. Phosphodependent recruitment of Bub1 and Bub3 to Spc7/KNL1 by Mph1 kinase maintains the spindle checkpoint. Curr Biol. 2012;22:891–899. doi:10.1016/j.cub.2012.03.051
11. Song B, Du J, Song DF, Ren JC, Feng Y. Dysregulation of NCAPG, KNL1, miR-148a-3p, miR-193b-3p, and miR-1179 may contribute to the progression of gastric cancer. Biol Res. 2018;51(1):44. doi:10.1186/s40659-018-0192-5
12. Cui Y, Zhang C, Ma S, Guo W, Cao W, Guan F. CASC5 is a potential tumour driving gene in lung adenocarcinoma. Cell Biochem Funct. 2020;38:733–742. doi:10.1002/cbf.3540
13. Urata YN, Takeshita F, Tanaka H, Ochiya T, Takimoto M. Targeted Knockdown of the Kinetochore Protein D40/Knl-1 Inhibits Human Cancer in a p53 Status-Independent Manner. Sci Rep. 2015;5(1):13676. doi:10.1038/srep13676
14. Bai T, Zhao Y, Liu Y, Cai B, Dong N, Li B. Effect of KNL1 on the proliferation and apoptosis of colorectal cancer cells. Technol Cancer Res Treat. 2019;18:1533033819858668. doi:10.1177/1533033819858668
15. Men C, Chai H, Song X, Li Y, Du H, Ren Q. Identification of DNA methylation associated gene signatures in endometrial cancer via integrated analysis of DNA methylation and gene expression systematically. J Gynecol Oncol. 2017;28(6):e83. doi:10.3802/jgo.2017.28.e83
16. Shinawi T, Hill VK, Krex D, et al. DNA methylation profiles of long- and short-term glioblastoma survivors. Epigenetics. 2013;8(2):149–156. doi:10.4161/epi.23398
17. Li T, Fu J, Zeng Z, et al. TIMER2.0 for analysis of tumor-infiltrating immune cells. Nucleic Acids Res. 2020;48(W1):W509–w514. doi:10.1093/nar/gkaa407
18. Aran D. Cell-Type Enrichment Analysis of Bulk Transcriptomes Using xCell. Methods Mol Biol. 2020;2120:263–276.
19. Becht E, Giraldo NA, Lacroix L, et al. Estimating the population abundance of tissue-infiltrating immune and stromal cell populations using gene expression. Genome Biol. 2016;17:218. doi:10.1186/s13059-016-1070-5
20. Newman AM, Liu CL, Green MR, et al. Robust enumeration of cell subsets from tissue expression profiles. Nat Methods. 2015;12(5):453–457. doi:10.1038/nmeth.3337
21. Racle J, de Jonge K, Baumgaertner P, Speiser DE, Gfeller D. Simultaneous enumeration of cancer and immune cell types from bulk tumor gene expression data. Elife. 2017;6. doi:10.7554/eLife.26476
22. Love MI, Huber W, Anders S. Moderated estimation of fold change and dispersion for RNA-seq data with DESeq2. Genome Biol. 2014;15(12):550. doi:10.1186/s13059-014-0550-8
23. Fedchenko N, Reifenrath J. Different approaches for interpretation and reporting of immunohistochemistry analysis results in the bone tissue - A review. Diagn Pathol. 2014;9:221. doi:10.1186/s13000-014-0221-9
24. Yamagishi Y, Yang CH, Tanno Y, Watanabe Y. MPS1/Mph1 phosphorylates the kinetochore protein KNL1/Spc7 to recruit SAC components. Nat Cell Biol. 2012;14:746–752. doi:10.1038/ncb2515
25. London N, Ceto S, Ranish JA, Biggins S. Phosphoregulation of Spc105 by Mps1 and PP1 regulates Bub1 localization to kinetochores. Curr Biol. 2012;22(10):900–906. doi:10.1016/j.cub.2012.03.052
26. Primorac I, Weir JR, Chiroli E, et al. Bub3 reads phosphorylated MELT repeats to promote spindle assembly checkpoint signaling. Elife. 2013;2:e01030. doi:10.7554/eLife.01030
27. Cheeseman IM, Niessen S, Anderson S, et al. A conserved protein network controls assembly of the outer kinetochore and its ability to sustain tension. Genes Dev. 2004;18(18):2255–2268. doi:10.1101/gad.1234104
28. Obuse C, Iwasaki O, Kiyomitsu T, Goshima G, Toyoda Y, Yanagida M. A conserved Mis12 centromere complex is linked to heterochromatic HP1 and outer kinetochore protein Zwint-1. Nat Cell Biol. 2004;6(11):1135–1141. doi:10.1038/ncb1187
29. Cheeseman IM, Chappie JS, Wilson-Kubalek EM, Desai A. The conserved KMN network constitutes the core microtubule-binding site of the kinetochore. Cell. 2006;127(5):983–997. doi:10.1016/j.cell.2006.09.039
30. Kiyomitsu T, Obuse C, Yanagida M. Human Blinkin/AF15q14 is required for chromosome alignment and the mitotic checkpoint through direct interaction with Bub1 and BubR1. Dev Cell. 2007;13(5):663–676. doi:10.1016/j.devcel.2007.09.005
31. Espeut J, Cheerambathur DK, Krenning L, Oegema K, Desai A. Microtubule binding by KNL-1 contributes to spindle checkpoint silencing at the kinetochore. J Cell Biol. 2012;196(4):469–482. doi:10.1083/jcb.201111107
32. Hwang LH, Lau LF, Smith DL, et al. Budding yeast Cdc20: a target of the spindle checkpoint. Science. 1998;279(5353):1041–1044. doi:10.1126/science.279.5353.1041
33. Kim SH, Lin DP, Matsumoto S, Kitazono A, Matsumoto T. Fission yeast Slp1: an effector of the Mad2-dependent spindle checkpoint. Science. 1998;279(5353):1045–1047. doi:10.1126/science.279.5353.1045
34. Akiyama Y, Komiyama M, Miyata H, et al. Novel cancer-testis antigen expression on glioma cell lines derived from high-grade glioma patients. Oncol Rep. 2014;31(4):1683–1690. doi:10.3892/or.2014.3049
35. Bogdanov KV, Takimoto M. The involvement of c-Abl and D40 (AF15q14/CASC5) proteins in the regulation of cell proliferation and cancer. Tsitologiia. 2008;50:590–596.
36. Yang B, Wang JQ, Tan Y, Yuan R, Chen ZS, Zou C. RNA methylation and cancer treatment. Pharmacol Res. 2021;174:105937. doi:10.1016/j.phrs.2021.105937
37. Sturm G, Finotello F, Petitprez F, et al. Comprehensive evaluation of transcriptome-based cell-type quantification methods for immuno-oncology. Bioinformatics. 2019;35(14):i436–i445. doi:10.1093/bioinformatics/btz363
38. Lorvik KB, Hammarström C, Fauskanger M, et al. Adoptive Transfer of Tumor-Specific Th2 Cells Eradicates Tumors by Triggering an In Situ Inflammatory Immune Response. Cancer Res. 2016;76:6864–6876. doi:10.1158/0008-5472.CAN-16-1219
39. Dai M, Hellstrom I, Yip YY, Sjögren HO, Hellstrom KE. Tumor Regression and Cure Depends on Sustained Th1 Responses. J Immunother. 2018;41(8):369–378. doi:10.1097/CJI.0000000000000231
40. DeNardo DG, Barreto JB, Andreu P, et al. CD4(+) T cells regulate pulmonary metastasis of mammary carcinomas by enhancing protumor properties of macrophages. Cancer Cell. 2009;16:91–102. doi:10.1016/j.ccr.2009.06.018
41. Espinoza JA, Jabeen S, Batra R, et al. Cytokine profiling of tumor interstitial fluid of the breast and its relationship with lymphocyte infiltration and clinicopathological characteristics. Oncoimmunology. 2016;5:e1248015. doi:10.1080/2162402X.2016.1248015
42. Feng Q, Wei H, Morihara J, et al. Th2 type inflammation promotes the gradual progression of HPV-infected cervical cells to cervical carcinoma. Gynecol Oncol. 2012;127(2):412–419. doi:10.1016/j.ygyno.2012.07.098
43. Chen J, Gong C, Mao H, et al. E2F1/SP3/STAT6 axis is required for IL-4-induced epithelial-mesenchymal transition of colorectal cancer cells. Int J Oncol. 2018;53:567–578. doi:10.3892/ijo.2018.4429
44. Zhang S, Zhang E, Long J, et al. Immune infiltration in renal cell carcinoma. Cancer Sci. 2019;110(5):1564–1572. doi:10.1111/cas.13996
45. Li Y, Wu Q, Lv J, Gu J. A comprehensive pan-cancer analysis of CDH5 in immunological response. Front Immunol. 2023;14:1239875. doi:10.3389/fimmu.2023.1239875
46. Du C, Duan X, Yao X, et al. Tumour-derived exosomal miR-3473b promotes lung tumour cell intrapulmonary colonization by activating the nuclear factor-κB of local fibroblasts. J Cell Mol Med. 2020;24(14):7802–7813. doi:10.1111/jcmm.15411
47. Zhang Y, Wang ZZ, Han AQ, et al. TuBG1 promotes hepatocellular carcinoma via ATR/P53-apoptosis and cycling pathways. Hepatobiliary Pancreat Dis Int. 2023. doi:10.1016/j.hbpd.2023.09.004
48. Wang X, Mao Y, Xu H, Chen J, Chen X. Identification of m(5)C-related molecular subtypes and prediction models in the prognosis and tumor microenvironment infiltration of soft tissue sarcoma. Heliyon. 2023;9:e19680. doi:10.1016/j.heliyon.2023.e19680
49. Cao Y, Wu Y, Tu H, et al. (-)-Guaiol inhibit epithelial-mesenchymal transition in lung cancer via suppressing M2 macrophages mediated STAT3 signaling pathway. Heliyon. 2023;9:e19817. doi:10.1016/j.heliyon.2023.e19817
50. Kirsten WH, Mayer LA. Morphologic responses to a murine erythroblastosis virus. J Natl Cancer Inst. 1967;39:311–335.
51. Qunaj L, May MS, Neugut AI, Herzberg BO. Prognostic and therapeutic impact of the KRAS G12C mutation in colorectal cancer. Front Oncol. 2023;13:1252516. doi:10.3389/fonc.2023.1252516
52. Costamagna A, Natalini D, Camacho Leal MDP, et al. Docking Protein p130Cas Regulates Acinar to Ductal Metaplasia During Pancreatic Adenocarcinoma Development and Pancreatitis. Gastroenterology. 2022;162:1242–1255.e1211. doi:10.1053/j.gastro.2021.12.242
53. Hillaire MLB, Lawrence P, Lagrange B. IFN-γ: a Crucial Player in the Fight Against HBV Infection? Immune Netw. 2023;23:e30. doi:10.4110/in.2023.23.e30
54. Yam CQX, Lim HH, Surana U. DNA damage checkpoint execution and the rules of its disengagement. Front Cell Dev Biol. 2022;10:1020643. doi:10.3389/fcell.2022.1020643
55. Kassab A, Gupta I, Moustafa AA. Role of E2F transcription factor in oral cancer: recent insight and advancements. Semin Cancer Biol. 2023;92:28–41. doi:10.1016/j.semcancer.2023.03.004
 © 2023 The Author(s). This work is published and licensed by Dove Medical Press Limited. The full terms of this license are available at https://www.dovepress.com/terms.php and incorporate the Creative Commons Attribution - Non Commercial (unported, v3.0) License.
By accessing the work you hereby accept the Terms. Non-commercial uses of the work are permitted without any further permission from Dove Medical Press Limited, provided the work is properly attributed. For permission for commercial use of this work, please see paragraphs 4.2 and 5 of our Terms.
© 2023 The Author(s). This work is published and licensed by Dove Medical Press Limited. The full terms of this license are available at https://www.dovepress.com/terms.php and incorporate the Creative Commons Attribution - Non Commercial (unported, v3.0) License.
By accessing the work you hereby accept the Terms. Non-commercial uses of the work are permitted without any further permission from Dove Medical Press Limited, provided the work is properly attributed. For permission for commercial use of this work, please see paragraphs 4.2 and 5 of our Terms.