Back to Journals » Journal of Inflammation Research » Volume 16
Integrated Analysis of Immune Infiltration and Hub Pyroptosis-Related Genes for Multiple Sclerosis
Authors Zhang S, Ma Y, Luo X, Xiao H, Cheng R, Jiang A, Qin X ![]()
Received 8 June 2023
Accepted for publication 2 September 2023
Published 13 September 2023 Volume 2023:16 Pages 4043—4059
DOI https://doi.org/10.2147/JIR.S422189
Checked for plagiarism Yes
Review by Single anonymous peer review
Peer reviewer comments 3
Editor who approved publication: Professor Ning Quan
Shaoru Zhang,* Yue Ma,* Xiaoqin Luo, Hongmei Xiao, Ruiqi Cheng, Anan Jiang, Xinyue Qin
Department of Neurology, The First Affiliated Hospital of Chongqing Medical University, Chongqing, People’s Republic of China
*These authors contributed equally to this work
Correspondence: Xinyue Qin, Department of Neurology, The First Affiliated Hospital of Chongqing Medical University, 1st Youyi Road, Yuzhong District, Chongqing, People’s Republic of China, Tel +86 023-89012008, Email [email protected]
Purpose: Studies on overall immune infiltration and pyroptosis in patients with multiple sclerosis (MS) are limited. This study explored immune cell infiltration and pyroptosis in MS using bioinformatics and experimental validation.
Methods: The GSE131282 and GSE135511 microarray datasets including brain autopsy tissues from controls and MS patients were downloaded for bioinformatic analysis. The gene expression-based deconvolution method, CIBERSORT, was used to determine immune infiltration. Differentially expressed genes (DEGs) and functional enrichments were analyzed. We then extracted pyroptosis-related genes (PRGs) from the DEGs by using machine learning strategies. Their diagnostic ability for MS was evaluated in both the training set (GSE131282 dataset) and validation set (GSE135511 dataset). In addition, messenger RNA (mRNA) expression of PRGs was validated using quantitative real-time polymerase chain reaction (qRT-PCR) in cortical tissue from an experimental autoimmune encephalomyelitis (EAE) model of MS. Moreover, the functional enrichment pathways of each hub PRG were estimated. Finally, co-expressed competitive endogenous RNA (ceRNA) networks of PRGs in MS were constructed.
Results: Among the infiltrating cells, naive CD4+ T cells (P=0.006), resting NK cells (P=0.002), activated mast cells (P=0.022), and neutrophils (P=0.002) were significantly higher in patients with MS than in controls. The DEGs of MS were screened. Analysis of enrichment pathways showed that the pathways of transcriptional regulatory mechanisms and ion channels associating with pyroptosis. Four PRGs genes CASP4, PLCG1, CASP9 and NLRC4 were identified. They were validated in both the GSE135511 dataset and the EAE model by using qRT-PCR. CASP4 and NLRC4 were ultimately identified as stable hub PRGs for MS. Single-gene Gene Set Enrichment Analysis showed that they mainly participated in biosynthesis, metabolism, and organism resistance. ceRNA networks containing CASP4 and NLRC4 were constructed.
Conclusion: MS was associated with immune infiltration. CASP4 and NLRC4 were key biomarkers of pyroptosis in MS.
Keywords: immune infiltration, pyroptosis, multiple sclerosis, bioinformatics, ceRNA
Introduction
Multiple sclerosis (MS) is a progressive autoimmune inflammatory disease of the central nervous system (CNS) of unknown etiology. Inappropriate response of T/B cells is a well-known putative candidate among other causal agents.1 Anti-CD20 (aCD20) B cell-depleting monoclonal antibodies have proven highly successful in treating MS. However, new disease activity develops in a small proportion of MS patients after starting aCD20 therapy,2 and aCD20 therapy seems to only have a modest effect in preventing long-term disability in progressive forms of MS. Indeed, the contribution of numerous immune cell subtypes is believed to play a complex role in the pathogenesis of MS.3 Immune infiltration may influence the execution of pyroptosis,4 which may further aggravate immune infiltration and neuronal death in MS. However, studies concerning overall immune infiltration in the brain tissues of MS patients are still limited.
Pyroptosis provides a new perspective on the mechanisms underlying MS.5 The programmed cell fate is involved in apoptosis and necroptosis.6 Pyroptosis, a form of programmed cell death that differs from apoptosis and necrosis, relies on inflammasome activation7 and induces membrane rupture, leading to the release of inflammatory factors.8 Pyroptosis is initiated by caspase-1 (CASP1) family members and is executed by the pore-forming protein gasdermin D (GSDMD), or in certain circumstances, gasdermin E (GSDME). The CASP1 family of proteases cleave and activate GSDMD within the inflammasome and mediate the maturation of interleukin (IL)-1β and IL-18. Activated GSDMD translocates to the plasma membrane and assembles multimeric pores that are permeable to small molecules including ions and inflammasome-associated cytokines.9 Owing to drastic changes in osmotic pressure, pyroptotic bodies form along the membrane, which swell and rupture catastrophically, causing cell lysis.10 This process releases inflammatory mediators into the extracellular milieu, propagating local inflammation.10,11 Several lines of evidence have highlighted the importance of pyroptosis-related pivotal mediators in MS and its prototypic animal model on experimental autoimmune encephalomyelitis (EAE).12,13 However, few studies have investigated the enrichment pathways and immune correlations of pyroptosis-related molecules and effectors regulating pyroptosis in the development of MS. Long non-coding RNAs (lncRNAs) have been verified as crucial mediators in the regulation of pyroptosis.14 The lncRNAs and microRNAs (miRNAs) have been verified to regulate gene expression by functioning as competitive endogenous RNAs (ceRNAs). Genetic associations implicated in MS may offer an approach to identify early molecular and cellular events in MS pathogenesis.15 Investigating immune infiltration and related pyroptosis in MS could provide novel entry points for MS drug development or repurposing, which will be helpful in preventing and treating MS and may reduce the cost of drug discovery.
In recent years, microarrays based on high-throughput platforms combined with bioinformatics analysis have shown powerful potential to evaluate the immune landscape of diseases and explore promising biomarkers for many diseases,16 including inflammatory or neuroinflammatory disorders. For examples, a comprehensive bioinformatic analysis identified immune genes which are of great significance for the anti-inflammatory immunotherapy of atherosclerosis.17 Qiu et al identified an inflammation-related adrenomedullin precursor for male patients with local inflammatory gout based on integrated analysis.18 Furthermore, a study applied bioinformatic analysis and found apolipoprotein E as a hub biomarker regulating neuroinflammation in macrophages and microglia in spinal cord injury.19 Another study using bioinformatic analysis predicted that peripheral natural killer (NK) cells may infiltrate the brain and contribute to neuroinflammatory changes in Alzheimer’s disease using bioinformatic analysis.20 Therefore, this study aimed to explore the immune infiltration signatures and molecular mechanisms governing pyroptosis in the CNS of patients with MS via bioinformatics and experimental validation (Figure 1).
 |
Figure 1 The research flowchart of bioinformatic analysis and in vivo experimental validation. Abbreviations: DPRGs, differentially expressed pyroptosis-related genes; LASSO, least absolute shrinkage and selection operator; SVM-RFE, support vector machine recursive feature elimination; ROC, receiver operating characteristics curve; mRNA, messenger RNA; EAE, experimental autoimmune encephalomyelitis; CASP4, Caspases‐4; NLRC4, Nucleotide-binding, leucine-rich repeat (NLR) family caspase activation and recruitment domain (CARD) domain containing 4; GSEA, Gene Set Enrichment Analysis. |
Materials and Methods
Access and Preprocess of Data
We systematically searched MS-related studies Gene Expression Omnibus (GEO) datasets using the terms “MS” or “multiple sclerosis”. The inclusion criteria were as follows: (1) data uploaded after 2017; (2) the expression profiles contained more than 3 samples from MS patients. The microarray gene expression profiles of GSE131282 deposited by Enz LS,21 were selected as a training dataset. The GSE135511 dataset uploaded by Magliozzi R22 was chosen as the validation dataset. According to the manufacturer’s instructions, the GSE131282 dataset was profiled using Illumina HumanHT-12 V4.0 expression beadchip (GPL10558) microarrays. The GSE135511 dataset was processed using the Illumina HumanRef-8 v3.0 expression beadchip (GPL6883) microarrays. The samples of the two microarrays were collected from the gray matter and analyzed in a single experiment respectively, which adjusted in-group batch variation. Raw microarray data were acquired from GEO and pre-processed. Using R (version 4.1.2), we carried out background correction, normalization, probeset filtering, and annotation. Finally, 37 gray matter lesions from MS patients and 42 gray matter lesions from the controls of the GSE131282 dataset were selected for differential expression analysis. In the GSE135511 dataset, 20 gray matter lesions from MS patients and 10 gray matter lesions from the controls were selected.
Immune Infiltration Analysis of MS
To quantify the levels of immune infiltration in the brain tissue of MS patients, the CIBERSORT algorithm (https://cibersort.stanford.edu/) was applied,23 which is a gene expression-based deconvolution algorithm by using the leukocyte gene signature matrix. Only statistically significant data were reserved for the following analysis, with CIBERSORT P<0.05. Thus, the output was directly integrated to generate an entire matrix of immunecell fractions. Based on CIBERSORT, we compared the distribution of immune cell infiltration between patients with MS and healthy controls. CIBERSORT was used to compute the proportion of immune cells to approximate the immune infiltration landscape proportion. In addition, a correlation analysis was performed to evaluate the correlation between pyroptosis-related genes and immune infiltration in MS.
Differential Expression Analysis of Genes and Enrichment Pathways Analysis
Differential expression of the microarrays was analyzed using limma (R package limma). Differentially expressed genes (DEGs) with adjusted P<0.05 and |log2fold-change (log2FC) |≥0.585 were classified as statistically significant. The volcano plots and heatmaps were used to visualize the DEGs.
Molecular Signatures Database (MSigDB, http://software.broadinstitute.org/gsea/msigdb) were applied to annotate gene sets (canonical and hallmark pathways) in the analysis.24 Using the R package Msigdbr, the corresponding genes of each pathway were converted to homologs in Homo sapiens. Gene set variation analysis (GSVA),25 an unsupervised and nonparametric method, gene ontology (GO), and Kyoto Encyclopedia of Genes and Genomes (KEGG) enrichment analyses were performed to show the function and enrichment pathways of the differentially variable gene sets. Statistical significance was determined using an adjusted P value of 0.05.
Identification of Aberrant Expression of Pyroptosis-Related Genes in MS
The PubMed and Web of Science databases were searched during the study. The search was carried out using the medical terms “pyroptosis”, “pyroptosis-related genes” and “pyroptosis related genes”. Synonyms and abbreviations such as “PRG*”, and “DPRG*” were also used as keywords to broaden the search. And the 33 pyroptosis-related genes of the most recent researches were finally applied for subsequent analysis.8,26,27 Table S1 lists the parameters. The intersection between the DEGs identified in the previous phase and 33 PRGs was determined. Overlapping genes were selected as the differentially expressed pyroptosis-related genes (DPRGs). To identify stable and reproducible pyroptosis-related genes in MS, we combined the least absolute shrinkage and selection operator (LASSO) and support vector machine recursive feature elimination (SVM-RFE) algorithms based on linear and nonlinear decision functions.28 Developed as machine learning strategies, LASSO and SVM-RFE methods have been utilized for selecting features for high-throughput sequencing in recent years.29
Diagnostic Effectiveness of Hub Pyroptosis-Related Genes for MS Diagnosis
Receiver operating characteristic (ROC) curves were generated using expression data from the GSE131282 dataset using the pROC package. The area under the ROC curve (AUC) was calculated for a single biomarker to estimate the diagnostic effectiveness of pyroptosis-related genes for discriminating between MS and controls. Further validation of the diagnostic value of the biomarkers was conducted using GSE135511 microarray. And the expression levels of the hub pyroptosis-related genes were also calculated by “ggboxplot” package in R.
Experimental Autoimmune Encephalomyelitis (EAE) Model of MS
All experiments were approved by the ethics committee of the First Affiliated Hospital of Chongqing Medical University. Adult female C57BL/6 mice (18-20 g, 8-10 weeks) were divided into the EAE and control groups. The EAE group was injected subcutaneously on both sides of the spine (50ul/site, total 200ul, 350ug) with MOG35–55 peptide (051716, GL Biochem, Shanghai, China) in complete Freund’s adjuvant (CFA). CFA was a compound of 10 mL incomplete Freund’s adjuvant (F5881, Sigma, Saint Louis, USA) containing 100 mg of Mycobacterium tuberculosis H37Ra (231141, BD, New Jersey, USA). Immunized mice were injected intraperitoneally with 400 ng of pertussis toxin (81236A1, List Biological Lab, California, USA) on days 0 and 2. The control group was immunized in the same manner using PBS in the absence of MOG35–55 peptide. The mice were housed in cages under specific pathogen-free conditions and maintained under a standard 12/12 h light/dark cycle. The animals were euthanized 21d after immunization.
RNA Extraction and Quantitative Reverse Transcriptase Polymerase Chain Reaction (qRT-PCR)
Total RNA was extracted from the cortical of EAE and control mice according to the instructions of RNA according to the manufacturer’s instructions. cDNA was synthesized using a cDNA synthesis kit (R333; Vazyme, Jiangsu, China). qRT-PCR was performed using the SYBR Green Master Mix (Q711; Vazyme, Jiangsu, China). Target mRNA levels were normalized to β-actin levels, and the 2−ΔΔCt method was used to calculate relative mRNA expression levels. Primer sequences were synthesized by Tsingke Biotech (Beijing, China) and were listed in Table 1.
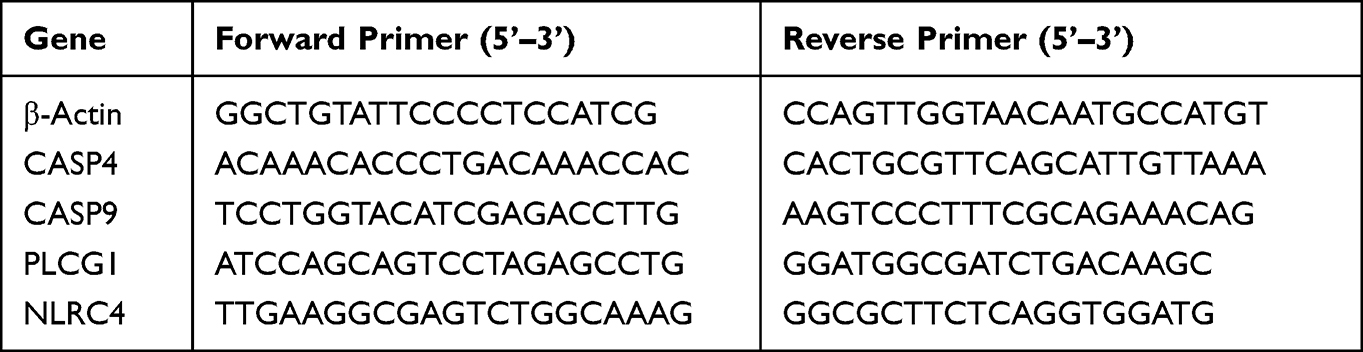 |
Table 1 Primers Used for Quantitative Reverse Transcriptase Polymerase Chain Reaction (qRT-PCR) |
Single-Gene Gene Set Enrichment Analysis (GSEA) for Hub Pyroptosis-Related Genes in MS
The underlying effect of each hub pyroptosis-related gene on MS development was explored using single gene GSEA for the functional enrichment analysis. As an advanced analytical method that applies a molecular signature database,30 GSEA can be used to interpret the effects of gene expression using a precision algorithm. Followed by converting gene symbol into Entrez ID using “org.HS.eg.db” R package, GSEA enrichment analysis was carried out using “ClusterProfiler” package of R.
Construction of a ceRNA Network for Hub Pyroptosis-Related Genes in MS
To evaluate the role of hub pyroptosis-related genes in the pathogenesis of MS, we constructed the underlying regulators of the ceRNA network, including messenger RNA (mRNA) transcripts, using hub pyroptosis-related genes and hub pyroptosis-related mRNA. Putative miRNA-mRNA (hub pyroptosis-related genes) pairs were predicted by mapping hub pyroptosis-related genes into the miRWalk database (http://mirwalk.umm.uni-heidelberg.de/)31 and miRNet 2.0 database (https://www.mirnet.ca/miRNet/).32 Overlapping pairs were regarded as the final miRNA-mRNA pairs. Next, the retrieved miRNAs were applied to the predicted lncRNA-miRNA pairs using miRNet 2.0. The parameters were set as “H. sapiens (human)” for organism, “miRBase ID” for ID type, “Not specified” for Tissue (human only), and “lncRNAs” for the targets. The lncRNA-miRNA-mRNA ceRNA network was constructed according to the principle of the ceRNA network, and the ggalluvial R package was used to visualize the network. A hub pyroptosis-related mRNA-related ceRNA co-expression network was constructed using Cytoscape (http://cytoscape.org/; version 3.9.0).33
Results
Immune Cell Infiltration of MS
Analysis using CIBERSORT was performed to determine immune cell infiltration in the controls and MS patients (Figure 2A and B). As shown in the histograms, the proportion of immune cells varied significantly among groups and samples. Naive B cells and monocytes showed relatively high infiltration fractions in control samples (Figure 2A). T cells, including naive CD4+ T cells, memory resting/activity CD4+ T cells, and CD8+ T cells were the primary infiltrating cells in the MS samples (Figure 2B). The violin plot further compared the different distributions of immune cell types between MS patients and controls (Figure 2C). Compared to the control tissues, the proportion of naive CD4+ T cells (P=0.006), resting natural killer (NK) cells (P=0.002), activated mast cells (P=0.022), and neutrophils (P=0.002) was higher in the MS group. Conversely, compared with patients with MS, the controls contained a higher fraction of naive B cells (P<0.001), activated NK cells (P=0.006), activated dendritic cells (P=0.024), and resting mast cells (P<0.001).
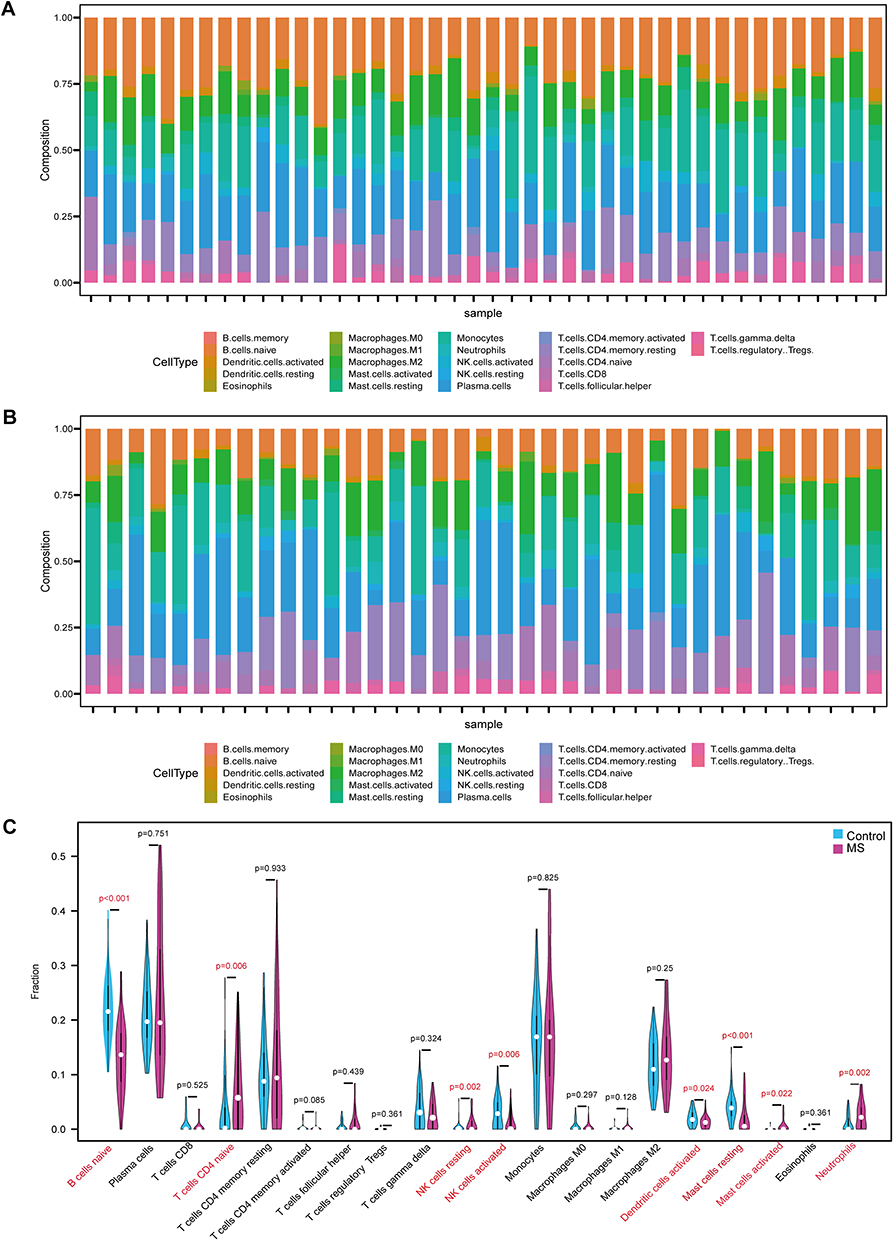 |
Figure 2 Comparing and analyzing the immune cells infiltration in the MS patients and the controls. (A)The fraction of immune cells in each control sample. (B) The fraction of immune cells in each MS sample. Different color of the bars indicated different immune cell populations. The length of the bars indicated the proportions of the immune cell populations, and the sum of the proportion of various immune cell populations in each sample was 1. (C) The difference of immune cell infiltration in gray matter between the MS patients and the controls. The MS group was shown in pink and the control group was shown in blue. |
Analysis of DEGs and Enrichment Pathways
Using volcano plot filtering, we identified genes with statistically significant differences between patients with MS and controls (Figure 3A). Among the top 25 DEGs, the expression values varied markedly between patients with MS and controls, as depicted in the heatmap (Figure 3B).
 |
Figure 3 Differential analysis. (A) The volcano plot was generated to visualize up-regulated differentially expressed genes (DEGs) vs down-regulated DEGs in the MS patients and the controls. (B) The heatmap showed the 25 tops DEG which were related the MS patients and the controls. |
GO function enrichment analysis was performed using GSVA. Most samples were enriched for pathways closely related to transcriptional regulatory mechanisms and ion channels. Examples include transcription regulatory region sequence-specific DNA binding, histone h4 K20 trimethylation, and ligand-gated ion channel signaling pathways. These functions were essential during cell death, whereas they were downregulated during ubiquitin-like protein ligase activity (Figure 4A). KEGG pathway analysis showed that MS exhibited increased activity in the glycosaminoglycan biosynthesis of keratan and heparan sulfate, neuroactive ligand receptor interaction, and biosynthesis of unsaturated fatty acids. In contrast, ubiquitin-mediated proteolysis and autophagy regulation were down-regulated (Figure 4B).
 |
Figure 4 Functional enrichment analysis using GSVA. (A) The top 10 upregulated pathways and top 10 downregulated pathways of GSVA result for GO terms are presented. (B) The top 10 upregulated and downregulated significantly enriched KEGG pathways. Abbreviations: GSVA, Gene set variation analysis; GO, gene ontology; MF, molecular function; BF, biological process; CC, cellular component; KEGG, Kyoto Encyclopedia of Genes and Genomes. |
Identification of Hub Pyroptosis-Related Genes for MS
Using the Venn diagram tool of R software, DEGs and pyroptosis-related genes were intersected and screened for seven DPRGs (Figure S1A). DPRGs were further identified using the LASSO and SVM-RFE algorithms. Five DPRGs were selected using the LASSO algorithm (Figure S1B and S1C) and four DPRGs were selected using SVM-RFE calculations (Figure S1D). Among the identified DPRGs, CASP4, PLCG1, CASP9 and NLRC4 overlapped with the two algorithms and were considered hub candidate PRGs for MS.
Diagnostic Evaluation of Hub PRGs
The ROC curve showed the predictive performance of the four candidate PRGs for patients with MS. Excellent predictive power was indicated by the high AUC values of the hub genes in GSE131282 (CASP4, AUC: 0.954; PLCG1, AUC: 0.932; CASP9, AUC: 0.938; NLRC4, AUC: 0.892) (Figure 5A). The effectiveness of the hub genes was further verified using an independent external validation set: the GSE135511 dataset. Unexpectedly, the NLRC4 of the GSE135511 microarray data was missing because of the absence of probes in the Illumina HumanRef-8 v3.0 expression beadchip. The CASP9 had the greatest AUC (0.865), followed by CASP4 (0.805) and PLCG1 (0.790) (Figure 5B). In general, the diagnostic effectiveness of CASP4, PLCG1 and CASP9 in the training and validation sets was relatively consistent. An unpaired t-test showing the expression levels of hub genes in the two datasets was presented as box plots (Figure S2).
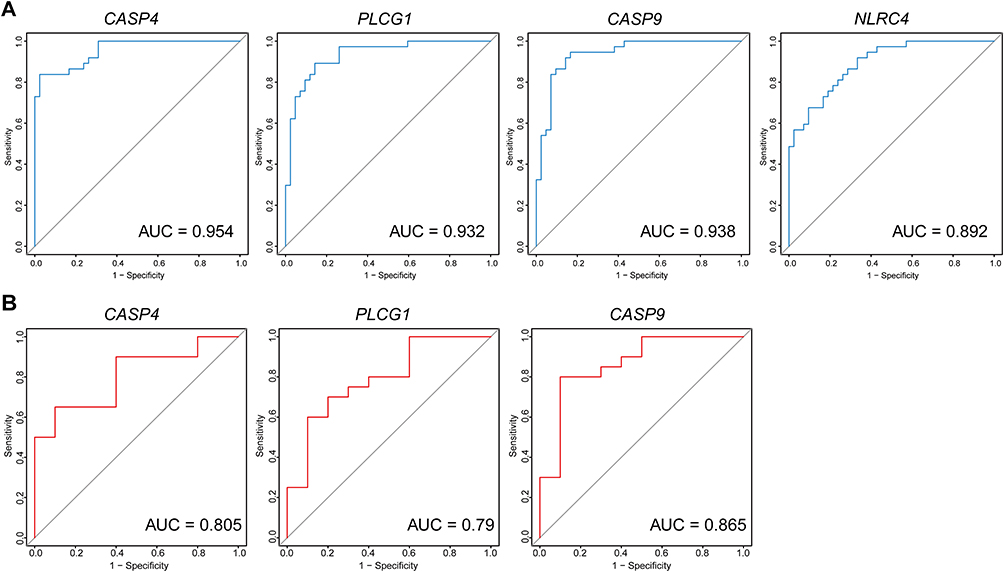 |
Figure 5 The Receiver operating characteristic (ROC) of the hub pyroptosis-related genes for predicting the patients with MS. (A) ROC curve in the training set (GSE131282 dataset). (B) ROC curve analysis of the validation set (GSE135511 dataset). |
In vivo Experimental Validation of Hub Pyroptosis-Related Genes
To ensure the reliability of the diagnostic value of the hub PRGs and to verify their expression levels, we used in vivo experiments for validation. The expression levels of the four hub PRGs were further identified by qRT-PCR in the EAE model of MS. The expression levels of CASP4 and NLRC4 were upregulated in the EAE brain tissues (n=6) compared to those in the controls (n=6). Nevertheless, there was no significant change in the frequency of PLCG1 and CASP9 in the EAE group compared with that in the controls (Figure 6).
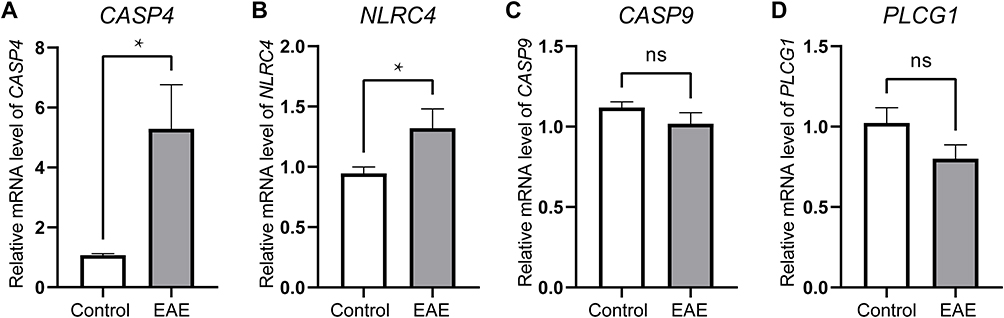 |
Figure 6 Identifying the statistical difference of gene expression estimated by qRT-PCR Assays. Total RNA was isolated from was extracted from cortical tissue of the EAE model (n=6) and the control model (n=6). The expressions of CASP4 (A) and NLRC4 (B) were upregulated in the EAE model compared with the control group (P<0.05). However, the expression of CASP9 (C) and PLCG1 (D) were not statistically significant. *P < 0.05. |
Single-Gene GSEA Enrichment Analysis of CASP4 and NLRC4
The correlation between MS and PRGs was assessed using GSEA enrichment analysis. Five leading upregulated and five downregulated pathways enriched for CASP4 and NLRC4 were identified (Figure 7). CASP4 is closely related to drug metabolism, cytochrome P450, ascorbate and aldarate metabolism, porphyrin metabolism, pentose and glucuronate interconversion, and steroid hormone biosynthesis. The pathways downregulated by CASP4 were concentrated in 2-Oxocarboxylic acid metabolism, DNA replication, mannose-type O-glycan biosynthesis, aminoacyl-tRNA biosynthesis, and mismatch repair. The pathways of NLRC4 showed that allograft rejection, hematopoietic cell lineage, asthma, autoimmune thyroid disease, and S. aureus infection were significantly upregulated. Autophagy, long-term potentiation, RNA polymerase, protein export, and circadian rhythms were negatively regulated.
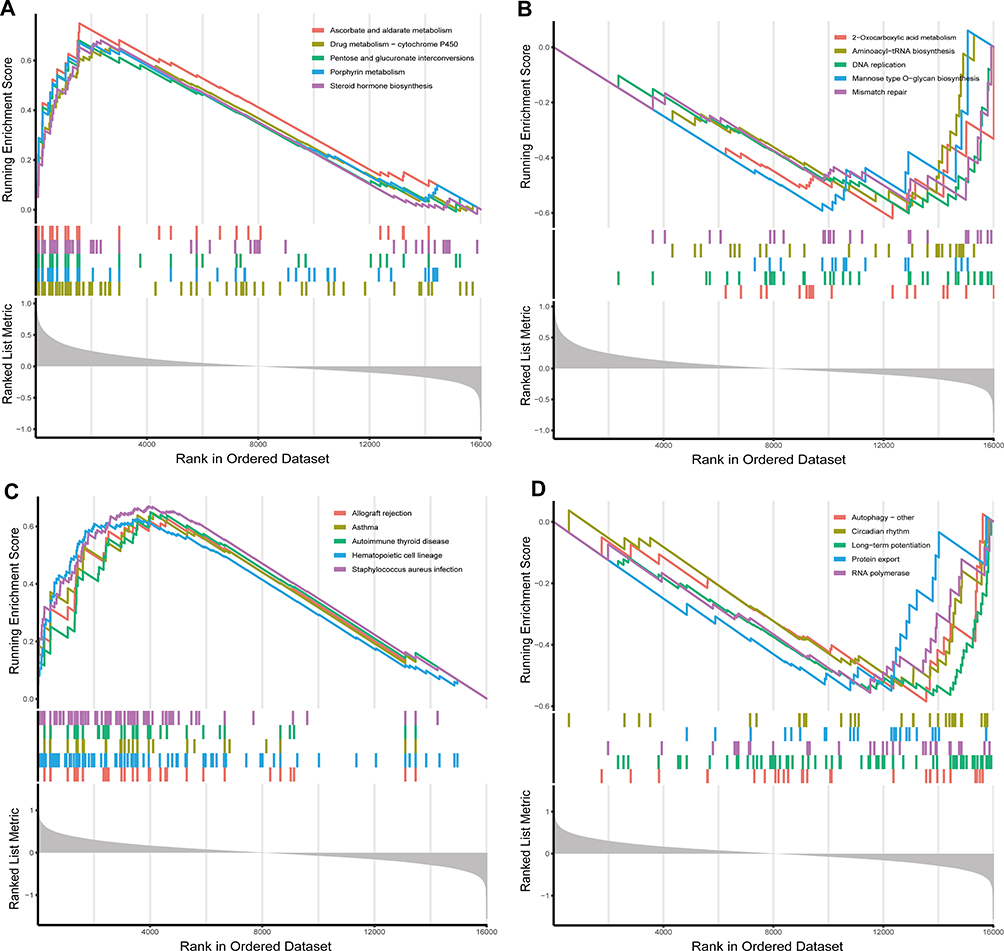 |
Figure 7 Single-gene GSEA pathway analysis of hub pyroptosis-related genes. (A) The five tops significant enriched pathways of CASP4 were ascorbate and aldarate metabolism, steroid hormone biosynthesis, pentose and glucuronate interconversions porphyrin metabolism, and drug metabolism-cytochrome P450. (B) The five tops downregulated pathways of CASP4 were 2-Oxocarboxylic acid metabolism, DNA replication, mannose type O-glycan biosynthesis, aminoacyl-tRNA biosynthesis, and mismatch repair. (C) The five tops significant enriched pathways of NLRC4 were staphylococcus aureus infection, autoimmune thyroid disease, asthma, hematopoietic cell lineage, and allograft rejection. (D) The five tops downregulated pathways of NLRC4 were autophagy-other, long-term potentiation, RNA polymerase, protein export and circadian rhythm. |
Construction of lncRNA-miRNA-mRNA ceRNA Networks for CASP4 and NLRC4 in MS
The miRNA targets of CASP4 and NLRC4 were predicted using a combination of two different databases, including the miRWalk database and miRNet 2.0 (Tables S2–S5). The predicted target miRNAs for CASP4 and NLRC4 were then intersected and overlapping miRNAs were screened as potential target miRNAs for CASP4 and NLRC4. Two target miRNAs of the specifically expressed NLRC4 and 16 target miRNAs of the specifically expressed CASP4 were identified. Based on the predicted miRNAs, we used the miRNet 2.0 database to predict the lncRNAs interacting with the predicted miRNAs (Table S6). lncRNAs with highly interconnected lncRNA-miRNA clusters were selected as target lncRNAs. The nine most predicted lncRNAs were calculated, and their connections in the ceRNA network were illustrated (Figure 8).
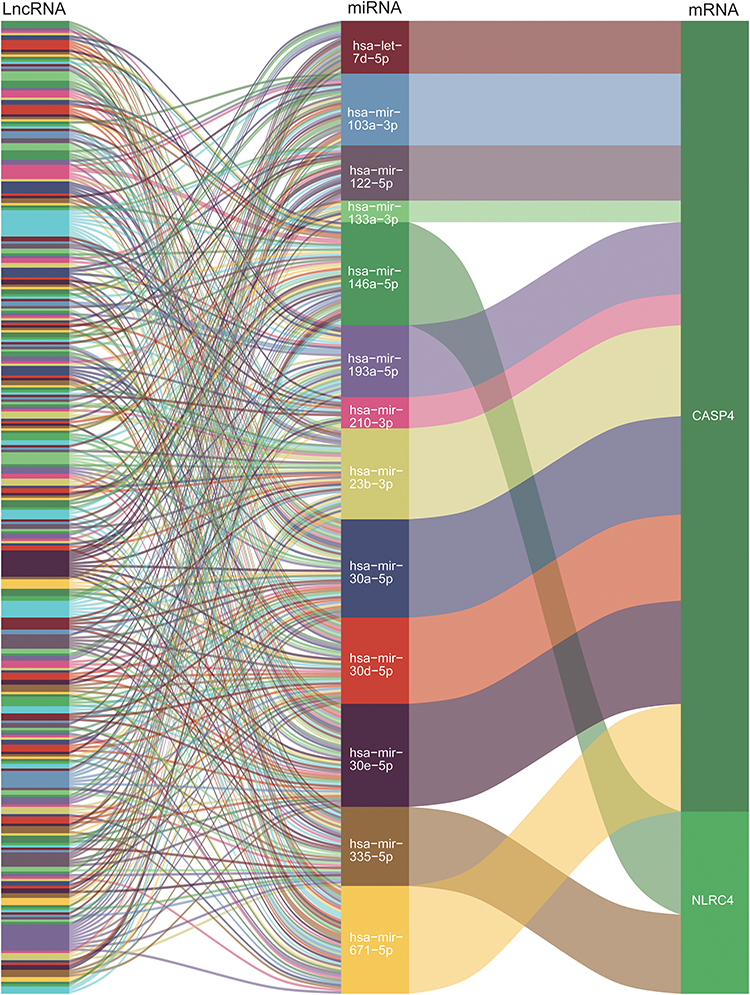 |
Figure 8 Sankey diagram for the competing endogenous RNA (ceRNA) network of the nine top-most predicted lncRNAs. Each rectangle represented a lncRNA/miRNA/gene, and the size of the rectangle represented the connection degree of each lncRNA/miRNA/gene. |
Subsequently, based on the ceRNA hypothesis, the following criteria must be met for upregulated CASP4 and NLRC4 involved in ceRNA regulation: (a) lncRNA-mRNA co-expressed positively, (b) lncRNA-miRNA co-expressed negatively, and (c) miRNA-mRNA co-expressed negatively. Therefore, we conducted a literature search and selected four reported upregulated lncRNAs and six reported downregulated miRNAs in MS to integrate hub pyroptosis-related mRNA-related ceRNA interactions. We proposed that 14 lncRNA-miRNA-mRNA axes of CASP4 and four lncRNA-miRNA-mRNA axes of NLRC4 may play a role in the pathogenesis of pyroptosis in MS: KCNQ1OT1-hsa-let-7d-5p/hsa-mir-103a-3p/hsa-mir-122-5p/hsa-mir-210-3p/hsa-mir-671-5p-CASP4, NEAT1-hsa-let-7d-5p/hsa-mir-103a-3p/hsa-mir-122-5p/hsa-mir-671-5p-CASP4, OIP5-AS1-hsa-let-7d-5p-CASP4, XIST-hsa-let-7d-5p/hsa-mir-103a-3p/hsa-mir-122-5p/hsa-mir-671-5p-CASP4 (Figure 9A), and KCNQ1OT1/NEAT1/OIP5-AS1/XIST-hsa-mir-335-5p-NLRC4 (Figure 9B).
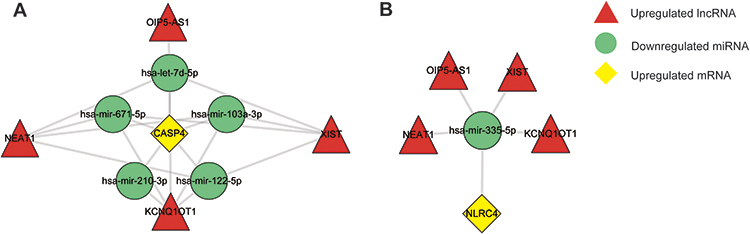 |
Figure 9 The competing endogenous RNA (ceRNA) networks and the potential RNA regulatory pathways of hub pyroptosis-related genes. (A) ceRNA network of mRNA for CASP4. (B) ceRNA network of mRNA for NLRC4. |
Discussion
MS is an immune-mediated disorder characterized by the massive infiltration of immune cells, inflammation, demyelination, and neuronal death in the CNS, yet remains widely under-detected and often misdiagnosed.1,34 Therefore, there is an urgent need to develop novel strategies to diagnose and treat MS.
In this study, we analyzed differences in the level of immune infiltration between patients with MS and controls using CIBERSORT. From the perspective of the overall distribution, T cells were the primary infiltrating cells in the MS samples. Statistically, the proportions of naive CD4+ T cells, resting NK cells, activated mast cells, and neutrophils were significantly higher in the MS group than in the control group, while the proportion of protective cells such as naive B cells and dendritic cells in MS group were significantly lower in the MS group than in the control group. Naive B cells downregulate pro-inflammatory immune responses in MS and dendritic cells play a neuroprotective role in MS.35,36 Naive CD4+ T cells are key players in driving the development of MS.37 Moreover, differentiation from naive CD4+ T cells to Tregs can be suppressed by high-mobility group box-1 protein (HMGB1), which aggravates pyroptosis in lung injury.38 Researchers had demonstrated CX3CR1-expressing NK cells associated with disease activity in MS.39 NK cell granzyme B has also been shown to cleave GSDME and to activate caspase-independent pyroptosis.40 Mast cells are involved in different phases of the development of MS, including contributing to intestinal Th17 differentiation and disruption of the blood-brain barrier (BBB), followed by recruitment of inflammatory immune cells to the CNS.41,42 As a source and target of IL-1β, mast cells express functional inflammasome that can drive pyroptosis.43 Neutrophils possess a large array of effector functions that enables MS pathogenesis, including the release of inflammatory mediators, enzymes, and neutrophil extracellular traps (NETs) as well as the breakdown of the BBB and myelin.44 The excellent prowess of neutrophils is highlighted during pyroptosis, which plays an important role in inflammation.45,46 Therefore, the infiltration of naive CD4+ T cells, resting NK cells, activated mast cells, and neutrophils are likely implicated in pyroptosis during MS progression.
In parallel, we performed functional enrichment analysis using GSVA to search for biological pathways and potential molecular mechanisms that may play key roles in MS. According to the GSVA analysis, transcriptional regulatory mechanisms, ion channels, and keratan sulfate biosynthesis signaling pathways were up-regulated, while biquitin-mediated proteolysis and autophagy regulation were down-regulated in MS. Pyroptosis-related molecules can be indirectly and directly regulated by transcription factors, non-coding RNAs, epigenetic modifications, and post-translational modifications.47 In addition to being essential for cell death regulation, membrane ion channels are believed to be involved in pyroptosis.48 Non-sulfated keratan sulfate may be capable of inducing inflammatory processes, which in turn exacerbates the progression of pyroptosis.49 Ubiquitination plays a dual role in the process of pyroptosis.50,51 Collectively, these results suggest pathways associated with pyroptosis in MS.
To further determine pyroptosis-related molecules in MS, we screened pyroptosis-related genes from DEGs of MS and demonstrated high diagnostic efficiencies in both the GSE131282 and GSE135511 datasets (lowest AUC of 0.790). To obtain more reliable and stable PRGs to diagnose MS, we constructed an EAE model for the experimental validation of the genes. The mRNA expression levels of CASP4 (Caspases‐4) and NLRC4 (nucleotide-binding, leucine-rich repeat (NLR) family caspase activation and recruitment domain (CARD) domain-containing 4) were significantly higher in the EAE group than in the control group. Thus, CASP4 and NLRC4 were considered hub pyroptosis‐related genes to diagnose MS compared to controls.
Pyroptosis occurs upon the activation of proinflammatory caspases, such as CASP4, and the subsequent cleavage of GSDMD,52 resulting in GSDMD N-terminal fragments that form membrane pores to induce cell lysis. According to the GSEA analysis, the upregulated pathways of CASP4 in MS were related to steroid hormone biosynthesis, ascorbate and aldarate metabolism, porphyrin metabolism, pentose and glucuronate interconversions, and drug metabolism-cytochrome P450. These findings are consistent with those of previous studies of pyroptosis. A previous study demonstrated that ascorbate upregulated the expression of CASP1 and promoted inflammasome formation to induce pyroptosis in colorectal carcinoma.53 Disturbance of steroid hormones, steroidogenesis, and gut microbiota dysbiosis-derived macrophage pyroptosis causes polycystic ovary syndrome.54 The downregulated pathways of CASP4 were more concentrated in carbohydrate metabolism, protein biosynthesis, DNA replication, and mismatch repair, which have crucial contributions to cellular processes. The mechanisms of porphyrin metabolism, pentose and glucuronate interconversions, and drug metabolism (cytochrome P450) in pyroptosis are still unclear.
NLRC4 induces pyroptosis by directly activating CASP1, which cleaves the pro-forms of GSDMD and releases inflammatory mediators such as IL-1β and IL-18.55 These molecules can deteriorate MS/EAE by stimulating autoimmune T cells, inducing neural toxicity, and compromising the BBB.12,13,56 According to the GSEA analysis, the pathways of NLRC4 in MS were significantly enriched in staphylococcus aureus (S. aureus) infection, asthma, allograft rejection, autoimmune thyroid disease, and hematopoietic cell lineage. Studies have confirmed that intracellular S. aureus triggers pyroptosis in host cells.57 Airway epithelial damage can induce pyroptosis.58 Allograft rejection liberates pathogen-associated molecular patterns and damage-associated molecular patterns, which causes caspase-1 cleavage of pro-IL-1β into mature IL-1β and pyroptosis.59 Multiple inflammasomes mediate cytokine secretion and pyroptosis in autoimmune thyroid disease.60 However, autophagy, long-term potentiation, RNA polymerase, protein export, and circadian rhythm were the negatively regulated pathways of NLRC4. The aberrant export and biochemical processes in MS may be affected by the dysregulation of NLRC4.
To screen out and unveil a systematic regulatory network of the pyroptosis-related CASP4 and NRLC4 in MS, we carried out a literature review to identify lncRNAs and miRNAs in MS. Among the target lncRNAs obtained from the database, four lncRNAs, namely KCNQ1OT1,61 NEAT,61,62 1OIP5-AS163 and XIST,64 were reportedly upregulated in MS. Furthermore, six miRNAs among the target miRNAs of CASP4 and NRLC4 were shown to be downregulated in MS: hsa-let-7d-5p, hsa-mir-103a-3p, hsa-mir-122-5p, hsa-mir-210-3p, hsa-mir-335-5p, and hsa-mir-671-5p.65–67 According to the ceRNA hypothesis, ceRNA networks interact with hub pyroptosis-related mRNA CASP4 and NRLC4. We hypothesize that KCNQ1OT1-hsa-let-7d-5p/hsa-mir-103a-3p/hsa-mir-122-5p/hsa-mir-210-3p/hsa-mir-671-5p-CASP4, NEAT1-hsa-let-7d-5p/hsa-mir-103a-3p/hsa-mir-122-5p/hsa-mir-671-5p-CASP4, OIP5-AS1-hsa-let-7d-5p-CASP4, XIST-hsa-let-7d-5p/hsa-mir-103a-3p/hsa-mir-122-5p/hsa-mir-671-5p-CASP4 and KCNQ1OT1/NEAT1/OIP5-AS1/XIST-hsa-mir-335-5p-NLRC4 might serve pivotal regulatory roles in MS. These correlations implied that CASP4 and NRLC4 mediated pyroptosis in MS pathogenesis and they were also regulated by complex interaction networks. The nodes of the networks could be targets for novel drug development for MS. However, further studies are warranted to confirm these correlations.
This study has some limitations. First, the expression levels of biomarkers such as CASP9 and PLCG1 may require further verification in clinical samples. Second, a comprehensive characterization of the ceRNA networks was not performed; which should be explored in future work. Finally, heterogeneous data integration, MS type, sample selection biases, and other characteristics may impact the generalization of the findings. Therefore, these results should be cautiously interpreted and further validation through human studies is hence necessary.
Conclusion
In addition to the well-known T/B cells theory, the occurrence of MS is related to immune infiltration by naive CD4+ T cells, resting NK cells, activated mast cells, and neutrophils. CASP4 and NLRC4 appear to be key mediators of pyroptosis in MS and have been implicated in a variety of biological processes and are regulated by complex ceRNA networks. CASP4 and NLRC4 were screened as novel biomarkers for distinguishing patients with MS from controls. Pathological immune infiltration and regulatory mechanisms of pyroptosis-related genes could be novel entry points for MS drug development. There are still many gaps in our knowledge regarding immune infiltration and the role of pyroptosis in MS. Sample selection biases and potential uncertainties in the data analysis may have influenced the conclusions. Therefore, further studies are warranted to validate these findings.
Abbreviations
aCD20, Anti-CD20; AUC, area under the ROC curve; BBB, blood brain barrier; CASP1, caspase-1; CASP4, Caspases‐4; ceRNAs, competing endogenous RNAs; CFA, complete Freund’s adjuvant; CNS, central nervous system; DEGs, differentially expressed genes; DPRGs, differentially expressed pyroptosis-related genes; EAE, experimental autoimmune encephalomyelitis; GO, gene ontology; GSDMD, gasdermin D; GSDME, gasdermin E; GSEA, Gene Set Enrichment Analysis; GSVA, Gene set variation analysis; HMGB1, high mobility group box-1 protein; IL-1β, Interleukin-1β; KEGG, Kyoto Encyclopedia of Genes and Genomes; LASSO, least absolute shrinkage and selection operator; lncRNAs, long non-coding RNAs; miRNAs, microRNAs; mRNA, messenger RNA; MS, multiple sclerosis; NETs, neutrophil extracellular traps; NLRC4, Nucleotide-binding leucine-rich repeat (NLR) family caspase activation and recruitment domain (CARD) domain containing 4; PRGs, pyroptosis-related genes; qRT-PCR, quantitative reverse transcriptase polymerase chain reaction; ROC, receiver operating characteristics curve; S. aureus, staphylococcus aureus; SVM-RFE, support vector machine recursive feature elimination.
Data Sharing Statement
All data in this study were obtained from the corresponding authors. The datasets supporting the conclusions of this study are available in the Gene Expression Omnibus (GEO, http://www.ncbi.nlm.nih.gov/geo/) repository and are included within the article and additional files.
Ethics Approval and Informed Consent
All procedures performed in studies involving animal experiments were approved by the Ethics Committee of the First Affiliated Hospital of Chongqing Medical University (Permit No: K2023-095) and were carried out in compliance with Guide for the Care and Use of Laboratory Animals, published by the National Institutes of Health.
Acknowledgments
We sincerely acknowledge Lukas Simon Enz, Roberta Magliozzi, and their colleagues for aggregating and uploading the GSE131282 and GSE135511 microarray datasets into the GEO repository.
Author Contributions
All authors made a significant contribution to the work reported, whether that is in the conception, study design, execution, acquisition of data, analysis and interpretation, or in all these areas; participating in drafting, revising, or reviewing articles; finally approving the version to be published; agreeing to the journals in which the article has been submitted; and agreeing to be responsible for all aspects of the work.
Disclosure
The authors report no conflicts of interest in this work.
References
1. Ashraf H, Solla P, Sechi LA. Current advancement of immunomodulatory drugs as potential pharmacotherapies for autoimmunity based neurological diseases. Pharmaceuticals. 2022;15:1077. doi:10.3390/ph15091077
2. Shinoda K, Li R, Rezk A, et al. Differential effects of anti-CD20 therapy on CD4 and CD8 T cells and implication of CD20-expressing CD8 T cells in MS disease activity. Proc Natl Acad Sci U S A. 2023;120:e2207291120. doi:10.1073/pnas.2207291120
3. Wiendl H, Schmierer K, Hodgkinson S, et al. Specific patterns of immune cell dynamics may explain the early onset and prolonged efficacy of cladribine tablets: a MAGNIFY-MS substudy. Neurol Neuroimmunol Neuroinflamm. 2023;10:e200048. doi:10.1212/NXI.0000000000200048
4. Gan J, Huang M, Lan G, et al. High glucose induces the loss of retinal pericytes partly via NLRP3-Caspase-1-GSDMD-mediated pyroptosis. Biomed Res Int. 2020;2020:4510628. doi:10.1155/2020/4510628
5. Zhang D, Li Y, Du C, et al. Evidence of pyroptosis and ferroptosis extensively involved in autoimmune diseases at the single-cell transcriptome level. J Transl Med. 2022;20:363. doi:10.1186/s12967-022-03566-6
6. Xu D, Ji Z, Qiang L. Molecular characteristics, clinical implication, and cancer immunity interactions of pyroptosis-related genes in breast cancer. Front Med. 2021;8:702638. doi:10.3389/fmed.2021.702638
7. Taabazuing CY, Okondo MC, Bachovchin DA. Pyroptosis and apoptosis pathways engage in bidirectional crosstalk in monocytes and macrophages. Cell Chem Biol. 2017;24:507–514.e504. doi:10.1016/j.chembiol.2017.03.009
8. Shi J, Gao W, Shao F. Pyroptosis: gasdermin-mediated programmed necrotic cell death. Trends Biochem Sci. 2017;42:245–254. doi:10.1016/j.tibs.2016.10.004
9. Sborgi L, Rühl S, Mulvihill E, et al. GSDMD membrane pore formation constitutes the mechanism of pyroptotic cell death. EMBO j. 2016;35:1766–1778. doi:10.15252/embj.201694696
10. Zhang Y, Chen X, Gueydan C, et al. Plasma membrane changes during programmed cell deaths. Cell Res. 2018;28:9–21. doi:10.1038/cr.2017.133
11. McKenzie BA, Dixit VM, Power C. Fiery cell death: pyroptosis in the central nervous system. Trends Neurosci. 2020;43:55–73. doi:10.1016/j.tins.2019.11.005
12. Barclay W, Shinohara ML. Inflammasome activation in multiple sclerosis and experimental autoimmune encephalomyelitis (EAE). Brain Pathol. 2017;27:213–219. doi:10.1111/bpa.12477
13. McKenzie BA, Mamik MK, Saito LB, et al. Caspase-1 inhibition prevents glial inflammasome activation and pyroptosis in models of multiple sclerosis. Proc Natl Acad Sci U S A. 2018;115:E6065–e6074. doi:10.1073/pnas.1722041115
14. Liu ZK, Wu KF, Zhang RY, et al. Pyroptosis-Related LncRNA signature predicts prognosis and is associated with immune infiltration in hepatocellular carcinoma. Front Oncol. 2022;12:794034. doi:10.3389/fonc.2022.794034
15. Goris A, Vandebergh M, McCauley JL, et al. Genetics of multiple sclerosis: lessons from polygenicity. Lancet Neurol. 2022;21:830–842. doi:10.1016/S1474-4422(22)00255-1
16. Nussbaum YI, Manjunath Y, Suvilesh KN, et al. Current and prospective methods for assessing anti-tumor immunity in colorectal cancer. Int J Mol Sci. 2021;22:4802. doi:10.3390/ijms22094802
17. Nie H, Yan C, Zhou W, et al. Analysis of immune and inflammation characteristics of atherosclerosis from different sample sources. Oxid Med Cell Longev. 2022;2022:5491038. doi:10.1155/2022/5491038
18. Qiu K, Zeng T, Liao Y, et al. Identification of inflammation-related biomarker Pro-ADM for male patients with gout by comprehensive analysis. Front Immunol. 2021;12:798719. doi:10.3389/fimmu.2021.798719
19. Yao XQ, Chen JY, Yu ZH, et al. Bioinformatics analysis identified apolipoprotein E as a hub gene regulating neuroinflammation in macrophages and microglia following spinal cord injury. Front Immunol. 2022;13:964138. doi:10.3389/fimmu.2022.964138
20. Lu Y, Li K, Hu Y, et al. Expression of immune related genes and possible regulatory mechanisms in alzheimer’s disease. Front Immunol. 2021;12:768966. doi:10.3389/fimmu.2021.768966
21. Enz LS, Zeis T, Schmid D, et al. Increased HLA-DR expression and cortical demyelination in MS links with HLA-DR15. Neurol Neuroimmunol Neuroinflamm. 2020;7:e656. doi:10.1212/NXI.0000000000000656
22. Magliozzi R, Howell OW, Durrenberger P, et al. Meningeal inflammation changes the balance of TNF signalling in cortical grey matter in multiple sclerosis. J Neuroinflammation. 2019;16:259. doi:10.1186/s12974-019-1650-x
23. Newman AM, Liu CL, Green MR, et al. Robust enumeration of cell subsets from tissue expression profiles. Nat Methods. 2015;12:453–457. doi:10.1038/nmeth.3337
24. Liberzon A, Birger C, Thorvaldsdóttir H, et al. The molecular signatures database (MSigDB) hallmark gene set collection. Cell Syst. 2015;1:417–425. doi:10.1016/j.cels.2015.12.004
25. Hänzelmann S, Castelo R, Guinney J. GSVA: gene set variation analysis for microarray and RNA-seq data. BMC Bioinform. 2013;14:7. doi:10.1186/1471-2105-14-7
26. Ye Y, Dai Q, Qi H. A novel defined pyroptosis-related gene signature for predicting the prognosis of ovarian cancer. Cell Death Discov. 2021;7:71. doi:10.1038/s41420-021-00451-x
27. Karki R, Kanneganti TD. Diverging inflammasome signals in tumorigenesis and potential targeting. Nat Rev Cancer. 2019;19:197–214. doi:10.1038/s41568-019-0123-y
28. Tang Y, Liang M, Tao L, et al. Machine learning-based diagnostic evaluation of shear-wave elastography in BI-RADS category 4 breast cancer screening: a multicenter, retrospective study. Quant Imaging Med Surg. 2022;12:1223–1234. doi:10.21037/qims-21-341
29. Xie R, Liu L, Lu X, et al. Identification of the diagnostic genes and immune cell infiltration characteristics of gastric cancer using bioinformatics analysis and machine learning. Front Genet. 2022;13:1067524. doi:10.3389/fgene.2022.1067524
30. Subramanian A, Tamayo P, Mootha VK, et al. Gene set enrichment analysis: a knowledge-based approach for interpreting genome-wide expression profiles. Proc Natl Acad Sci U S A. 2005;102:15545–15550. doi:10.1073/pnas.0506580102
31. Sticht C, De La Torre C, Parveen A, et al. miRWalk: an online resource for prediction of microRNA binding sites. PLoS One. 2018;13:e0206239. doi:10.1371/journal.pone.0206239
32. Yeh IJ, Liu KT, Shen JH, et al. Identification of the potential prognostic markers from the miRNA-lncRNA-mRNA interactions for metastatic renal cancer via next-generation sequencing and bioinformatics. Diagnostics. 2020;10:228. doi:10.3390/diagnostics10040228
33. Shannon P, Markiel A, Ozier O, et al. Cytoscape: a software environment for integrated models of biomolecular interaction networks. Genome Res. 2003;13:2498–2504. doi:10.1101/gr.1239303
34. Grajchen E, Hendriks JJA, Bogie JFJ. The physiology of foamy phagocytes in multiple sclerosis. Acta Neuropathol Commun. 2018;6:124. doi:10.1186/s40478-018-0628-8
35. Bar-Or A, Li R. Cellular immunology of relapsing multiple sclerosis: interactions, checks, and balances. Lancet Neurol. 2021;20:470–483. doi:10.1016/S1474-4422(21)00063-6
36. Piacente F, Bottero M, Benzi A, et al. Neuroprotective potential of dendritic cells and sirtuins in multiple sclerosis. Int J Mol Sci. 2022;23:4352. doi:10.3390/ijms23084352
37. Jensen IJ, Jensen SN, Sjaastad FV, et al. Sepsis impedes EAE disease development and diminishes autoantigen-specific naive CD4 T cells. Elife. 2020;9. doi:10.7554/eLife.55800
38. Xie K, Chen YQ, Chai YS, et al. HMGB1 suppress the expression of IL-35 by regulating Naïve CD4+ T cell differentiation and aggravating Caspase-11-dependent pyroptosis in acute lung injury. Int Immunopharmacol. 2021;91:107295. doi:10.1016/j.intimp.2020.107295
39. Hamann I, Unterwalder N, Cardona AE, et al. Analyses of phenotypic and functional characteristics of CX3CR1-expressing natural killer cells. Immunology. 2011;133:62–73. doi:10.1111/j.1365-2567.2011.03409.x
40. Zhang Z, Zhang Y, Xia S, et al. Gasdermin E suppresses tumour growth by activating anti-tumour immunity. Nature. 2020;579:415–420. doi:10.1038/s41586-020-2071-9
41. Pinke KH, Zorzella-Pezavento SFG, Lara VS, et al. Should mast cells be considered therapeutic targets in multiple sclerosis? Neural Regen Res. 2020;15:1995–2007. doi:10.4103/1673-5374.282238
42. Ribatti D, Tamma R, Annese T. Mast cells and angiogenesis in multiple sclerosis. Inflamm Res. 2020;69:1103–1110. doi:10.1007/s00011-020-01394-2
43. Bonnekoh H, Scheffel J, Kambe N, et al. The role of mast cells in autoinflammation. Immunol Rev. 2018;282:265–275. doi:10.1111/imr.12633
44. De Bondt M, Hellings N, Opdenakker G, et al. Neutrophils: underestimated players in the pathogenesis of multiple sclerosis (MS). Int J Mol Sci. 2020;21:4558. doi:10.3390/ijms21124558
45. de Bont CM, Boelens WC, Pruijn GJM. NETosis, complement, and coagulation: a triangular relationship. Cell Mol Immunol. 2019;16:19–27. doi:10.1038/s41423-018-0024-0
46. Dubyak GR, Miller BA, Pearlman E. Pyroptosis in neutrophils: multimodal integration of inflammasome and regulated cell death signaling pathways. Immunol Rev. 2023;314:229–249. doi:10.1111/imr.13186
47. Wen R, Liu YP, Tong XX, et al. Molecular mechanisms and functions of pyroptosis in sepsis and sepsis-associated organ dysfunction. Front Cell Infect Microbiol. 2022;12:962139. doi:10.3389/fcimb.2022.962139
48. Kunzelmann K. Ion channels in regulated cell death. Cell Mol Life Sci. 2016;73:2387–2403. doi:10.1007/s00018-016-2208-z
49. Zheng T, Zhao C, Zhao B, et al. Impairment of the autophagy-lysosomal pathway and activation of pyroptosis in macular corneal dystrophy. Cell Death Discov. 2020;6:85. doi:10.1038/s41420-020-00320-z
50. Shi Y, Yang Y, Xu W, et al. E3 ubiquitin ligase SYVN1 is a key positive regulator for GSDMD-mediated pyroptosis. Cell Death Dis. 2022;13:106. doi:10.1038/s41419-022-04553-x
51. Zhang Y, Liu W, Zhong Y, et al. Metformin corrects glucose metabolism reprogramming and NLRP3 inflammasome-induced pyroptosis via inhibiting the TLR4/NF-κB/PFKFB3 signaling in trophoblasts: implication for a potential therapy of preeclampsia. Oxid Med Cell Longev. 2021;2021:1806344. doi:10.1155/2021/1806344
52. Downs KP, Nguyen H, Dorfleutner A, et al. An overview of the non-canonical inflammasome. Mol Aspects Med. 2020;76:100924. doi:10.1016/j.mam.2020.100924
53. Tian W, Wang Z, Tang NN, et al. Ascorbic acid sensitizes colorectal carcinoma to the cytotoxicity of arsenic trioxide via promoting reactive oxygen species-dependent apoptosis and pyroptosis. Front Pharmacol. 2020;11:123. doi:10.3389/fphar.2020.00123
54. Huang J, Chen P, Xiang Y, et al. Gut microbiota dysbiosis-derived macrophage pyroptosis causes polycystic ovary syndrome via steroidogenesis disturbance and apoptosis of granulosa cells. Int Immunopharmacol. 2022;107:108717. doi:10.1016/j.intimp.2022.108717
55. Freeman L, Guo H, David CN, et al. NLR members NLRC4 and NLRP3 mediate sterile inflammasome activation in microglia and astrocytes. J Exp Med. 2017;214:1351–1370. doi:10.1084/jem.20150237
56. Shao S, Chen C, Shi G, et al. Therapeutic potential of the target on NLRP3 inflammasome in multiple sclerosis. Pharmacol Ther. 2021;227:107880. doi:10.1016/j.pharmthera.2021.107880
57. Pastar I, Sawaya AP, Marjanovic J, et al. Intracellular Staphylococcus aureus triggers pyroptosis and contributes to inhibition of healing due to perforin-2 suppression. J Clin Invest. 2021;131. doi:10.1172/JCI133727
58. Sun J, Li Y. Pyroptosis and respiratory diseases: a review of current knowledge. Front Immunol. 2022;13:920464. doi:10.3389/fimmu.2022.920464
59. Weigt SS, Palchevskiy V, Belperio JA. Inflammasomes and IL-1 biology in the pathogenesis of allograft dysfunction. J Clin Invest. 2017;127:2022–2029. doi:10.1172/JCI93537
60. Guo Q, Wu Y, Hou Y, et al. Cytokine secretion and pyroptosis of thyroid follicular cells mediated by enhanced NLRP3, NLRP1, NLRC4, and AIM2 Inflammasomes are associated with autoimmune thyroiditis. Front Immunol. 2018;9:1197. doi:10.3389/fimmu.2018.01197
61. Karimi E, Azari H, Tahmasebi A, et al. LncRNA-miRNA network analysis across the Th17 cell line reveals biomarker potency of lncRNA NEAT1 and KCNQ1OT1 in multiple sclerosis. J Cell Mol Med. 2022;26:2351–2362. doi:10.1111/jcmm.17256
62. Dastmalchi R, Ghafouri-Fard S, Omrani MD, et al. Dysregulation of long non-coding RNA profile in peripheral blood of multiple sclerosis patients. Mult Scler Relat Disord. 2018;25:219–226. doi:10.1016/j.msard.2018.07.044
63. Gharesouran J, Taheri M, Sayad A, et al. Integrative analysis of OIP5-AS1/HUR1 to discover new potential biomarkers and therapeutic targets in multiple sclerosis. J Cell Physiol. 2019;234:17351–17360. doi:10.1002/jcp.28355
64. Ding Y, Li T, Yan X, et al. Identification of hub lncRNA ceRNAs in multiple sclerosis based on ceRNA mechanisms. Mol Genet Genomics. 2021;296:423–435. doi:10.1007/s00438-020-01750-1
65. Gandhi R, Healy B, Gholipour T, et al. Circulating microRNAs as biomarkers for disease staging in multiple sclerosis. Ann Neurol. 2013;73:729–740. doi:10.1002/ana.23880
66. Piket E, Zheleznyakova GY, Kular L, et al. Small non-coding RNAs as important players, biomarkers and therapeutic targets in multiple sclerosis: a comprehensive overview. J Autoimmun. 2019;101:17–25. doi:10.1016/j.jaut.2019.04.002
67. Selmaj I, Cichalewska M, Namiecinska M, et al. Global exosome transcriptome profiling reveals biomarkers for multiple sclerosis. Ann Neurol. 2017;81:703–717. doi:10.1002/ana.24931
 © 2023 The Author(s). This work is published and licensed by Dove Medical Press Limited. The
full terms of this license are available at https://www.dovepress.com/terms
and incorporate the Creative Commons Attribution
- Non Commercial (unported, 3.0) License.
By accessing the work you hereby accept the Terms. Non-commercial uses of the work are permitted
without any further permission from Dove Medical Press Limited, provided the work is properly
attributed. For permission for commercial use of this work, please see paragraphs 4.2 and 5 of our Terms.
© 2023 The Author(s). This work is published and licensed by Dove Medical Press Limited. The
full terms of this license are available at https://www.dovepress.com/terms
and incorporate the Creative Commons Attribution
- Non Commercial (unported, 3.0) License.
By accessing the work you hereby accept the Terms. Non-commercial uses of the work are permitted
without any further permission from Dove Medical Press Limited, provided the work is properly
attributed. For permission for commercial use of this work, please see paragraphs 4.2 and 5 of our Terms.
Recommended articles
DOCK4 as a Potential Biomarker Associated with Immune Infiltration in Stomach Adenocarcinoma: A Database Analysis
Lu Y, Yu J, Dong Q, Du Y, Liang Z
International Journal of General Medicine 2022, 15:6127-6143
Published Date: 11 July 2022
Prediction of Diagnostic Gene Biomarkers Associated with Immune Infiltration for Basal Cell Carcinoma
Xie D, Chen X, Wu H, Ning D, Cao X, Wan C
Clinical, Cosmetic and Investigational Dermatology 2022, 15:2657-2673
Published Date: 13 December 2022
Expression Profile of Pyroptosis-Related Genes and the Associated Regulatory Axis in Primary Gout Patients
Niu S, Lei TY, Dai F, Xie H, Yu X, Zhang Q, Qing Y
Journal of Inflammation Research 2023, 16:1711-1725
Published Date: 19 April 2023
Role of Kinetochore Scaffold 1 (KNL1) in Tumorigenesis and Tumor Immune Microenvironment in Pan-Cancer: Bioinformatics Analyses and Validation of Expression
Ding Y, Wang K, Zhao S, Li Y, Qiu W, Zhu C, Wang Y, Dong C, Liu J, Lu Y, Qi W
International Journal of General Medicine 2023, 16:4883-4906
Published Date: 31 October 2023
Single-Cell Sequencing Combined with Transcriptome Sequencing Constructs a Predictive Model of Key Genes in Multiple Sclerosis and Explores Molecular Mechanisms Related to Cellular Communication
Hu F, Zhu Y, Tian J, Xu H, Xue Q
Journal of Inflammation Research 2024, 17:191-210
Published Date: 9 January 2024