Back to Archived Journals » Integrated Blood Pressure Control » Volume 15
Hypertension and Its Associated Factors Among Long-Distance Truck Drivers in Ethiopia
Authors Rike ME ![]() , Diress M
, Diress M ![]() , Dagnew B
, Dagnew B ![]() , Getnet M
, Getnet M ![]() , Hasano Kebalo A, Sinamaw D
, Hasano Kebalo A, Sinamaw D ![]() , Solomon D
, Solomon D ![]() , Akalu Y
, Akalu Y ![]()
Received 9 February 2022
Accepted for publication 15 June 2022
Published 21 June 2022 Volume 2022:15 Pages 67—79
DOI https://doi.org/10.2147/IBPC.S361789
Checked for plagiarism Yes
Review by Single anonymous peer review
Peer reviewer comments 3
Editor who approved publication: Dr Konstantinos Tziomalos
Mohammed Ebrahim Rike,1 Mengistie Diress,2 Baye Dagnew,2 Mihret Getnet,2 Abbul Hasano Kebalo,1 Derese Sinamaw,3 Damtew Solomon,1 Yonas Akalu2
1Department of Biomedical Science, School of Medicine, College of Medicine and Health Sciences, Madda Walabu University, Bale Robe, Oromia, Ethiopia; 2Department of Human Physiology, School of Medicine, College of Medicine and Health Sciences, University of Gondar, Gondar, Amhara, Ethiopia; 3Department of Biomedical Science, School of Medicine, College of Medicine and Health Sciences, Debre Markos University, Debre Markos, Amhara, Ethiopia
Correspondence: Mohammed Ebrahim Rike, Department of Biomedical Science, School of Medicine, College of Medicine and Health Sciences, Madda Walabu University, Bale Robe, Ethiopia, Tel +251920071361, Email [email protected]
Introduction: Hypertension is rising globally and is one of the leading causes of cardiovascular disease. It affects people of different groups; however, owing to a rise in a sedentary lifestyle it is more prevalent among long-distance truck drivers. However, the prevalence of hypertension and its associated factors among truck drivers in Ethiopia is not known. Therefore, this study aimed to determine the prevalence of hypertension and its associated factors among long-distance truck drivers in Ethiopia.
Methods: A cross-sectional study was conducted among 415 long-distance truck drivers selected by systematic random sampling technique at Modjo dry port from May 15 to 30, 2021. The data were collected and entered into Epi-data 4.6 then it was exported to SPSS version 25 for analysis. Descriptive statistics, bivariable, and multivariable logistic regression analyses were executed. The odds ratio with a 95% confidence interval was computed. In the final model, a variable with a p ≤ 0.05 was declared as a predictor of hypertension.
Results: The prevalence of hypertension among long-distance truck drivers in Ethiopia was 34.7%. The odds of hypertension was higher among drivers who were ≥ 45 years old [Adjusted odds ratio (AOR) = 4.32; 95% Confidence interval (CI): 2.16, 8.62], obese [AOR= 5.12; 95% CI: 1.33, 19.8], alcohol drinkers [AOR=3.05; 95% CI: 1.27, 7.31], and cigarette smokers [AOR= 3.74; 95% CI: 1.64, 8.51]. Drivers who had regular physical exercise were less likely [AOR=0.33; 95% CI: 0.17, 0.63] to have hypertension than drivers with no physical activity.
Conclusion: More than a third of the participants in Ethiopia had hypertension. Higher age, obesity, absence of rest between driving, short sleep duration, smoking, alcohol drinking, and physical inactivity were significantly associated with hypertension. Therefore, health education on lifestyle modifications, sleep habits, and the importance of rest breaks between driving should be considered to prevent hypertension and further complications.
Keywords: hypertension, long-distance truck drivers, Ethiopia
Introduction
Hypertension (HTN) is a long-term medical condition, characterized by persistently increased resting blood pressure,1 clinically defined as systolic blood pressure (SBP) of 140 mmHg and/or diastolic blood pressure (DBP) of 90 mmHg and above.2 Its etiology is still not fully understood in most (90–95%) of cases, named essential hypertension.3 The remaining 5–10% of cases are categorized as secondary hypertension, defined as high blood pressure due to identifiable causes.4 Hypertension typically does not cause symptoms.5 Long-term hypertension, however, can damage the arterial walls and leads to several consequences involving the heart, brain, kidney, and eye.2,6,7
As the world health organization (WHO) estimates, approximately 1.13 billion (22%) of the world’s adult population are affected by hypertension in 2019, with the peak levels in Africa (27%) and the lowest in America (18%). One in four men and one in five women of the world population are hypertensive with a higher incidence (2/3th) among adults in low and middle-income countries (LMICs).7 In Ethiopia, more than 21% of people are estimated to have hypertension and more than 50% of these individuals were not aware of their blood pressure status.8
Hypertension affects people of different groups, however, owing to the rise in a sedentary lifestyle, and other risk factors such as diabetes mellitus, obesity, and a family history of similar illness, hypertension is more prevalent among long-distance truck drivers.2,9 Many truckers use fast foods, snacks, and alcoholic beverages from hotels after extended periods of driving with little or no physical activity.9–11 As a consequence of this forced sedentarism and other factors, long-distance truckers are at high risk of developing hypertension.11,12 Moreover, studies conducted in Iran, Brazil, and Pakistan among drivers showed that drivers have an increased risk of hypertension.13–15
Globally, according to one meta-analysis, the prevalence of hypertension among truck drivers is higher (34%) than in the general population (22%).7,16 A higher incidence of hypertension was also observed among long-distance drivers in South Africa (36%),17 Ghana (38.7%),18 and Nigeria (39.7%).19
Poorly controlled hypertension may interfere with work activities and brings economic dependency if they terminate their work despite the increased cost of medication and family care.20 Besides, drivers may also be accidentally affected by cardiovascular and cerebrovascular complications.6,21–23 These can result in fatal road accidents if they happen while driving.24
Many researchers have identified several potential factors that were associated with HTN among long-distance truck drivers, these include socio-demographic factors like age, income, marital status, family history of HTN,25–27 and lifestyle factors linked to smoking, alcohol drinking, physical activity, and duration of sleep as well as the existence of comorbidities like overweight, obesity, and diabetes.13,18,19 Linked to these findings, lifestyle interventions that are increasingly gaining attention, have been strongly recommended by different health organizations.2,7 The intervention involves daily physical activity, reduction of substance use and body weight, correcting eating habits, and promotion of appropriate sleep patterns coupled with circadian entrainment.28
Various works of literature tried a lot to assess the prevalence and determinant factors of hypertension among drivers worldwide.16 However, in Ethiopia, most of the works of literature focused on the general population8,29,30 or among non-driver sections of the population.31–33 To the best of our knowledge, nothing is known about hypertension and its associated factors among long-distance truck drivers in Ethiopia, while they are one of the most vulnerable groups of people.
This is the first attempt to explore simultaneously, the association between hypertension and factors such as sociodemographic, anthropometric, and lifestyle indicators among long-distance truck drivers. Early recognition of at-risk individuals will promote timely intervention and foster the efforts of cardiovascular disease prevention. This study aimed to determine the prevalence of hypertension and its associated factors among long-distance truck drivers in Ethiopia.
Methods and Materials
Study Setting, Design, and Period
This institution-based cross-sectional study was carried out at Modjo Dry Port from May 15 to 30, 2021. Modjo Dry Port is the first port established at the end of 2009 to relieve the congestion in the Djibouti port. It is located in central Ethiopia, 73 km from Addis Ababa, and is connected to the new Ethio-Djibouti Railway line. The port has a vital role in the Ethiopian-Djibouti trade corridor; it handles about 95% of Ethiopia’s trades. Based on information obtained from the port management about 4 to 5 thousand truckers are serving in transporting goods and raw materials between ports.34
Population and Eligibility Criteria
All long-distance truck drivers at Modjo dry port in Ethiopia were considered as source populations whereas truck drivers who came to Modjo Dry Port during the study period were considered as the study population and were included.
Sample Size Determination and Sampling Technique
The sample size was determined using the single population proportion formula, with the following assumptions: the magnitude of hypertension (p) 50%, the margin of error (d) 5%, reliability coefficient (Zα/2) 1.96, a confidence level of 95%. The minimum sample size was 384 and after adding a non-response rate of 10%, the final sample size was 423.

A systematic random sampling technique was used to select the study participants. On average, a maximum of 15 days was required for a truck to make a round trip from Modjo Dry Port to Djibouti International Port and back to Modjo Dry Port unless a technical problem on the vehicle or other accidents occurred. Based on the information from the port management, an average of 300 to 400 trucks arrive daily at the port. With this consideration the total drivers during the study period were computed as 300×15= 4500, whereas the constant value was obtained as followed: K = 4500 ÷ 423 ≈11, to give each driver an equal chance of inclusion, a random number between 1 and 11 was chosen as a starting number that was 3 and every 11th driver from the randomly chosen driver was studied until the total sample size was obtained.
Data Collection Instrument and Procedure
We used an adapted interviewer-administered questionnaire to collect the data, which consists of four main parts: Socio-demographic characteristics, lifestyle characteristics, medical information, and work-related factors. Participants’ blood pressure and anthropometric indices were measured using standard devices including a portable weight measuring scale, inelastic measuring tape, portable height measuring board, mercury sphygmomanometer, and stethoscope.
Experienced four data collectors (clinical Nurses) and one supervisor (Health officer) were involved in the process of data collection. The supervisor controlled and supervised all the data collection processes. First, data on socio-demographic characteristics, lifestyle characteristics, medical information, and work-related factors were collected by two nurses. Next, blood pressure and anthropometric parameters including weight, height, waist circumference, and hip circumference were measured using the standardized devices by the rest of the two nurses. During data collection, all current covid-19 prevention protocol was implemented such as wearing a mask, keeping a physical distance, and using hand sanitizer before and after the interview.
Triple blood pressure measurement was taken with a mercury sphygmomanometer at 5-minute intervals after 5 minutes of rest and for participants who took a caffeinated beverage; measurement was conducted after 30 minutes of rest. The measurement was performed in a sitting position with the legs uncrossed and arm supported on the table, with the palm facing upward and the cloth removed. The appropriate size cuff was positioned 1–2 cm above the elbow at the level of the heart. Then as to the world health organization (WHO) recommendation, since the first measurement is highly sensitive to conditions, the average systolic blood pressure (SBP) and diastolic blood pressure (DBP) of the last two measurements were used to diagnose hypertension.35
Body weight was measured to the nearest 0.1 kg using a calibrated scale, with subjects wearing light cloth and no shoes. Measurement scales were calibrated and checked for 0.00 before each data collection. Height was measured to the nearest 0.1 cm using a portable stadiometer, with subjects barefooted. Body Mass Index (kg/m2) was calculated by dividing the individual’s weight in Kg by the square of height in meters.36
Waist circumference (WC) was measured with a measuring tape placed between the inferior angle of the ribs and the supra-iliac crest with the patient standing and expiring normally. The hip circumference (HC) was measured by positioning the measuring tape around the maximum circumference of the buttocks while the person is standing, and reading the measurement to the nearest 0.1 cm. The Waist to Hip Ratio (WHR) was calculated and recorded to the nearest two decimal places.36
Data Quality Control
First, the English version questionnaire was translated into Amharic by a language expert and then back to English by another language expert to ensure consistency of the questionnaire. Before the actual data collection date, one-day theoretical and practical training was given to the data collectors and supervisor concerning the objective and the process of data collection; the presence of any ambiguity in the questionnaire was requested and clarified. A pretest was conducted among 21 long-distance drivers at Akaki customs station to check the quality of the tool and little modification was done. Moreover, completeness and consistency were checked every day after data collection, and the questionnaire was also checked before entering data into the computer software program.
Data Analysis Procedure
Data was entered using Epi-data 4.6.Statistical software and then exported to SPSS version 25 for analysis. Descriptive statistics such as frequencies, percentages, the mean, and standard deviation were performed. Bivariable and multivariable logistic regression analyses were executed after checking the necessary assumptions of the model. All independent variables with a p-value of less than 0.2 in the bivariable analysis were considered for the multivariable logistic regression analysis. Independent variables with a p-value of ≤ 0.05 in the multivariable logistic regression analysis were considered statistically significant. The odds ratio with a 95% confidence level was used to measure the strength of the association between hypertension and explanatory variables. Hosmer and Lemeshow goodness of fit was also performed to assess model fitness at a p-value of > 0.05.
Variables
The dependent variable was hypertension which was dichotomized as yes or no. Participants were considered to have hypertension if he was under antihypertensive medical treatment or had at least one of the following statements:
- Systolic blood pressure greater than or equal to 140 mmHg (SBP ≥ 140 mmHg);
- Diastolic blood pressure greater than or equal to 90 mmHg (SBP ≥ 90 mmHg);
- Systolic blood pressure greater than or equal to 140 and diastolic blood pressure greater than or equal to 90 mmHg (SBP ≥ 140 and DBP ≥ 90 mmHg).2
The independent variables for this study were age, sex, marital status, educational level, monthly income, body mass index, waist circumference, waist to height ratio, cigarette smoking, khat chewing, alcohol drinking, physical exercise, mealtime habit, and sleep duration (SD), diabetes status, and family history of HTN, work experience, work hour per day (WHPD), workday per weak (WDPW), and rest break between driving.
Mealtime habit was assessed based on Ethiopian usual time for breakfast, lunch, and dinner meal, in which subjects who had dinner mealtime after 5 o’clock were considered as late. Sleep duration (SD) was classified as duration greater than or equal to 7 and less than 7 hours.
Based on previous study work experience, WHPD, and WDPW were assessed by classifying subjects into <5 and ≥5 year of experience, <10 and ≥10 hour per day, and ≤6 and 7 and days per week respectively.
Operational Definitions
Anthropometric indices: Body mass index (BMI) was defined as normal weight (18.5–24.9 kg/m2), overweight (25–29.9 kg/m2) and Obese (≥ 30 kg/m2).37 Waist circumference (WC) that specific to males is defined as normal (< 94cm), overweight (94–101.9cm), and obese (≥102 cm) whereas, Waist to hip ratio (WHR) that specific to males is defined as normal (<0.90), overweight (0.90–0.99), and obese ((≥1.0).
Long-distance truck drivers: drivers who are expected to drive longer and spend the night away from their homes as the journey is too long to be made in a day.38
Current smokers: drivers who have smoked at least 100 cigarettes in their entire life and now smoke some days (< 3 days/week) or every day (≥ 3 days/week).39,40
Current drinker: A driver who has drunk alcohol (≥12 drinks) in the past year. Further classified into Light drinkers (≤ 3 drinks per week), Moderate drinkers (≤ 14 drinks per week), and Heavier drinkers (> 14 drinks per week).41,42
Khat chewer: is a driver who chews a chat at least once within the last 30 days.43
Regular physical exercise: a driver who had 2 to 5 hours of regular physical activity (walking, running, riding, and stretching exercises, such as sit-ups and pull-ups) per week.44
Ethical Approval and Consent to Participate
Ethical clearance was gained from the Institutional Review Board (IRB) of the School of Medicine, College of Medicine and Health Science, University of Gondar. Next, permission for data collection was taken from the Modjo Dry Port directorate office. All study participants were also informed about the purpose, significance, and process of the study. Besides, they were informed that they can refuse or discontinue participation at any time and the fact that information is recorded without their name being mentioned to keep anonymity and confidentiality. Then, written informed consent was obtained and the data collection process proceeded. During data collection, anyone who was found hypertensive for the first time was advised to see a physician.
Results
Background characteristics of study participants.
Out of 423 male truck drivers, 415 were involved in the study, with a 98% response rate. The mean age of participants was 39.1 ± 9.0, ranging from 24 to 64 years, and the mean monthly income was $120.89 ± $51.1. The majority (77.8%) of the drivers were aged below 45 years, 82.7% of them were married, and had completed secondary education (71.5%). Few participants had a history of hypertension (8%) and diabetes (5.5%). Moreover, fewer proportions of participants were also found obese that classified by BMI (11.3%), WHR (15.4%), and WC (29.6%) (Table 1).
 |
Table 1 Background Characteristics of Long-Distance Truck Drivers at Modjo Dry Port in Ethiopia, 2021 (n=415) |
Lifestyle Characteristics of Study Participants
Regarding lifestyle characteristics, of the 415 truck drivers interviewed, higher proportions 255 (61.4%) of participants were physically inactive, were current alcohol drinkers 245 (59.1%) and had a short sleep duration of < 6 hours 268 (64.6%). Few drivers were smokers 51 (12.3%) and ate dinner late at night hours 64 (15.4%) (Table 2).
 |
Table 2 Lifestyle Characteristics of Long-Distance Truck Drivers at Modjo Dry Port in Ethiopia, 2021(n=415) |
Prevalence and Predictors of Hypertension Among Long-Distance Truck Drives
In this study, the prevalence of hypertension among long-distance truck drivers in Ethiopia was 34.7% [95% CI; 30%, 39] of which 111 (26.7%) were newly diagnosed hypertensive (Figure 1).
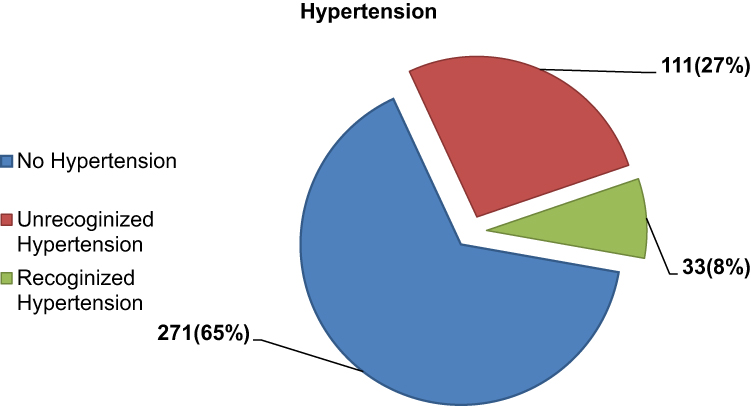 |
Figure 1 Prevalence of hypertension among long-distance truck drivers in Ethiopia, 2021. |
In the bivariable binary logistic regression analysis, explanatory variables such as age, physical activity, cigarette smoking, alcohol drinking, eating late at night hours, driving experience, driving hour per day, rest between driving, sleep duration, body mass index, waist to hip ratio had shown statistically significant association at a p-value of<0.20. In multivariable analysis, all of the enrolled variables except driving hour per day, driving experience, and waist to hip ratio were significantly associated with hypertension occurrence at a p-value of ≤ 0.05.
The odds of hypertension among drivers aged 45 and above were 4 [adjusted odds ratio (AOR) = 4.32; 95% CI: 2.16, 8.62] times higher when compared to age less than 45. Similarly, drivers who had regular physical exercise were 67% [AOR=0.33; 95% CI: 0.17, 0.63] less likely to develop hypertension as compared to drivers with no physical activity. Regarding substance use, drivers who were drinking alcohol and smoking cigarettes were 3.1 [AOR=3.05; 95% CI: 1.27, 7.31] and 3.7 [AOR= 3.74; 95% CI: 1.64, 8.51] times more likely to develop hypertension as compared to non-drinker and non-smoker, respectively. The odds of developing hypertension were 58% [AOR= 0.42; 95% CI: 0.23, 0.77] lower among drivers with a sleeping duration (SD) of less than 7 hours as compared to drivers with SD ≥7. Obese drivers were nearly five times [AOR= 5.12; 95% CI: 1.33, 19.8] more likely to develop hypertension when compared to drivers with normal BMI (Table 3).
 |
Table 3 Bivariable and Multivariable Analyses of Factors Associated with Hypertension Among Long-Distance Truck Drivers at Modjo Dry Port in Ethiopia, 2021(n=415) |
Discussion
Most of the factors associated with hypertension are greatly influenced by the Job and labor culture.45 Truck driving is a job that imposes drivers to risk factors for hypertension than other jobs.20 Based on the above facts, this study attempted to assess the prevalence and associated factors of hypertension among long-distance truck drivers in Ethiopia. The overall prevalence of hypertension in this study was 34.7% [95% CI; 30%, 39%], of which 76.9% were newly diagnosed. This finding is consistent with studies done in South Africa 36%,17 Sri Lanka 36.7%,26 and Ghana 38.7%.18 However, it is higher than the prevalence reported by the studies conducted in the United States 21.2%46 and India 24.7%47 but lower than the study done in Iran (59.8%).27 The variations observed could be owing to the differences in operational definition, sample size, and measuring devices. In the previous study prevalence of hypertension was determined using unrecognized hypertension and digital form of measuring devices. Besides, the discrepancy might also be due to socio-demographic and cultural differences.
In this study, drivers with age 45 and above were more likely to have hypertension than drivers with age below 45. This is supported by studies done in Nigeria,19 Iran,27 and India.48 This might be due to the aging process that leads to arterial stiffness. Aging alters the stiffness of the extra-cellular matrix (ECM) of the arterial wall by causing degenerative changes in the structural proteins such as elastin and collagen. Besides, the aging process is also attributed to endothelial dysfunction and loss of balance between vasodilators and vasoconstrictors. These alterations might lead to hypertension in older drivers.49
Regarding physical activity, drivers who had engaged in regular physical exercise were less likely to develop hypertension as compared to a driver with no physical activity. This finding is similar to those of studies done in south India,50 Brazil,13 and Iran.27 It has been suggested that physical inactivity may increase voluntary food intake and reduce metabolic rate which may lead to obesity.51 Through different mechanisms obesity (excess accumulation of adipocytes) may cause hypertension. One of the mechanisms is by increasing serum levels of Angiotensin II and aldosterone,52 and the other is by inducing endothelial damage and sympathetic overactivity.53
In the present study, the odds of hypertension among smokers were higher than in non-smokers. This finding is consistent with a cross-sectional study conducted among drivers in south India,54 and Ghana.18 The immediate noxious effect of smoking is connected to nervous system overactivity and impairment (attenuated) in cardiac baroreflex sensitivity (BRS), which leads to an increase in myocardial contractility, heart rate, and blood pressure in this individual.55 Also, chronic cigarette smoking initiates arterial stiffness and this effect might persist even after cessation of smoking.56
The finding of this study also indicated a significant association between hypertension and alcohol consumption among drivers. This is supported by the study conducted in Iran,27 Ghana,18 and Nigeria.19 The mechanism that underlies alcohol consumption and hypertension are numerous. But majorly, alcohol induces hypertension by stimulating cortisol secretion and generation of angiotensin II through the renin-angiotensin-aldosterone system (RAAS). One of the effects on blood pressure may be due to the mineralocorticoid activity of cortisol, which can bind to receptor having similar DNA sequence with that of aldosterone receptor inside the cell. Because of this, cortisol can have those actions of adrenal corticosteroids producing sodium and fluid retention and potassium excretion. Moreover, the vasoconstriction and salt restriction effect of angiotensin II and aldosterone hormone also could contribute to the development of hypertension.57
Regarding sleeping duration, there was a strong association between hypertension and short sleep duration. This finding is consistent with those studies done in the United States,58 China,59 Iran,27 and Ghana.18 This might be due to the hypothesized effects of short sleep duration; sleep deprivation may impair the energy balance in the body and eventually favors the development of adipocyte-induced hypertension.60 Moreover, prolonged sleep deprivation might lead to increased heart rate, increase salt retention, and elevated sympathetic nervous system activity, which entrains the cardiovascular system to operate under high pressure.61
Another finding of the present study was the association between late-night eating and hypertension. This concurs with cross-sectional studies conducted among Ghanaian18 and Nigerian drivers.19 Later circadian timing of food intake or food intake before sleep is implicated to bring obesity. A potential mechanism for increased body fat in response to later meal timing may be due to decreased thermic effect of food, which is the energy expended in response to a meal. Later on, this would contribute to a positive energy balance and weight gain over time.62
In a cross-sectional study among Ghanaian long-distance bus drivers, long duration in a sitting position was a significant predictor of hypertension,18 which is consistent with our present study. Not breaking in-between long sitting duration is a typical example of a sedentary habit that has been associated with obesity and hypertension.
In this study, long-distance truck drivers who were obese were more likely to develop hypertension. This study is supported by previous studies conducted elsewhere.19,58,63,64 This association might be due to the metabolic effect of excess adipocytes in the body that favors hypertension occurrence. Excess adipocyte enhances activation of adipocyte-derived angiotensinogen and angiotensin-converting enzyme, expression of angiotensin receptors, and secretion of leptin. Moreover, excess adiposity is also linked to mitochondrial dysfunction, increased production of reactive oxygen species (ROS), and insulin resistance. Eventually, these may lead to hypertension by causing endothelial damage, sympathetic overactivity, and increased serum angiotensin II and aldosterone level.65–67
The strength of the present study is since Modjo dry port is the main port in the country; most of the long-distance truckers were included, to give equal chance for participants random sampling technique was used. Despite the significant findings of this study, the current study is not without limitations. This study did not measure participants’ blood glucose levels, only used self-reported diabetic states. Furthermore, because the study was a cross-sectional one, we could not determine the direction of causality.
Conclusion
In conclusion, our results suggest that the prevalence of hypertension was high among long-distance truck drivers at Modjo dry port in Ethiopia. It is revealed that older age, obesity, short sleep duration, eating late at night, smoking, and alcohol drinking was positively associated with hypertension. On the other hand, the presence of rest breaks between driving and regular physical exercise was negatively associated with hypertension. Therefore health advice targeted on lifestyle modifications, sleep habits, and the importance of rest breaks between driving should be considered as part of an intervention to prevent hypertension.
Declarations
All the processes of study complied with the Declaration of Helsinki.
Abbreviations
BMI, body mass index; DBP, diastolic blood pressure; HTN, hypertension; SBP, systolic blood pressure; WC, waist circumference; WDPW, workday per week; WHO, World Health Organization; WHPD, work hour per day; WHR, waist to height ratio.
Data and Materials Availability
The dataset containing all the required data is found at the primary author that can be accessed with a justifiable request.
Acknowledgments
The authors would like to acknowledge the University of Gondar for funding, study participants, data collectors, and facilitators for their unreserved cooperation in the process of this study.
Author Contributions
All authors made a significant contribution to the work reported, and actively participated in the conceptualization, methodology, execution, acquisition of data, analysis, and interpretation, they also took part in drafting, revising, or critically reviewing the article; gave final approval of the version to be published; have agreed on the journal to which the article has been submitted; and agree to be accountable for all aspects of the work.
Disclosure
No conflicts of interest are reported by the authors.
References
1. Centers for Disease Control and Prevention. Facts about hypertension; 2020, september 8. Available from: https://www.cdc.gov/bloodpressure/facts.htm.
2. Schneider RH, Salerno J, Brook RD. 2020 international society of hypertension global hypertension practice guidelines–lifestyle modification. J Hypertens. 2020;38(11):2340–2341. doi:10.1097/HJH.0000000000002625
3. Iqbal AM, Jamal SF. Essential Hypertension. StatPearls; 2019.
4. Lin Y, Eacker A. Secondary Hypertension, in Chalk Talks in Internal Medicine. Springer; 2020:39–43.
5. Boron WF, Boulpaep EL. Boron & Boulpaep Concise Medical Physiology E-Book. Elsevier Health Sciences; 2020.
6. Kjeldsen SE. Hypertension and cardiovascular risk: general aspects. Pharmacol Res. 2018;129:95–99. doi:10.1016/j.phrs.2017.11.003
7. World Health Organization. Hypertension; 2019. Available from: https://www.who.int/news-room/fact-sheets/detail/hypertension.
8. Tiruneh SA, Bukayaw YA, Yigizaw ST, et al. Prevalence of hypertension and its determinants in Ethiopia: a systematic review and meta-analysis. PLoS One. 2021;15(12):e0244642. doi:10.1371/journal.pone.0244642
9. Sebastin K. Long route truck driving–a 360 degree review. Karunakaran N, 2017: p. 172.
10. Moturi WO, Florkowski WJ. Food choices as an occupation hazard: food choice and purchase behavior among long-haul truck drivers; 2019.
11. Bachmann LH, Lichtenstein B, St. Lawrence JS, et al. Health risks of American long-distance truckers: results from a multisite assessment. J Occup Environ Med. 2018;60(7):e349–e355. doi:10.1097/JOM.0000000000001319
12. Pourabdian S, Golshiri P, Janghorbani M. Overweight, underweight, and obesity among male long-distance professional drivers in Iran. J Occup Health. 2020;62(1):e12114. doi:10.1002/1348-9585.12114
13. Reis LA, Costa CD, Rodrigues DS, Alcântara KC, et al. Obesity, hypertension and diabetes among truck drivers in the middle-west, Brazil. Biosci J. 2017;33(2).
14. Hall JE, Do Carmo JM, da Silva AA, et al. Obesity, kidney dysfunction and hypertension: mechanistic links. Nat Rev Nephrol. 2019;15(6):367–385. doi:10.1038/s41581-019-0145-4
15. Roush GC. Obesity induced hypertension: heavy on the accelerator. Am Heart Assoc. 2019;16(8):e01233.
16. Krishnamoorthy Y, Sarveswaran G, Sakthivel M. Prevalence of hypertension among professional drivers: evidence from 2000 to 2017—A systematic review and meta-analysis. J Postgrad Med. 2020;66(2):81. doi:10.4103/jpgm.JPGM_297_19
17. Lalla-Edward ST, Fischer AE, Venter WDF, et al. Cross-sectional study of the health of Southern African truck drivers. BMJ open. 2019;9(10):e032025. doi:10.1136/bmjopen-2019-032025
18. Anto EO, Owiredu WKBA, Adua E, et al. Prevalence and lifestyle-related risk factors of obesity and unrecognized hypertension among bus drivers in Ghana. Heliyon. 2020;6(1):e03147. doi:10.1016/j.heliyon.2019.e03147
19. Amadi CE, Grove TP, Mbakwem AC, et al. Prevalence of cardiometabolic risk factors among professional male long-distance bus drivers in Lagos, south-west Nigeria: a cross-sectional study. Cardiovasc J Afr. 2018;29(2):106–114. doi:10.5830/CVJA-2018-006
20. Crizzle AM, Bigelow P, Adams D, et al. Health and wellness of long-haul truck and bus drivers: a systematic literature review and directions for future research. J Transp Health. 2017;7:90–109. doi:10.1016/j.jth.2017.05.359
21. Pathak RK, Abhilash SP, Hendriks JM. A team-based approach toward risk factors of atrial fibrillation. Card Electrophysiol Clin. 2021;13(1):257–262. doi:10.1016/j.ccep.2020.11.008
22. Sierra C. Hypertension and the risk of dementia. Front Cardiovasc Med. 2020;7:5. doi:10.3389/fcvm.2020.00005
23. Parvin K, Santha NJ, Selvarani G, Selvarani G. Assessment of risk status for coronary artery disease in terms of selected risk factors among bus drivers. Asian J Nurs Edu Res. 2020;10(3):291–297. doi:10.5958/2349-2996.2020.00061.0
24. Das K, Dasgupta A, Naskar NN, et al. How aware are our truck drivers regarding prevention of road traffic accidents? A cross-sectional study in Dankuni area, Hooghly. Int J Community Med Public Health. 2020;7(3):1084–1088. doi:10.18203/2394-6040.ijcmph20200971
25. Chankaramangalam MA, Ramamoorthy V, Muthuraja D, Saravanan PA, Rajan V. Factors associated with hypertension among truck drivers: a cross sectional study at a check post on a National Highway in South India. Int J Med Res Heal Sci. 2017;6:126.
26. Jayarajah U, Jayakody AJ, Jayaneth JM, et al. Prevalence of hypertension and its associated factors among a group of bus drivers in Colombo, Sri Lanka. Int J Occup Environ Med. 2017;8(1):58–59. doi:10.15171/ijoem.2017.986
27. Khanlari P, Khosravipour M, Gharagozlou F, et al. Prevalence and determinants of hypertension among Iranian taxi drivers (2018). J Occup Health Epidemiol. 2020;9(1):1–9. doi:10.29252/johe.9.1.1
28. Valenzuela PL, et al. Lifestyle interventions for the prevention and treatment of hypertension. Nat Rev Cardiol. 2020;18:1–25.
29. Legese N, Tadiwos Y. Epidemiology of hypertension in Ethiopia: a systematic review. Integr Blood Press Control. 2020;13:135. doi:10.2147/IBPC.S276089
30. Kebede B, Ayele G, Haftu D, et al. The prevalence and associated factors of hypertension among adults in Southern Ethiopia. Int J Chronic Dis. 2020;2020.
31. Badego B, Yoseph A, Astatkie A, Odoi A. Prevalence and risk factors of hypertension among civil servants in Sidama Zone, south Ethiopia. PLoS One. 2020;15(6):e0234485. doi:10.1371/journal.pone.0234485
32. Kurtul S, Ak FK, Türk M. The prevalence of hypertension and influencing factors among the employees of a university hospital. Afr Health Sci. 2020;20(4):1725–1733. doi:10.4314/ahs.v20i4.24
33. Wolle SZ, Kebed SM, Alemu ZA. To determine the prevalence of hypertension and its lifestyle risk factors in Amhara Region of Debre Birehan Town among Zonal Civil Servants. Ethiopia; 2020.
34. Yosef T, Bogale B, Destaw A, et al. The burden of overweight and obesity among long-distance truckers in Ethiopia. J Obes. 2020;2020. doi:10.1155/2020/4242789
35. world Health Organization. WHO technical specifications for automated non-invasive blood pressure measuring devices with cuf; 2020.
36. World Health Organization Guide to physical measurements; 2020. Available from: https://www.who.int/ncds/surveillance/steps/Section%204%20Step%202%20Physical%20Measurements.pdf.
37. World Health Organization. Body mass index – BMI; 2021. Available from: https://www.euro.who.int/en/health-topics/disease-prevention/nutrition/a-healthy-lifestyle/body-mass-index-bmi.
38. Transportation, U.S.D.o. Long-distance travel; 2017. Available from: https://www.bts.gov/bts/archive/publications/highlights_of_the_2001_national_household_travel_survey/section_03.
39. Centers for Disease Control and Prevention. Adult Tobacco Use Information; 2017. Available from: https://www.cdc.gov/nchs/nhis/tobacco/tobacco_glossary.htm.
40. Ministry of Health New Zealand. Definitions of smoking status; 2020. Available from: https://www.health.govt.nz/our-work/preventative-health-wellness/tobacco-control/tobacco-control-information-practitioners/definitions-smoking-status.
41. Colette A, Charles SJ, Rosemonde K, et al. The prevalence of high blood pressure and its relationship with sociodemographic, anthropometric and lifestyles indicators: a population-based study in aplahoue health district, Benin. Univers J Public Health. 2020;8(2):65–72. doi:10.13189/ujph.2020.080203
42. centers for Disease Control and Prevention. Adult Alcohol Use Information; 2018. Available from: https://www.cdc.gov/nchs/nhis/alcohol/alcohol_glossary.htm.
43. Diress M, Yeshaw Y, Bantihun M, et al. Refractive error and its associated factors among pregnant women attending antenatal care unit at the University of Gondar Comprehensive Specialized Hospital, Northwest Ethiopia. PLoS One. 2021;16(2):e0246174. doi:10.1371/journal.pone.0246174
44. World Health Organization. Global Physical Activity Questionnaire (GPAQ) Analysis Guide. Geneva; 2012.
45. Hrehova D, Ziaran P. Impact of the working conditions on health and selected job-related diseases. an international comparison. In: SHS Web of Conferences. EDP Sciences; 2021.
46. Robbins RB, Thiese MS, Ott U, et al. Metabolic syndrome in commercial truck drivers: prevalence, associated factors, and comparison with the general population. J Occup Environ Med. 2020;62(7):453–459. doi:10.1097/JOM.0000000000001863
47. Sabherwal S, Sood I, Chinnakaran A, et al. Hypertension in Indian truck drivers: the need for comprehensive service provision to this mobile population (2017–18). J Occup Health Epidemiol. 2020;9(2):85–90. doi:10.29252/johe.9.2.85
48. Lakshman A, Manikath N, Rahim A, et al. Prevalence and risk factors of hypertension among male occupational bus drivers in North Kerala, South India: a Cross-Sectional Study. ISRN Prev Med. 2014;2014:318532. doi:10.1155/2014/318532
49. Das KC, Kundumani-Sridharan V, Subramani J. Role of thioredoxin in age-related hypertension. Curr Hypertens Rep. 2018;20(1):6. doi:10.1007/s11906-018-0815-9
50. Dhamodharan S, Megala M, Duraimurugan M, et al. Prevalence of hypertension and its risk factors among transport workers in South India. Int J Community Med Public Health. 2020;7(4):1329. doi:10.18203/2394-6040.ijcmph20201093
51. Visaria A, Kethidi N, Chilakapati R, et al. Effect modification, confounding, or interaction: understanding the role of hypertension on the association between adiposity and physical activity. Blood Press Monit. 2021;26(2):169. doi:10.1097/MBP.0000000000000501
52. Shariq OA, McKenzie TJ. Obesity-related hypertension: a review of pathophysiology, management, and the role of metabolic surgery. Gland Surg. 2020;9(1):80. doi:10.21037/gs.2019.12.03
53. Haas de Mello A, Ferreira GK, Rezin GT. Chapter 3 - Abnormal mitochondrial metabolism in obesity and insulin resistance. In: Ostojic S, eds. Clinical Bioenergetics. Academic Press; 2021:83–92.
54. Chankaramangalam MA. Factors associated with hypertension among truck drivers: a cross sectional study at a check post on a national highway in South India. Int J Med Res Health Sci. 2017;6(5):126–129.
55. Cui J, Drew RC, Muller MD, et al. Habitual cigarette smoking raises pressor responses to spontaneous bursts of muscle sympathetic nerve activity. Am J Physiol Regul Integr Comp Physiol. 2019;317(2):R280–R288. doi:10.1152/ajpregu.00293.2018
56. Rezk-Hanna M, Doering L, Robbins W, et al. Acute effect of hookah smoking on arterial stiffness and wave reflections in adults aged 18 to 34 years of age. Am J Cardiol. 2018;122(5):905–909. doi:10.1016/j.amjcard.2018.05.033
57. Husain K, Ansari RA, Ferder L. Alcohol-induced hypertension: mechanism and prevention. World J Cardiol. 2014;6(5):245–252. doi:10.4330/wjc.v6.i5.245
58. Hege A, Lemke MK, Apostolopoulos Y, et al. US long-haul truck driver work organization and the association with cardiometabolic disease risk. Arch Environ Occup Health. 2017;72(5):303–310. doi:10.1080/19338244.2016.1242468
59. Guan Y, Zhang M, Zhang X, et al. Association between sleep duration and hypertension of migrant workers in China: a national cross-sectional surveillance study. BMJ Open. 2019;9(11):e031126. doi:10.1136/bmjopen-2019-031126
60. McHill AW, Wright KP. Jr, Role of sleep and circadian disruption on energy expenditure and in metabolic predisposition to human obesity and metabolic disease. Obes Rev. 2017;18(S1):15–24. doi:10.1111/obr.12503
61. Okunowo O, Orimoloye HT, Bakre SA, et al. Age- and body weight-dependent association between sleep duration and hypertension in US adults: findings from the 2014–2017 National Health Interview Survey. Sleep Health. 2019;5(5):509–513. doi:10.1016/j.sleh.2019.05.003
62. McHill AW, Phillips AJ, Czeisler CA, et al. Later circadian timing of food intake is associated with increased body fat.. Am J Clin Nutr. 2017;106(5):1213–1219. doi:10.3945/ajcn.117.161588
63. Sangaleti CT, Trincaus MR, Baratieri T, et al. Prevalence of cardiovascular risk factors among truck drivers in the South of Brazil. BMC Public Health. 2014;14(1):1063. doi:10.1186/1471-2458-14-1063
64. Sharma PK, Ganguly E. Morbidity profile of long distance truck drivers in Hyderabad city, India. J Dr NTR Univ Health Sci. 2014;3(4):234–237. doi:10.4103/2277-8632.146603
65. Ramalingam L, Menikdiwela K, LeMieux M, et al. The renin angiotensin system, oxidative stress and mitochondrial function in obesity and insulin resistance. Biochim Biophys Acta Mol Basis Dis. 2017;1863(5):1106–1114. doi:10.1016/j.bbadis.2016.07.019
66. Bell BB, Rahmouni K. Leptin as a Mediator of Obesity-Induced Hypertension. Curr Obes Rep. 2016;5(4):397–404. doi:10.1007/s13679-016-0231-x
67. Schütten MT, Houben AJHM, de Leeuw PW, et al. The link between adipose tissue renin-angiotensin-aldosterone system signaling and obesity-associated hypertension. Physiology. 2017;32(3):197–209. doi:10.1152/physiol.00037.2016
 © 2022 The Author(s). This work is published and licensed by Dove Medical Press Limited. The
full terms of this license are available at https://www.dovepress.com/terms
and incorporate the Creative Commons Attribution
- Non Commercial (unported, 3.0) License.
By accessing the work you hereby accept the Terms. Non-commercial uses of the work are permitted
without any further permission from Dove Medical Press Limited, provided the work is properly
attributed. For permission for commercial use of this work, please see paragraphs 4.2 and 5 of our Terms.
© 2022 The Author(s). This work is published and licensed by Dove Medical Press Limited. The
full terms of this license are available at https://www.dovepress.com/terms
and incorporate the Creative Commons Attribution
- Non Commercial (unported, 3.0) License.
By accessing the work you hereby accept the Terms. Non-commercial uses of the work are permitted
without any further permission from Dove Medical Press Limited, provided the work is properly
attributed. For permission for commercial use of this work, please see paragraphs 4.2 and 5 of our Terms.
Recommended articles
Prevalence of Hyperuricemia and the Relationship Between Serum Uric Acid and Hypertension in New Onset Diabetic Patients: A Cross-Sectional Indian Study
Singh SK, Singh R, Singh SK, Iquebal MA, Jaiswal S, Singh A
Diabetes, Metabolic Syndrome and Obesity 2022, 15:1809-1817
Published Date: 14 June 2022
Hypertension and Dyslipidaemia in Argentina: Patient Journey Stages
Sadler AE, Belcastro F, Yarleque CR
International Journal of General Medicine 2022, 15:7799-7808
Published Date: 12 October 2022
Patterns of Dyslipidemia in the Anemic and Nonanemic Hypertensive Saudi Population: A Cross-Sectional Study
Alfhili MA, Alsughayyir J, Basudan AM, Ghneim HK, Alfaifi M, Alamri HS, Awan ZA, Algethami MR
International Journal of General Medicine 2022, 15:7895-7906
Published Date: 21 October 2022
Prevalence and Factors Associated with Hypertension Among HIV Positive Patients on Antiretroviral Therapy: A Hospital-Based Cross-Sectional Study in Rwanda
Uwanyirigira D, Biracyaza E, Uzabakiriho I, Omolo J, Hakizayezu F, Nzayirambaho M
Vascular Health and Risk Management 2023, 19:857-870
Published Date: 27 December 2023
Prevalence of Hypertension and Its Associated Factors Among Adult People Living with HIV/AIDS at Anti-Retroviral Treatment (ART) Centers in Mumbai, India
Acharya S, Karanjkar V, Goyal M, Deshpande PV, Anonymous, Setia MS, Rathod D, Kannan P, Krishna A, Pathni AK, Palkar A, Harshana A, Anonymous
HIV/AIDS - Research and Palliative Care 2025, 17:105-119
Published Date: 3 June 2025