Back to Journals » Journal of Blood Medicine » Volume 16
Exploring the Relationship Between Personalization of Care and Participation in Sport Activities Among People with Severe Hemophilia A Across Europe: Post Hoc Analysis of the CHESS II Study
Authors Blenkiron T, Ferri Grazzi E ![]() , Burke T, Watt M, Davis KH
, Burke T, Watt M, Davis KH
Received 10 February 2025
Accepted for publication 7 July 2025
Published 6 August 2025 Volume 2025:16 Pages 359—372
DOI https://doi.org/10.2147/JBM.S521079
Checked for plagiarism Yes
Review by Single anonymous peer review
Peer reviewer comments 2
Editor who approved publication: Dr Martin H Bluth
Tom Blenkiron,1 Enrico Ferri Grazzi,1 Tom Burke,1,2 Maureen Watt,3 Kimberly H Davis3
1HCD Economics Ltd, Daresbury, UK; 2Faculty of Social Care, University of Chester, Chester, UK; 3Takeda Development Center Americas, Inc, Cambridge, MA, USA
Correspondence: Enrico Ferri Grazzi, HCD Economics, Mere House, Brook Street, Knutsford, Daresbury, WA16 8GP, UK, Tel +44 1925 606475, Email [email protected]
Purpose: To describe the demographic and clinical characteristics of patients with hemophilia A receiving different levels of treatment personalization (TP), and to assess the relationship between TP and sport active time (SAT).
Patients and Methods: This post hoc analysis of the CHESS II study used data from physician-completed patient record forms and patient self-completion forms for adult males receiving prophylaxis for severe hemophilia A in Europe between November 2018 and October 2020. SAT was assessed using propensity score matching (PSM) across levels of TP, including pharmacokinetic (PK)-guided and non-PK-guided.
Results: Of 54 patients, 32 (59.3%) received TP. Of these, 22 (68.8%) and 10 (31.3%) received non-PK-guided and PK-guided treatment, respectively. Median age varied between the TP and no-TP groups (29.5 and 34.0 years, respectively). Median (IQR) annual bleeding incidence was higher with non-PK-guided vs PK-guided TP (4.0 [3.0– 8.0] vs 3.5 [2.0– 4.0]). Median (IQR) problem joints were similar with non-PK-guided and PK-guided TP (1.0 [0.0– 1.0] and 1.0 [0.0– 2.0]). Patients in the TP vs no-TP group had higher median (IQR) SAT per month (3.3 [1.8– 6.2] vs 1.8 [0.7– 5.0] hours). Median (IQR) SAT per month was higher with PK-guided vs non-PK-guided TP (4.0 [3.0– 20.0] vs 3.0 [1.3– 5.3] hours). After controlling for confounding in the PSM model, SAT remained higher with TP vs no-TP and with PK-guided vs non-PK-guided TP. In both PSM models, P values were < 0.05 for the average treatment effect and < 0.01 for the average treatment effect on the treated. Sensitivity analyses confirmed the robustness of the PSM.
Conclusion: Patients receiving TP vs no-TP had higher median SAT. Of those with TP, those receiving PK-guided vs non-PK-guided TP experienced lower bleeding rates and higher SAT. PK-guided TP may help patients to be more active, potentially gaining the clinical and psychosocial benefits of exercise.
Keywords: exercise, pharmacokinetic-guided treatment, prophylaxis, quality of life, treatment personalization, hemophilia A
Introduction
Hemophilia A (HA) is a chronic congenital condition characterized by a deficiency or dysfunction of the coagulation protein factor VIII (FVIII). This leads to bleeding episodes affecting the joints, muscles, and soft tissue that can be traumatic or spontaneous in nature.1 HA severity is classified according to endogenous FVIII levels and can be severe (FVIII levels <0.01 IU/mL), moderate (FVIII levels 0.01–0.05 IU/mL), or mild (FVIII levels 0.05–0.4 IU/mL), with the risk and seriousness of bleeding events largely dependent on HA severity.2 In the long term, repeated bleeding into joints often results in progressive joint deterioration, characterized by chronic pain and inflammation, and differing levels of mobility limitation.2
People with HA can experience acute pain as a consequence of ongoing bleeding episodes.2 Repeated bleeding episodes, particularly into joints, can cause synovial deterioration and joint damage, resulting in chronic pain2 which, alongside the risk of bleeding, can negatively impact physical activity levels.3 This adds to the condition burden of HA and can reduce health-related quality of life (HRQoL).4,5 Patients reported pain, joint damage, and injury/bleeding as perceived risks of exercise and some considered the risks of physical activity as potentially greater than its benefits.3 However, physical activity can be highly beneficial for patients, resulting in increased strength, flexibility, joint stabilization and coordination, increased muscle mass, and improved clinical outcomes with a reduced frequency of musculoskeletal bleeding episodes.6–10
Typically, treatment for HA can be provided on-demand, to replenish FVIII levels to stop an ongoing bleeding event, or prophylactically, to prevent bleeding events from occurring.1 Although prophylactic FVIII replacement is recommended for patients with a severe bleeding phenotype to provide sufficient protection from frequent joint bleeds and associated complications,2 individual patients respond differently to treatments, and no standardized “one size fits all” treatment approach exists.1,2 With FVIII replacement, the dosage and administration frequency required to achieve the desired FVIII level varies between patients based on a number of factors, including HA severity, bleeding patterns, joint health status, weight, and the individual pharmacokinetic (PK) profile.2,11,12 Therefore, tailoring prophylaxis to individual patients by targeting FVIII levels based on a patient’s PK profile, as well as patients’ preference and lifestyle can improve outcomes.11,13 An effective and tailored treatment approach that reduces bleeding and pain can lead to improved HRQoL partly due to fewer restrictions on physical activity and daily life.14,15
Results from previous analyses have demonstrated that PK profiling can aid in the development of personalized dosing regimens for patients to achieve more favorable clinical outcomes.16 However, in-depth analyses involving multivariable regression and matching models are important to appropriately assess patients’ level of physical activity (eg, sport participation) in relation to treatment. Specific techniques exist to help reduce the influence of confounding variables, such as propensity score matching (PSM).17 PSM is a quasi-experimental method that is used to construct an artificial control group by matching each treated (control) observation with a control (treated) observation, with the aim of matching patients with comparable clinical profiles and general characteristics.17,18
The objectives of this analysis were to describe the demographic and clinical differences between patients receiving different levels of treatment personalization (TP), and to assess the relationship between TP and time spent in sport activities using data from the CHESS II study.
Materials and Methods
Study Design and Patient Populations
Data were drawn from the “Cost of Haemophilia across Europe: a Socio-economic Survey II” (CHESS II) study, a cross-sectional, retrospective, burden-of-illness study of 1337 males with hereditary HA or hemophilia B aged ≥18 years from eight European countries, treated by 185 hemophilia providers of care. The CHESS II study design, methodology, and primary findings have been published previously.16,19,20 In brief, the CHESS II study utilized two questionnaires: a physician-completed clinical record form and a patient self-completion form (“patient and public involvement and engagement” [PPIE]). The physician-completed clinical record form included information on patient demographics, clinical outcomes, medical history, treatment patterns, and healthcare resource utilization for up to eight patients with HA in the physician’s clinical case load; and the PPIE included non-medical resource use, HRQoL (EQ-5D-5L), labor market outcomes, activity and work impairment (Work Productivity and Activity Impairment), and activity participation including sport active time (SAT) along with other patient-reported outcomes and were voluntarily completed by the participants upon providing informed consent. Data were collected between November 2018 and October 2020.16 The two-year period reflects the duration of data collection across participating countries, rather than a prospective follow-up period for patients. Eligibility criteria for inclusion in the CHESS II study were male gender, ≥18 years of age, diagnosed with non-acquired HA or hemophilia B of any severity, and able to understand the informed consent form and provide informed consent.16 PwH were recruited by their treating physician on a “next eligible patient seen” regardless of reason for consultation in order to minimize selection bias. All data were collected and analyzed anonymously and in aggregate form.19 The study was carried out in accordance with the relevant regional guidelines and approved by the Research Ethics Sub-Committee of the Faculty of Health and Social Care within the University of Chester. The study was conducted in accordance with the Declaration of Helsinki.
This analysis included data on patients from the CHESS II study receiving prophylaxis with FVIII replacement therapy, who did not have an active inhibitor to FVIII replacement therapy at recruitment or within the 12 months prior, and who had available information on TP, and physical activity (Figure 1).
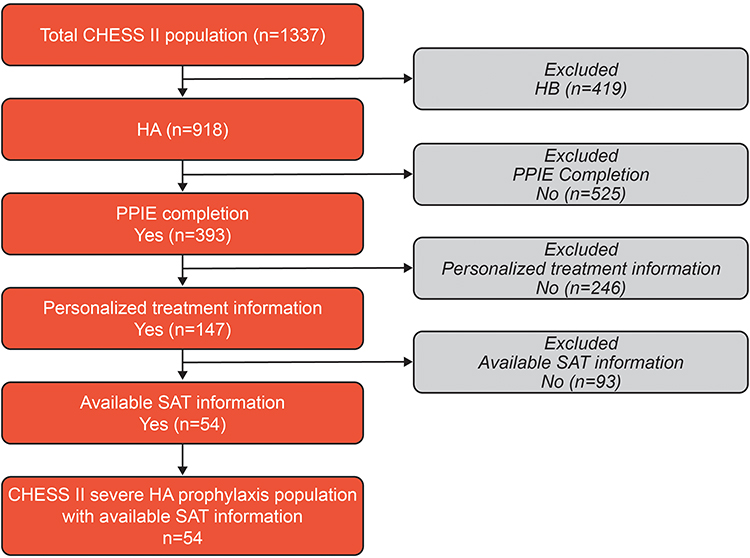 |
Figure 1 Patient disposition for inclusion in this analysis. Abbreviations: CHESS, Cost of Haemophilia in Europe: A Socioeconomic Survey; HA, hemophilia A; HB, hemophilia B; PPIE, patient public involvement engagement; SAT, sport active time. |
Clinical Characteristics and Patient-Reported Outcomes
Demographics (age, body mass index [BMI], employment status, education level), treatment characteristics and key clinical outcomes (annual bleeding rate [ABR], problem joints [PJs], target joints [TJs], HA-related chronic pain and the presence of comorbidities) were reported by the hemophilia care provider. ABR was measured as the sum of bleeding events in the 12 months prior to data collection. PJs were defined as joints with chronic pain, and/or limited range of movement due to chronic synovitis or arthropathy with or without persistent bleeding.21,22 TJs are defined as joints in which ≥3 spontaneous bleeds have occurred within a consecutive 6-month period; the joint is no longer considered a target joint if ≤2 bleeds have occurred within 12 months.23 Chronic pain associated with HA was categorized as: none (no functional deficit, no analgesic use [except with hemarthrosis]), mild pain (does not interfere with occupation or daily activities, may require occasional non-narcotic analgesic), moderate pain (partial or occasional interference with occupation or daily activities, use of non-narcotic medications), and severe pain (interferes with occupation or daily activities, requires frequent use of non-narcotic and narcotic medications).24
FVIII treatment type was categorized as standard half-life, extended half-life, or plasma-derived. Adherence to treatment was reported by the physician and categorized as fully adherent (missing <15% of infusions), sub-optimally adherent (missing 15–25% of infusions), or non-adherent (missing >25% of infusions). Treatment adherence was also reported by the patient as their level of adherence to their hemophilia treatment regimen on a scale between 0 (“Not at all”) and 10 (“Fully”).
Participants completed the EQ-5D-5L questionnaire, which measures five levels of impairment ranging from “no problems” to “extreme problems” across five domains: mobility, self-care, usual activities, pain/discomfort, and anxiety/depression.25 The EuroQol visual analogue scale (EQ-VAS) was also used to assess patient-reported level of health on the day of reporting ranging from 0 to 100.25 In both assessments a higher score indicates a higher HRQoL.
Data were stratified across levels of TP, based on physician-collected data and defined as no TP or receiving TP, which was further split into receiving prophylaxis based on PK measurements (PK-guided), or physician estimate without PK measurements (non-PK-guided; Figure 2). SAT (hours per month) was defined as hours typically spent on sport activities including jogging, swimming, cycling, team sports, and/or strength training each month, as reported by the patient in the PPIE questionnaire.
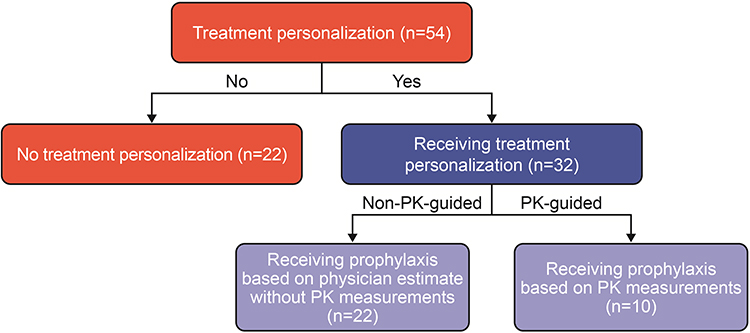 |
Figure 2 Flow chart showing stratification of data across treatment personalization. Abbreviation: PK, pharmacokinetic. |
Statistical Analysis
Patient demographics and characteristics were summarized using descriptive statistics as median and interquartile range (IQR) as well as mean and standard deviation (SD) across continuous variables, and count and percentage across categorical variables. Wilcoxon rank-sum test or chi-squared test, confirmed with Fisher’s exact test, were used to calculate P values. The decision to use non-parametric analysis was based on the modest sample size and the non-normal distribution of key continuous variables, such as sport active time (SAT). Non-parametric analysis offers greater robustness under these conditions and avoids assumptions that may not be fully satisfied. All analyses were performed using STATA 17 (StataCorp LLC, College Station, TX, USA; www.stata.com).
Univariable and Multivariable Analyses
Univariable regression analysis was undertaken to identify potentially suitable variables for inclusion in the PSM models. Variables with a significant univariable association (p<0.05) with the outcome of interest were identified as candidates for inclusion in the PSM models. Scatter plots and the Pearson correlation coefficient were used to explore the interrelationship between continuous covariates that were considered for inclusion in the multivariable regression analysis. Multivariable analysis was conducted using standard linear regression (ordinary least squares) to further assess the outcomes of interest for potential inclusion within the PSM regression analysis.
Propensity Score Matching
To control for possible selection bias, patients in the TP group were matched to those in the no-TP group, and patients in the PK-guided group were matched to those in the non-PK-guided group, using PSM with replacement.26–28 The use of replacement increases matching quality by allowing each control individual to serve as a match for multiple treated individuals, when appropriate, thereby reducing variability in the estimates. Propensity scores were calculated for the primary outcome, SAT, using logistic regression models. Covariates included in the models were selected based on their clinical relevance and statistical significance in univariable and multivariable analyses (see Results – Propensity score matching). These covariates encompassed key demographic, clinical, and treatment-related factors to minimize confounding and improve the precision of the estimated effects. Optimal full 1:1 matching with 0.2 caliper was used for both treated (TP/PK-guided) and control (no-TP/non-PK-guided) groups to estimate the average treatment effect (ATE) and average treatment effect on the treated (ATT). ATE represents the effect, at the population level, of transitioning an entire population from untreated to treated on the outcome of interest, providing insight into the potential impact of the intervention if universally applied.27 ATT on the other hand is the average effect of treatment on those subjects who ultimately received the treatment on the outcome of interest, reflecting its realized impact within the treated subgroup.27 The robustness of the PSM models was evaluated through several diagnostic methods. Propensity score distribution overlap between treatment and control group was assessed, to ensure common support for matching. Covariate balance was assessed via standardized mean differences and variance ratios were examined to assess balance. Box and balance plots were used for visual confirmation. Rosenbaum bounds, and associated gamma values, which quantify the degree to which unmeasured covariates could bias the estimated treatment effect, were also used.29,30 Additional details on PSM methods and PSM sensitivity analyses are provided in Supplementary Methods.
Results
Patient Demographics
Of the 1337 patients included in CHESS II, 147 had information on TP, all of whom had severe HA. Of these 147 patients, 54 reported being active, 50 were unable to be active due to hemophilia, and 43 were not active for reasons unrelated to hemophilia. In total, 54 patients from five countries (Italy, Spain, United Kingdom, Germany, and France) had available SAT data, met all eligibility criteria, and were included in this secondary analysis (Figure 1).
Of 54 patients receiving prophylaxis for severe HA with available SAT data, 32 (59.3%) received TP; 22 (68.8%) of whom received non-PK-guided treatment, and 10 (31.3%) received PK-guided treatment (Figure 2).
Patient demographics are shown in Table 1. Most patients were from Spain (n=23, 42.6%), followed by Italy (n=20, 37.0%), Germany (n=5, 9.3%), France (n=4, 7.4%), and the United Kingdom (n=2, 3.7%). Median age varied between the TP and no-TP groups (29.5 and 34.0 years, respectively), while BMI was similar (23.6 and 25.1 kg/m2, respectively). Most patients were employed (TP group, n=12/22 [54.5%]; no-TP group, n=22/32 [68.8%]).
 |
Table 1 Patient Demographics Stratified by Treatment Personalization |
Clinical Characteristics and Patient-Reported Outcomes
Clinical characteristics and patient-reported outcomes are shown in Table 2. Median (IQR) ABR was similar in the TP and no-TP groups (4.0 [3.0–7.5] and 5.0 [2.0–7.0], respectively, p=0.88). Median number of TJs was higher for patients in the TP vs no-TP group (1.0 [0.0–2.5] vs 0.0 [0.0–1.0], respectively, p=0.05) (Table 2), although the median number of PJs was similar (1.0 [0.0–1.0] vs 0.5 [0.0–2.0], p=0.92) (Figure 3).
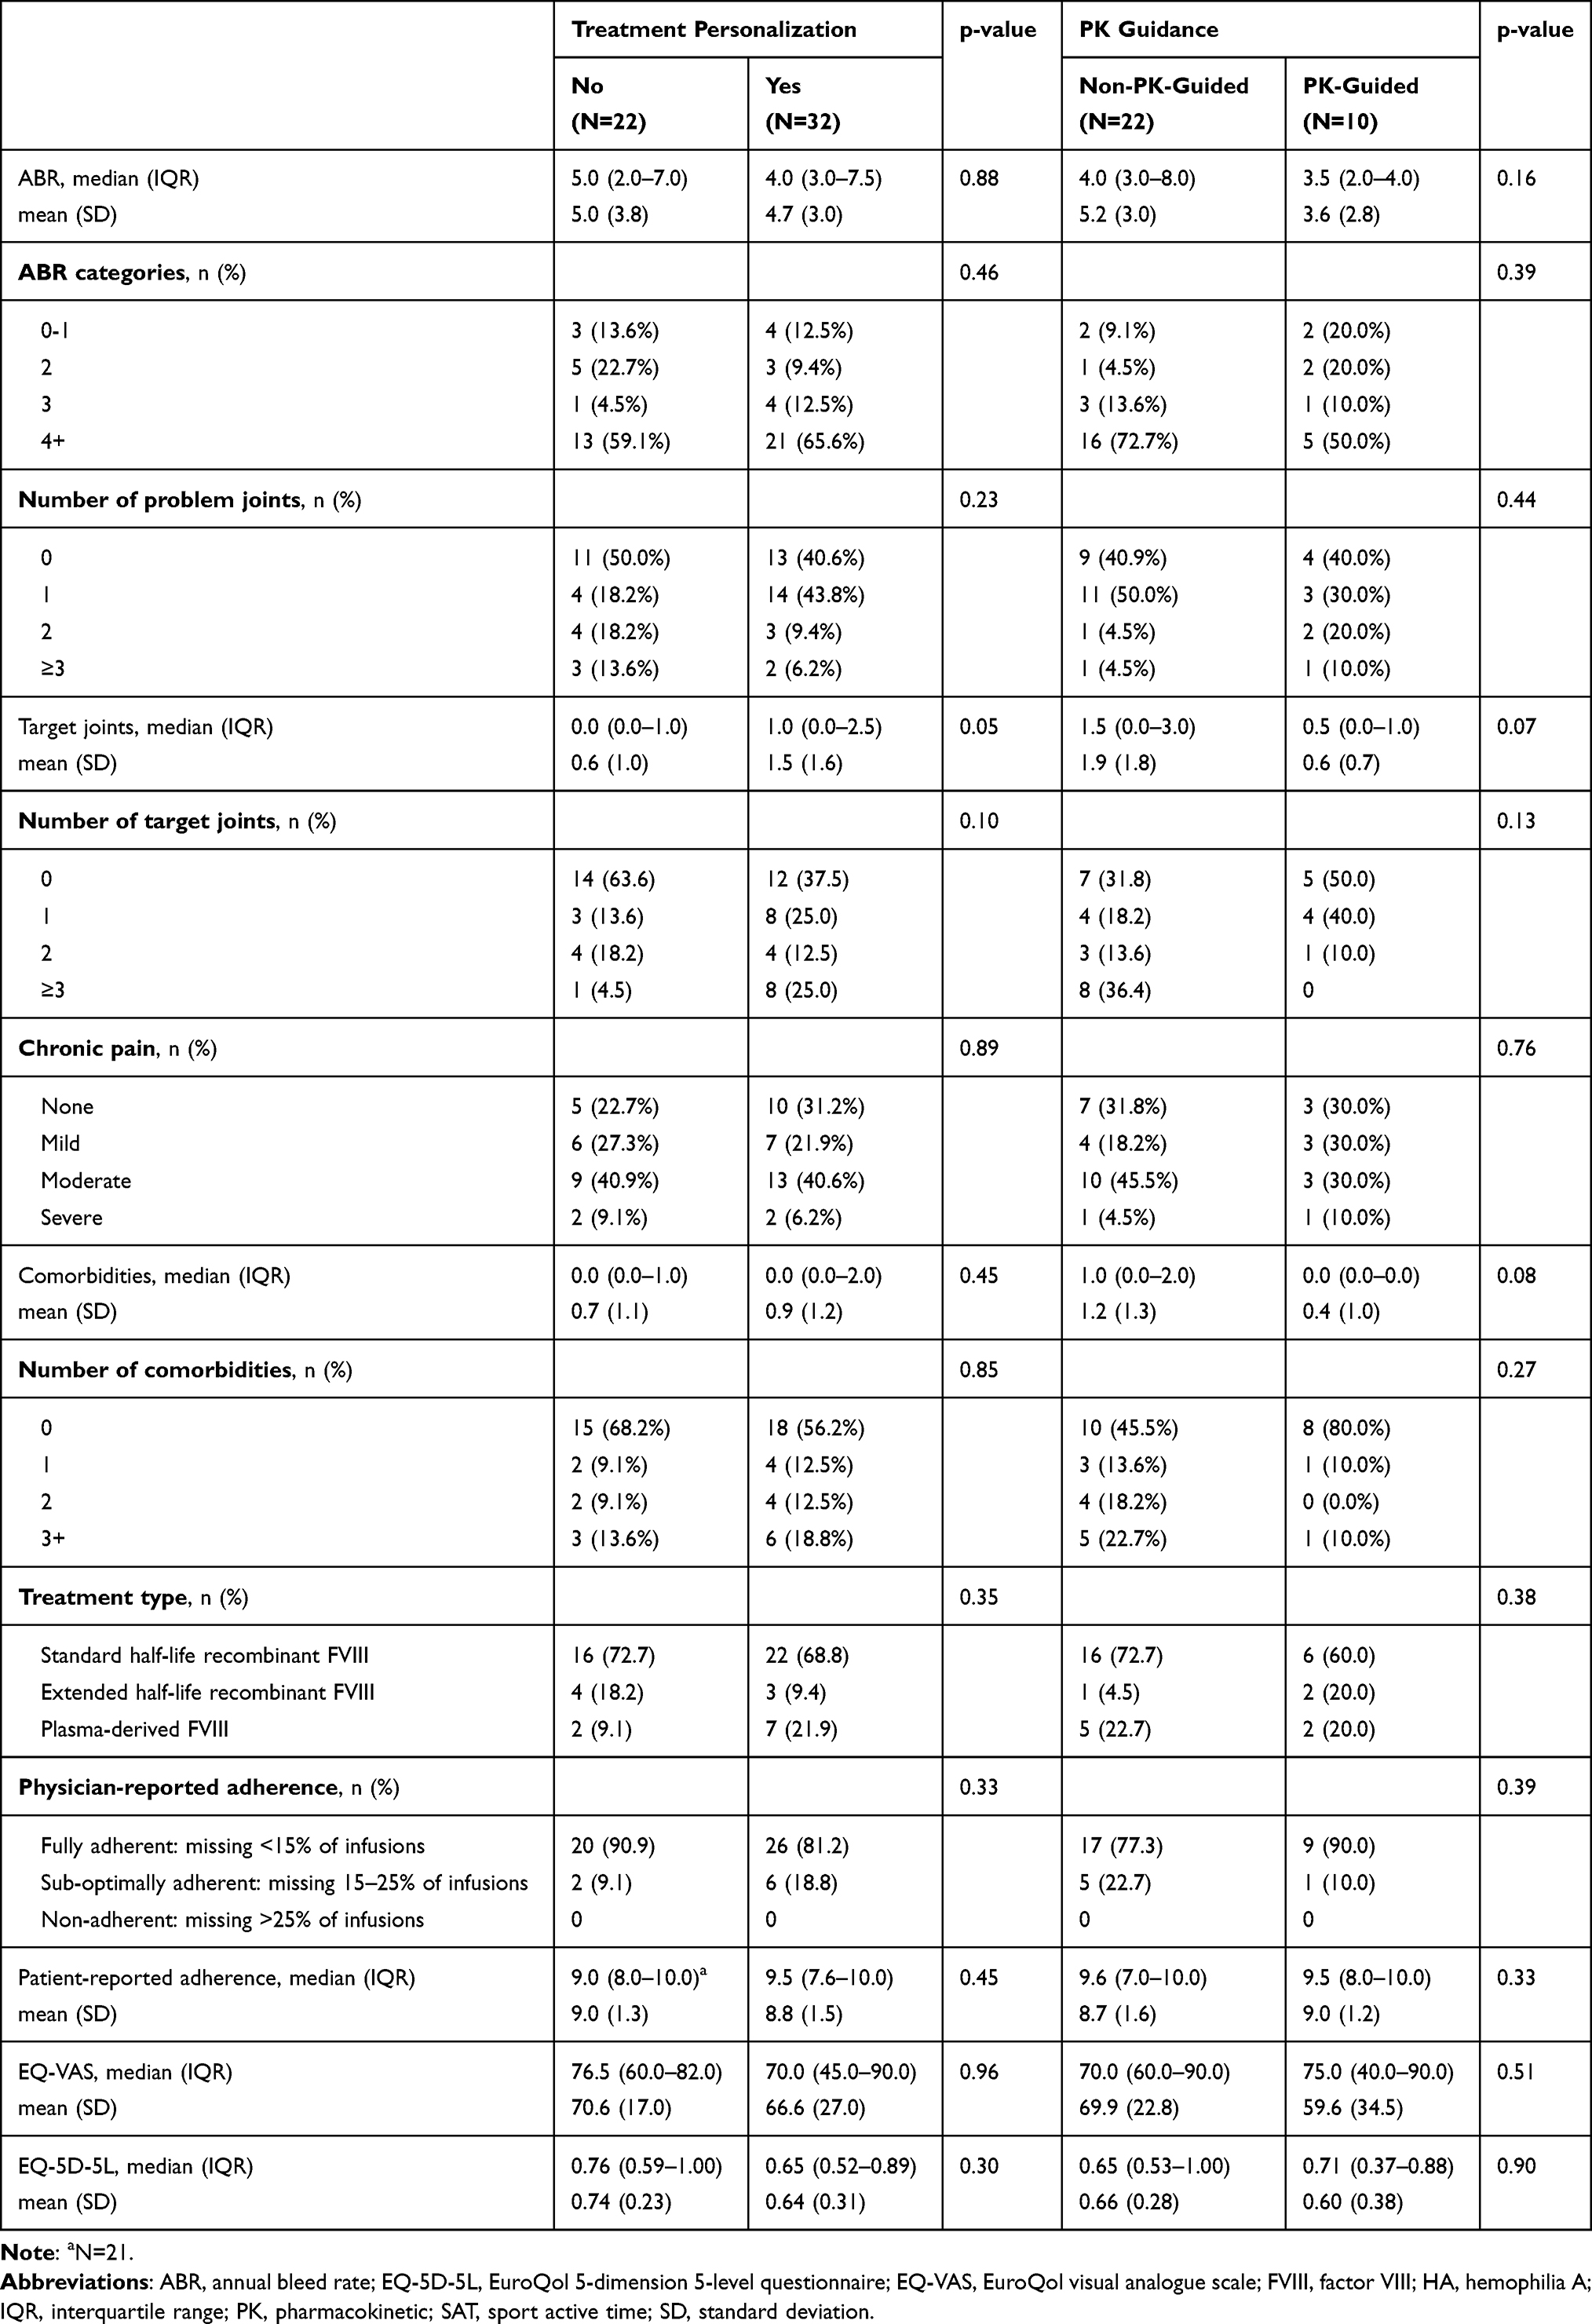 |
Table 2 Clinical Characteristics and Patient-Reported Outcomes Stratified by Treatment Personalization |
 |
Figure 3 Mean and median number of problem joints in patients with severe HA with and without treatment personalization. Abbreviations: HA, hemophilia A; IQR, interquartile range; PK, pharmacokinetic. |
Median (IQR) ABR was higher for patients receiving non-PK-guided TP (4.0 [3.0–8.0]) than for patients receiving PK-guided TP (3.5 [2.0–4.0]) (p=0.16, Table 2). Median (IQR) TJs were also higher for patients receiving non-PK-guided treatment (1.5 [0.0–3.0]), compared with patients receiving PK-guided treatment (0.5 [0.0–1.0], p=0.07). Median (IQR) PJs were similar between patients receiving non-PK-guided and PK-guided TP, (1.0 [0.0–1.0] and 1.0 [0.0–2.0] respectively; p=0.58, Figure 3).
The percentage of patients with moderate to severe chronic pain was similar between patients in the TP and no-TP groups (46.9% and 50.0%, respectively), and was higher for patients receiving non-PK-guided treatment (50.0%) than patients receiving PK-guided treatment (40.0%; Table 2). Median (IQR) EQ-5D-5L scores were higher for patients in the no-TP group (0.76 [0.59–1.00]) than those in the TP group (0.65 [0.52–0.89]); and were lower for patients receiving non-PK-guided (0.65 [0.53–1.00]) compared with PK-guided TP (0.71 [0.37–0.88]) with a higher score indicating better HRQoL (Table 2).
Patients in the TP vs no-TP group had a higher median (IQR) SAT per month (3.3 [1.8–6.2] vs 1.8 [0.7–5.0] hours, p=0.04) (Figure 4). Patients receiving PK-guided treatment had a higher median (IQR) SAT per month of 4.0 (3.0–20.0) hours than patients receiving non-PK-guided treatment with 3.0 (1.3–5.3) hours (p=0.15, Figure 4).
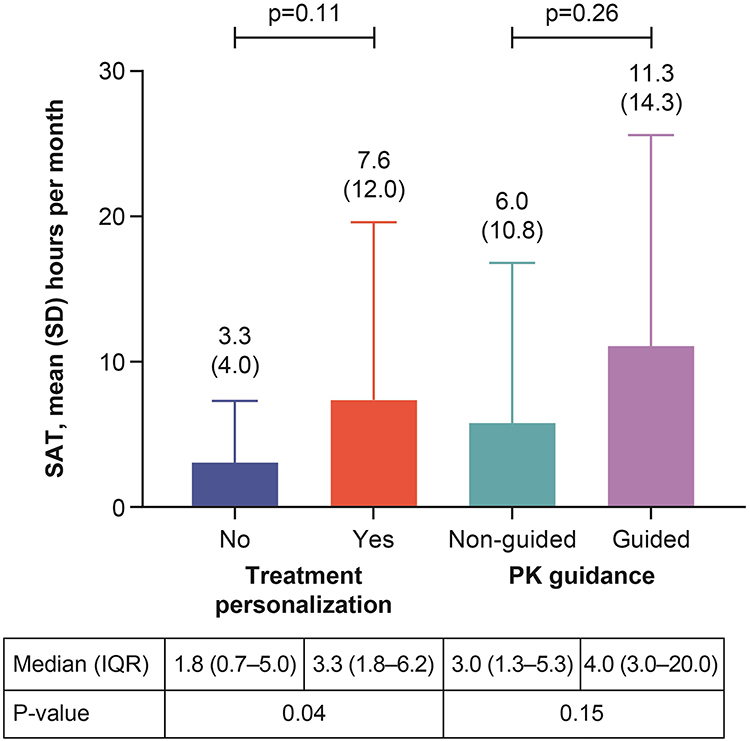 |
Figure 4 Mean and median SAT per month in hours in patients with severe HA with and without treatment personalization. Abbreviations: HA, hemophilia A; IQR, interquartile range; PK, pharmacokinetic; SAT, sport active time. |
Propensity Score Matching
The variables derived from the univariable and multivariable analyses used for PSM were age, BMI, ABR, PJs, with/without university education, patient-reported adherence, and physician-reported chronic pain. After controlling for the matching variables, patients in the TP group showed a higher SAT per month compared with those in the no-TP group (ATE 4.8 [p<0.05], ATT 5.7 [p<0.01]), and patients with PK-guided TP had a higher SAT per month than those with non-PK-guided TP (ATE 14.8 [p<0.001], ATT 6.8 [p<0.01], Table 3).
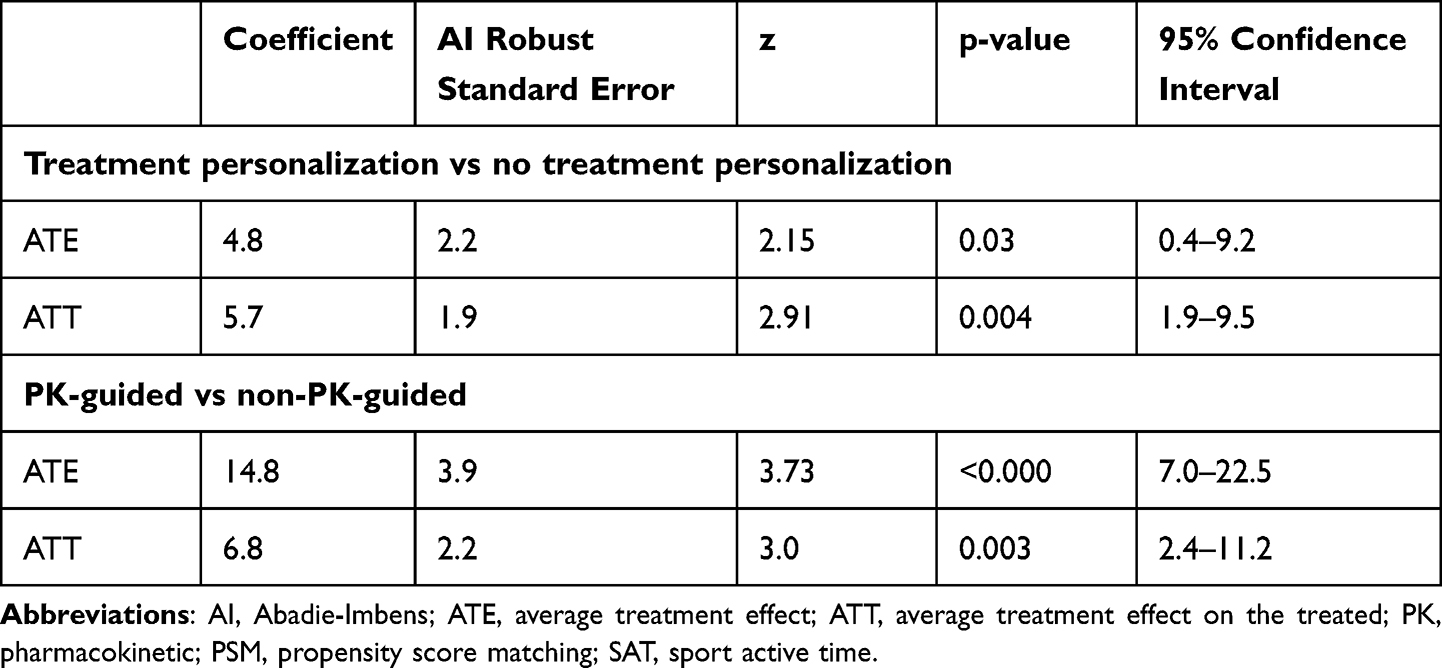 |
Table 3 PSM Model for SAT with Treatment Personalization and PK Guidance |
Sensitivity Analyses
To ensure the validity of the estimated ATE and ATT, sensitivity analysis was conducted on the results. Specifically, balance of the propensity score distributions was visually inspected pre- and post-matching via balance plots. Additionally, the robustness of the estimated results to the effect of an unmeasured confounder was estimated via Rosenbaum bounds.
Visual inspection of the balance and box plots (Figures 5 and 6) suggests an overall improvement in alignment of propensity scores between the treated groups and control groups after matching, particularly for key clinical and treatment variables such as ABR, chronic and acute pain and treatment adherence. This post-matching alignment allows for more accurate estimation of treatment effects (Table S1). The balance plots for TP (Figure 5) appeared more balanced than that for PK guidance (Figure 6), which is consistent with the smaller population within the PK guidance PSM model.
 |
Figure 5 TP ATE PSM balance plot. (A) TP density plot, (B) TP box plot. Abbreviations: ATE, average treatment effect; PSM, propensity score matching; TP, treatment personalization. |
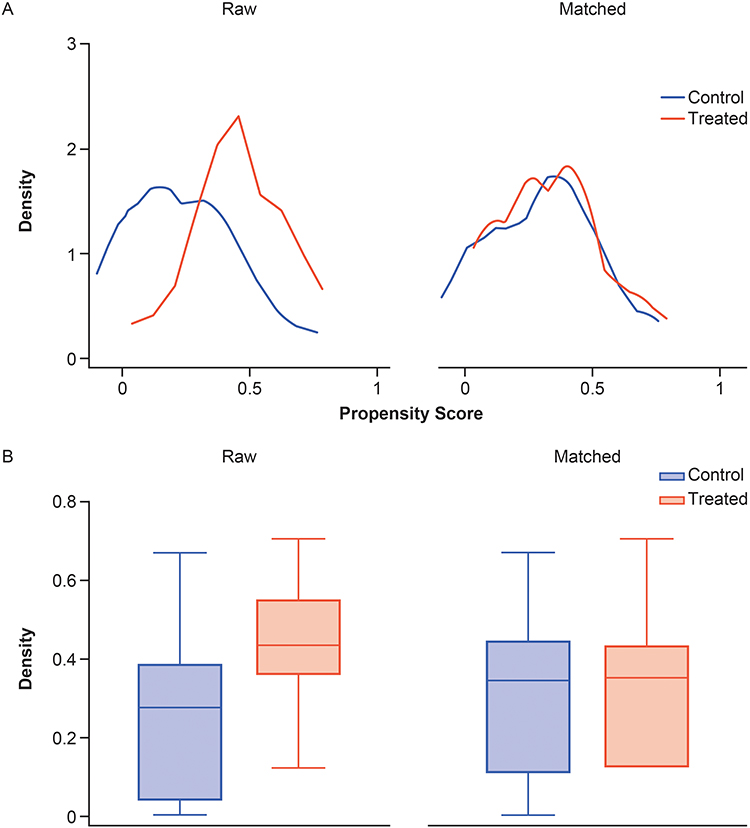 |
Figure 6 PK guidance ATE PSM balance plot. (A) PK-guidance density plot, (B) PK-guidance box plot. Abbreviations: ATE, average treatment effect; PK, pharmacokinetic; PSM, propensity score matching; TP, treatment personalization. |
The Rosenbaum bounds for the ATT PSM model of TP binary at the 0.05 significance level indicate a Gamma value between 2.4 and 2.45, suggesting that the estimated treatment effect is robust to an unobserved bias that increases the odds of treatment assignment by 140%, but sensitive to a bias increasing these odds by 145%, as statistical significance is lost beyond this threshold. Similarly, for the ATT PSM model of PK guidance binary, the Gamma value falls between 1.55 and 1.6, indicating robustness of the treatment effects to a bias that increases treatment odds by 55%, but sensitivity to a 60% increase at the 0.05 significance level.
Discussion
Physical activity and SAT are important for patients with HA to improve physical condition and clinical outcomes.6–10 Indeed, guidelines from the World Federation of Hemophilia (WFH) recommend regular physical activity for patients to promote bone health maintenance, muscle strengthening, and a healthy body weight, which can decrease bleed frequency and improve self-esteem.2,8 This analysis aimed to assess the SAT of patients with HA receiving different levels of TP. Median age differed between the TP and no-TP groups, while BMI was similar. Bleeding rates were lower in patients receiving personalized care compared with those who were not and are consistent with findings from the larger CHESS II cohort.16 Lower ABR and annualized joint bleeding rates have been described in patients receiving PK-guided treatment compared with standard prophylaxis; however, these differences can vary.16,31–33 Additionally, data have shown that maintaining higher target trough levels through personalized care can achieve lower bleeding rates.11
Notably, median TJ rates were higher in the TP vs no-TP group, although PJs (ie joints with chronic pain and/or limited range of movement, a more patient-centered and chronic measure than TJs21,22), were similar in the TP and no-TP groups. Quality of life (EQ-5D-5L score) was better in patients in the no-TP vs TP group. Taken together, these results may suggest that patients with more severe disease are more likely to receive TP in response to increased bleeding rates and/or the emergence of joint health deterioration. Quality of life may also have been better in the no-TP group because undertaking TP may be associated with an increased treatment burden due to additional monitoring, tests and/or clinic visits. Despite this, patients receiving TP reported higher SAT per month compared with those in the no-TP group. Although this study did not investigate the reasons why patients with TP were more able to engage in sporting activity, it is possible that TP increased their confidence in managing perceived risks of physical activity.
PSM models were used to further assess whether TP has an effect on activity participation. PSM is a particularly appropriate approach for investigating hemophilia, owing to the heterogeneous nature of the patient population and the often small sample sizes.34 PSM offers increased face validity by using like for like comparison through its matching process (only matching the closest observation in the opposite arm), allowing for an accurate and focused estimation of the difference in the outcome of interest between the treated and control groups.27 Overall, PSM analysis suggested a positive effect of TP on physical activity, particularly for patients with PK-guided compared with non-PK-guided. The PSM models confirmed that SAT was higher for patients in the TP vs no-TP group, and was substantially higher for patients receiving PK-guided compared with non-PK-guided TP, when controlling for age, BMI, ABR, PJs, treatment adherence, and pain.
To confirm the robustness of the PSM model, a number of sensitivity analyses were performed, such as the analysis of pre- and post-matching characteristics, balance plots, and Rosenbaum bounds. Robustness, in the context of the PSM model, refers to the model’s ability to produce reliable and valid estimates of the treatment effect, even in the presence of potential confounding factors. Pre- and post-matching characteristics and balance plots, derived from the propensity scores of the two ATE SAT models, indicated improved balance across both models. Additionally, the Rosenbaum bounds analysis revealed that the PSM models were resistant to high levels of unmeasured confounding.
The results of this analysis are consistent with a previous analysis of CHESS II in which PK-guided dosing was associated with lower bleeding rates and less healthcare resource utilization compared with patients not receiving PK-guided dosing.16 Taken together, the data from these studies provide further support for the recommendation of the WFH that PK-guided prophylaxis should be used to provide sufficient clotting factor levels for patients to maintain their lifestyle.2 Given the importance of physical activity to both overall health and HA-related outcomes, the results of the present analysis suggest that any form of TP, including PK-guided prophylaxis, may allow patients to partake more in physical activities, as recommended by the WFH, with greater bleed control. This may allow patients to benefit both physically and mentally from an active lifestyle.
Limitations
The results of this analysis should be considered in the context of limitations inherent to the nature of cross-sectional studies examining data from a single point in time and the secondary nature of this analysis, data from the CHESS II study already existed and were not collected for the specific purpose of this analysis. Additionally, participation in the study was entirely voluntary and contingent on patients visiting their physician, therefore a degree of selection bias cannot be excluded. Due to the retrospective nature of data collected, by patients and physicians in the original CHESS II study, a degree of recall bias cannot be ruled out, as well as errors in the transfer of data from the medical charts. Patients receiving emicizumab prophylaxis were not included in this analysis, as the study aimed to assess the implications of PK guided personalized factor treatment on physical activity levels and therefore their inclusion would not have been appropriate due to the inability to adjust emicizumab dosing. However, the effects of differing prophylaxis options for hemophilia A on physical activity should be investigated in future studies. Outputs from this analysis should be interpreted with caution owing to the small sample sizes. Finally, the results should be interpreted considering the limitations of the statistical methods employed. While matching with replacement optimizes balance and reduces variability of estimates, which, despite being accounted for in the estimation of variance, may lead to over-representation of certain control observations and therefore reduce generalizability. Additionally, although PSM is not a substitute for randomization, it ensures balance in measured confounders. Therefore, despite employing sensitivity analysis via Rosenbaum bounds to assess their potential effects, unmeasured confounders may have had an impact on the results of this analysis.
Conclusion
The results of this study indicate that TP supports patients to engage in more physical activity than those with no TP. With appropriate health management and treatment regimens, patients could participate in more activities, experiencing the clinical and psychosocial benefits associated with an active lifestyle.
Further real-world evidence is required to assess the impact of TP on bleed outcomes, adherence, HRQoL, healthcare resource utilization, and patient physical activity levels, as well as helping to identify additional areas of unmet need.
Abbreviations
ABR, annual bleeding rate; ATE, average treatment effect; ATT, average treatment effect on the treated; BMI, body mass index; EQ-VAS, EuroQol visual analogue scale; FVIII, protein factor VIII; HA, hemophilia A; HB, hemophilia B; HRQoL, health-related quality of life; PJs, problem joints; PK, pharmacokinetic; PPIE, patient and public involvement and engagement; PSM, propensity score matching; SAT, sport active time; SD, standard deviation; TJs, target joints; TP, treatment personalization; WFH, World Federation of Hemophilia.
Data Sharing Statement
The datasets generated and/or analyzed during the current study are held under license by the University of Chester and are not publicly available. Upon reasonable request, and subject to review, the corresponding author will provide the analyses that support the findings of this research. Subject to certain criteria, conditions, and exceptions, access to the related data for researchers who provide a methodologically sound proposal may be considered by data owners HCD Economics and the University of Chester. The data will be provided after its de-identification, in compliance with applicable privacy laws, data protection, and requirements for consent and anonymization.
Ethics Approval and Informed Consent
All data were collected and analyzed anonymously and in aggregate form. The study was carried out in accordance with the relevant regional guidelines and approved by the Research Ethics Sub Committee of the Faculty of Health and Social Care within the University of Chester.
Acknowledgments
Under the direction of the authors, medical writing support was provided by Emma Green, PhD, Excel Scientific Solutions (Fairfield, CT), and was funded by Takeda Development Center Americas, Inc., Cambridge, MA, USA.
Author Contributions
All authors contributed to the work reported, whether that is in the conception, study design, execution, acquisition of data, analysis and interpretation, or in all these areas; took part in drafting, revising or critically reviewing the article; gave final approval of the version to be published; have agreed on the journal to which the article has been submitted; and agree to be accountable for all aspects of the work.
Funding
This study was funded by Takeda Development Center Americas, Inc., Lexington, MA, USA. The wider CHESS II study was supported by unrestricted research grants from BioMarin, Sanofi, and Takeda.
Disclosure
TB, EFG, and TB are employees of HCD Economics Ltd. MW and KHD are employees of Takeda and Takeda stockholders. The authors report no other conflicts of interest in this work.
References
1. Peyvandi F, Garagiola I, Young G. The past and future of haemophilia: diagnosis, treatments, and its complications. Lancet. 2016;388(10040):187–197. doi:10.1016/S0140-6736(15)01123-X
2. Srivastava A, Santagostino E, Dougall A, et al. WFH guidelines for the management of hemophilia, 3rd edition. Haemophilia. 2020;26(S6):1–158. doi:10.1111/hae.14046
3. Flaherty LM, Schoeppe J, Kruse‐Jarres R, Konkle BA. Balance, falls, and exercise: beliefs and experiences in people with hemophilia: a qualitative study. Res Pract Thromb Haemost. 2018;2(1):147–154. doi:10.1002/rth2.12060
4. Poon JL, Zhou ZY, Doctor JN, et al. Quality of life in haemophilia A: Hemophilia Utilization Group Study Va (HUGS-Va). Haemophilia. 2012;18(5):699–707. doi:10.1111/j.1365-2516.2012.02791.x
5. Trippoli S, Vaiani M, Linari S, Longo G, Morfini M, Messori A. Multivariate analysis of factors influencing quality of life and utility in patients with haemophilia. Haematologica. 2001;86(7):722–728.
6. Hilberg T, Herbsleb M, Puta C, Gabriel HHW, Schramm W. Physical training increases isometric muscular strength and proprioceptive performance in haemophilic subjects. Haemophilia. 2003;9(1):86–93. doi:10.1046/j.1365-2516.2003.00679.x
7. Pierstorff K, Seuser A, Weinspach S, Laws HJ. Physiotherapy home exercise program for haemophiliacs. Klin Padiatr. 2011;223(3):189–192. doi:10.1055/s-0031-1275337
8. Negrier C, Seuser A, Forsyth A, et al. The benefits of exercise for patients with haemophilia and recommendations for safe and effective physical activity. Haemophilia. 2013;19(4):487–498. doi:10.1111/hae.12118
9. Souza J, Simoes H, Campbell CS, Pontes F, Boullosa D, Prestes J. Haemophilia and exercise. Int J Sports Med. 2012;33(02):83–88. doi:10.1055/s-0031-1286292
10. Tiktinsky R, Falk B, Heim M, Martinovitz U. The effect of resistance training on the frequency of bleeding in haemophilia patients: a pilot study. Haemophilia. 2002;8(1):22–27. doi:10.1046/j.1365-2516.2002.00575.x
11. Klamroth R, Windyga J, Radulescu V, et al. Rurioctocog alfa pegol PK-guided prophylaxis in hemophilia A: results from the Phase 3 PROPEL study. Blood. 2021;137(13):1818–1827. doi:10.1182/blood.2020005673
12. Collins PW, Fischer K, Morfini M, Blanchette VS, Bjorkman S; International Prophylaxis Study Group Pharmacokinetics Expert Working Group. Implications of coagulation factor VIII and IX pharmacokinetics in the prophylactic treatment of haemophilia. Haemophilia. 2011;17(1):2–10. doi:10.1111/j.1365-2516.2010.02370.x
13. Valentino LA, Pipe SW, Collins PW, et al. Association of peak factor VIII levels and area under the curve with bleeding in patients with haemophilia A on every third day pharmacokinetic-guided prophylaxis. Haemophilia. 2016;22(4):514–520. doi:10.1111/hae.12905
14. Oladapo AO, Epstein JD, Williams E, Ito D, Gringeri A, Valentino LA. Health‐related quality of life assessment in haemophilia patients on prophylaxis therapy: a systematic review of results from prospective clinical trials. Haemophilia. 2015;21(5):e344–358. doi:10.1111/hae.12759
15. Wyrwich KW, Krishnan S, Auguste P, et al. Changes in health-related quality of life with treatment of longer-acting clotting factors: results in the A-LONG and B-LONG clinical studies. Haemophilia. 2016;22(6):866–872. doi:10.1111/hae.12987
16. Ferri Grazzi E, Sun SX, Burke T, O’Hara J. The impact of pharmacokinetic-guided prophylaxis on clinical outcomes and healthcare resource utilization in hemophilia A patients: real-world evidence from the CHESS II study. J Blood Med. 2022;13:505–516. doi:10.2147/JBM.S363028
17. Brookhart MA, Schneeweiss S, Rothman KJ, Glynn RJ, Avorn J, Stürmer T. Variable selection for propensity score models. Am J Epidemiol. 2006;163(12):1149–1156. doi:10.1093/aje/kwj149
18. Rubin DB, Thomas N. Matching using estimated propensity scores: relating theory to practice. Biometrics. 1996;52(1):249–264. doi:10.2307/2533160
19. Ferri Grazzi E, Becker T, Brandt S, et al. Clinical and humanistic burden of non-inhibitor haemophilia A in five European countries: insights from the CHESS II study. Adv Ther. 2024;41(10):3888–3904. doi:10.1007/s12325-024-02956-0
20. O’Hara J, Hughes D, Camp C, Burke T, Carroll L, Garcia Diego D-A. The cost of severe haemophilia in Europe: the CHESS study. Orphanet J Rare Dis. 2017;12(1):106. doi:10.1186/s13023-017-0660-y
21. O’Hara J, Khair K, McLaughlin P, et al. P154 “Problem joint” a more patient relevant definition for joint morbidity in haemophilia [abstract]. Haemophilia. 2019;25(S1):111–112.
22. Burke T, Rodriguez-Santana I, Chowdary P, et al. Humanistic burden of problem joints for children and adults with haemophilia. Haemophilia. 2023;29(2):608–618. doi:10.1111/hae.14731
23. Blanchette VS, Key NS, Ljung LR, et al. Definitions in hemophilia: communication from the SSC of the ISTH. J Thromb Haemost. 2014;12(11):1935–1939. doi:10.1111/jth.12672
24. Gilbert MS. Prophylaxis: musculoskeletal evaluation. Semin Hematol. 1993;30(3 Suppl 2):3–6.
25. EuroQol Research Foundation. EQ-5D-5L user guide. Available from: https://euroqol.org/publications/user-guides/.
26. Benedetto U, Head SJ, Angelini GD, Blackstone EH. Statistical primer: propensity score matching and its alternatives. Eur J Cardiothorac Surg. 2018;53(6):1112–1117. doi:10.1093/ejcts/ezy167
27. Austin PC. An introduction to propensity score methods for reducing the effects of confounding in observational studies. Multivariate Behav Res. 2011;46(3):399–424. doi:10.1080/00273171.2011.568786
28. Gu XS, Rosenbaum PR. Comparison of multivariate matching methods: structures, distances, and algorithms. J Comput Graph Stat. 1993;2(4):405–420. doi:10.1080/10618600.1993.10474623
29. DiPrete TA, Gangl M. 7. Assessing bias in the estimation of causal effects: Rosenbaum bounds on matching estimators and instrumental variables estimation with imperfect instruments. Sociol Methodol. 2004;34(1):271–310. doi:10.1111/j.0081-1750.2004.00154.x
30. Becker S, Caliendo M. Sensitivity analysis for average treatment effects. Stata J. 2007;7(1):71–83. doi:10.1177/1536867X0700700104
31. Gu C, Huang H, Han Y. Cost-effectiveness analysis of pharmacokinetic-guided prophylaxis versus standard prophylaxis in adults with severe hemophilia A in China. Adv Ther. 2022;39(8):3777–3788. doi:10.1007/s12325-022-02220-3
32. Klamroth R, Kurnik K, Wenning S, et al. Pharmacokinetic-guided prophylaxis with rurioctocog alfa pegol improves bleeding rates over standard prophylaxis: real-world observational data from the Ahead German study [abstract]. Blood. 2021;138(Suppl 1):3187. doi:10.1182/blood-2021-146162
33. Lissitchkov T, Rusen L, Georgiev P, et al. PK-guided personalized prophylaxis with Nuwiq® (human-cl rhFVIII) in adults with severe haemophilia A. Haemophilia. 2017;23(5):697–704. doi:10.1111/hae.13251
34. Cenzer I, Boscardin WJ, Berger K. Performance of matching methods in studies of rare diseases: a simulation study. Intractable Rare Dis Res. 2020;9(2):79–88. doi:10.5582/irdr.2020.01016
 © 2025 The Takeda Pharmaceutical Company Limited (Takeda). This work is published and licensed by Dove Medical Press Limited. The
full terms of this license are available at https://www.dovepress.com/terms
and incorporate the Creative Commons Attribution
- Non Commercial (unported, 4.0) License.
By accessing the work you hereby accept the Terms. Non-commercial uses of the work are permitted
without any further permission from Dove Medical Press Limited, provided the work is properly
attributed. For permission for commercial use of this work, please see paragraphs 4.2 and 5 of our Terms.
© 2025 The Takeda Pharmaceutical Company Limited (Takeda). This work is published and licensed by Dove Medical Press Limited. The
full terms of this license are available at https://www.dovepress.com/terms
and incorporate the Creative Commons Attribution
- Non Commercial (unported, 4.0) License.
By accessing the work you hereby accept the Terms. Non-commercial uses of the work are permitted
without any further permission from Dove Medical Press Limited, provided the work is properly
attributed. For permission for commercial use of this work, please see paragraphs 4.2 and 5 of our Terms.
Recommended articles
The Impact of Pharmacokinetic-Guided Prophylaxis on Clinical Outcomes and Healthcare Resource Utilization in Hemophilia A Patients: Real-World Evidence from the CHESS II Study
Ferri Grazzi E, Sun SX, Burke T, O'Hara J
Journal of Blood Medicine 2022, 13:505-516
Published Date: 19 September 2022
Effect of Exercise Interventions on Health-Related Quality of Life in Patients with Fibromyalgia Syndrome: A Systematic Review and Network Meta-Analysis
Zhang KD, Wang LY, Zhang ZH, Zhang DX, Lin XW, Meng T, Qi F
Journal of Pain Research 2022, 15:3639-3656
Published Date: 22 November 2022
Influence of Coaching on Effectiveness, Participation, and Safety of an Exercise Program for Postmenopausal Women with Osteoporosis: A Randomized Trial
Bragonzoni L, Barone G, Benvenuti F, Ripamonti C, Lisi L, Benedetti MG, Marini S, Dallolio L, Maietta Latessa P, Zinno R, Audino G, Kemmler W, Pinelli E
Clinical Interventions in Aging 2023, 18:143-155
Published Date: 5 February 2023
Real-World Experience of People with Hemophilia A Receiving Turoctocog Alfa Pegol (N8-GP): Results from a Patient Experience Survey
Eichler H, Nagao A, Waller J, Stuber A
Patient Preference and Adherence 2023, 17:3001-3014
Published Date: 17 November 2023
How Do Exercise, Sleep and Depression Affect Disease Scores and Quality of Life in Primary Sjögren’s Syndrome Patients?
Tastekin F, Karatas E, Aydin O, Yargucu Zihni F, Kabasakal Y, Barutcuoglu B, Karabulut G
International Journal of General Medicine 2024, 17:2981-2991
Published Date: 9 July 2024