Back to Journals » Cancer Management and Research » Volume 18

Exploratory Pilot Multi-Omics Profiling of Gut Microbiota and Metabolic Features in Patients with Prolactinoma
Authors Yang J, Nie D, Zhang Y, Li C ![]()
Received 9 March 2026
Accepted for publication 22 May 2026
Published 16 June 2026 Volume 2026:18 608026
DOI https://doi.org/10.2147/CMAR.S608026
Checked for plagiarism Yes
Review by Single anonymous peer review
Peer reviewer comments 2
Editor who approved publication: Professor Yong Teng
Jianing Yang,1 Ding Nie,2 Yazhuo Zhang,1 Chuzhong Li1
1Department of Cell Biology, Beijing Neurosurgical Institute, Capital Medical University, Beijing, People’s Republic of China; 2Department of Neurosurgery, Beijing Tiantan Hospital, Capital Medical University, Beijing, People’s Republic of China
Correspondence: Chuzhong Li, Department of Cell Biology, Beijing Neurosurgical Institute, Capital Medical University, No. 119 South Fourth Ring West Road, Fengtai District, Beijing, 10070, People’s Republic of China, Email [email protected]
Background: Growing evidence suggests a potential role of the gut microbiota in pituitary neuroendocrine tumors (PitNETs). This exploratory study focused on prolactinoma, the most prevalent PitNET subtype, to preliminarily characterize gut microbial and metabolic features associated with the disease.
Materials and Methods: Fecal samples were collected from five patients with hyperprolactinemic prolactinoma and five patients with nonfunctioning (NF) PitNETs. Exploratory metagenomic and metabolomic analyses were performed to profile gut microbiota composition and metabolic alterations.
Results: Compared with NF PitNET controls, prolactinoma patients showed distinct trends in gut microbial composition, including increased abundances of Bacteroides and Eubacterium and decreased abundances of Blautia and Clostridium. Metabolomic profiling identified differential metabolic features, including elevated fatty acid esters of hydroxy fatty acids (FAHFAs) and palmitoleic acid, which were mainly associated with glucose and lipid metabolism pathways.
Conclusion: This pilot multi-omics analysis provides preliminary evidence of altered gut microbiome–metabolite profiles in prolactinoma. These findings are hypothesis-generating and may support further investigation of gut–pituitary axis interactions in larger, well-powered cohorts.
Keywords: prolactinoma, gut microbiota, hyperprolactinemia, microbiome, metabolome
Introduction
Prolactinomas are the most common subtype of pituitary neuroendocrine tumors (PitNETs), accounting for approximately 50–53% of all cases, and are characterized by excessive prolactin secretion leading to hyperprolactinemia and multisystem complications.1,2 Dopamine agonists (DAs) are the first line of therapy and are effective in most patients; however, 10–30% of patients exhibit drug resistance and tumor recurrence, particularly those with large or invasive prolactinomas.3,4 These challenges highlight the need for a deeper understanding of prolactinoma pathogenesis beyond classical endocrine regulation.
Growing evidence has established the gut microbiota as a key regulator of host metabolism, immunity, neuroendocrine signaling, and therapeutic responsiveness.5–8 Notably, gut microbes influence dopamine metabolism, bile acid composition, stress hormone levels, and estrogen signaling pathways, which are directly involved in the regulation of prolactin secretion.9,10 These findings suggest that the gut microbiota may represent an underappreciated modulator of prolactin homeostasis and prolactinoma biology.
Recent studies have begun to explore the relationship between the gut microbiota and PitNETs and have demonstrated distinct microbial alterations in patients with Cushing’s disease, somatotropinoma, and nonfunctioning (NF) PitNETs.11–13 However, despite prolactinoma being the most prevalent PitNET subtype, the gut microbiome characteristics of individuals with prolactinoma remain largely unexplored.14
In this exploratory study, we applied shotgun metagenomic sequencing combined with nontargeted liquid chromatography‒mass spectrometry (LC‒MS) metabolomics to profile gut microbiome and fecal metabolic features in prolactinoma patients compared with NF PitNET controls. By integrating microbial taxonomic, functional, and metabolomic analyses, we aimed to explore potential prolactinoma-associated microbiome‒metabolite patterns and to examine possible links between gut microbial alterations and prolactin-related metabolic remodeling.
Materials and Methods
Clinical Cohort
This was an exploratory pilot study. Ten PitNET patients from Beijing Tiantan Hospital of Capital Medical University were recruited between January 2021 and December 2022, including five patients with prolactinoma and five with NF PitNET. Patients with prolactinoma were included in the study if they met the following criteria: imaging studies confirming the presence of a pituitary adenoma, preoperative serum prolactin levels exceeded five times the upper limit of normal, other pituitary hormones were within normal ranges, and there were no clinical manifestations of acromegaly or Cushing’s syndrome. For patients with NF PitNETs, the inclusion criteria were as follows: imaging studies confirming the presence of a pituitary adenoma, preoperative pituitary hormone levels that were normal, and no symptoms, such as menstrual irregularities, galactorrhea, acromegaly, or features of Cushing’s syndrome. In both groups, none of the patients had been treated with dopamine agonists prior to admission; none had acute gastrointestinal symptoms within 2 weeks; none were taking antibiotics or microbial agents; none had a history of ongoing gastrointestinal disease; none had a history of infections, tumors, cardiovascular or other diseases; and none had a history of smoking or alcohol abuse. The two groups were comparable in age and sex distribution. All participants were recruited from a single center and originated from a relatively similar geographic region that surrounding Beijing in North China. This study was approved by the Ethics Committee of Capital Medical University at Beijing Tiantan Hospital (KY 2021–032-02) and conducted in accordance with the Declaration of Helsinki. Written informed consent was obtained from all participants for the use of their fecal samples and related clinical data. All the data were anonymized to protect participant confidentiality.
Sample Collection and Metagenomic Sequencing
Prior to surgery, fresh fecal samples from all ten patients were collected. The samples were sealed immediately after collection and temporarily stored at −20°C before being transferred to a freezer at −80°C within 2 h for extended storage.
Sequencing of all the samples was performed by Novogene Bioinformatics Ltd. after the extraction of bacterial DNA using a kit. An Illumina platform was used for sequencing. Clean data facilitated metagenome assembly, MetaGeneMark was used for gene prediction, gene catalogs were constructed and compared with MicroNR libraries, and nonredundant gene clusters were categorized and functionally annotated. Following the merging of gene abundance tables, species abundance tables at various classification levels were derived using the species annotation data (unigene) for each gene. This was followed by functional annotation and pathway abundance analysis based on the Kyoto Encyclopedia of Genes and Genomes (KEGG) database.
Nontargeted Metabolomics
Fecal samples (50 mg) were extracted with 500 μL of 80% methanol and vortexed thoroughly. Each mixture was incubated on ice for 5 min and centrifuged at 15,000 × g at 4°C for 20 min. The supernatant was subsequently diluted with LC‒MS-grade water to a final methanol concentration of 53% and centrifuged again under the same condition. The resulting supernatant was transferred to LC‒MS vials and subjected to ultra-performance liquid chromatography‒tandem mass spectrometry (UPLC‒MS/MS) analysis. Raw UPLC‒MS/MS datasets were processed using Compound Discoverer 3.1 (Thermo Fisher Scientific) in an untargeted metabolomics workflow, including peak alignment, metabolite annotation, and quantification based on peak intensity data. The normalized data were used to predict the molecular formulas using addition ions, molecular ion peaks, and fragment ions. Compounds with a coefficient of variation greater than 30% in the quality control samples were excluded after data normalization to ensure reliable metabolite identification and relative quantification.
Statistical Analysis
Sequences were aligned against the NCBI nonredundant database using DIAMOND software, and taxonomic annotations were assigned using the lowest common ancestor (LCA) algorithm. Principal coordinate analysis (PCoA), nonmetric multidimensional scaling (NMDS), and analysis of similarities (ANOSIM) were performed using the vegan and ade4 packages in R software. Linear discriminant analysis effect size (LEfSe) was used to identify differentially abundant taxa between the two groups, with taxa ranked according to linear discriminant analysis (LDA) scores.
Multivariate analysis was performed using partial least squares discriminant analysis (PLS-DA) with metaX software, and variable importance in projection (VIP) scores were calculated for each metabolite. In addition, univariate analysis was conducted using Student’s t-test to evaluate differences between groups, and fold change (FC) values were determined. Differentially abundant metabolites were identified based on the combined criteria of VIP > 1, p < 0.05, and FC ≥ 2 or ≤ 0.5.
Correlation between the host metabolome and gut microbiome was assessed using Spearman’s rank correlation analysis. For comparisons of clinical and demographic variables, categorical variables were analyzed using Fisher’s exact test, and continuous variables were compared using the Mann–Whitney U-test. A two-sided p < 0.05 was considered statistically significance.
Results
Clinical Characteristics of the Subjects
A total of five patients diagnosed with prolactinoma were included in the study, and five patients with NF PitNETs were included as controls. The clinical features of the participants are presented in Table 1. No substantial differences were observed with respect to age, sex, body mass index, maximum tumor diameter, or gross total resection between the two groups. Plasma prolactin levels were higher in the prolactinoma group than in the NF PitNET group (P = 0.01). Baseline clinical characteristics of each participant are provided in Supplementary Material.
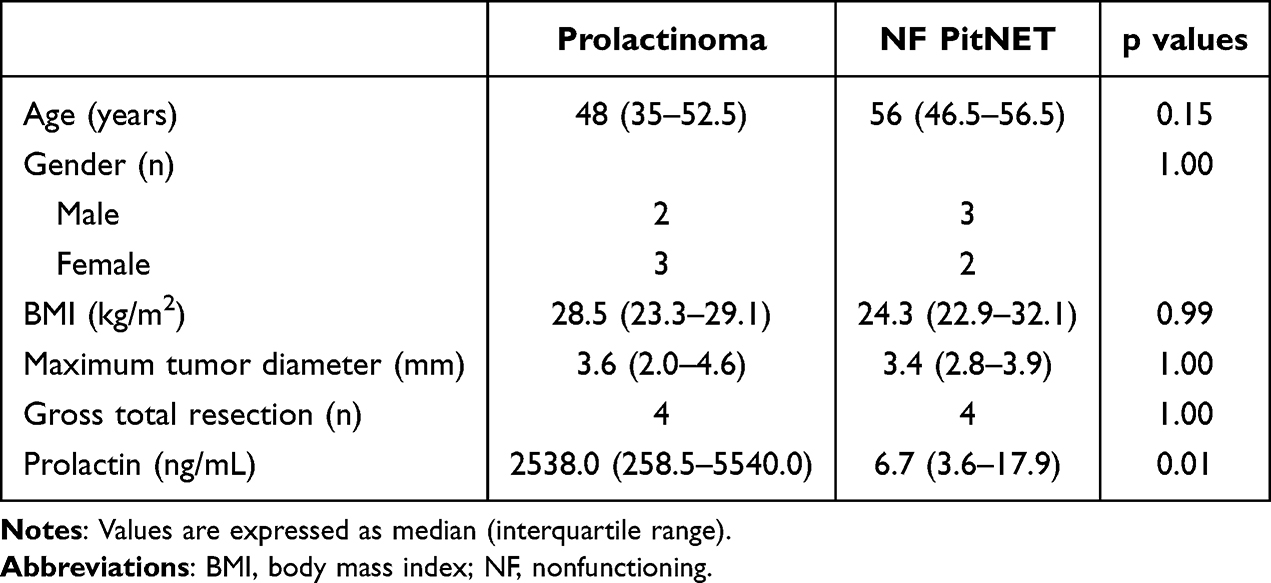 |
Table 1 Clinical Characteristics of the Subjects |
Changes in Intestinal Microbiome Composition in Patients with Prolactinoma
To assess gene diversity, rarefaction curves were generated by incrementally increasing the number of samples to estimate core and pan-genes. The core gene curve decreased and stabilized with increasing sample size, indicating a consistent set of shared functional genes across samples. Meanwhile, the pan-gene curve increased and plateaued, suggesting that most genes in the cohort were captured (Figure 1A). The numbers of unique genes were 106,082 and 96,451 in the NF PitNET and prolactinoma groups, respectively (Figure 1B). In addition, similarity analyses at the genus and species levels revealed that components differed significantly more between groups than within groups (p = 0.021 and p = 0.019, respectively) (Figure 1C and D). At the genus and species levels, PCoA score plots based on Bray–Curtis dissimilarity revealed separation between the prolactinoma and NF PitNET groups, suggesting differences in microbial community composition (Figure 1E and F).
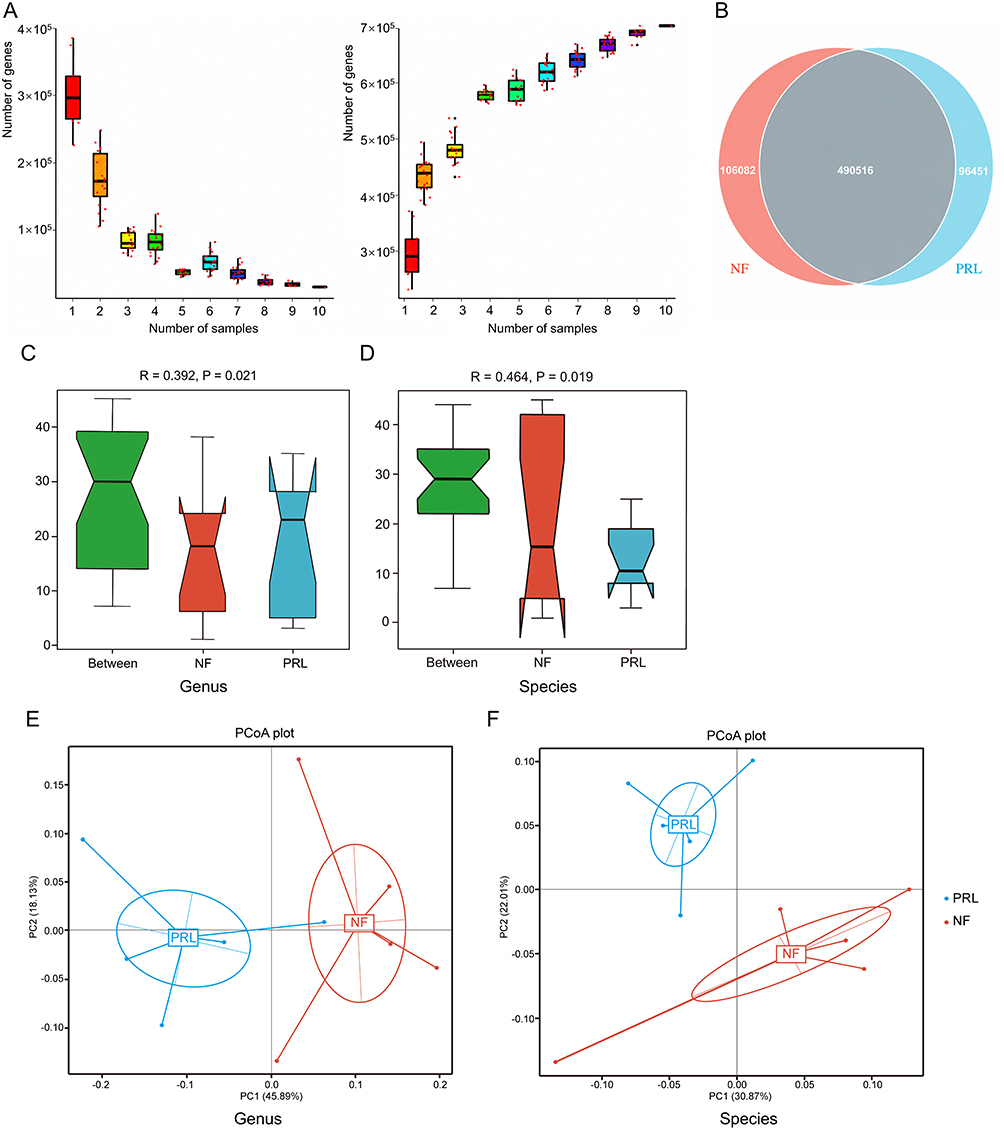 |
Figure 1 Gene prediction and abundance analysis of gut microbial gene profiles. (A) Rarefaction curves of core genes (left) and pan genes (right). The x-axis represents the number of samples, and the y-axis represents the number of genes. (B) Venn diagram of gene number distribution. (C and D) ANOSIM results at the genus and species levels. The x-axis indicates group categories, and the y-axis shows the distribution of pairwise sample dissimilarities. (E and F) Principal coordinate analysis (PCoA) plots based on Bray–Curtis dissimilarity at the genus and species levels, showing β diversity between the prolactinoma and NF PitNET groups. Abbreviations: NF, nonfunctioning PitNET group; PRL, prolactinoma group. |
We first constructed heatmaps of clustered microbial abundance at the genus level to compare group-level and sample-level patterns between prolactinoma and NF PitNET patients (Figure 2A and B). We then performed species level analysis to further refine these differences, revealing distinct species-level abundance patterns between the two groups (Figure 2C and D). This hierarchical analysis allowed us to capture both broad compositional shifts and subtle taxonomic differences.
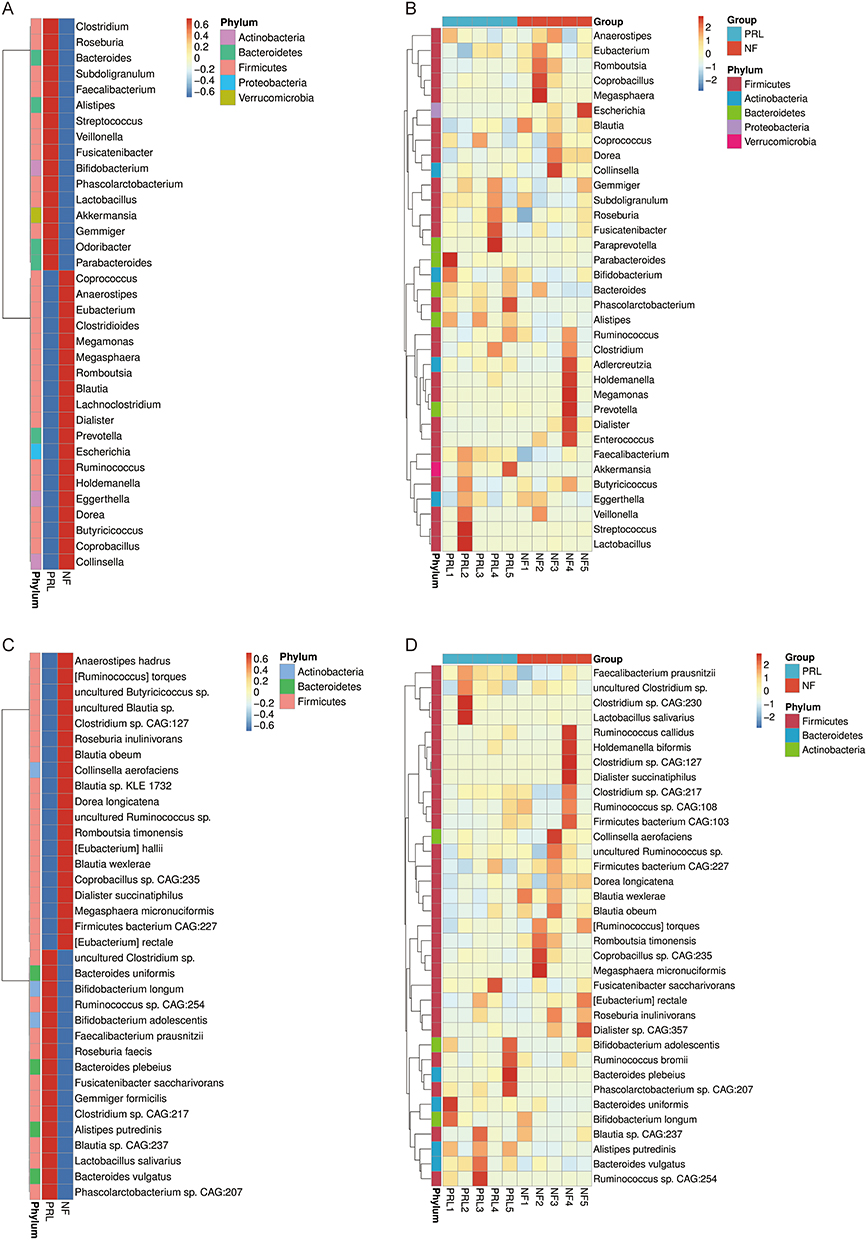 |
Figure 2 Differential microbial clustering heatmaps of the prolactinoma group and NF PitNET group at the genus level (A and B) and species level (C and D). The horizontal axis represents sample information, and the vertical axis represents annotation information. The cluster tree is presented on the left. The corresponding Z value was obtained after standardized processing of the relative abundance in each row. Abbreviations: NF, nonfunctioning PitNET group; PRL, prolactinoma group. |
In addition, to identify taxa differentially abundant between groups, LEfSe analysis was performed, and the distribution of LDA scores was visualized in histograms (Figure 3A). The abundances of Bacteroides and Eubacterium were increased in the prolactinoma group, whereas those of Blautia and Clostridium were decreased, indicating that the gut microbial composition of the prolactinoma group significantly differed from that of the NF PitNET group. KEGG functional annotation showed that the gut microbial genes were associated mainly with metabolic pathways. Among these genes, carbohydrate metabolism, amino acid metabolism, and cofactor and vitamin metabolism represented the most enriched functional categories, comprising 31,322, 23,310, and 17,180 genes, respectively (Figure 3B).
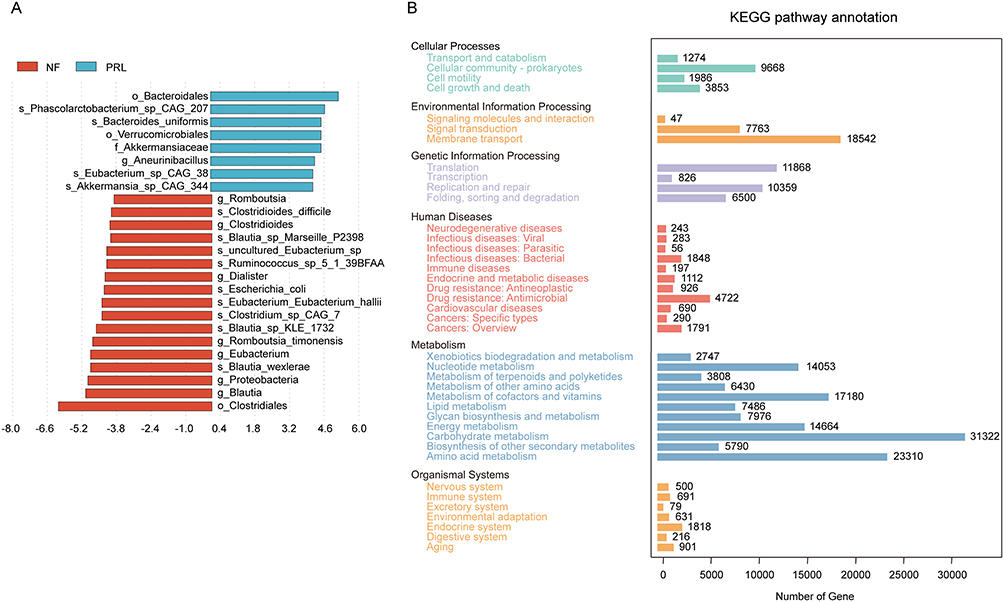 |
Figure 3 Comparative microbial analysis between the prolactinoma group and the NF PitNET group and functional assessment. (A) Linear discriminant analysis (LDA) score distribution of differentially abundant taxa between groups. The length of each bar represents the effect size of each species. (B) KEGG pathway annotation showing the distribution of genes across different functional categories. The x-axis represents the number of genes, and the y-axis represents KEGG functional categories. Abbreviations: NF, nonfunctioning PitNET group; PRL, prolactinoma group. |
Differences in Fecal Metabolites Between the Prolactinoma and NF PitNET Groups
To investigate metabolic differences between the two groups, fecal samples from both cohorts were subjected to nontargeted LC–MS metabolomics. Analyses were performed in both positive (POS) and negative (NEG) ion modes to comprehensively characterize metabolic alterations between the prolactinoma and NF PitNET groups. The results of the PLS-DA score plots showed clear separation between the two groups in both ionization modes, indicating distinct global metabolic profiles (Figure 4A and B). Differentially abundant metabolite analysis using volcano plots showed a broad spectrum of significantly altered metabolites between the prolactinoma and NF PitNET groups (Figure 4C and D). Several lipid-related and metabolism-associated metabolites, including docosatrienoic acid and phylloquinone, were significantly increased upon detection in positive ion mode, while fatty acid esters of hydroxy fatty acids (FAHFAs) and ursolic acid were increased upon detection in negative ion mode. These findings indicate substantial remodeling of the fecal lipid and metabolic profiles in patients with prolactinoma.
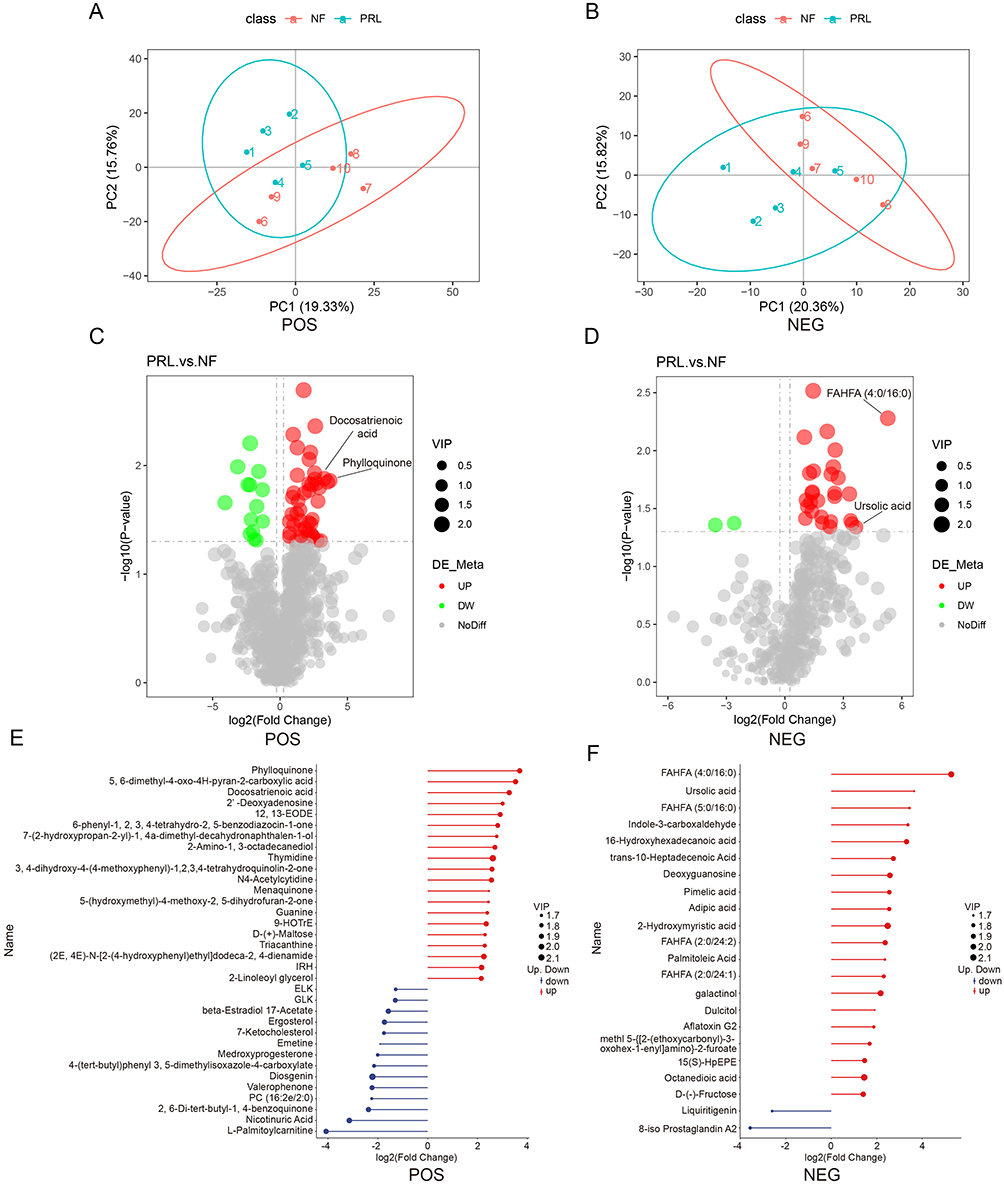 |
Figure 4 Multivariate and differential analysis of fecal metabolomic profiles between prolactinoma and NF PitNET groups. (A and B) Partial least squares discriminant analysis (PLS-DA) score plots of metabolomic profiles in positive (POS) and negative (NEG) ion modes, showing separation between the prolactinoma and NF PitNET groups. (C and D) Volcano plots of differentially abundant metabolites in POS and NEG ion modes. The y-axis represents −log10(p value), and the x-axis represents log2(fold change). Each point represents a metabolite; red indicates increased abundance and green indicates decreased abundance. (E and F) Top 20 differentially abundant metabolites in POS and NEG ion modes, ranked by variable importance in projection (VIP) scores. Red indicates increased abundance and blue indicates decreased abundance. Abbreviations: PRL, prolactinoma; NF, nonfunctioning PitNET; POS, positive ion mode; NEG, negative ion mode. |
To further visualize the most prominent metabolites showing differential abundance, the top 20 metabolites were ranked to illustrate the magnitude and direction of metabolite changes between the two groups (Figure 4E and F). Consistent with the volcano plot results, metabolites such as phylloquinone and docosatrienoic acid were markedly increased in the prolactinoma group upon detection in positive ion mode, whereas FAHFAs, ursolic acid, and pimelic acid were among the top increased metabolites detected in negative ion mode.
To visualize the global expression patterns of differentially abundant metabolites, hierarchical clustering analysis was performed on the basis of their abundance profiles, revealing distinct metabolite clusters between the prolactinoma and NF PitNET groups (Figure 5A and B). To visualize coordinated variation among differentially abundant metabolites, chord diagrams were constructed on the basis of pairwise correlation coefficients of the top 20 differentially abundant metabolites (ranked by p value) across samples (Figure 5C and D). Finally, KEGG pathway enrichment analysis was performed on the basis of the differentially abundant metabolites, and bubble plots were generated to visualize significantly enriched metabolic pathways in the prolactinoma and NF PitNET groups (Figure 6A and B). In addition, metabolite association networks were constructed on the basis of curated pathway information to illustrate potential metabolic connections among differentially abundant metabolites, providing a systems-level overview of metabolite relationships (Figure 6C and D).
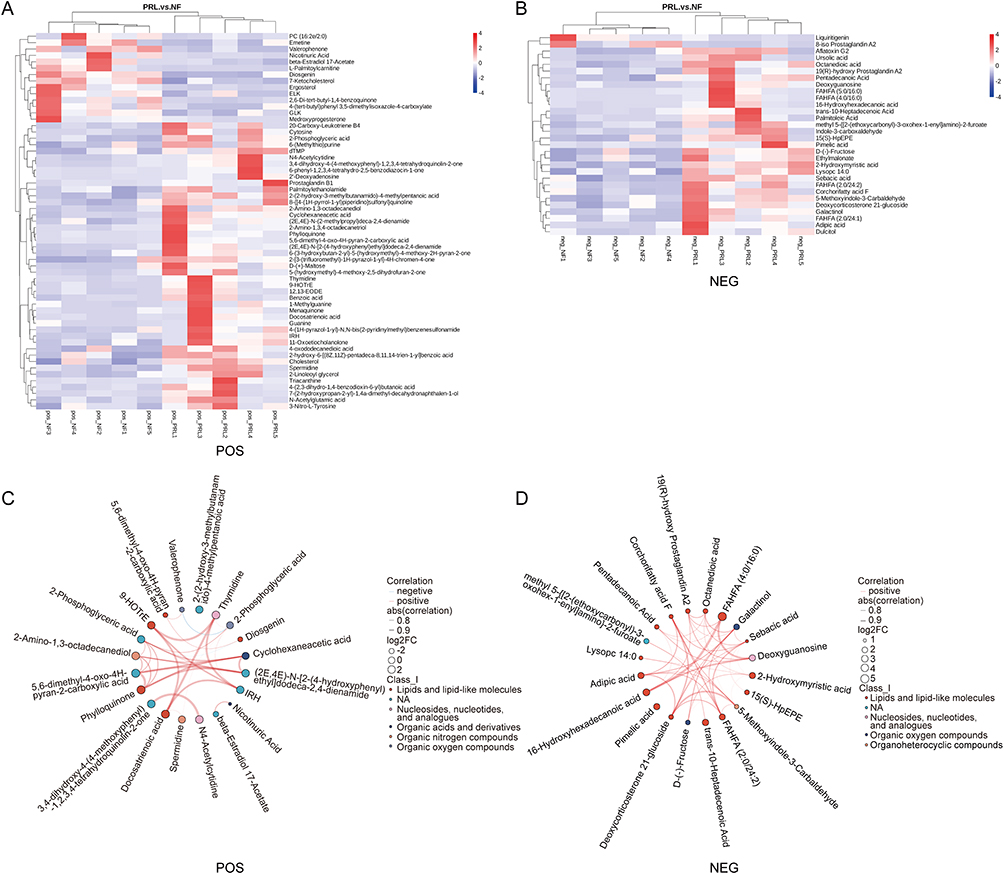 |
Figure 5 Metabolite clustering and correlation of differentially abundant fecal metabolites. (A and B) Heatmaps of differentially abundant metabolites in POS and NEG ion modes. Rows represent metabolites and columns represent samples. Hierarchical clustering was applied to both dimensions. (C and D) Chord diagrams illustrating pairwise correlations among the top 20 differentially abundant metabolites in POS and NEG ion modes. Node colors indicate metabolite classes, node size represents log2(fold change), and edge thickness reflects correlation strength. Red and blue edges indicate positive and negative correlations, respectively. Abbreviations: PRL, prolactinoma group; NF, nonfunctioning PitNET group; POS, positive ion mode; NEG, negative ion mode. |
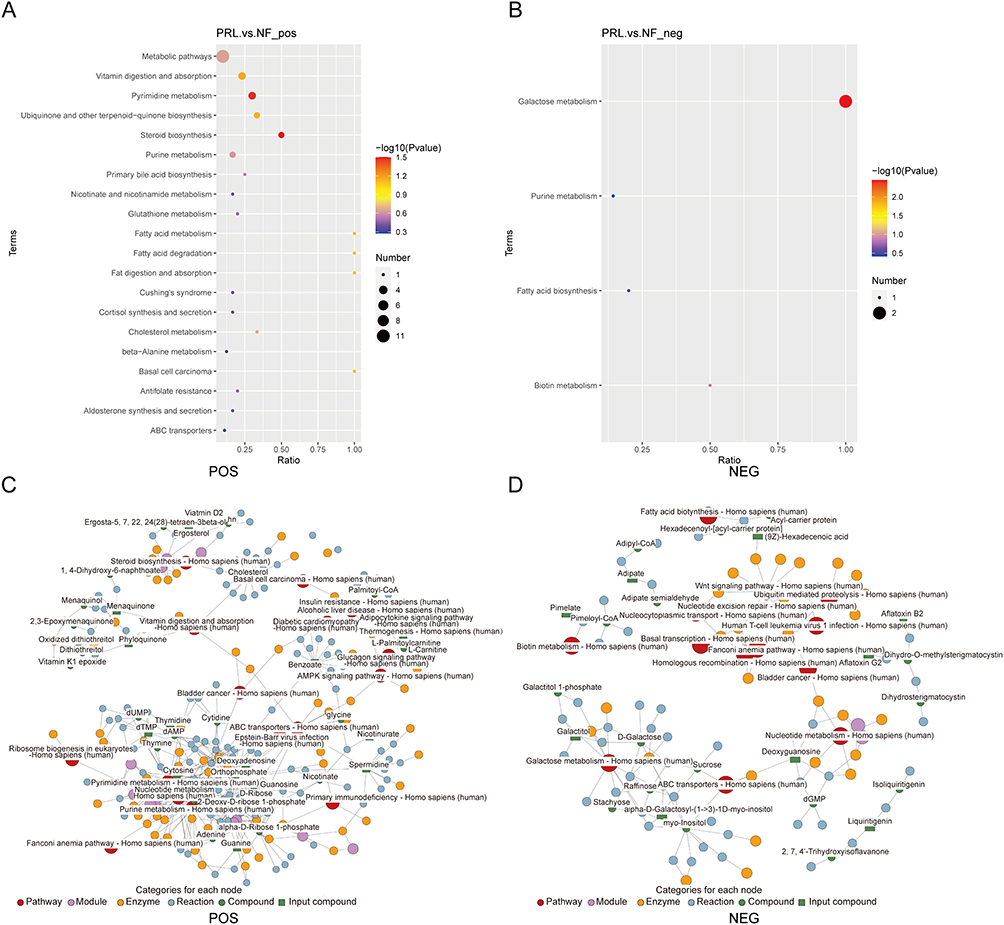 |
Figure 6 Pathway and network analysis of differentially abundant fecal metabolites. (A and B) KEGG pathway enrichment analysis of differentially abundant metabolites. Bubble plots show enriched pathways, where color indicates −log10(p value) and bubble size represents the number of metabolites involved. (C and D) Metabolic network visualization in POS and NEG ion modes. Abbreviations: PRL, prolactinoma group; NF, nonfunctioning PitNET group; POS, positive ion mode; NEG, negative ion mode. |
Correlation Analysis of the Fecal Microbiome and Metabolites
To explore the associations between the gut microbial composition and fecal metabolite profiles, correlation analyses were performed between significantly altered microbial taxa and differentially abundant metabolites at the species level using Spearman correlation coefficients. Heatmaps were generated to visualize covariation patterns between microbial taxa and metabolite levels across samples (Figure 7A and B). In addition, chord diagrams were constructed to illustrate the network structure and strength of associations between genera and metabolites (Figure 7C and D). Notably, Diosgenin levels were positively correlated with Asaccharospora and Desulfuribacillus but negatively correlated with Faecalibacterium and Ornithobacterium in the prolactinoma group. In contrast, FAHFA levels were positively correlated with the abundance of Butyricimonas. These findings suggest coordinated changes between specific microbial taxa and lipid-related metabolites in the gut microbiota of prolactinoma patients.
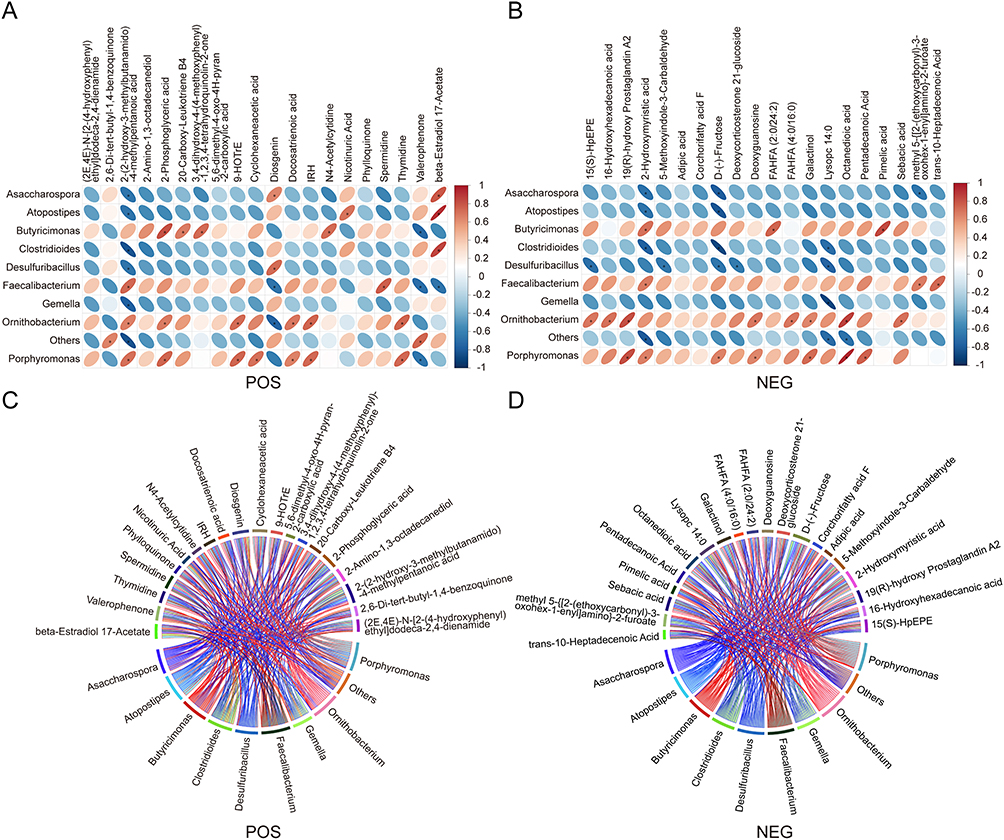 |
Figure 7 Correlation between fecal metabolites and gut microbes. (A and B) Analysis of the correlation heatmap with the Spearman correlation coefficient in POS and NEG modes. Columns represent differentially abundant metabolites and rows represent differential bacterial genera. The color scale on the right indicates the correlation coefficient, with red indicating positive correlations and blue indicating negative correlations. An asterisk (*) indicates a statistically significance difference (p < 0.05). (C and D) Chord diagrams illustrating pairwise correlations between differentially abundant bacteria and metabolites in POS and NEG modes. Nodes represent bacteria and metabolites, with colors indicating their respective categories. Links represent correlations, and line thickness reflects correlation strength. Abbreviations: POS, positive ion mode; NEG, negative ion mode. |
Discussion
Compared with patients with nonfunctioning PitNETs, patients with prolactinoma are associated with a distinct gut microbiome and fecal metabolic profile, supporting a potential link between prolactin-related endocrine alterations and the gut microbial composition. Rather than reflecting a uniform PitNET-associated microbiome, our findings indicate that prolactinoma exhibits a subtype-specific microbial signature characterized by shifts in key bacterial taxa, including increased abundance of Bacteroides and Eubacterium and reduced abundance of Blautia and Clostridium. Notably, this microbial pattern differs from that reported in growth hormone-secreting pituitary adenomas, which have been associated with reduced Bacteroides abundance and increased Blautia abundance.15 Together with our observations in both prolactinoma and NF PitNET patients, these findings suggest that individuals with different PitNET subtypes may harbor distinct gut microbiome configurations, potentially reflecting differences in the hormonal milieu and metabolic regulation. This subtype-specific microbial heterogeneity provides a foundation for exploring immune and neuroendocrine mechanisms linking the gut microbiome to prolactinoma pathophysiology.
Emerging evidence suggests that the gut microbiota can influence antitumor immunity by modulating T-cell-mediated responses. In immune checkpoint–refractory melanoma, enrichment of Bacteroides species has been associated with reduced CD8⁺ T-cell infiltration and increased immunosuppressive cell populations, and the results of fecal transplantation experiments have further supported the microbiota-dependent regulation of antitumor immunity.7 In the context of pituitary tumors, compared with patients with NF PitNETs, those with prolactinoma exhibit greater CD8⁺ T-cell infiltration, whereas dopamine agonist-resistant prolactinomas exhibit a relative reduction in the presence of CD8⁺ T cells.16 Given our observation of Bacteroides enrichment in prolactinoma patients, these findings raise the possibility that prolactinoma-associated alterations in the gut microbiome may influence tumor immune landscapes, potentially contributing to heterogeneous therapeutic responses. Although our study did not directly assess the intratumoral immune cell composition, the association between Bacteroides expansion and immune modulation observed in other tumor types provides a rationale for further investigation into gut microbiota–immune interactions in individuals with prolactinoma, particularly those resistant to dopamine agonists.
In addition to immune-related mechanisms, prolactin plays a central role in systemic metabolic regulation, providing an additional framework for interpreting the metabolic alterations observed in prolactinoma patients.17 Hyperprolactinemia is associated with metabolic dysregulation, including increased adiposity and impaired glucose homeostasis.18,19 Consistent with these roles of prolactin in metabolism, our metabolomic analyses suggested notable alterations in lipid- and glucose-related metabolites in prolactinoma patients compared with those in NF PitNET controls. In addition, prolactin critically regulates adipocyte lipid homeostasis through two pathways: suppression of free fatty acid (FFA) uptake and inhibition of glucose-derived lipogenesis, thereby impairing lipid storage capacity in adipose tissue.19 FAHFAs are a newly discovered class of biologically active lipid molecules that can improve blood glucose tolerance, promote insulin secretion, and alleviate inflammation associated with obesity in mammals.20,21 The association of FAHFAs with specific gut microbial taxa in our study further suggests that prolactinoma-associated gut microbiome alterations may participate in shaping host metabolic phenotypes. Taken together, these findings support a model in which prolactin-driven metabolic perturbations and gut microbiome-associated metabolic remodeling may converge, potentially contributing to the systemic metabolic features observed in prolactinoma patients.
Prolactin has also been implicated in the regulation of neuroendocrine stress responses and affective behaviors, positioning it at the intersection of endocrine, metabolic, and neuropsychiatric regulation. While the precise mechanisms linking prolactin to mood disorders remain incompletely understood, emerging evidence suggests that stress-responsive pathways and metabolic signaling may play contributing roles.22 Studies have shown that persistent hyperprolactinemia leads to diminished stress-responsive neuronal activity in the hypothalamus, particularly in hypothalamic paraventricular nucleus subregions.23,24 Additionally, Torner and Donner et al suggested that prolactin has antianxiety effects in animal models.24,25 Hyperprolactinemia also has an antidepressant effect in rodents.26 In this context, our metabolomic findings provide exploratory clues linking prolactinoma-associated metabolic alterations with neuropsychiatric-related pathways. Notably, the level of 2-phosphoglyceric acid, a metabolite previously reported to be elevated in patients in depressive states,27 was increased in the prolactinoma group and correlated with specific gut microbial taxa. In parallel, the levels of palmitoleic acid, a lipid metabolite associated with improved metabolic and neuropsychiatric profiles in both animal and human studies, significantly increased in the prolactinoma group. Similarly, palmitoleic acid concentrations changed significantly in mice with depression-like behavior, whereas in human studies, high levels of palmitoleic acid were associated with low levels of depression.28,29 These metabolite changes, together with their associations with the gut microbial composition, suggest that gut microbiota-related metabolic remodeling may be involved in modulating prolactin-associated neuroendocrine phenotypes. The hypothalamic–pituitary–adrenal (HPA) axis represents a potential integrative framework linking stress, metabolism, and the gut microbiota.30–32 Given the bidirectional interactions between gut microbes and HPA axis activity, prolactin-associated alterations in the gut microbiome may influence stress-responsive neuroendocrine signaling through microbiota-metabolite pathways.33,34 Although these interpretations remain speculative, they provide a conceptual basis for future studies investigating gut–brain–endocrine interactions in the context of prolactinoma.
Several limitations of this study should be acknowledged. First, the relatively small sample size reflects the exploratory pilot nature of this investigation and warrants cautious interpretation of the findings. Larger, independent cohorts with adequate statistical power and sex-stratified analysis are required for validation. Second, although all participants were recruited from a single center and originated from the North China region, which may partially reduce large-scale geographic heterogeneity, dietary habits were not systematically recorded and may have influenced gut microbial composition. Third, due to the cross-sectional design, the dynamic effects of hyperprolactinemia on the gut microbiome over time could not be assessed. In addition, metabolomic profiling was limited to fecal samples, and the lack of serum metabolomic data restrict interpretation of potential systemic immune associations. Finally, experimental validation using animal models or microbiota-targeted interventions is needed to determine whether the observed microbial alterations play a causal role in prolactinoma.
Despite these limitations, this exploratory pilot multi-omics study provides a preliminary integrated view of gut microbiome and fecal metabolomic alterations in prolactinoma. Rather than establishing definitive disease-specific signatures, our findings highlight potential microbial and metabolic patterns that may serve as hypothesis-generating signals, offering a foundation for future mechanistic and translational studies on gut–endocrine interactions in prolactinoma. Future studies with larger sample sizes and incorporation of dietary information are warranted to validate and extend these findings.
Conclusion
In summary, this exploratory study provides a preliminary integrated metagenomic and metabolomic profile of the gut microbiome in prolactinoma patients, revealing altered microbial and metabolic patterns as well as coordinated microbiome–metabolite associations. These findings suggest a possible association between gut microbial alterations and endocrine–metabolic features in prolactinoma and serve as a hypothesis-generating basis for future mechanistic and translational studies.
Declaration of AI Use
In this article, ChatGPT (5.3) was used for phrasing and grammar correction, but AI was not used to generate any of the opinions in the article.
Data Sharing Statement
Some or all of the datasets used and analyzed in this study are not publicly accessible but can be obtained from the corresponding author upon reasonable request.
Acknowledgments
The authors would like to thank all the patients who donated fecal samples for this study.
Author Contributions
All authors made a significant contribution to the work reported, whether in the conception, study design, execution, acquisition of data, analysis and interpretation, or in all these areas; took part in drafting, revising or critically reviewing the article; gave final approval of the version to be published; have agreed on the journal to which the article has been submitted; and agree to be accountable for all aspects of the work.
Funding
This work was supported by the National Natural Science Foundation of China (82473446 to CL), Beijing Municipal Natural Science Foundation (Grant No. Z220012 to CL), and Capital’s Funds for Health Improvement and Research (2026-2-20411 to CL).
Disclosure
The authors have no conflicts of interest relevant to this study.
References
1. Tritos NA, Miller KK. Diagnosis and management of pituitary adenomas: a review. JAMA. 2023;329(16):1386–14. doi:10.1001/jama.2023.5444
2. Petersenn S, Fleseriu M, Casanueva FF, et al. Diagnosis and management of prolactin-secreting pituitary adenomas: a pituitary society international consensus statement. Nat Rev Endocrinol. 2023;19(12):722–740. doi:10.1038/s41574-023-00886-5
3. Chanson P, Maiter D. The epidemiology, diagnosis and treatment of prolactinomas: the old and the new. Best Pract Res Clin Endocrinol Metab. 2019;33(2):101290. doi:10.1016/j.beem.2019.101290
4. Urwyler SA, Karavitaki N. Refractory lactotroph adenomas. Pituitary. 2023;26:273–277. doi:10.1007/s11102-023-01305-8
5. Lavelle A, Sokol H. Gut microbiota-derived metabolites as key actors in inflammatory bowel disease. Nat Rev Gastroenterol Hepatol. 2020;17(4):223–237. doi:10.1038/s41575-019-0258-z
6. Martin CR, Osadchiy V, Kalani A, Mayer EA. The brain-gut-microbiome axis. Cellular Molecular Gastroenterol Hepatol. 2018;6(2):133–148. doi:10.1016/j.jcmgh.2018.04.003
7. Gopalakrishnan V, Spencer CN, Nezi L, et al. Gut microbiome modulates response to anti–PD-1 immunotherapy in melanoma patients. Science. 2018;359(6371):97–103. doi:10.1126/science.aan4236
8. Buchta Rosean C, Bostic RR, Ferey JCM, et al. Preexisting commensal dysbiosis is a host-intrinsic regulator of tissue inflammation and tumor cell dissemination in hormone receptor–positive breast cancer. Cancer Res. 2019;79(14):3662–3675. doi:10.1158/0008-5472.CAN-18-3464
9. Wang Y, Qiao H, Zhang Y. Changes of dopamine and tyrosine hydroxylase levels in the brain of germ-free mice. Iranian J Biotechnol. 2023;21(1):e2798. doi:10.30498/ijb.2022.236732.2798
10. Hu C, Huang Z, Sun B, Liu M, Tang L, Chen L. Metabolomic profiles in zebrafish larvae following probiotic and perfluorobutanesulfonate coexposure. Environ Res. 2022;204(Pt D):112380. doi:10.1016/j.envres.2021.112380
11. Hu J, Yang J, Chen L, et al. Alterations of the gut microbiome in patients with pituitary adenoma. Pathology Oncol Res. 2022;28:1610402. doi:10.3389/pore.2022.1610402
12. Lin B, Wang M, Gao R, et al. Characteristics of Gut Microbiota in Patients with GH-Secreting Pituitary Adenoma. Microbiol Spectrum. 2022;10(1):e0042521. doi:10.1128/spectrum.00425-21
13. Nie D, Wang D, Wang Z, et al. The gut microbiome in patients with Cushing’s disease affects depression- and anxiety-like behavior in mice. Microbiome. 2024;12(1):225. doi:10.1186/s40168-024-01939-1
14. Luzardo-Ocampo I, Ocampo-Ruiz AL, Dena-Beltrán JL, Martínez de la Escalera G, Clapp C, Macotela Y. The diversity of gut microbiota at weaning is altered in prolactin receptor-null mice. Nutrients. 2023;15(15):3447. doi:10.3390/nu15153447
15. Deng Z, Chen S, She Y, et al. IGF-1-mediated upregulation of gut Blautia correlates with inflammatory markers in growth hormone-secreting pituitary adenomas. J Genet Genomics. 2025;52:1062–1065. doi:10.1016/j.jgg.2025.04.015
16. Potthoff TE, Walter C, Jeising D, et al. Single-cell transcriptomics link gene expression signatures to clinicopathological features of gonadotroph and lactotroph PitNET. J Transl Med. 2024;22(1):1027. doi:10.1186/s12967-024-05821-4
17. Lopez-Vicchi F, De Winne C, Brie B, Sorianello E, Ladyman SR, Becu-Villalobos D. Metabolic functions of prolactin: physiological and pathological aspects. J Neuroendocrinol. 2020;32(11):e12888. doi:10.1111/jne.12888
18. Ramos-Román MA. Prolactin and lactation as modifiers of diabetes risk in gestational diabetes. Hormone Metabolic. 2011;43(9):593–600. doi:10.1055/s-0031-1284353
19. Ben-Jonathan N, Hugo ER, Brandebourg TD, LaPensee CR. Focus on prolactin as a metabolic hormone. Trends Endocrinol Metabol. 2006;17(3):110–116. doi:10.1016/j.tem.2006.02.005
20. Zhu Q-F, Yan J-W, Ni J, Feng Y-Q. FAHFA footprint in the visceral fat of mice across their lifespan. Biochimica Et Biophysica Acta. 2020;1865(5):158639. doi:10.1016/j.bbalip.2020.158639
21. Aryal P, Syed I, Lee J, et al. Distinct biological activities of isomers from several families of branched fatty acid esters of hydroxy fatty acids (FAHFAs). J Lipid Res. 2021;62:100108. doi:10.1016/j.jlr.2021.100108
22. Faron-Górecka A, Latocha K, Pabian P, Kolasa M, Sobczyk-Krupiarz I, Dziedzicka-Wasylewska M. The involvement of prolactin in stress-related disorders. Int J Environ Res Public Health. 2023;20(4):3257. doi:10.3390/ijerph20043257
23. Donner N, Bredewold R, Maloumby R, Neumann ID. Chronic intracerebral prolactin attenuates neuronal stress circuitries in virgin rats. Euro J Neuro Sci. 2007;25(6):1804–1814. doi:10.1111/j.1460-9568.2007.05416.x
24. Torner L, Maloumby R, Nava G, Aranda J, Clapp C, Neumann ID. In vivo release and gene upregulation of brain prolactin in response to physiological stimuli. Euro J Neurosci. 2004;19(6):1601–1608. doi:10.1111/j.1460-9568.2004.03264.x
25. Torner L, Toschi N, Nava G, Clapp C, Neumann ID. Increased hypothalamic expression of prolactin in lactation: involvement in behavioural and neuroendocrine stress responses. Euro J Neurosci. 2002;15(8):1381–1389. doi:10.1046/j.1460-9568.2002.01965.x
26. Drago F, Pulvirenti L, Spadaro F, Pennisi G. Effects of TRH and prolactin in the behavioral despair (swim) model of depression in rats. Psychoneuroendocrinology. 1990;15(5–6):349–356. doi:10.1016/0306-4530(90)90060-M
27. Yuan D, Kuan T, Ling H, et al. Serum metabolomics of end-stage renal disease patients with depression: potential biomarkers for diagnosis. Renal Failure. 2021;43(1):1479–1491. doi:10.1080/0886022X.2021.1994995
28. Irmisch G, Schläfke D, Richter J. Relationships between fatty acids and psychophysiological parameters in depressive inpatients under experimentally induced stress. Prostaglandins Leukotrienes Essential Fatty Acids. 2006;74(2):149–156. doi:10.1016/j.plefa.2004.12.006
29. Yu H, Qin X, Yu Z, Chen Y, Tang L, Shan W. Effects of high-fat diet on the formation of depressive-like behavior in mice. FoodFunction. 2021;12(14):6416–6431. doi:10.1039/D1FO00044F
30. Wu W-L, Adame MD, Liou C-W, et al. Microbiota regulate social behaviour via stress response neurons in the brain. Nature. 2021;595(7867):409–414. doi:10.1038/s41586-021-03669-y
31. Desbonnet L, Garrett L, Clarke G, Kiely B, Cryan JF, Dinan TG. Effects of the probiotic Bifidobacterium infantis in the maternal separation model of depression. Neuroscience. 2010;170(4):1179–1188. doi:10.1016/j.neuroscience.2010.08.005
32. Wu Q, Xu Z, Song S, et al. Gut microbiota modulates stress-induced hypertension through the HPA axis. Brain Research Bulletin. 2020;162:49–58. doi:10.1016/j.brainresbull.2020.05.014
33. Misiak B, Łoniewski I, Marlicz W, et al. The HPA axis dysregulation in severe mental illness: can we shift the blame to gut microbiota? Progress Neuro Psychopharmacol Biolog Psychiatry. 2020;102:109951. doi:10.1016/j.pnpbp.2020.109951
34. de Weerth C. Do bacteria shape our development? Crosstalk between intestinal microbiota and HPA axis. Neurosci Biobehav Rev. 2017;83:458–471. doi:10.1016/j.neubiorev.2017.09.016
 © 2026 The Author(s). This work is published and licensed by Dove Medical Press Limited. The
full terms of this license are available at https://www.dovepress.com/terms
and incorporate the Creative Commons Attribution
- Non Commercial (unported, 4.0) License.
By accessing the work you hereby accept the Terms. Non-commercial uses of the work are permitted
without any further permission from Dove Medical Press Limited, provided the work is properly
attributed. For permission for commercial use of this work, please see paragraphs 4.2 and 5 of our Terms.
© 2026 The Author(s). This work is published and licensed by Dove Medical Press Limited. The
full terms of this license are available at https://www.dovepress.com/terms
and incorporate the Creative Commons Attribution
- Non Commercial (unported, 4.0) License.
By accessing the work you hereby accept the Terms. Non-commercial uses of the work are permitted
without any further permission from Dove Medical Press Limited, provided the work is properly
attributed. For permission for commercial use of this work, please see paragraphs 4.2 and 5 of our Terms.
Recommended articles
Gut Microbiota–Tumor Microenvironment Interactions: Mechanisms and Clinical Implications for Immune Checkpoint Inhibitor Efficacy in Cancer
Said SS, Ibrahim WN
Cancer Management and Research 2025, 17:171-192
Published Date: 25 January 2025
Altered Gut Microbiota and Plasma Metabolome Profiles Characterize Depression Individuals with Ischemic Stroke: A Comparative Analysis
Cao N, Lv D, Liu Y, Zhang H, Zhang X
Neuropsychiatric Disease and Treatment 2025, 21:973-987
Published Date: 29 April 2025
Rhubarb: Traditional Uses, Phytochemistry, Multiomics-Based Novel Pharmacological and Toxicological Mechanisms
Miao H, Wang KE, Li P, Zhao YY
Drug Design, Development and Therapy 2025, 19:9457-9480
Published Date: 23 October 2025
Metabolomics and Gut Microbiota in Elderly Patients with Diabetic Peripheral Neuropathy and Sarcopenia
Wang X, Yu F, Cai Q, Li B, Li X, Fu C, Yu X, Yin W, Zeng S, Gao H, Cheng M
Diabetes, Metabolic Syndrome and Obesity 2025, 18:4335-4345
Published Date: 22 November 2025