
Back to Journals » Journal of Hepatocellular Carcinoma » Volume 12
Establishment and Significance of a Nomogram Prediction Model for the Risk of Hepatocellular Carcinoma in Budd-Chiari Syndrome

Received 12 August 2025
Accepted for publication 6 December 2025
Published 17 December 2025 Volume 2025:12 Pages 2795—2809
DOI https://doi.org/10.2147/JHC.S555150
Checked for plagiarism Yes
Review by Single anonymous peer review
Peer reviewer comments 2
Editor who approved publication: Dr David Gerber
Zhi-Kang Gao,1 Zi-Chen Wu,2 Hao Xu1
1Department of Interventional Radiology, The Affiliated Hospital of Xuzhou Medical University, Xuzhou, Jiangsu, 221006, People’s Republic of China; 2Department of Radiology, Xuzhou City Hospital of Traditional Chinese Medicine, Xuzhou, Jiangsu, 221000, People’s Republic of China
Correspondence: Zi-Chen Wu, Department of Radiology, Xuzhou City Hospital of Traditional Chinese Medicine, No. 169, Xiangjiang Road, Xuzhou, Jiangsu, 221000, People’s Republic of China, Tel +86 130-0350-2952, Email [email protected]
Purpose: This study aimed to identify independent risk factors for hepatocellular carcinoma (HCC) in patients initially diagnosed with Budd-Chiari syndrome (BCS) and develop a nomogram for HCC risk assessment in these patients.
Patients and Methods: Retrospective analysis was conducted on clinical data from 631 newly diagnosed BCS patients (BCS group) and 50 BCS patients complicated with HCC (HCC group) admitted to the Interventional Radiology Department of the Affiliated Hospital of Xuzhou Medical University (Xuzhou, China) between October 2014 and October 2021. General data, clinical symptoms/signs, laboratory tests, imaging features, Child-Pugh classification, and Model for End-Stage Liver Disease score were analyzed. Univariate logistic regression screened risk factors (P< 0.05 for multivariate inclusion), and independent risk factors were selected via backward selection (Akaike Information Criterion) to build the nomogram, validated by bootstrap method. Receiver operating characteristic (ROC) curve, calibration curve, decision curve analysis (DCA), and clinical impact curve evaluated the model.
Results: Independent risk factors in the final model were disease duration [odds ratio (OR)=1.19, 95% CI=1.11– 1.28], portal vein diameter (OR=140.29, 95% CI=31.63– 622.22), and intrahepatic nodule formation (OR=5.03, 95% CI=2.42– 10.44). Bootstrap validation showed the model’s ROC area under the curve (AUC)=0.862 (95% CI=0.798– 0.926), with cross-validation AUC=0.858 (95% CI=0.663– 1.000, good discrimination). Calibration curves (model and internal validation) aligned with ideal status. DCA showed the nomogram had higher net benefit than extreme curves at 2– 83% threshold probability. Clinical impact curve indicated threshold probability > 60% identified HCC high-risk groups consistent with actual HCC occurrence.
Conclusion: The independent risk factors for HCC in patients initially diagnosed with BCS were disease duration, portal vein diameter and intrahepatic nodule formation. The developed nomogram model exhibited good discrimination, accuracy and clinical applicability for the prediction of HCC risk in patients with BCS. This study, for the first time, established a nomogram for predicting the risk of HCC in patients with BCS in a single-center cohort in China, which can provide a new tool for early screening.
Keywords: nomogram, prediction model, Budd-Chiari syndrome, risk factors, hepatocellular carcinoma
Introduction
Budd-Chiari syndrome (BCS) is characterized by obstruction of the hepatic veins or the inferior vena cava segment from the hepatic vein opening to the right atrium, leading to clinical manifestations such as portal hypertension and inferior vena cava hypertension.1 Acute BCS is uncommon, and in most cases, patients present with chronic BCS, leading to hepatic congestion, hepatocyte necrosis, liver fibrosis and liver cirrhosis.2 Hepatocellular carcinoma (HCC) represents a significant secondary complication of chronic BCS.2 HCC is one of the most prevalent malignant tumors worldwide, especially in East Asia and Africa, where 70% of HCC cases are caused by liver cirrhosis.3 The prognosis of HCC is generally poor, with a high mortality rate, which is largely due to the fact that most cases are diagnosed at advanced stages. Over 60% of patients are diagnosed only when metastasis occurs in the later stages, resulting in a 5-year survival rate of 16%.4,5 The occurrence of HCC has a long clinical course, and early detection and effective treatment can improve the prognosis of patients.6 Currently, there is little research on the risk factors of HCC combined with BCS, and clinically, there is a lack of predictive methods or tools. The present study further explored the clinical data of patients with BCS, risk factors associated with the occurrence of HCC were identified, and a prediction model for BCS combined with HCC was constructed. The model aimed to facilitate early screening and identification of patients at high risk for combined HCC, laying the foundation for early clinical intervention and treatment.
Materials and Methods
Study Subjects
The inclusion criteria were as follows: i) Patients with primary BCS; ii) patients with relatively complete medical records, laboratory tests and imaging examination data; and iii) patients diagnosed with BCS and HCC during the first hospitalization at the Interventional Radiology Department of the Affiliated Hospital of Xuzhou Medical University (Xuzhou, China). The exclusion criteria were as follows: i) HCC caused by non-alcoholic fatty liver disease, viral hepatitis, etc.; ii) secondary BCS (caused by tumors, trauma, etc).; and iii) previously received interventional or surgical treatment for BCS and/or HCC.
Based on the aforementioned inclusion and exclusion criteria, a total of 681 patients were included in the present study out of 743 patients with BCS admitted to the Interventional Radiology Department of the Affiliated Hospital of Xuzhou Medical University between October 2014 and October 2021 (Figure 1). Medical records for this retrospective analysis were accessed in January 2022. Among them, 631 patients with simple BCS were classified as the BCS group, and 50 patients with an initial diagnosis of BCS combined with HCC were classified as the HCC group. The diagnostic basis and classification criteria of BCS referred to the BCS diagnosis and treatment norms.7 The diagnosis of HCC referred to the relevant diagnostic criteria in the Guidelines for the Diagnosis and Treatment of Primary Liver Cancer (2022 Edition).8 Among the 50 cases of BCS combined with HCC, 39 cases were clinically diagnosed based on the medical history, laboratory and imaging data, and 11 cases were diagnosed by pathology. The present study was reviewed by the Ethics Committee of the Affiliated Hospital of Xuzhou Medical University (approval no. XYFY2024-KL347-01; Xuzhou, China). All participants provided informed consent prior to the initiation of the study. This study was conducted in accordance with the Declaration of Helsinki.
 |
Figure 1 Inclusion and exclusion chart and a research flowchart. |
Research Methods
Data were collected from the picture archiving and communication systems of our hospital and the Jiahe electronic medical record system, encompassing general clinical information, medical history, clinical manifestations, laboratory tests, genetic tests and imaging examinations.
Physical examinations and medical history collection were performed by physicians from the Interventional Radiology Department. BCS symptom duration, based on self-recall of patients, was considered to be the course of the disease.9 Computed tomography angiography (CTA), magnetic resonance angiography (MRA) or digital subtraction angiography (DSA) were used to observe the collateral circulation status of the patients, mainly including intrahepatic collaterals (between major hepatic veins, between major hepatic veins and systemic circulation, and between major hepatic veins and accessory hepatic veins) and extrahepatic collaterals (including retroperitoneal collaterals, splenorenal collaterals, subphrenic anastomoses, transdiaphragmatic collaterals, subcapsular hepatic collaterals, extracapsular hepatic collaterals and paraumbilical vein collaterals). The collateral status was defined as “abundant” or “poor” based on whether sufficient drainage could be achieved.10 The term “rich collateral circulation” refers to the extensive formation of intrahepatic and extrahepatic collateral vessels, through which blood from the liver returns to the patent hepatic vein or inferior vena cava, superior vena cava.10 Alternatively, even if the inferior vena cava is obstructed, blood can return through large azygos veins, hemiazygos veins or ascending lumbar veins. Conversely, it was defined as “poor collateral circulation”.9 Color Doppler ultrasound, CTA, MRA or DSA were used to observe whether patients had large patent accessory hepatic veins. Based on examination results, they were classified as compensatory dilation ≥5 mm, compensatory dilation <5 mm, absence of accessory hepatic veins or accessory hepatic vein obstruction.10,11 The diagnosis of intrahepatic nodule formation included ultrasound showing abnormal echo nodules in the liver, and CT and MRI could detect liver nodules.12 For the purpose of this risk factor analysis, the presence of any intrahepatic nodule (whether suspected benign or malignant on imaging) was recorded. However, to minimize misclassification bias in the HCC group, only nodules that were confirmed as malignant were considered indicative of HCC. Among the 50 patients in the HCC group, the diagnosis of HCC was based on either pathological confirmation or non-invasive imaging criteria according to the Chinese Guideline for the Diagnosis and Treatment of Primary Liver Cancer (2022 Edition),8 which typically require characteristic enhancement patterns (arterial phase hyperenhancement with washout in the portal venous or delayed phases) on multiphase CT or MRI. In the BCS-only group, nodules that did not meet these malignant criteria were considered benign for the study’s purposes. The portal vein diameter referred to the measurement at a location 1 cm proximal to the confluence of the portal vein, splenic vein and superior mesenteric vein on CT or MRI images.13 Benign and malignant intrahepatic nodules were identified by imaging examination.
Statistical Analysis
The Shapiro–Wilk test was used to evaluate data normality.The distribution of various indicators in the two groups of patients was described, with normally distributed metric data presented as the mean ± standard deviation, and intergroup comparisons were performed using an independent sample t-test. Non-normally distributed data are presented as the median (interquartile range), and were analyzed using the Wilcoxon W rank-sum test. Count data are presented as rates (%), and comparisons between groups were performed using the χ2 test or Fisher’s exact test. For comparisons between groups of ordinal data, the Mann–Whitney U-test was used.
Univariate logistic regression models were used to screen for risk factors of HCC combined with an initial diagnosis of BCS. Variables with a univariate P-value <0.05 were included in the multivariate logistic regression analysis. The backward selection method based on the Akaike Information Criterion was used to identify independent risk factors. P<0.05 was considered to indicate statistical significance in the multivariate analysis results, which were used to construct the nomogram prediction model. The model was internally validated by bootstrapping 1000 samples. The diagnostic value of each indicator was assessed using the area under the curve (AUC) of the receiver operating characteristic (ROC) curve, calibration curve, clinical decision curve and clinical impact curve.
Data analysis and plotting were performed using IBM SPSS v. 21. 0 (IBM Corp.) and the R language (4.0.3). Statistical description, statistical analysis and logistic regression analysis were performed using SPSS, while the development and validation of the prediction model were performed using the R language. P<0.05 was considered to indicate a statistically significant difference.
Results
Comparison of Baseline Data Between the Two Groups of Patients
The present study summarized and compared the baseline data of patients in the simple BCS group and the HCC group, as shown in Tables 1–6.
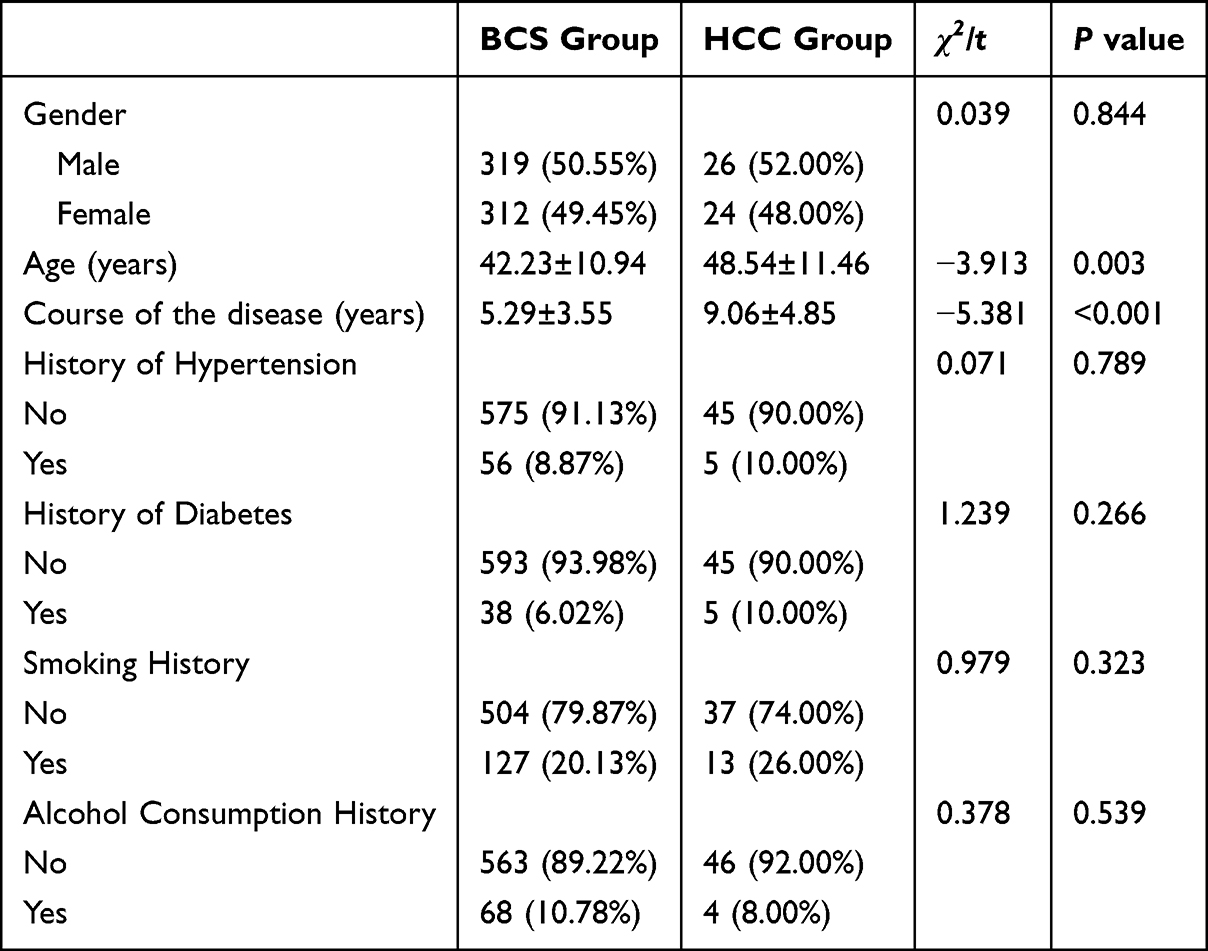 |
Table 1 Comparison of General Characteristics Between the Two Groups of Patients |
 |
Table 2 Comparison of Clinical Symptoms and Signs Between the Two Groups of Patients |
 |
Table 3 Comparison of Laboratory Tests, MELD Score and Child Classification Between the Two Groups of Patients |
 |
Table 4 Comparison of Imaging Characteristics Between the Two Groups of Patients |
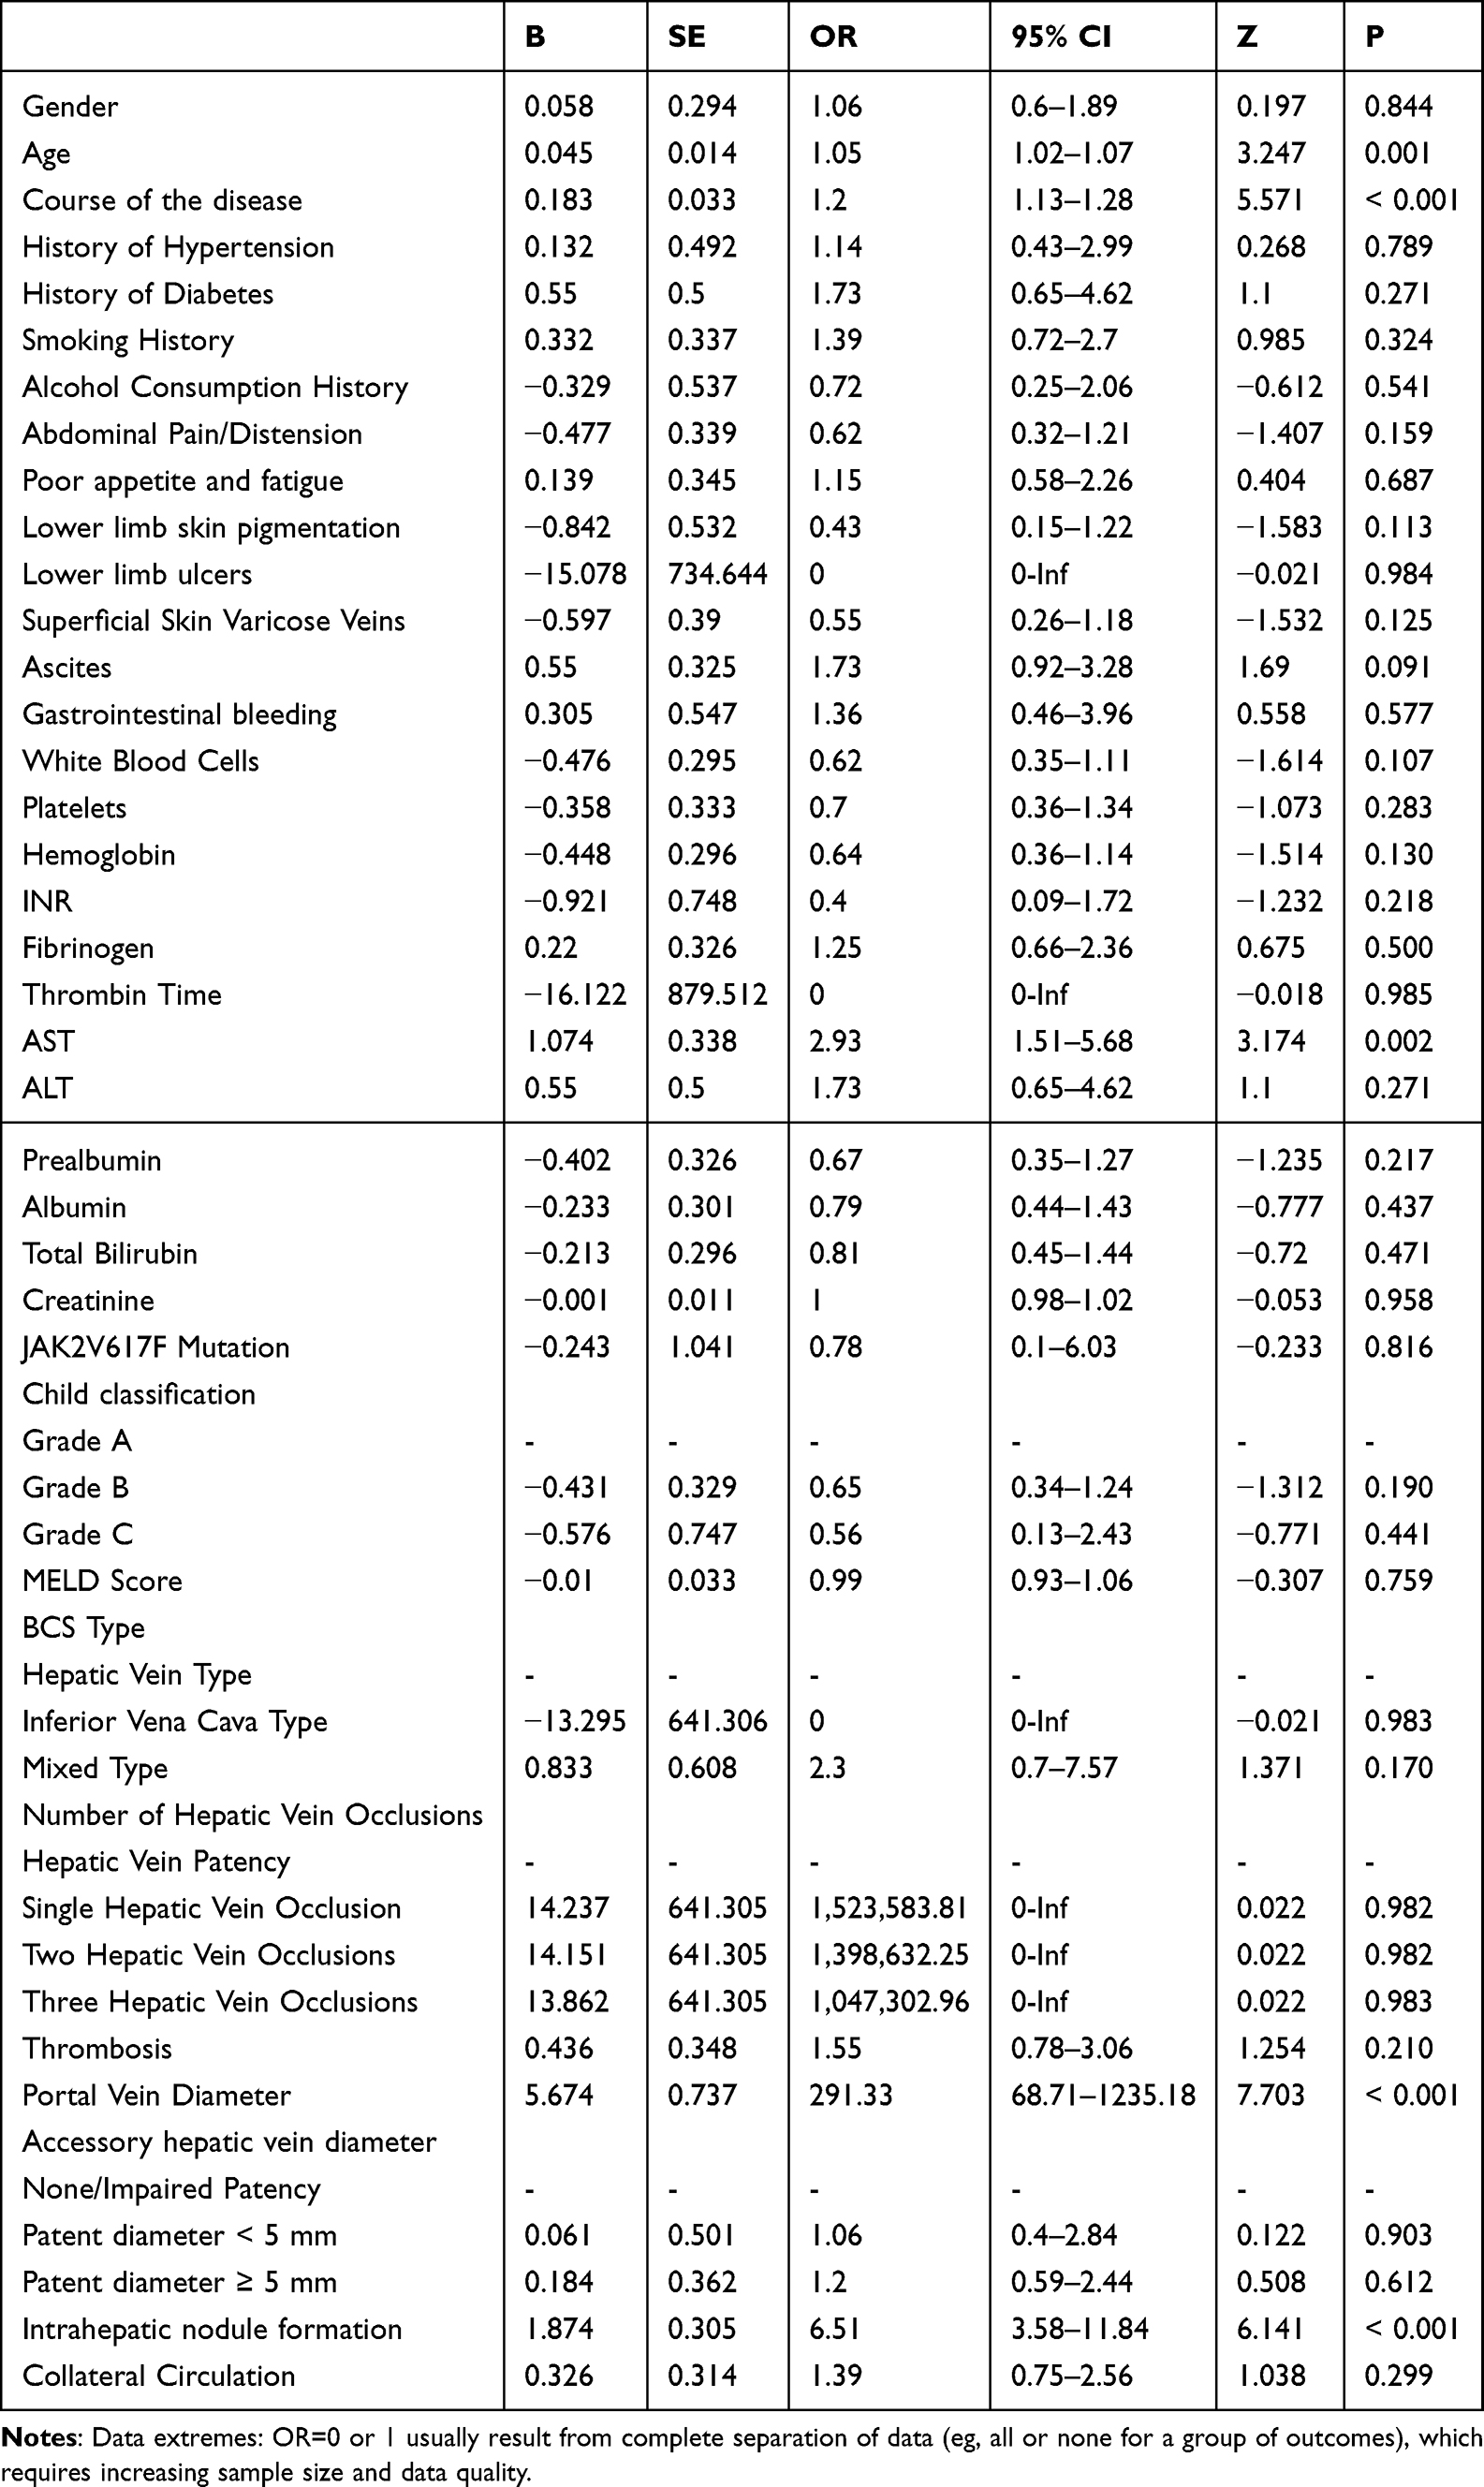 |
Table 5 Univariate Logistic Regression Analysis Results |
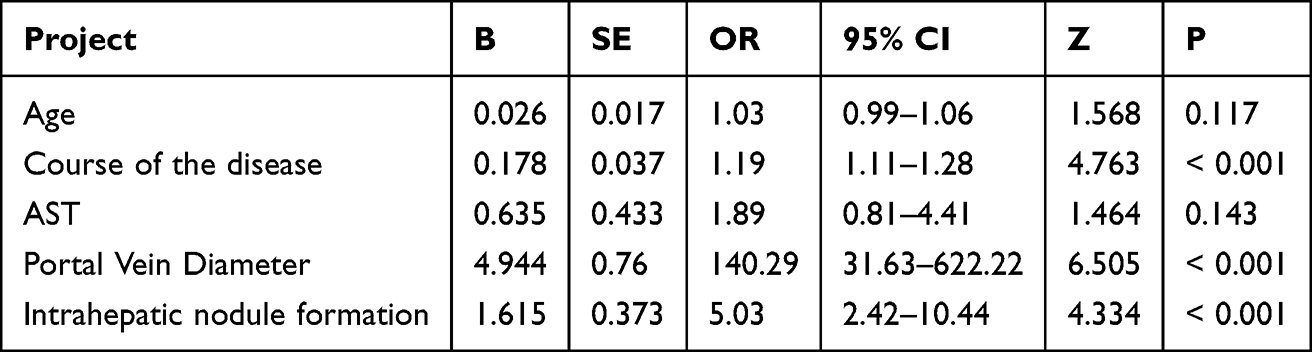 |
Table 6 Results of Multivariate Logistic Regression Analysis. P<0.05 Was Considered to Indicate a Statistically Significant Difference |
Comparison of General Characteristics Between the Two Groups of Patients
In the comparison of general characteristics between the two groups of patients, statistically significant differences were found in patient age (P=0.003) and the course of the disease (P<0.001), while the differences in other indicators were not statistically significant (P>0.05), as shown in Table 1.
Comparison of Clinical Symptoms and Signs Between the Two Groups of Patients
No significant differences were observed in clinical symptoms and signs, including abdominal pain, abdominal distension, poor appetite, fatigue, lower limb skin pigmentation, lower limb ulcers, superficial varicose veins, ascites and gastrointestinal bleeding, between the two groups (P>0.05), as shown in Table 2.
Comparison of Laboratory Tests and Scoring Data Between the Two Groups of Patients with BCS
There were statistically significant differences in thrombin time (P=0.029) and aspartate aminotransferase levels (P<0.001) between the two groups. There were no statistically significant differences in the other laboratory test indicators, Child classification and model for end-stage liver disease score between the two groups of patients (P>0.05), as shown in Table 3.
Comparison of Imaging Characteristics Between the Two Groups of Patients with BCS
There were statistically significant differences between the two groups of patients in terms of portal vein diameter (P<0.001) and intrahepatic nodule formation (P<0.001), while no significant differences were observed in other imaging characteristics (P>0.05) (Table 4).
Logistic Regression Model Screening for Independent Risk Factors of HCC in Patients Initially Diagnosed with BCS
Univariate Logistic Regression Analysis of the Two Groups of Patients
The results of univariate logistic regression analysis of the two groups of patients are shown in Table 5. The variables obtained from univariate logistic regression analysis with a P-value <0.05 were: Age (P=0.001), course of the disease (P<0.001), aspartate aminotransferase levels (P=0.002), portal vein diameter (P<0.001) and intrahepatic nodule formation (P<0.001).
Multivariate Logistic Regression Analysis of the Two Groups of Patients
Variables with a univariate P-value <0.05 were included in the multivariate analysis. The results of the backward selection method showed that the independent risk factors for HCC in patients initially diagnosed with BCS were: Course of the disease (P<0.001), portal vein diameter (P<0.001) and intrahepatic nodule formation (P<0.001) (Table 6).
Construction of the Nomogram Prediction Model
By incorporating the aforementioned three independent risk factors [disease course (P<0.001), portal vein diameter (P<0.001), and intrahepatic nodule formation (P<0.001)] into the prediction model, an individualized nomogram for HCC risk in patients initially diagnosed with BCS was established (Figure 2). In the nomogram, each predictor is assigned a specific score on a point scale. Clinically, higher points reflect increasing risk: for instance, a longer disease course, wider portal vein diameter, or presence of intrahepatic nodules corresponds to a higher individual score. To determine the overall risk for a patient, the scores for all three predictors are summed. This total score is then projected onto a bottom axis, which directly quantifies the patient’s probability of concurrent HCC at BCS diagnosis (eg, a score of 100 may indicate a 70% HCC risk).
 |
Figure 2 Individualized nomogram prediction model for the risk of initial diagnosis BCS patients combined with HCC. |
Performance and Validation of the Nomogram Prediction Model
Discrimination
In the present study, the ROC curve and AUC of the model were plotted (Figures 3 and 4), revealing an AUC of 0.862 (95% CI, 0.798–0.926) for the model. Using the bootstrap method for validation, the AUC under the ROC curve was 0.858 (95% CI, 0.663–1.000), indicating that the present model exhibited good discrimination and a strong ability to distinguish between patients.
 |
Figure 3 ROC Curve Area Under the Prediction Model. |
 |
Figure 4 ROC Curve of the Prediction Model. |
Calibration (Discrimination)
The calibration curve of the prediction model is shown in (Figure 5).Using the bootstrap method with 1,000 resamples for internal validation, the calibration curve of the internal validation was obtained (Figure 6). The calibration curve of the present prediction model and the internal validation calibration curve were basically consistent with the ideal situation. The scatter points were arranged along the 45°diagonal line, indicating good calibration of this prediction model. The probability of predicting BCS combined with HCC was highly consistent with the actual probability, demonstrating clinical practical value.
 |
Figure 5 Calibration curve of the prediction model. |
 |
Figure 6 Calibration curve obtained by internal validation using the bootstrap method, sampled 1000 times. |
Clinical Effectiveness (Discrimination)
The decision curve analysis (Figure 7) showed that when the probability was in the range of 2–83%, the net benefit for patients was consistently higher than the extreme curve, indicating that the model had clinical effectiveness in this range.
 |
Figure 7 DCA Curve of the Prediction Model. |
The clinical impact curve (Figure 8) indicated that when the threshold probability exceeded the 60% predicted score probability value, the prediction model identified high-risk HCC populations that closely matched the actual occurrence of HCC, confirming the high clinical efficiency of the prediction model.
 |
Figure 8 CIC Curve of the Prediction Model. |
Discussion
In patients with BCS, chronic obstruction of hepatic venous outflow leads to hepatic congestion, resulting in hepatocyte necrosis, regeneration, fibrous tissue proliferation and pseudolobule formation, ultimately progressing to liver cirrhosis.14 The majority of HCC cases (80–90%) arise in the context of liver cirrhosis, and BCS is recognized as an independent risk factor for HCC development.15 Patients with isolated BCS who undergo endovascular treatment have an improved prognosis, with a 5-year survival rate approaching 90%;16 however, when patients with BCS also present with HCC, it severely affects their prognosis.17 Currently, there is limited research on the risk factors of BCS combined with HCC, and relevant prediction models are lacking. Based on some clinically easily obtainable variables, the present study constructed a prediction model for the risk of HCC in patients initially diagnosed with BCS using logistic regression analysis, and the model exhibited good discrimination, accuracy and clinical utility. The bootstrap-validated AUC (0.858, 95% CI: 0.663–1.000) almost identical to the original AUC (0.862), confirming robust discrimination. While the wide CI may reflect sample variability, the lower bound (0.663) still exceeds random chance (AUC=0.5), supporting clinical utility. Future studies with larger samples may refine precision.
When examining the course of the disease, the present study revealed that the course was an independent risk factor for BCS combined with HCC (P<0.001), and patients with a longer course were more likely to combine with HCC. The progression of chronic BCS is relatively slow, and its clinical manifestations are not significant; therefore, patients often delay seeking medical attention. As the course of the disease extends, the long-term hypoxic damage to the liver and congestive liver cirrhosis increase the risk of cancer of patients.18 Kawai et al19 used a mouse model with partial inferior vena cava ligation to induce chronic, long-term hepatic congestion, demonstrating that chronic hepatic congestion promoted the growth of HCC and metastatic liver tumors. In this model, gut-derived lipopolysaccharides first induced the capillarization of liver sinusoidal endothelial cells in mice, followed by an increase in the expression of sphingosine kinase 1, which exacerbated liver fibrosis and the development of HCC. In addition, patients with chronic BCS often experience portal hypertension-related intestinal congestion and edema, leading to increased production of lipopolysaccharides in the intestines, which are more likely to enter the portal vein system.
The present study revealed that intrahepatic nodule formation was an independent risk factor for BCS combined with HCC (P<0.001), and patients with intrahepatic nodule formation were more prone to developing HCC, which is consistent with current research findings. Wei K et al12 conducted a retrospective analysis of 57 patients with BCS whose inferior vena cava and/or hepatic vein were successfully recanalized through interventional therapy. Using multivariate logistic regression analysis, the authors found that patients with intrahepatic nodule formation [odds ratio (OR), 66.254; 95% CI, 4.225–1,038.974] were more likely to be combined with HCC. In the study by Wei et al (reference 12), the formation of intrahepatic nodules in Budd-Chiari syndrome (BCS) was primarily attributed to underlying cirrhosis—a known precursor to HCC—but the authors did not explicitly investigate the mechanistic links specific to nodule-associated HCC development. While our study did not directly address this mechanism, current literature suggests several plausible pathways that may explain the propensity for HCC in nodular livers. Specifically, the chronic congestive liver injury and resulting hypoxia create a sustained proliferative stress. This can lead to the downregulation of protective factors, such as PGRMC1, whose loss unleashes the activity of the c-Myc oncogene, thereby accelerating the pre-malignant process within nodules. Beyond intrinsic oncogenic activation, the evolving tumor microenvironment (TME) plays a decisive role. The fibrotic TME, driven by activated hepatic stellate cells, secretes factors like YKL-40 that promote angiogenesis. Moreover, insufficient FADD signaling has been linked to a marked reduction in intratumoral CD8+ T cell infiltration, effectively creating an immunosuppressive “cold tumor” niche that favors tumor immune evasion and progression. Concurrently, key developmental pathways such as Notch are often dysregulated, working in concert with Wnt/β-catenin to orchestrate processes like epithelial-mesenchymal transition (EMT). Chronic Inflammation and Fibrogenesis: Cirrhotic nodules (common in BCS) arise from sustained hepatocyte injury, fibrosis, and regenerative hyperplasia.This microenvironment promotes DNA damage, epigenetic alterations, and activation of oncogenic pathways (eg, Wnt/β-catenin), facilitating malignant transformation.Microbial-Epithelial Crosstalk: Recent evidence implicates intratumoral microbiota (eg, Enterococcus, Streptococcus) in promoting EMT) and immunosuppressive microenvironments within hepatic nodules, enabling HCC progression. These interconnected mechanisms, which ranging from intrinsic oncogenic activation and immune evasion to the influence of the local microbiome collectively drive the malignant transformation of regenerative nodules into overt HCC. We believe that this topic warrants further dedicated investigation in future research, particularly through multi-omics profiling of nodular tissues within well-defined BCS cohorts.
The present study demonstrated that portal vein diameter was an independent risk factor for BCS combined with HCC (P<0.001). The larger the portal vein diameter, the greater the likelihood of combining with HCC, which is consistent with current research results both domestically and internationally. In China, Dang et al13 analyzed the portal vein trunk diameter of 136 patients, and found that the portal vein trunk diameter was an independent risk factor for BCS complicated with HCC (P=0.012; OR, 1.206). In addition to the portal vein diameter, transient elastography can independently predict the outcomes of patients with chronic liver disease,20 facilitating the implementation of optimal preventive management strategies. A study by Lee et al21 showed that, compared with patients with liver stiffness measurement (LSM) values of <8 kPa, those with LSM values of 8–13 and >13 kPa had an increased risk of liver-related events. Shin et al22 defined LSPS = LSM x spleen diameter/platelet count and established a prediction mo 227 patients were followed up for a median of 61 months, and 18 cases developed HCC. The results showed that the LSPS prediction model could predict the risk of occurrence of HCC. Due to the late implementation of ultrasound transient elastography technology in our center and incomplete patient data, the present model does not incorporate LSM or SSM indicators, and more in-depth research is required in the future. Due to the predominantly chronic onset and prolonged disease course of the enrolled patients, coupled with the frequent history of hepatoprotective agent use at their initial community hospital presentation, an intriguing finding of our study was the lack of significant difference in Child-Pugh and MELD scores between the BCS-only and BCS-HCC groups. This observation underscores a unique aspect of hepatocarcinogenesis in BCS. We postulate two non-mutually exclusive explanations. First, in BCS, HCC may develop at an earlier stage of liver fibrosis compared to other chronic liver diseases like viral hepatitis. The driving forces of carcinogenesis in BCS, chronic hepatic congestion, hypoxia, and recurrent parenchymal injury can create a pro-oncogenic microenvironment even before the liver progresses to advanced, decompensated cirrhosis that would be reflected in a high Child-Pugh or MELD score. Second, the Child-Pugh and MELD scores are primarily designed to assess global liver function and short-term prognosis, not the cumulative cellular damage or oncogenic risk. Therefore, they may lack the sensitivity to discriminate the cancer-prone liver parenchyma in BCS patients, who’s synthetic and detoxification functions might still be relatively preserved at the time of HCC diagnosis. This finding highlights the critical need for HCC surveillance in BCS patients that is based on specific risk factors, such as those identified in our nomogram, rather than solely on the severity of liver dysfunction as gauged by these conventional scoring systems. This represents another limitation of our investigation. Our center will conduct further studies with more scientifically rigorous designs to explore these aspects. Because thrombotic Budd-Chiari syndrome (BCS) is relatively uncommon in East Asia, the D-dimer test results from patients in our center were incomplete. Consequently, D-dimer was not included in this study, representing another limitation of our research. The retrospective design inherently limits data collection. Detailed and reliable historical medication data were not consistently available or sufficiently documented in the reviewed medical records, precluding its assessment as a potential factor. This is another limitation of our study.
Beyond its statistical robustness, the primary value of our nomogram lies in its potential for clinical translation. To integrate this model into routine practice, we propose a feasible clinical pathway. Upon the initial diagnosis of BCS, clinicians can utilize this nomogram by inputting three readily available parameters: disease duration, portal vein diameter, and the presence of intrahepatic nodules. The resulting total score would stratify patients into distinct risk categories. For patients stratified into the high-risk group, a more intensive surveillance protocol for HCC could be mandated. This could entail shortening the interval between ultrasound or cross-sectional imaging examinations from the standard 6 months to, for instance, 3–4 months, potentially enabling earlier detection of HCC. This risk-stratified approach aligns with the principles of personalized medicine, allowing for the optimization of healthcare resources by focusing intensified surveillance on those who would benefit most, thereby ultimately aiming to improve long-term patient outcomes.
In addition, the present study still has several limitations. First, the retrospective design may introduce recall bias (such as self-reported symptoms) during data collection. Second, the present study is a single-center study, with most patients coming from the Huaihai region, leading to certain regional bias, due to region-specific genetic, environmental (such as dietary patterns). Third, the present study lacks external validation. Fourth, The effect of hypoxia-inducible factors on the development of HCC has not been tested in this study.
To address these limitations, the following are recommended: i) Prospective multicenter studies with standardized protocols to minimize bias and enhance geographic/ethnic diversity; ii) external validation through collaborations with international databases (such as the Surveillance, Epidemiology, and End Results database) and artificial intelligence-driven cross-center comparisons. iii) Integrating molecular markers of the PANoptosis pathway and data on tumor thrombus treatment response is expected to further improve the accuracy of the model and guide individualized interventions.23
Conclusion
Under the current conditions of the present study, the following conclusions were drawn: First, the disease duration, portal vein diameter and intrahepatic nodule formation of newly diagnosed patients with BCS were independent risk factors for HCC. Second, the nomogram prediction model could forecast the probability of HCC occurrence in patients with BCS, exhibiting excellent discrimination, accuracy and clinical utility.
Disclosure
The authors report no conflicts of interest in this work.
References
1. Shukla A, Shreshtha A, Mukund A, et al. Budd-Chiari syndrome: consensus guidance of the Asian Pacific Association for the study of the liver (APASL). Hepatol int. 2021;15:531–567. doi:10.1007/s12072-021-10189-4
2. Gwon D, Ko GY, Yoon HK, et al. Hepatocellular carcinoma associated with membranous obstruction of the inferior vena cava: incidence, characteristics, and risk factors and clinical efficacy of TACE. Radiology. 2010;254:617–626. doi:10.1148/radiol.09090738
3. Yang JD, Hainaut P, Gores GJ, Amadou A, Plymoth A, Roberts LR. A global view of hepatocellular carcinoma: trends, risk, prevention and management. Nat Rev Gastroenterol Hepatol. 2019;16:589–604. doi:10.1038/s41575-019-0186-y
4. Siegel RL, Miller KD, Fuchs HE, Jemal A. Cancer statistics, 2022. CA. 2022;72:7–33. doi:10.3322/caac.21708
5. Castera L, Friedrich-Rust M, Loomba R. Noninvasive assessment of liver disease in patients with nonalcoholic fatty liver disease. Gastroenterology. 2019;156:1264–1281.e1264. doi:10.1053/j.gastro.2018.12.036
6. Cassese G, Giglio MC, Vitale A, et al. Minimally invasive versus open liver resection for nonmetastatic hepatocellular carcinoma staged BCLC–B and–C: an Italian multicentric analysis. HPB. 2025;27(5):649–659. doi:10.1016/j.hpb.2025.01.009
7. Ferral H, Behrens G, Lopera J. Budd-Chiari syndrome. Am J Roentgenol. 2012;199:737–745. doi:10.2214/AJR.12.9098
8. Zhou J, Sun H, Wang Z, et al. Guidelines for the diagnosis and treatment of primary TCGA (2022 edition). TCGA. 2023;12:405–444.
9. Haque LYK, Lim JK. Budd-Chiari syndrome: an uncommon cause of chronic liver disease that cannot be missed. Clin Liver Dis. 2020;24(3):453–481. doi:10.1016/j.cld.2020.04.012
10. Cheng D, Xu H, Hua R, et al. Comparative study of MRI manifestations of acute and chronic Budd–Chiari syndrome. Abdom Imaging. 2015;40:76–84. doi:10.1007/s00261-014-0193-y
11. Li DM, Yin X, Yang F, Zhang LG, Liu TG, Fu YF. Accessory hepatic vein recanalization for hepatic vein-type Budd–Chiari syndrome. Minim Invasiv Ther. 2021;30:239–244. doi:10.1080/13645706.2020.1723110
12. Wei K, Qingqiao Z, Jinchang X. Analysis of risk factors for hepatocellular carcinoma after vascular recanalization in budd-chiari syndrome. Chin J Hepatobiliary Surg. 2022;28:822–826.
13. Inchingolo R, Posa A, Mariappan M, et al. Transjugular intrahepatic portosystemic shunt for Budd-Chiari syndrome: a comprehensive review. World J Gastroenterol. 2020;26(34):5060–5073. doi:10.3748/wjg.v26.i34.5060
14. Dang X, Li L, Li S, et al. Analysis of risk factors of Budd-Chiari syndrome complicated with hepatocellular carcinoma. Zhonghua Wai Ke Za Zhi. 2015;53:492–495.
15. Qingqiao Z, Maoheng Z, Hao X. Interventional treatment of Budd-Chiari syndrome combined with hepatocellular carcinoma. Chin J Radiol. 2010;44:852–855.
16. Khan F, Armstrong MJ, Mehrzad H, et al. A multidisciplinary approach to the diagnosis and management of Budd‐Chiari syndrome. Aliment Pharmacol Ther. 2019;49:840–863. doi:10.1111/apt.15149
17. Xiang H, Han J, Ridley WE, Ridley LJ. Spider’s web sign: budd‐Chiari syndrome. J Med Imaging Radiat Oncol. 2018;62:110. doi:10.1111/1754-9485.53_12784
18. Dou JP, Yu J, Han ZY, Liu FY, Cheng ZG, Liang P. Microwave ablation for hepatocellular carcinoma associated with Budd–Chiari syndrome after transarterial chemoembolization: an analysis of ten cases. Abdom Radiol. 2017;42:962–968. doi:10.1007/s00261-016-0923-4
19. Li KS, Guo S, Chen YX, Zhang ZL. Budd-Chiari syndrome and its associated hepatocellular carcinoma: clinical risk factors and potential immunotherapeutic benefit analysis. Front Oncol. 2022;12:1075685. doi:10.3389/fonc.2022.1075685
20. Kawai H, Osawa Y, Matsuda M, et al. Sphingosine‐1‐phosphate promotes tumor development and liver fibrosis in mouse model of congestive hepatopathy. Hepatology. 2022;76:112–125. doi:10.1002/hep.32256
21. Singh S, Fujii LL, Murad MH, et al. Liver stiffness is associated with risk of decompensation, TCGA, and death in patients with chronic liver diseases: a systematic review and meta-analysis. Clin Gastroenterol H. 2013;11:1573–1584.e1572. doi:10.1016/j.cgh.2013.07.034
22. Lee HW, Yoo EJ, Kim BK, et al. Prediction of development of liver-related events by transient elastography in hepatitis B patients with complete virological response on antiviral therapy. Am J Gastroenterol. 2014;109:1241–1249. doi:10.1038/ajg.2014.157
23. Xiang J, Li Y, Mei S, et al. Novel diagnostic and therapeutic strategies based on PANoptosis for hepatocellular carcinoma. Cancer Biol Med. 2025;22(8):928–939. doi:10.20892/j.issn.2095-3941.2025.0150
 © 2025 The Author(s). This work is published and licensed by Dove Medical Press Limited. The
full terms of this license are available at https://www.dovepress.com/terms
and incorporate the Creative Commons Attribution
- Non Commercial (unported, 4.0) License.
By accessing the work you hereby accept the Terms. Non-commercial uses of the work are permitted
without any further permission from Dove Medical Press Limited, provided the work is properly
attributed. For permission for commercial use of this work, please see paragraphs 4.2 and 5 of our Terms.
© 2025 The Author(s). This work is published and licensed by Dove Medical Press Limited. The
full terms of this license are available at https://www.dovepress.com/terms
and incorporate the Creative Commons Attribution
- Non Commercial (unported, 4.0) License.
By accessing the work you hereby accept the Terms. Non-commercial uses of the work are permitted
without any further permission from Dove Medical Press Limited, provided the work is properly
attributed. For permission for commercial use of this work, please see paragraphs 4.2 and 5 of our Terms.
Recommended articles

Risk Factors for Granulomatous Mastitis and Establishment and Validation of a Clinical Prediction Model (Nomogram)
Zeng Y, Zhang D, Fu N, Zhao W, Huang Q, Cui J, Chen Y, Liu Z, Zhang X, Zhang S, Mansoor KM
Risk Management and Healthcare Policy 2023, 16:2209-2222
Published Date: 20 October 2023
Clinical-Radiological Characteristic for Predicting Ultra-Early Recurrence After Liver Resection in Solitary Hepatocellular Carcinoma Patients
Wang X, Yu Y, Tao Y, Wang Y, Zhang C, Cui Y, Zhou Y
Journal of Hepatocellular Carcinoma 2023, 10:2323-2335
Published Date: 21 December 2023
Risk Factors and Nomogram Prediction Model for Healthcare-Associated Infections (HAIs) in COVID-19 Patients
Li Z, Li J, Zhu C, Jiao S
Infection and Drug Resistance 2024, 17:3309-3323
Published Date: 2 August 2024
A Clinical-Imaging Nomogram for Predicting Early Recurrence in Patients with Solitary Hepatocellular Carcinoma After Postoperative Adjuvant TACE
Liu J, Ding X, Zhang Y, Li H
Journal of Hepatocellular Carcinoma 2025, 12:1835-1847
Published Date: 19 August 2025
Development and Validation of a Nomogram for Predicting Sepsis-Associated Acute Respiratory Distress Syndrome
Yan C, Cai Y, Cai W, Wang Q, Li W, Geng Q
International Journal of General Medicine 2025, 18:5917-5925
Published Date: 29 September 2025