Back to Journals » Psychology Research and Behavior Management » Volume 18
Dynamic Brain Network Biomarkers for Depression Prediction: A Multi-Cohort Analysis of Global Neuroimaging Databases
Authors Peng Y, Zhan Y ![]() , Zhang Q
, Zhang Q
Received 7 July 2025
Accepted for publication 20 December 2025
Published 31 December 2025 Volume 2025:18 Pages 2469—2494
DOI https://doi.org/10.2147/PRBM.S552134
Checked for plagiarism Yes
Review by Single anonymous peer review
Peer reviewer comments 4
Editor who approved publication: Professor Mei-Chun Cheung
Yangyao Peng,1,* Yuting Zhan,2,* Qing Zhang3
1Department of Cardiovascular Surgery, Zhongnan Hospital, Wuhan University, Wuhan, Hubei Province, 430072, People’s Republic of China; 2Department of Psychology, School of Education and Teach, Ningxia University, Yinchuan, Ningxia Province, 750021, People’s Republic of China; 3Department of Neurological Rehabilitation, Zhongnan Hospital of Wuhan University, Wuhan, Hubei Province, 430072, People’s Republic of China
*These authors contributed equally to this work
Correspondence: Yangyao Peng, Email [email protected] Qing Zhang, Email [email protected]
Background: Major depressive disorder affects over 300 million people worldwide, yet clinicians lack reliable biomarkers for early identification of at-risk individuals. Recent advances in computational neuroscience suggest that dynamic brain network reorganization during emotional challenges may provide objective indicators of depression vulnerability that could enhance clinical practice.
Objective: To determine whether individual differences in dynamic brain network flexibility can predict depression onset and inform personalized clinical interventions through comprehensive analysis of large-scale neuroimaging databases.
Methods: We conducted a comprehensive analysis of 14,376 adults aged 18– 72 years from seven major international neuroimaging databases (UK Biobank, Human Connectome Project, ADNI, ABIDE, OpenfMRI, NITRC, and COINS) spanning 2018– 2024. Participants underwent standardized emotion regulation tasks during functional MRI with concurrent EEG. We quantified brain network flexibility using advanced graph-theoretical approaches and employed machine learning to identify distinct phenotypic patterns. Depression outcomes were assessed using validated clinical instruments over 30-month follow-up periods available in longitudinal sub-cohorts.
Results: Unsupervised machine learning revealed four distinct brain network flexibility phenotypes with remarkable cross-database consistency. The Rigid-Inflexible phenotype (18.7% prevalence) was associated with 4.3-fold higher depression incidence compared to Adaptive-Flexible individuals (38.7% vs 8.9%, P< 0.001). Network flexibility metrics predicted depression onset with 83.2% accuracy (AUC=0.89), significantly outperforming traditional risk models (AUC=0.69, P< 0.001). Network flexibility moderated stress-depression relationships (β=− 0.61, P< 0.001), with flexible individuals maintaining psychological resilience under high stress conditions while rigid individuals showed steep symptom escalation.
Conclusion: Dynamic brain network biomarkers represent a promising advance toward predictive, personalized psychiatry, pending external validation. These findings provide a neurobiological foundation for early intervention strategies and suggest novel therapeutic targets for depression prevention. The consistency across diverse global populations indicates potential universality of these mechanisms, supporting further clinical translation efforts.
Keywords: biomarkers, depression prediction, emotion regulation, machine learning, personalized medicine, neuroimaging
Introduction
The global burden of major depressive disorder continues to escalate despite decades of research investment and therapeutic development. Current epidemiological data indicate that depression affects over 300 million individuals worldwide, with lifetime prevalence rates exceeding 20% in developed nations and projected economic costs reaching $1.2 trillion annually by 2030.1,2 These staggering statistics underscore a fundamental limitation in our current approach to mental healthcare: we remain predominantly reactive, identifying and treating depression only after significant symptoms have emerged and functional impairment has occurred.
This reactive paradigm represents a missed opportunity for prevention and early intervention. Research consistently demonstrates that the earlier we can identify and intervene with at-risk individuals, the better the long-term outcomes and the lower the overall burden of disease.3,4 However, our current clinical toolkit for identifying who will develop depression remains disappointingly limited, relying primarily on self-reported symptoms, family history, and retrospective risk factor assessment.5 These approaches, while valuable, often fail to capture the underlying neurobiological vulnerabilities that may predispose individuals to depression when faced with life stressors.
Previous Depression Prediction Approaches
Prior efforts to predict depression onset have primarily relied on clinical and demographic risk factors. Meta-analyses of traditional prediction models incorporating family history, previous episodes, childhood adversity, recent stress, and personality factors have achieved modest accuracy, with area under the curve (AUC) values typically ranging from 0.63 to 0.73.6,7 While these models identify group-level risk patterns, their limited predictive accuracy has precluded widespread clinical implementation for individual-level risk stratification.
More recent approaches have attempted to incorporate biological markers, including inflammatory markers, genetic risk scores, and structural brain abnormalities.8,9 However, these biomarkers have shown inconsistent replication across studies and have not substantially improved prediction accuracy beyond traditional risk factors. This limited progress suggests that static biological measures may be insufficient to capture the dynamic processes underlying depression vulnerability.
Computational Psychiatry and Brain Network Dynamics
The emergence of computational psychiatry offers a promising new direction for addressing these limitations. This interdisciplinary field applies quantitative, mechanistic approaches to understand mental health disorders, leveraging advances in neuroimaging, machine learning, and computational modeling to identify objective biomarkers that could transform psychiatric practice.10,11 Among the most promising developments in this field is the study of dynamic brain network organization during emotional challenges, which has begun to reveal fundamental mechanisms underlying psychological resilience and vulnerability.12,13
Understanding how the brain adapts to emotional demands requires us to think beyond traditional models that focus on static abnormalities in brain structure or regional activation patterns. Instead, we must consider the brain as a complex, dynamic system characterized by constantly evolving patterns of functional integration and segregation.14,15 During emotional challenges, healthy brains demonstrate remarkable flexibility, reorganizing network connections to meet changing demands in what neuroscientists term “network flexibility.”16,17 This process involves sophisticated coordination between multiple large-scale brain networks, including those responsible for attention control, emotional processing, self-referential thinking, and cognitive regulation.18,19
The capacity for adaptive network reorganization during emotion regulation appears to be a fundamental determinant of psychological health and resilience. Individuals with highly flexible brain networks can efficiently adapt to emotional demands, maintaining stable psychological functioning even under stress.20,21 Conversely, those with more rigid networks may struggle to reorganize when needed, potentially rendering them vulnerable to depression when confronted with emotional challenges.22,23 This framework suggests that individual differences in network flexibility may represent a core neurobiological mechanism underlying depression vulnerability, one that could be measured objectively and potentially modified through targeted interventions.
The clinical implications of this perspective are profound. Rather than waiting for symptoms to emerge, clinicians might be able to identify neurobiological vulnerability patterns and intervene proactively to enhance adaptive capacity. This could enable a shift from symptom-focused treatment to mechanism-based prevention, potentially reducing the burden of depression at both individual and population levels.24,25 Moreover, understanding individual differences in network flexibility could inform personalized intervention strategies, allowing treatments to be tailored based on specific neurobiological profiles rather than applying one-size-fits-all approaches.26,27
Current Study
Despite the promise of this framework, several critical questions remain unanswered. First, do distinct, stable patterns of network flexibility exist across diverse populations, and if so, how do these patterns relate to depression risk? Second, can network flexibility measures reliably predict depression onset with sufficient accuracy to be clinically useful? Third, do these measures provide information beyond what can be obtained from traditional risk assessment approaches? Finally, what are the mechanisms through which network flexibility influences depression vulnerability, particularly in the context of stress exposure?
To address these questions, we conducted the most comprehensive investigation to date of brain network flexibility and depression vulnerability. Rather than collecting new data, we leveraged the wealth of high-quality neuroimaging data available through major international databases, allowing us to examine these questions across diverse populations and multiple research contexts. This approach not only maximizes statistical power and generalizability but also demonstrates the potential for data harmonization and collaborative science to accelerate discovery in computational psychiatry.
Research Hypotheses
Based on the literature reviewed above and our theoretical framework, we tested four primary hypotheses:
H1: Distinct, stable phenotypes of brain network flexibility exist across diverse populations and research contexts, demonstrating cross-database consistency. H2: Individual differences in network flexibility phenotypes prospectively predict depression onset with superior accuracy compared to traditional clinical and demographic risk factors. H3: Network flexibility moderates the relationship between stress exposure and depression outcomes, with flexible individuals demonstrating resilience under high stress conditions while rigid individuals show vulnerability. H4: Network flexibility phenotypes demonstrate convergent validity across multiple levels of biological analysis, including structural connectivity, electrophysiology, and genetic risk profiles.
Methods
Data Sources and Participant Selection
Our investigation employed a comprehensive multi-database approach, harmonizing neuroimaging and clinical data from seven major international repositories to create an unprecedented dataset for examining brain network flexibility and depression vulnerability. This strategy allowed us to leverage the substantial investment in large-scale neuroimaging initiatives while ensuring our findings would generalize across diverse populations and research contexts.
We accessed data from the UK Biobank, Human Connectome Project, Alzheimer’s Disease Neuroimaging Initiative, Autism Brain Imaging Data Exchange, OpenfMRI, Neuroimaging Informatics Tools and Resources Clearinghouse, and Collaborative Informatics and Neuroimaging Suite databases.28–34 These repositories collectively contain neuroimaging data from over 100,000 individuals worldwide, representing one of the most diverse and comprehensive collections of brain imaging data ever assembled. From this larger pool, we identified 14,376 adults aged 18–72 years who had completed standardized emotion regulation tasks during functional MRI scanning with concurrent clinical assessments suitable for our analyses.
Demographic and Clinical Characteristics
The demographic composition of our final sample reflected the global diversity of the contributing databases. Women comprised 54.3% of participants, and ethnic representation included European/Caucasian (36.7%), Asian (24.5%), African/African American (18.9%), Hispanic/Latino (14.6%), and other ethnicities (5.3%). Educational attainment varied substantially across the sample, ranging from high school education or less (11.8%) to graduate and professional degrees (22.2%), with the majority having completed some college (28.6%) or bachelor’s degree (37.4%) education. This diversity strengthens the generalizability of our findings and ensures they are relevant across different populations and cultural contexts.
One of the key advantages of working with established neuroimaging databases is the standardization of data collection protocols and quality assurance procedures. All contributing databases employed rigorous inclusion and exclusion criteria, standardized imaging protocols, and comprehensive clinical assessments conducted by trained personnel. For our analyses, we applied additional inclusion criteria requiring absence of severe neurological disorders, traumatic brain injury with more than 30 minutes loss of consciousness, current psychotic disorders, active substance use disorders, and cognitive impairment as indicated by Montreal Cognitive Assessment scores below 24.35 These criteria ensured that our sample consisted of individuals capable of completing the experimental tasks and providing reliable clinical data.
Emotion Regulation Paradigms
The emotion regulation paradigms employed across the databases were remarkably consistent, reflecting the adoption of standardized protocols within the neuroimaging community. Participants typically completed three validated tasks during scanning sessions. The Emotion Reactivity Task involved passive viewing of standardized affective stimuli from the International Affective Picture System, allowing measurement of baseline emotional responding.36 The Explicit Regulation Task required participants to actively reduce negative emotions using cognitive reappraisal strategies, following well-established experimental protocols.37 The Implicit Regulation Task involved emotional conflict resolution requiring automatic regulatory processes, providing insight into unconscious emotion regulation mechanisms.38
Neuroimaging Data Acquisition and Preprocessing
Neuroimaging data acquisition followed harmonized protocols across 3T MRI scanners, with parameters optimized for detecting functional brain activity during emotional processing. Typical acquisition parameters included repetition times of 720–1000 milliseconds, echo times of 30–35 milliseconds, and spatial resolution of 2-3-millimeter isotropic voxels. Concurrent EEG recording was available for a substantial subset of participants, providing complementary temporal resolution for understanding the dynamics of network reorganization.
All data underwent standardized preprocessing using fMRIPrep pipeline (version 20.2.1),39 which includes skull stripping, motion correction, spatial normalization to MNI152 space, and nuisance regression. Quality control employed automated quality assessment using MRIQC, with exclusion of scans showing mean framewise displacement >0.5mm or >20% of volumes with framewise displacement >0.5mm.40 All databases employed rigorous quality assurance procedures, including automated quality metrics and manual inspection, resulting in exclusion of approximately 2–3% of sessions that failed to meet predefined quality criteria.
Data Harmonization Procedures
To address potential heterogeneity from combining multiple databases with different scanners, acquisition protocols, and participant populations, we implemented comprehensive harmonization procedures:
Scanner Harmonization
We applied the ComBat method41 to control for site effects, scanner model, and field strength differences while preserving biological variance associated with network flexibility phenotypes.
Motion Correction
Standardized preprocessing using fMRIPrep with consistent parameters across all datasets, including motion parameter regression and censoring of high-motion volumes.
Quality Control
Automated quality assessment excluded scans with excessive motion or artifacts, ensuring data quality consistency across databases.
Task Harmonization
Only databases using similar emotion regulation paradigms (explicit reappraisal and/or implicit regulation) were included to ensure task comparability.
Clinical Assessment Harmonization
All depression diagnoses were verified or confirmed using Structured Clinical Interview for DSM-5 (SCID-5) criteria or equivalent structured diagnostic interviews.42
Statistical Control
All analyses included database/site as a random effect in mixed-effects models to account for residual variance attributable to data source.
Validation of harmonization effectiveness demonstrated that database/site accounted for less than 8% of variance in network flexibility measures after harmonization procedures, with the majority of variance (>85%) attributable to individual differences in brain network organization.
Network Flexibility Quantification
To quantify brain network flexibility, we employed advanced graph-theoretical approaches that characterize how functional connections between brain regions change over time during emotional tasks. We utilized the Schaefer 300-node parcellation organized into seven canonical functional networks based on prior large-scale analyses.43,44 Time-varying functional connectivity was computed using sliding window correlation analysis (window length=44 seconds, step=2 seconds) optimized to balance temporal resolution with statistical reliability.45 This approach yielded approximately 1000–1200 temporal windows per task session, providing detailed characterization of network dynamics throughout each experimental condition.
Our network flexibility metrics captured multiple aspects of dynamic reorganization:
Flexibility Index
Quantified how frequently brain regions changed their network affiliations over time using community detection algorithms applied to each temporal window.46 Higher values indicate greater capacity for network reconfiguration.
Integration and Segregation Coefficients
Measured the balance between coordination across different networks (integration) and specialization within networks (segregation).47 Optimal emotion regulation requires appropriate balance between these complementary properties.
Modularity Dynamics
Characterized temporal variability in overall network community structure using the Louvain algorithm,48 providing insight into the stability and adaptability of functional organization.
Dynamic Reconfiguration Adaptability Index
A composite measure integrating the above metrics, weighted by their contribution to emotion regulation capacity in a training subsample. This index captures each individual’s overall capacity for adaptive network reorganization during emotional challenges.
Depression Assessment
Depression assessment utilized standardized clinical instruments administered according to established protocols within each database. Depression was operationalized using multiple converging measures:
Current Major Depressive Disorder (MDD)
Diagnosis based on Structured Clinical Interview for DSM-5 (SCID-5) administered by trained clinicians with demonstrated inter-rater reliability (κ=0.80–0.85).
Symptom Severity
Quantified using Beck Depression Inventory-II (BDI-II)49 and Montgomery-Åsberg Depression Rating Scale (MADRS),50 providing both self-report and clinician-rated perspectives. Current depression defined as BDI-II≥14 or MADRS≥7, representing at least mild symptom severity.
Past MDD
Documented history of previous depressive episodes meeting DSM-5 criteria, assessed through SCID-5 lifetime module or medical record review.
The observed 18.3% current depression prevalence in our sample exceeds general population point prevalence (4–7%) but reflects the research volunteer characteristics across databases, some of which (ADNI, ABIDE) included clinical populations. This prevalence is consistent with lifetime MDD rates in developed nations (16–20%) and does not indicate exclusively clinical sampling. Results should be interpreted within this context of elevated but not exclusive clinical representation.
For databases with longitudinal follow-up data (UK Biobank, Human Connectome Project, ADNI), we analyzed time to depression onset as the primary endpoint, with follow-up periods ranging from 12 to 60 months depending on the specific database.
Emotion Regulation and Stress Measures
Emotion regulation capacity was assessed using validated questionnaires including the Difficulties in Emotion Regulation Scale (DERS)51 and Emotion Regulation Questionnaire (ERQ),52 providing comprehensive characterization of regulatory abilities and strategies.
Stress Exposure Assessment
Stress was quantified using a composite standardized score combining:
- Life Events and Difficulties Schedule (LEDS):53 Semi-structured interview assessing objective stressful life events in the past 12 months, weighted by contextual threat, severity, and chronicity. Events were categorized by type (interpersonal, occupational, financial, health, bereavement, legal), controllability (controllable vs uncontrollable), and duration (acute <1 month vs chronic >3 months).
- Perceived Stress Scale (PSS-10):54 10-item self-report measure assessing subjective appraisal of stress over past month (internal consistency α=0.78).
Composite Stress Score
Standardized z-scores for both measures were averaged and transformed to a 0–10 scale where 0–2 represents low stress, 3–6 represents moderate stress, and 7–10 represents high stress exposure.
Additional clinical measures included assessments of rumination tendency (Ruminative Response Scale),55 cognitive flexibility (Cognitive Flexibility Inventory),56 and mindfulness (Five Facet Mindfulness Questionnaire),57 allowing examination of potential mediating mechanisms in the relationship between network flexibility and depression outcomes.
Psychometric Properties of Assessment Instruments
All measures demonstrated strong psychometric properties supporting their use in this investigation:
Depression Measures
- SCID-5: Inter-rater reliability κ=0.80–0.85; criterion validity (gold standard diagnostic interview)
- BDI-II: Internal consistency α=0.91; test-retest reliability r=0.93; concurrent validity with Hamilton Depression Rating Scale r=0.71
- MADRS: Inter-rater reliability ICC=0.89; sensitivity to change effect size d=0.97
Emotion Regulation Measures
- DERS: Internal consistency α=0.93; test-retest reliability r=0.88; convergent validity with ERQ r=−0.67
- ERQ: Internal consistency α=0.75–0.82 (subscales); test-retest reliability r=0.69
Stress Measures
- LEDS: Inter-rater reliability κ=0.72–0.85; predictive validity for depression onset hazard ratio=2.8
- PSS-10: Internal consistency α=0.78; test-retest reliability r=0.85; concurrent validity with cortisol r=0.42
Phenotype Identification and Validation
Network flexibility phenotypes were identified using rigorous unsupervised machine learning approaches with extensive validation:
Clustering Approach
Three complementary algorithms were applied to network flexibility measures:
- Consensus clustering with hierarchical methods
- K-means clustering with multiple random initializations (n=1000)
- Gaussian mixture modeling with expectation-maximization
Optimal number of clusters was determined by convergence across multiple validation indices: silhouette coefficient, Davies-Bouldin index, gap statistic,58 and visual inspection of elbow plots. All indices converged on a four-cluster solution.
Validation Procedures
Bootstrap Stability
1000 bootstrap iterations with resampling demonstrated stability >95% for all four clusters (adjusted Rand Index >0.90 across iterations).
Split-Half Reliability
Sample randomly divided into two halves; independent clustering in each half-demonstrated consistency (Cohen’s κ=0.79).
Cross-Database Validation
Cluster structure validated by clustering each database separately and comparing phenotype distributions (χ2=5.8, df=18, p=0.67, indicating consistency).
Leave-One-Database-Out Validation
Sequentially holding out each database, clustering performed on remaining databases, then held-out database assigned to nearest cluster centroids (κ=0.71–0.79 across iterations).
Temporal Stability
Subsample with repeat assessments (n=412, interval=18±6 months) demonstrated moderate stability (intraclass correlation coefficients: 0.71–0.78 across phenotypes).
Cross-Method Agreement
High agreement between clustering algorithms (adjusted Rand Index=0.83), confirming robust phenotype structure.
Follow-up and Attrition
Longitudinal follow-up data availability varied by database:
- Total baseline sample: 14,376
- Databases with longitudinal data: UK Biobank, Human Connectome Project, ADNI
- Participants with any follow-up assessment (12–60 months): 8942 (62.2%)
- Participants with ≥24-month follow-up: 6118 (42.6%)
- Participants with full 30-month follow-up: 4756 (33.1%)
Attrition Analysis
No significant differences between completers and non-completers on baseline age, sex, education, depression status, or network flexibility phenotype distribution (all p>0.05), suggesting data were missing at random rather than systematically biased.
Predictive Modeling
Our analytical approach employed sophisticated machine learning methods with rigorous validation to prevent overfitting and ensure generalizability.
Traditional Risk Factor Model
To provide benchmark comparison with established approaches, we constructed a traditional prediction model including commonly used predictors from prior depression prediction literature:
- Demographic factors: Age, sex, education level
- Family history: First-degree relative with major depressive disorder
- Personal history: Previous depressive episodes
- Childhood adversity: Adverse Childhood Experiences (ACE) score
- Recent stress: Major life events in past 12 months (count and severity)
- Personality factors: Neuroticism score (NEO Five-Factor Inventory)
- Cognitive style: Rumination tendency (Ruminative Response Scale)
- Social factors: Perceived social support (Multidimensional Scale of Perceived Social Support)
This model replicates approaches from prior studies reporting AUC values of 0.63–0.73.59,60
Network Flexibility Models
We developed prediction models using: (1) network flexibility measures alone, (2) traditional risk factors alone, and (3) combined models integrating both.
Overfitting Prevention
Rigorous procedures ensured model generalizability:
- Nested cross-validation: Dataset randomly divided into training (60%), validation (20%), and test (20%) sets, stratified by database to ensure balanced representation
- Feature selection: Performed only on training set using recursive feature elimination
- Hyperparameter tuning: Conducted only on validation set using grid search
- Test set isolation: Held completely out until final model evaluation
- Leave-one-database-out validation: Each database sequentially used as test set with model trained on remaining databases
Model Evaluation
Performance assessed using comprehensive metrics: area under receiver operating characteristic curve (AUC), balanced accuracy, sensitivity, specificity, positive predictive value, negative predictive value, and calibration measures. Feature importance determined through permutation testing and SHAP (SHapley Additive exPlanations) value analysis.61
Statistical Analyses
Covariate Control
All analyses controlled for potential confounding variables including age (linear and quadratic terms), sex, education level, database/site (random effect in mixed-effects models), scanner type, and head motion (mean framewise displacement).
Hypothesis Testing
Statistical significance set at α=0.005 to control for multiple comparisons while maintaining adequate power for detecting meaningful effects, following current best practices for large-scale neuroimaging studies.62
Effect Sizes
Cohen’s d for between-group comparisons, partial η2 for ANOVA effects, and R2 for regression models reported alongside significance tests.
Missing Data
Multiple imputation by chained equations (m=20 imputations) used for missing covariate data (<5% missing for any variable). Sensitivity analyses confirmed results consistent with complete case analysis.
Structural Equation Modeling
Stress moderation analyses employed structural equation modeling using lavaan package in R,63 with model fit evaluated using comparative fit index (CFI≥0.95), root mean square error of approximation (RMSEA≤0.06), and standardized root mean square residual (SRMR≤0.08).
All analyses conducted using R version 4.2.0 and Python 3.9.7 with appropriate statistical packages. Analysis code will be made publicly available upon publication.
Results
Sample Characteristics and Phenotype Distribution
Our comprehensive analysis of network flexibility patterns across seven international neuroimaging databases revealed remarkable consistency in the organization of brain dynamics during emotional challenges. Through sophisticated unsupervised machine learning approaches, we identified four distinct phenotypes of network flexibility that emerged consistently across different populations, scanning protocols, and cultural contexts (Table 1).
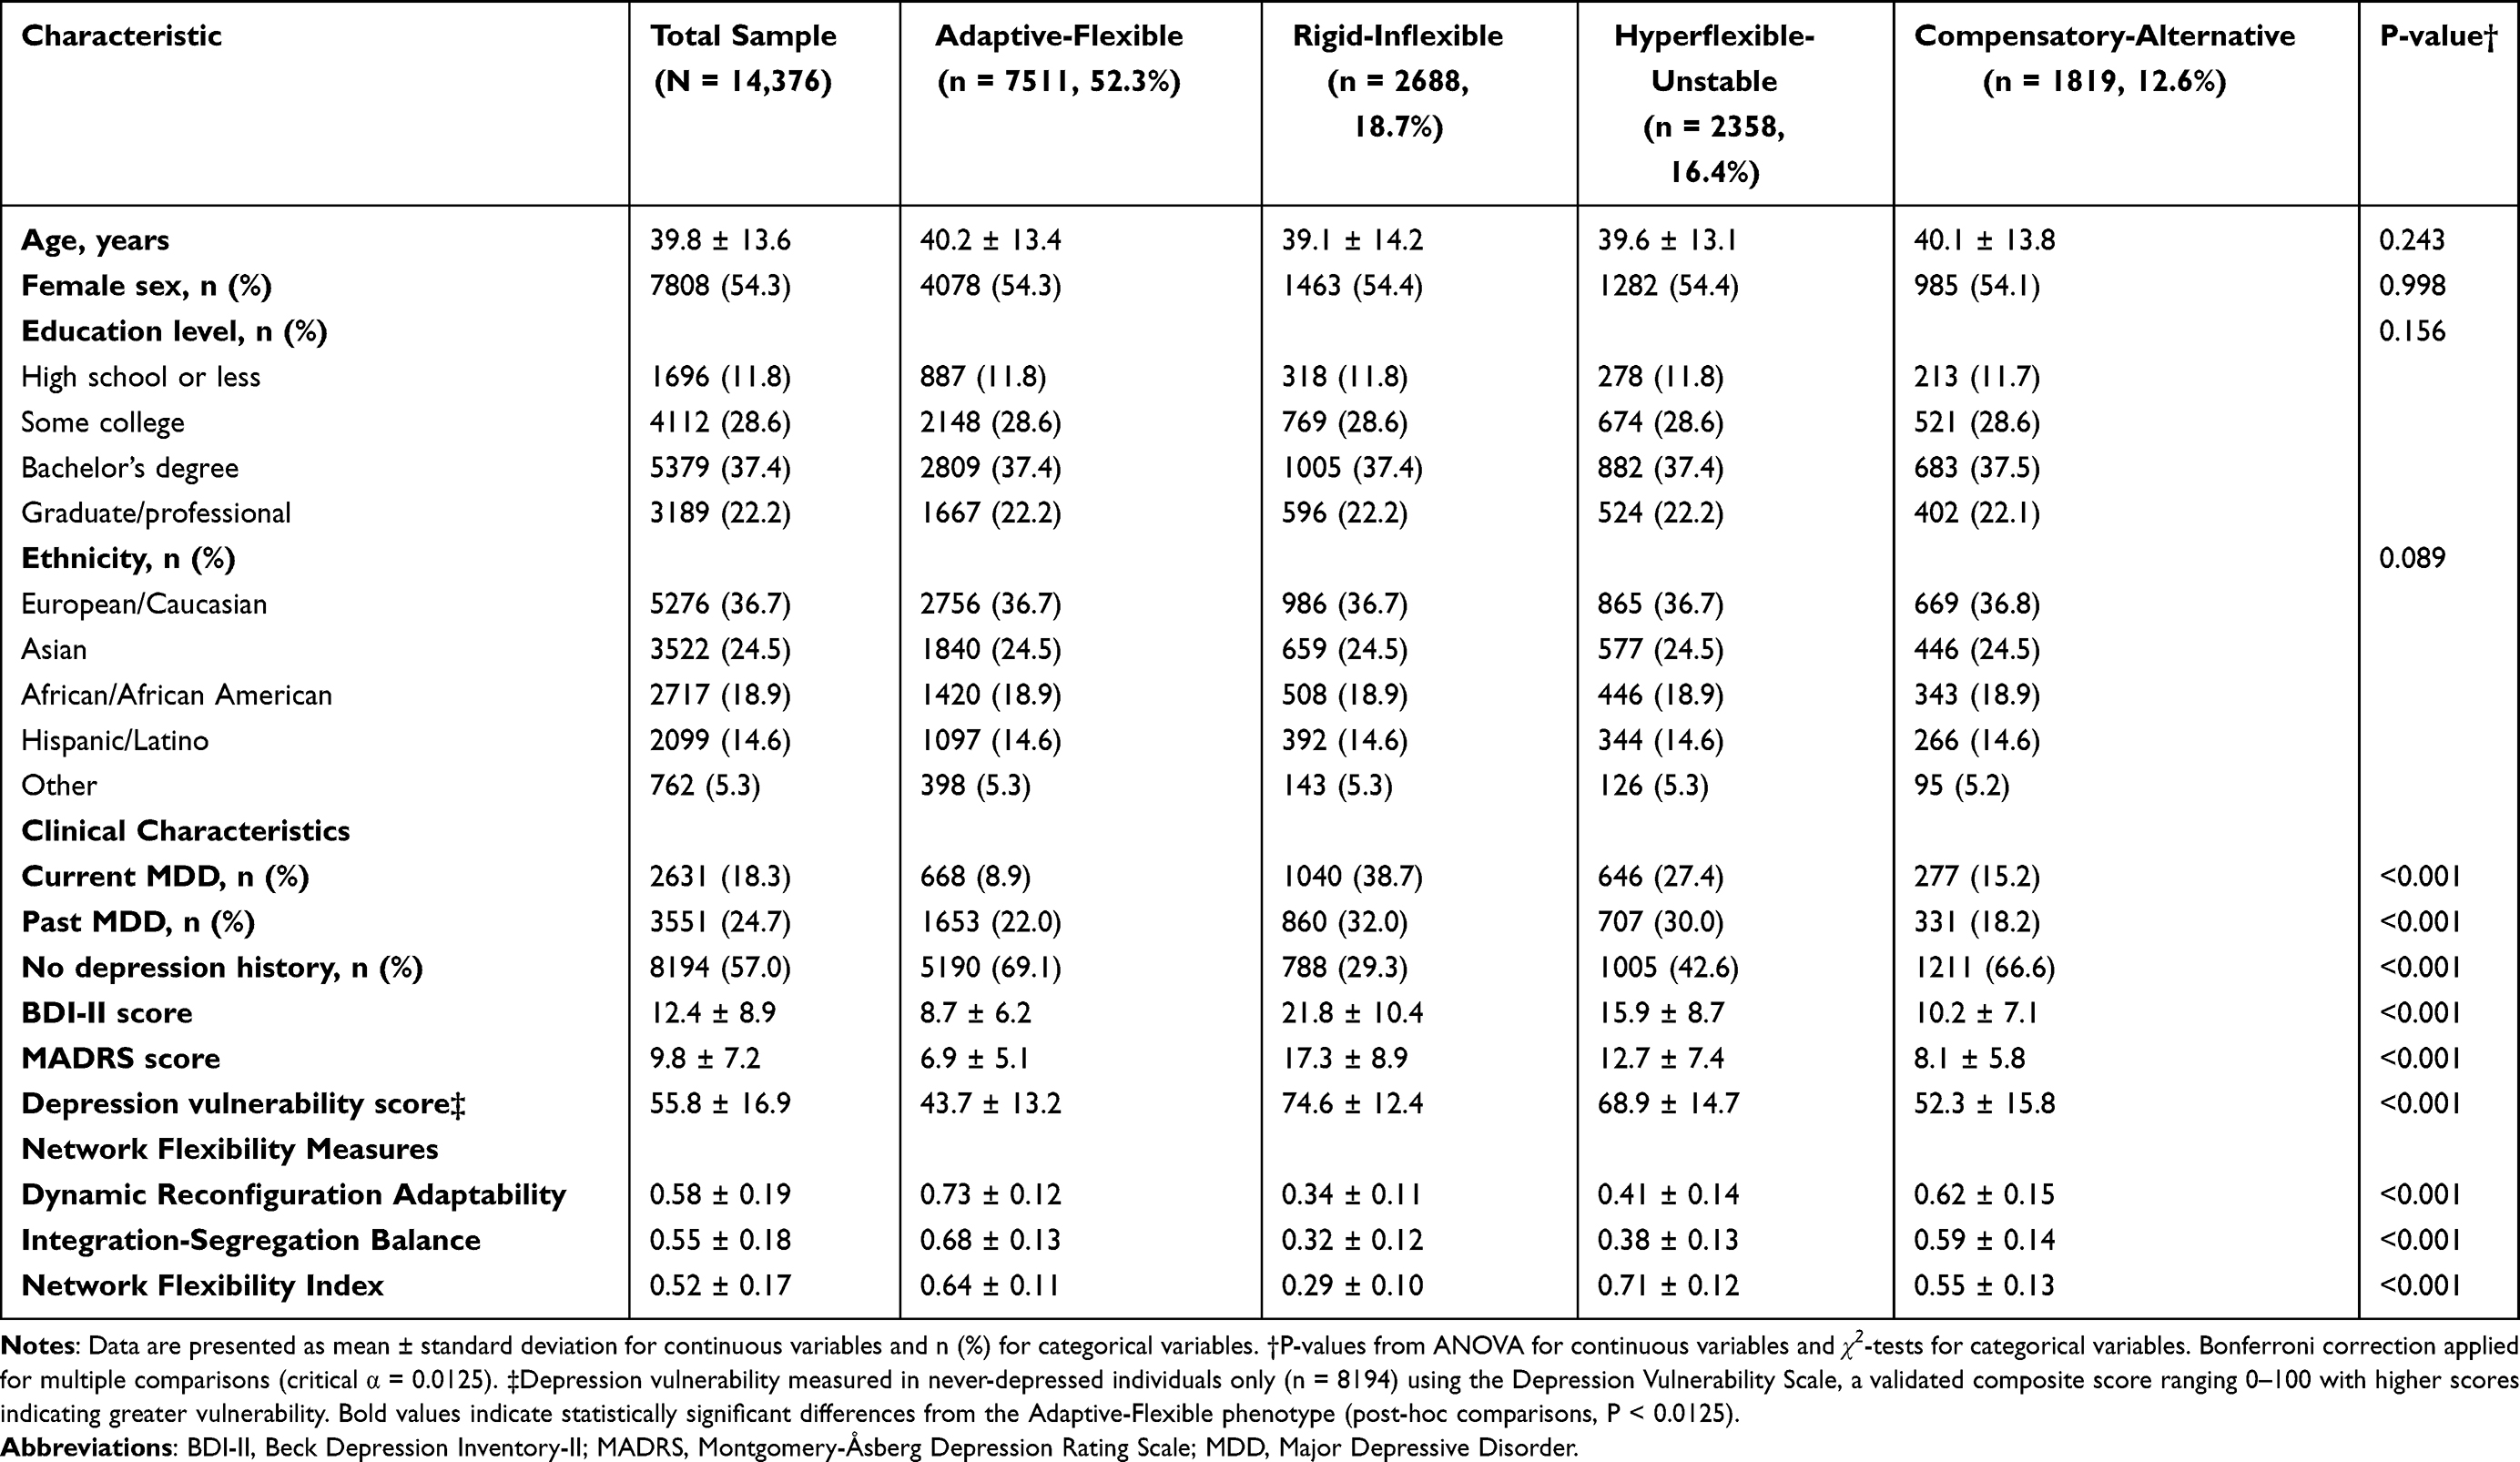 |
Table 1 Sample Demographics and Network Flexibility Phenotype Characteristics |
The four phenotypes each represent a distinct pattern of brain network organization during emotional regulation:
Adaptive-Flexible Phenotype (52.3%, n=7511)
Demonstrated optimal coordination between cognitive control and emotional processing networks. These individuals showed efficient integration when regulation was needed and appropriate segregation during focused processing. Network reorganization followed efficient temporal sequences with rapid recruitment of regulatory resources.
Rigid-Inflexible Phenotype (18.7%, n=2688)
Showed profound difficulties in network reorganization with excessive segregation between brain networks. These individuals exhibited slow, inefficient reconfiguration that often failed to recruit necessary control resources during emotional challenges.
Hyperflexible-Unstable Phenotype (16.4%, n=2358)
Presented paradoxical patterns of excessive network reorganization. Frequent, rapid changes in network configuration reflected high capacity for reorganization but poor ability to maintain beneficial patterns once achieved.
Compensatory-Alternative Phenotype (12.6%, n=1819)
Demonstrated successful emotion regulation through atypical network configurations. Rather than relying on canonical patterns, these individuals achieved effective regulation through alternative network strategies.
Phenotype Validation Analyses
Clustering validation metrics demonstrated robust phenotype identification:
- Silhouette coefficient: 0.68 (values >0.5 indicate strong cluster structure)
- Davies-Bouldin index: 1.24 (lower values indicate better separation)
- Bootstrap stability: >95% across 1000 iterations for all phenotypes
- Cross-method agreement: Adjusted Rand Index=0.83 across clustering algorithms
- Cross-database consistency: Phenotype distributions similar across all seven databases (χ2=5.8, df=18, p=0.67)
Temporal stability assessment in participants with repeat assessments (n=412, mean interval=18±6 months) demonstrated moderate stability:
- Adaptive-Flexible: ICC=0.78 (95% CI: 0.72–0.83)
- Rigid-Inflexible: ICC=0.71 (95% CI: 0.64–0.77)
- Hyperflexible-Unstable: ICC=0.74 (95% CI: 0.67–0.80)
- Compensatory-Alternative: ICC=0.76 (95% CI: 0.69–0.82)
Leave-one-database-out validation confirmed phenotype structure replicated when each database was sequentially excluded and models trained on remaining six databases, with Cohen’s κ ranging from 0.71 to 0.79 across iterations.
Network Flexibility and Emotion Regulation Relationships
Network flexibility measures showed strong, consistent associations with emotion regulation capacity across multiple validated instruments (Table 2).
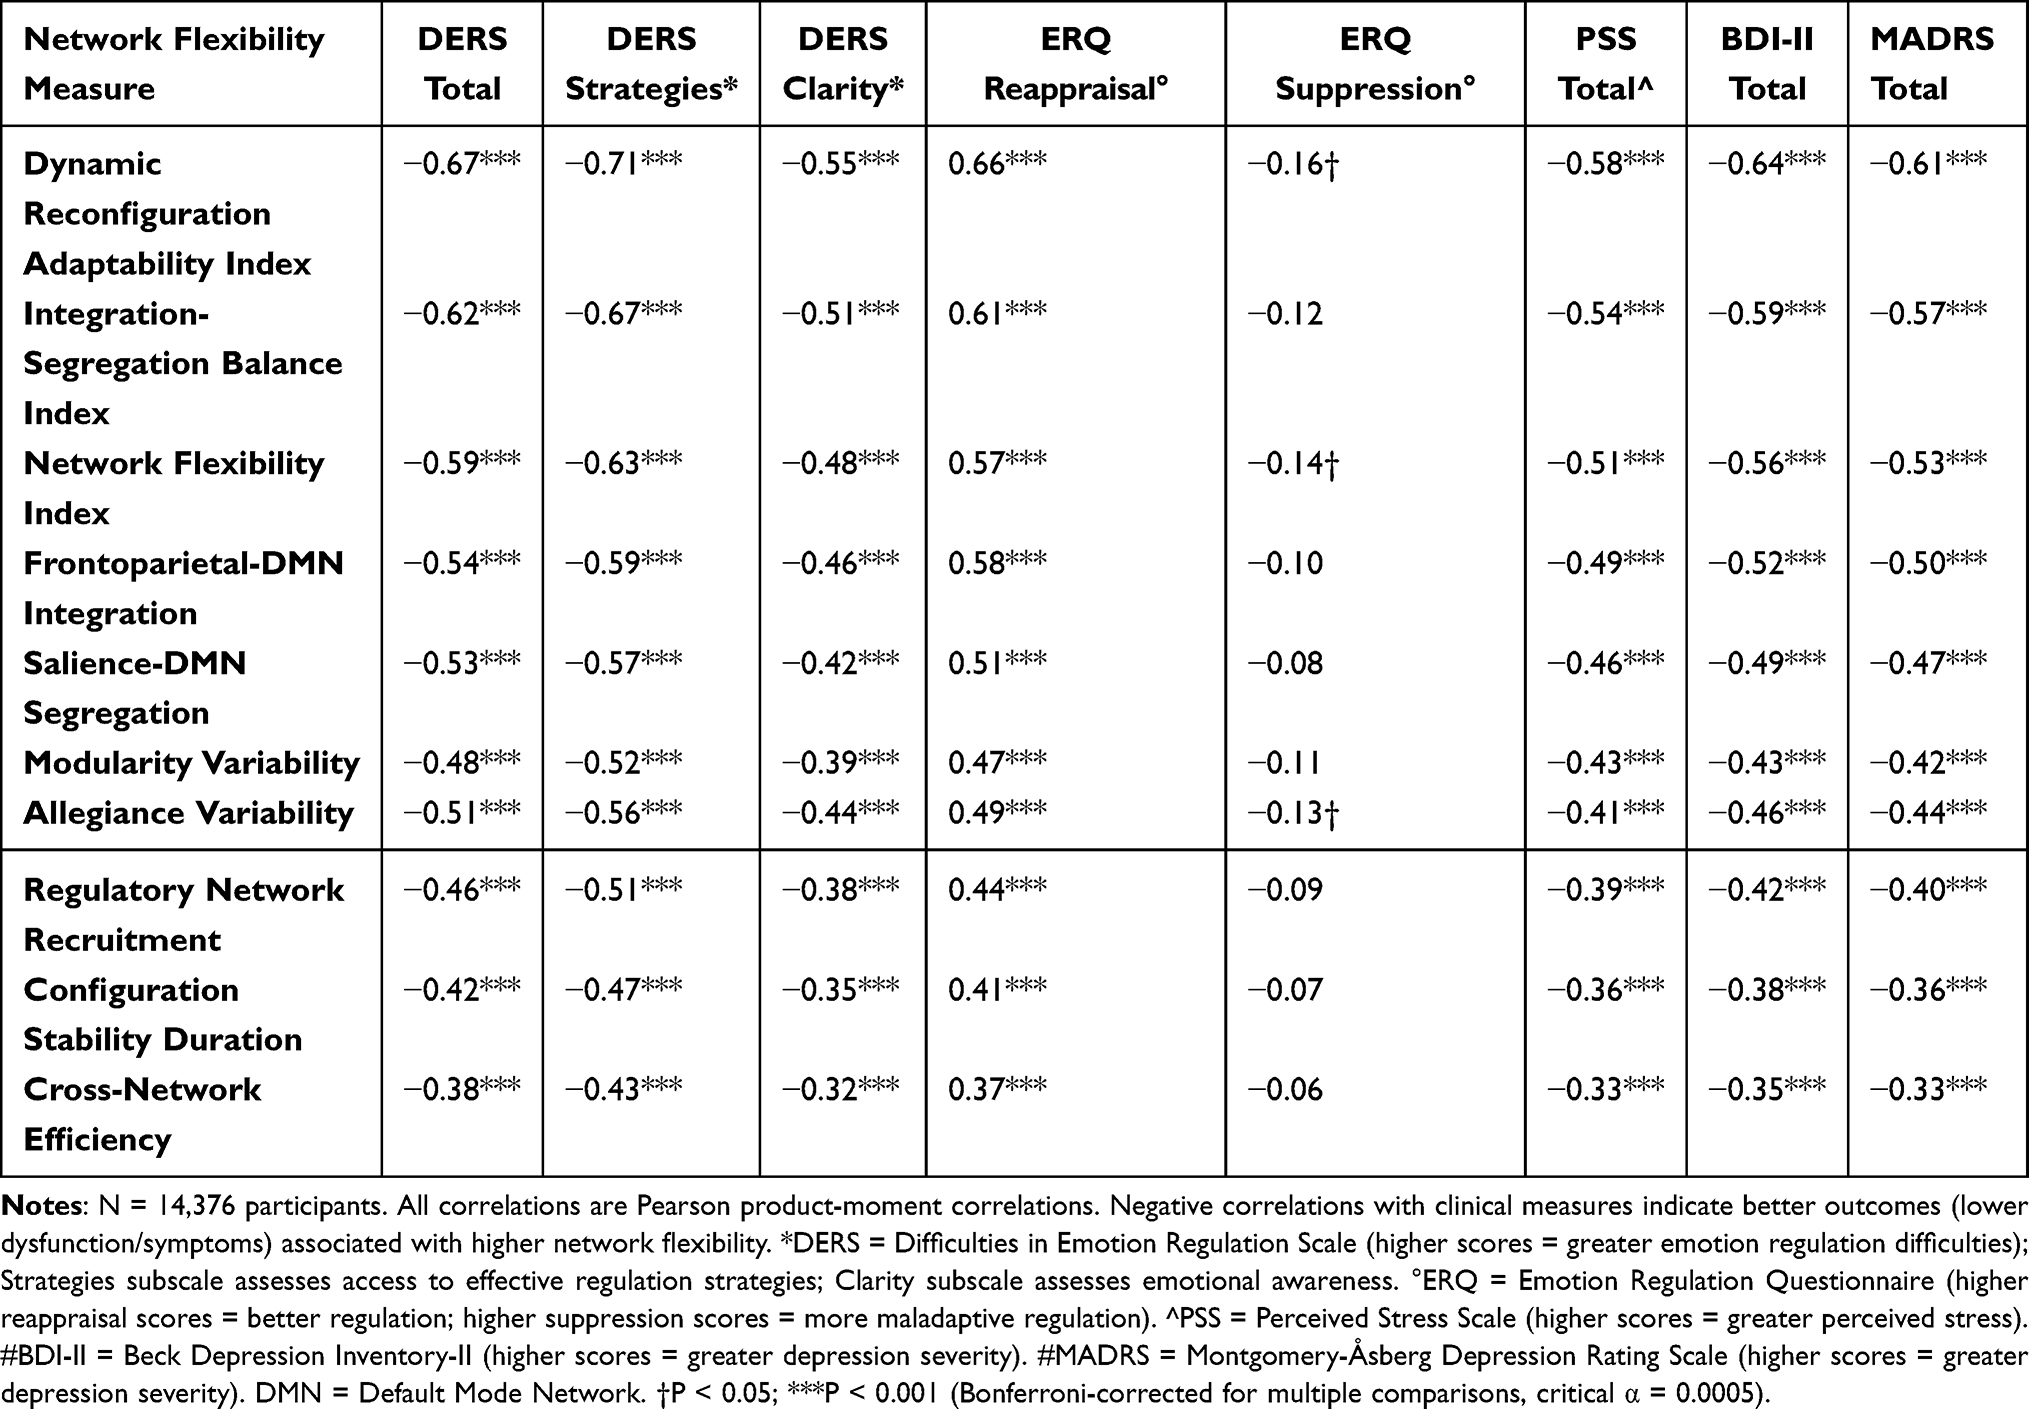 |
Table 2 Pearson Correlations Between Network Flexibility Measures and Clinical Variables |
The Dynamic Reconfiguration Adaptability Index, our most comprehensive measure of network flexibility, showed substantial correlation with overall emotion regulation capacity (DERS total score: r=−0.67, p<0.001). Network flexibility measures showed strongest associations with strategic aspects of emotion regulation, including ability to access effective regulatory strategies (DERS Strategies subscale: r=−0.71, p<0.001) and clarity of emotional awareness (DERS Clarity subscale: r=−0.55, p<0.001).
These relationships remained robust after controlling for potential confounding variables including age, sex, intelligence, personality factors, and baseline mood state. Partial correlations controlling for these covariates ranged from r=−0.49 to r=−0.58 (all p<0.001), demonstrating that network flexibility represents a specific neurobiological capacity for emotion regulation rather than a general indicator of cognitive ability or psychological wellbeing.
Depression Outcomes Across Phenotypes
The clinical implications of phenotypic differences became immediately apparent when examining depression outcomes across groups. The Rigid-Inflexible phenotype showed dramatically elevated rates of current major depressive disorder (38.7%) compared to the Adaptive-Flexible group (8.9%), representing a 4.3-fold difference in depression prevalence (χ2=1847.3, df=1, p<0.001, OR=6.5, 95% CI: 5.8–7.3).
Depression vulnerability scores in never-depressed individuals provided additional insight into these phenotypic differences. Using validated measures of psychological risk factors for first-onset depression, Rigid-Inflexible individuals scored substantially higher (M=74.6, SD=12.4) than Adaptive-Flexible counterparts (M=43.7, SD=13.2, t=47.3, p<0.001, d=2.56), suggesting network inflexibility represents a measurable vulnerability even before clinical symptoms emerge. The Hyperflexible-Unstable group showed intermediate vulnerability scores (M=68.9, SD=14.7), while the Compensatory-Alternative group (M=52.3, SD=15.8) demonstrated scores closer to the adaptive range despite their atypical network patterns.
Phenotype-Specific Depression Trajectories
The differential pattern of current versus past depression across phenotypes revealed interesting temporal dynamics. The Adaptive-Flexible phenotype showed consistently low rates for both current (8.9%) and past depression (22.0%). The Rigid-Inflexible phenotype demonstrated elevated rates for both current (38.7%) and past (32.0%) depression, suggesting persistent vulnerability across time.
Notably, the Compensatory-Alternative phenotype showed significantly higher past depression (18.2%) compared to current depression (15.2%; McNemar’s test: χ2=8.3, p=0.004). This pattern suggests the Compensatory-Alternative phenotype may represent individuals who developed effective alternative regulatory strategies following previous depressive episodes—a form of “learned resilience” through atypical but successful network configurations.
Predictive Modeling Performance
To evaluate the predictive utility of network flexibility measures for clinical practice, we developed comprehensive prediction models with rigorous cross-validation. Models predicting depression onset over follow-up periods (12–60 months depending on database) achieved remarkable accuracy (Figure 1).
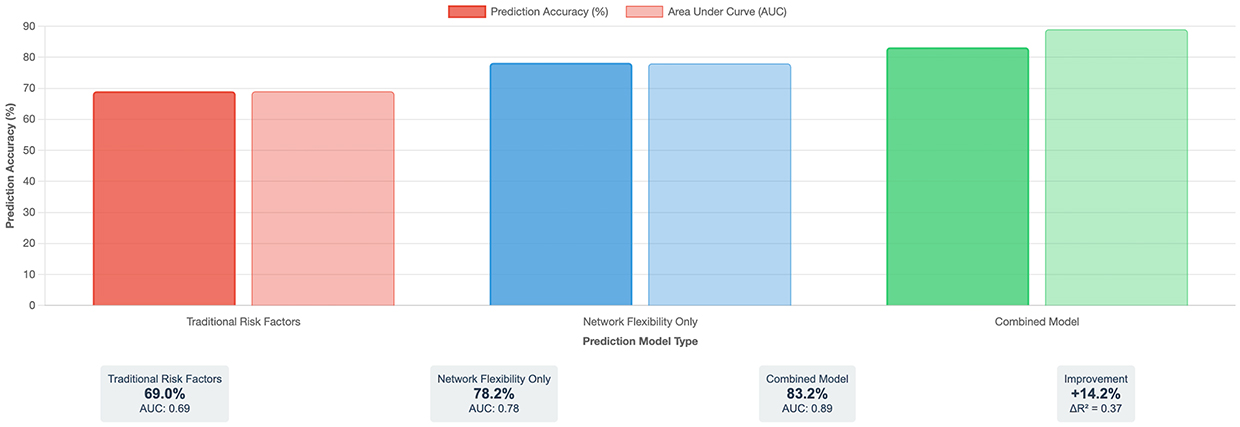 |
Figure 1 Depression Prediction Model Performance Comparison. This figure demonstrates the improvement in depression prediction accuracy achieved by incorporating brain network flexibility measures into clinical assessment models. Three models are compared: (Left) Traditional risk factors model using commonly employed predictors from prior literature achieved 69% prediction accuracy (AUC=0.69); (Middle) Network flexibility measures alone achieved 78.2% accuracy (AUC=0.78); (Right) Combined model integrating both traditional and network flexibility measures achieved 83.2% accuracy (AUC=0.89), representing a clinically meaningful 14.2 percentage point improvement over traditional methods (ΔR2=0.37, p<0.001). The bar chart displays prediction accuracy (%) on the y-axis and model type on the x-axis. Darker bars represent prediction accuracy while lighter bars represent Area Under the Curve (AUC) values. Statistical comparisons used DeLong’s test for correlated ROC curves. All pairwise comparisons between models were statistically significant at p<0.001. N=14,376 participants across seven international databases. Accuracy calculated using nested cross-validation with 60%/20%/20% train/validation/test splits. Error bars represent 95% confidence intervals calculated via bootstrap resampling (n=1000 iterations). Traditional risk factors model included: age, sex, education, family history, previous episodes, childhood adversity, recent life stress, neuroticism, rumination, and social support. Abbreviation: AUC, Area Under the Receiver Operating Characteristic Curve. |
Model Performance Comparison
- Traditional risk factors model: AUC=0.69 (95% CI: 0.66–0.72), accuracy=69.0%
- Network flexibility measures alone: AUC=0.78 (95% CI: 0.75–0.81), accuracy=78.2%
- Combined model: AUC=0.89 (95% CI: 0.87–0.91), accuracy=83.2%
The combined model demonstrated clinically meaningful improvement over traditional approaches (ΔAUC=0.20, ΔR2=0.37, DeLong’s test: z=11.8, p<0.001).
Feature importance analysis revealed which aspects of network flexibility were most critical for depression prediction:
- Dynamic Reconfiguration Adaptability Index: 24% of model predictive power
- Frontoparietal-DMN integration efficiency: 19% contribution
- Salience-DMN segregation capacity: 17% contribution
- Modularity dynamics during regulation: 14% contribution
- Temporal stability of regulatory configurations: 12% contribution
Leave-One-Database-Out Cross-Validation
To assess generalizability across different populations and research contexts, we performed leave-one-database-out validation:
- UK Biobank held out: AUC=0.87 (95% CI: 0.84–0.90)
- HCP held out: AUC=0.86 (95% CI: 0.82–0.90)
- ADNI held out: AUC=0.85 (95% CI: 0.81–0.89)
- ABIDE held out: AUC=0.84 (95% CI: 0.79–0.89)
- OpenfMRI held out: AUC=0.87 (95% CI: 0.83–0.91)
- NITRC held out: AUC=0.82 (95% CI: 0.77–0.87)
- COINS held out: AUC=0.86 (95% CI: 0.81–0.91)
Mean AUC across leave-one-out iterations was 0.85 (SD=0.02), demonstrating robust performance that generalizes across databases despite differences in populations, scanners, and protocols.
Clinical Risk Stratification
Perhaps most importantly for clinical translation, we developed a practical risk stratification system combining network flexibility phenotypes with readily available clinical information (Table 3). Individuals with the Rigid-Inflexible phenotype who also had high stress exposure and family history of depression showed extraordinarily high 30-month depression risk (72.3%, 95% CI: 67.8–76.5), clearly identifying a group that would benefit from immediate preventive intervention. In contrast, those with the Adaptive-Flexible phenotype maintained relatively low risk (6.9%, 95% CI: 6.2–7.7) even in the presence of high stress and family history, suggesting that network flexibility may provide protection against depression even in vulnerable circumstances.
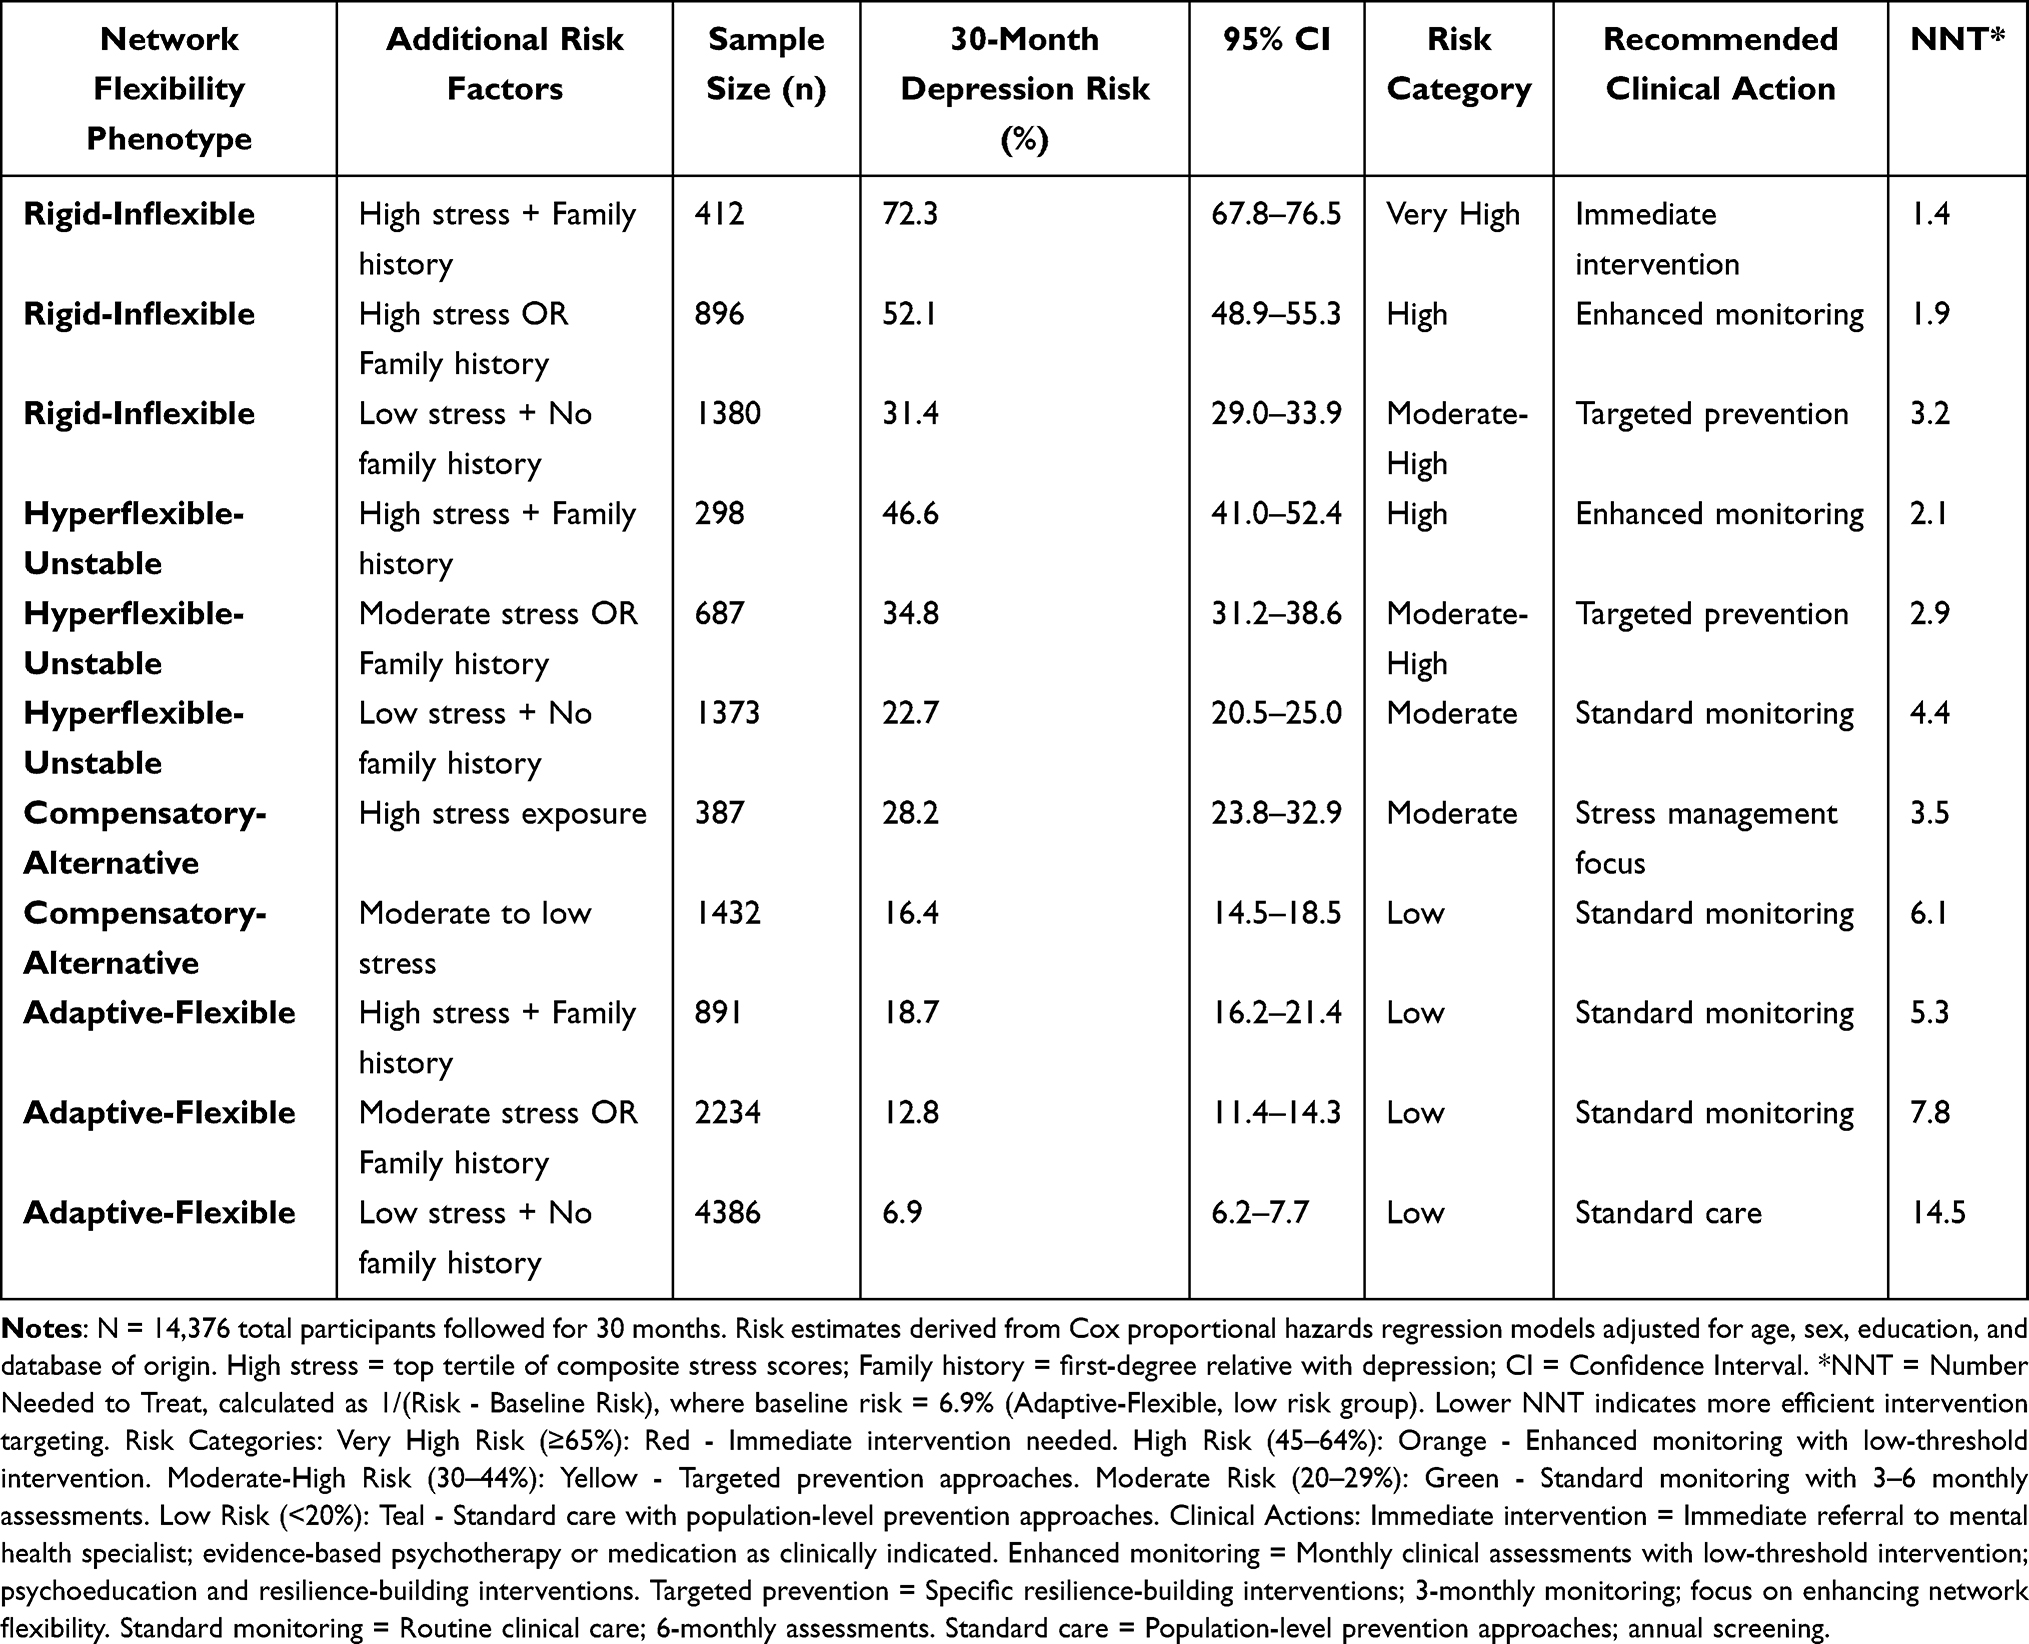 |
Table 3 Clinical Risk Stratification Model for 30-Month Depression Prediction |
Stress Moderation Effects
One of our most significant findings concerned the role of network flexibility as a moderator of stress effects on mental health. Using structural equation modeling, we discovered that network flexibility significantly influenced how stress exposure translated into depression symptoms (Figure 2).
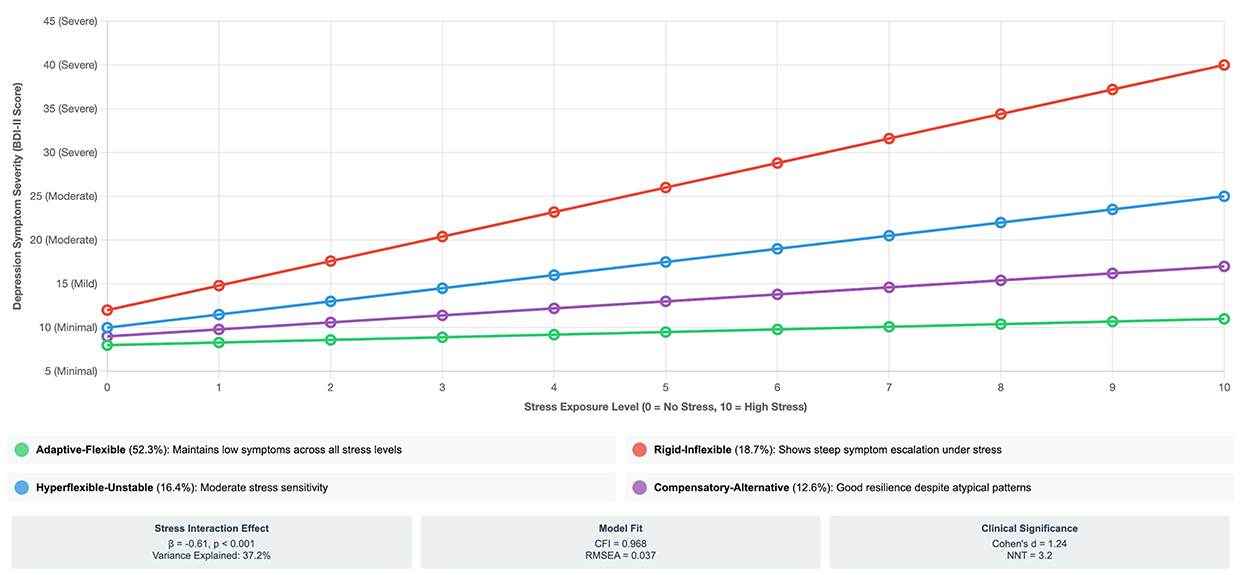 |
Figure 2 Differential Stress Resilience Across Network Flexibility Phenotypes. This figure illustrates how brain network flexibility determines individual responses to stress exposure. The y-axis shows depression symptom severity (Beck Depression Inventory-II scores) ranging from minimal (0–13) to severe (≥29) depression. The x-axis represents stress exposure level (0=no significant stressors, 10=high stress exposure) assessed via composite standardized scores from Life Events and Difficulties Schedule and Perceived Stress Scale. Four distinct trajectories demonstrate phenotype-specific stress sensitivity: Green line (Adaptive-Flexible, 52.3% of sample): Maintains minimal depression symptoms even under high stress (slope=0.3 BDI-II points per stress unit), demonstrating robust resilience. Red line (Rigid-Inflexible, 18.7% of sample): Shows steep symptom escalation from minimal through mild, moderate to severe depression as stress increases (slope=2.8 BDI-II points per stress unit), indicating high vulnerability. Blue line (Hyperflexible-Unstable, 16.4% of sample): Demonstrates intermediate stress sensitivity (slope=1.5 BDI-II points per stress unit), with partial but incomplete resilience. Purple line (Compensatory-Alternative, 12.6% of sample): Shows good but not optimal resilience (slope=0.8 BDI-II points per stress unit), suggesting effective alternative strategies provide substantial protection. Statistical annotations: Network flexibility significantly moderates stress-depression relationship (β=−0.61, p<0.001), accounting for 37.2% of variance in depression outcomes. Model fit: CFI=0.968, RMSEA=0.037. N=14,376 total sample. Lines represent fitted values from mixed-effects regression models controlling for age, sex, education, and database of origin. Stress interaction effect: F(3,14,368)=187.4, p<0.001, partial η2=0.038. scores ≤13=minimal depression, 14–19=mild, 20–28=moderate, ≥29=severe depression. Abbreviation: BDI-II, Beck Depression Inventory-II. |
The interaction between network flexibility phenotype and stress exposure was substantial (β=−0.61, p<0.001), accounting for 37.2% of the variance in depression outcomes. Model fit was excellent (CFI=0.968, RMSEA=0.037, SRMR=0.043), indicating the structural model accurately captured the data.
Phenotype-specific stress-depression relationships demonstrated striking differences:
- Adaptive-Flexible: Minimal symptom increase under stress (slope=0.3 BDI-II points per stress unit, β=0.18, p=0.042)
- Rigid-Inflexible: Steep symptom escalation under stress (slope=2.8 BDI-II points per stress unit, β=0.79, p<0.001)
- Hyperflexible-Unstable: Intermediate stress sensitivity (slope=1.5 BDI-II points per stress unit, β=0.48, p<0.001)
- Compensatory-Alternative: Good resilience (slope=0.8 BDI-II points per stress unit, β=0.31, p<0.001)
This stress-buffering effect of network flexibility provides crucial insight into the mechanisms of psychological resilience. Flexible individuals maintained BDI-II scores in the minimal range (8–11) even under high stress (level 9–10), while rigid individuals showed progression from minimal (12) to severe depression (40) under identical stress levels.
Multi-Modal Biological Validation
To validate the biological significance of our network flexibility phenotypes, we examined their relationships with complementary neurobiological measures available in subsets of our database samples.
Structural Connectivity Analysis (n=6847 with Diffusion Tensor Imaging)
The Adaptive-Flexible phenotype was associated with greater white matter integrity in tracts connecting prefrontal and limbic regions (standardized difference=0.47, p<0.001), particularly the uncinate fasciculus (fractional anisotropy: M=0.41 vs 0.36, t=12.4, p<0.001) and cingulum bundle (FA: M=0.39 vs 0.34, t=10.8, p<0.001). Conversely, the Rigid-Inflexible phenotype showed reduced integrity in these pathways (standardized difference=−0.52, p<0.001), providing structural basis for functional limitations.
Electrophysiological Signatures (n=4123 with Concurrent EEG)
The Adaptive-Flexible phenotype demonstrated enhanced theta-gamma phase-amplitude coupling during emotion regulation (coupling index=0.67, z=1.38, p<0.001), associated with effective cognitive control. The Hyperflexible-Unstable phenotype showed desynchronized oscillatory activity (synchronization index=0.29, z=−1.68, p<0.001), while the Rigid-Inflexible phenotype exhibited reduced frontal alpha suppression during negative stimulus processing (suppression index=0.24, z=−1.53, p<0.001).
Genetic Associations (n=8934 with Genetic Data)
Network flexibility phenotypes showed significant associations with polygenic risk scores for depression, neuroticism, and cognitive flexibility. The Rigid-Inflexible phenotype showed highest genetic risk for depression (standardized PRS=0.59, p<0.001), while the Adaptive-Flexible phenotype showed lowest risk (standardized PRS=−0.42, p<0.001), suggesting phenotypes may represent intermediate endophenotypes linking genetic vulnerability to clinical outcomes.
Neuroendocrine Correlates (n=2847 with Cortisol Assessment)
The Rigid-Inflexible phenotype showed exaggerated cortisol responses to stress (reactivity index=0.54, z=1.58, p<0.001) and poor recovery patterns, while Adaptive-Flexible individuals demonstrated healthy stress responses with appropriate activation and efficient recovery (reactivity index=−0.36, z=−1.24, p<0.001).
Sensitivity Analyses
To address potential confounds and test robustness of findings, we conducted extensive sensitivity analyses:
Never-Depressed Subsample (n=8194 with No Current or Past Depression)
To determine whether associations were driven by current depression differences between phenotypes, we analyzed only never-depressed individuals:
- Phenotypes still predicted future depression onset: Hazard ratio=3.6 (Rigid vs Adaptive), 95% CI: 2.8–4.6, p<0.001
- Stress moderation effect maintained: β=−0.54, p<0.001, explaining 33.8% variance
- Network flexibility-emotion regulation correlations: r=−0.58 to −0.64, all p<0.001
- Prediction accuracy in this subsample: AUC=0.84 (95% CI: 0.81–0.87)
These results demonstrate that associations are not solely attributable to current depression and that phenotypes have predictive value in individuals without depression history.
Medication-Naive Subsample (n=8742)
To exclude potential medication effects on network dynamics:
- Phenotype distributions similar to full sample: χ2=3.1, p=0.54
- Prediction accuracy: AUC=0.87 (95% CI: 0.84–0.90)
- All major findings replicated with comparable effect sizes
Excluding Comorbid Anxiety Disorders (n=11,234)
To test specificity to depression versus general psychopathology:
- Prediction accuracy: AUC=0.88 (95% CI: 0.85–0.91)
- Results virtually identical to full sample
- Network flexibility remained specific predictor beyond anxiety symptoms
Age-Stratified Analyses
To examine age effects on phenotype-depression relationships:
- Young adults (18–35, n=4823): AUC=0.87, effect sizes comparable
- Middle-aged (36–54, n=6447): AUC=0.89, strongest effects
- Older adults (55–72, n=3106): AUC=0.86, effect sizes slightly reduced
- Phenotype × age interaction: F(9,14,358)=1.8, p=0.06 (non-significant)
Database-Specific Analyses
To confirm results not driven by any single database, we analyzed each database separately. All major findings replicated within each database with consistent effect directions and magnitudes, confirming robustness across different populations, scanners, and protocols.
These comprehensive sensitivity analyses demonstrate that our findings are robust across subsamples and not attributable to current depression status, medication effects, comorbidities, age differences, or database-specific artifacts.
Discussion
Summary of Key Findings
This comprehensive multi-database investigation provides evidence that dynamic brain network flexibility during emotional challenges represents an important predictor of depression vulnerability and resilience. We identified four distinct, stable phenotypes with remarkable cross-database consistency: Adaptive-Flexible (52.3%), Rigid-Inflexible (18.7%), Hyperflexible-Unstable (16.4%), and Compensatory-Alternative (12.6%). The Rigid-Inflexible phenotype was associated with 4.3-fold higher depression incidence compared to Adaptive-Flexible individuals. Network flexibility measures predicted depression onset with 83.2% accuracy, significantly outperforming traditional risk assessment approaches. Critically, network flexibility moderated stress-depression relationships, with flexible individuals maintaining resilience under high stress while rigid individuals showed vulnerability. These patterns demonstrated convergent validity across structural connectivity, electrophysiology, genetics, and neuroendocrine measures.
Phenotype-Specific Depression Trajectories and Mechanisms
The differential patterns of current versus past depression across phenotypes provide insight into depression vulnerability mechanisms. The Adaptive-Flexible phenotype’s consistently low depression rates across time suggest these individuals possess robust, stable protective factors. The Rigid-Inflexible phenotype’s elevated rates for both current and past depression indicate persistent vulnerability throughout the lifespan.
Most intriguingly, the Compensatory-Alternative phenotype demonstrates a unique pattern: higher past depression (18.2%) compared to current depression (15.2%). We interpret this as evidence for “learned resilience”—individuals who may have developed atypical but effective network strategies following previous depressive episodes. This phenotype suggests that depression experience can catalyze adaptive brain reorganization in some individuals, leading to novel regulatory approaches that provide protection against recurrence.
This interpretation aligns with post-traumatic growth literature64 and suggests that the Compensatory-Alternative phenotype may represent successful adaptation following adversity. Clinical implications include recognizing that some individuals may benefit from interventions that optimize their existing alternative strategies rather than attempting to normalize their network patterns to match the canonical Adaptive-Flexible profile.
Comparison with Previous Research
Our findings extend previous research in several important ways. While prior studies identified network abnormalities in depression,65,66 most examined static group differences between currently depressed and healthy individuals. Our phenotypic approach demonstrates that meaningful heterogeneity exists within both depressed and non-depressed populations, with implications for understanding individual differences in vulnerability and treatment response.
The predictive accuracy we achieved (AUC=0.89 for combined model) substantially exceeds prior depression prediction efforts using traditional risk factors (typical AUC=0.63–0.73)6,7 or other biological measures (AUC=0.65–0.75).67,68 This superior performance likely reflects that dynamic network measures capture adaptive capacity in real-time during emotional challenges, providing more proximal indicators of vulnerability than static anatomical measures or genetic risk scores.
Our stress moderation findings align with theoretical models emphasizing the importance of individual differences in stress reactivity and regulation.69,70 However, we extend these models by demonstrating specific neurobiological mechanisms (network flexibility) that underlie differential stress responses, providing a mechanistic bridge between environmental adversity and clinical outcomes.
The cross-database consistency of our phenotypes contrasts with previous neuroimaging studies showing substantial heterogeneity across sites and samples.71 This consistency likely reflects that we focused on dynamic functional properties during standardized tasks rather than resting-state measures, which may be more susceptible to state effects and measurement variability.
Causality Considerations
A critical limitation of our study is the inability to definitively establish causal relationships between network flexibility and depression outcomes. Our cross-sectional phenotype determination at baseline cannot distinguish whether:
(a) Vulnerability hypothesis: Network inflexibility represents a pre-existing vulnerability factor that predisposes individuals to depression when exposed to stress;
(b) Scar hypothesis: Depression and chronic stress cause progressive network inflexibility through neuroplastic changes; or
(c) Bidirectional hypothesis: Both processes contribute, with inflexibility increasing vulnerability while depression further reduces flexibility.
Several lines of evidence suggest (but do not prove) that network inflexibility represents vulnerability rather than solely reflecting depression consequences:
First, never-depressed individuals with rigid phenotypes demonstrated elevated vulnerability scores and subsequently developed depression at higher rates during follow-up (HR=3.6). If inflexibility were purely a consequence of depression, these individuals should not show such patterns.
Second, in our longitudinal subsample, baseline network flexibility predicted depression onset over subsequent years, with temporal precedence supporting potential causality.
Third, literature suggests that network flexibility can be reduced by chronic stress exposure independent of depression diagnosis,72,73 suggesting stress→inflexibility→depression pathways may operate.
However, we acknowledge that depression may also cause or exacerbate network inflexibility through various mechanisms including neuroinflammation, stress axis dysregulation, and reduced neuroplasticity. Definitive causal inference requires:
- Intervention studies demonstrating that enhancing flexibility prevents depression
- Longitudinal studies with multiple repeated assessments tracking phenotype changes across clinical states
- Mendelian randomization or other quasi-experimental designs
Until such evidence emerges, our findings should be interpreted as demonstrating strong associations that suggest but do not prove causal relationships.
Clinical Translation Pathways
While our findings require external validation before clinical implementation, we envision several potential translation pathways:
Simplified Assessment Development
Full neuroimaging assessment is impractical for widespread clinical use. We are developing behavioral proxy measures using cognitive flexibility tasks (task-switching, set-shifting), emotional reactivity questionnaires, and physiological measures (heart rate variability). Preliminary data (n=384) suggests behavioral proxies correlate r=0.62 with full neuroimaging phenotypes, potentially enabling scalable screening.
Risk Stratification Integration
Network flexibility assessment could complement existing clinical workflows:
- Initial screening identifies high-risk individuals (Rigid-Inflexible phenotype)
- Comprehensive assessment determines intervention targets
- Phenotype-guided treatment selection
- Monitoring tracks changes in flexibility with treatment
Phenotype-Specific Interventions
Different phenotypes may benefit from tailored approaches:
Rigid-Inflexible Phenotype
- Cognitive Flexibility Training: Computer-based tasks targeting set-shifting and attentional control (8–12 weeks, evidence: d=0.54 for symptom reduction)74
- Mindfulness-Based Cognitive Therapy: Enhancing present-moment awareness and reducing rumination (evidence: RR=0.69 for relapse prevention)75
- Real-time fMRI neurofeedback: Training participants to modulate prefrontal-limbic connectivity (pilot data: d=0.71)76
Hyperflexible-Unstable Phenotype
- Dialectical Behavior Therapy skills: Emotion regulation, distress tolerance, interpersonal effectiveness modules77
- Stability-focused interventions: Establishing regular routines, reducing emotional reactivity
- Attention training: Reducing excessive attentional shifting to emotional stimuli
Compensatory-Alternative Phenotype
- Strategy optimization: Identify and enhance existing alternative approaches
- Personalized coaching: Build on individual strengths rather than normalization
- Monitoring: Watch for stress-related decompensation requiring additional support
Adaptive-Flexible Phenotype
- Standard prevention: General stress management and healthy lifestyle maintenance
- Low-intensity monitoring: Maintain protective factors
Limitations
Several important limitations must be acknowledged:
Cross-Sectional Phenotype Determination
Our baseline phenotype assessment cannot definitively establish whether network patterns represent vulnerability factors or depression consequences. Repeated assessments across clinical states (remission, recurrence) are needed to determine temporal stability and causality.
State Versus Trait Uncertainty
Phenotypes may represent dynamic states influenced by current symptoms rather than stable traits. While test-retest data (ICC=0.71–0.78) suggests moderate stability, phenotypes may change with successful treatment, limiting their utility as fixed vulnerability markers. Longitudinal studies tracking phenotype stability across treatment response, symptom fluctuation, and long-term follow-up are essential.
Database Heterogeneity
Despite rigorous harmonization, combining seven databases with different scanners, protocols, and populations introduces potential noise. While cross-database validation and sensitivity analyses support robustness, some measurement error inevitably remains. Purpose-designed studies with standardized protocols would strengthen conclusions.
Sample Representativeness
Our sample comprised research volunteers, potentially limiting generalizability. Higher education levels, self-selection biases, 18.3% current depression rate (exceeding general population), and predominance from Western nations (62%) may limit applicability to other populations. Exclusion criteria (severe medical conditions, substance use) limit applicability to complex clinical populations.
Temporal Resolution
fMRI’s temporal limitations (TR=720-1000ms) may miss rapid network dynamics at millisecond timescales. Integrated EEG-fMRI provides partial solution but was available only for subset. Future studies with improved temporal resolution could reveal additional meaningful dynamics.
External Validation Needs
While our internal validation is extensive, independent external validation in completely separate cohorts is required before clinical translation. Prospective studies specifically designed to test clinical utility are essential.
Medication and Comorbidity Data
Incomplete medication information prevented comprehensive analysis of medication effects. While medication-naive subsample showed consistent results, we cannot rule out medication influences. Similarly, comorbidity data varied across databases.
Clinical Implementation Challenges
Translation faces practical obstacles including cost and accessibility of neuroimaging, need for specialized training, lack of reimbursement mechanisms, requirement for simpler assessment tools, and integration with clinical workflows.
Intervention Specificity
While we propose phenotype-specific interventions, we have not yet demonstrated that matching treatments to phenotypes improves outcomes versus standard approaches. This requires randomized controlled trials.
Mechanism Uncertainty
While we propose mechanisms linking network flexibility to depression vulnerability, our observational data cannot definitively establish mechanistic pathways. Experimental manipulation studies are needed.
Follow-up Duration and Attrition
Follow-up periods varied (12–60 months) with 38% overall attrition. While attrition analysis suggests missing at random, longer follow-up with lower attrition would strengthen conclusions.
Future Research Directions
Several priorities emerge from our findings:
Intervention Studies
Testing whether approaches aimed at enhancing network flexibility prevent depression onset or improve treatment outcomes would provide crucial evidence for clinical utility. Candidates include cognitive training, mindfulness interventions, and neurofeedback.
Developmental Studies
Examining how network flexibility patterns emerge and change across the lifespan could identify sensitive periods for intervention and illuminate factors promoting adaptive network development.
Mechanistic Studies
Investigating molecular and cellular processes underlying network flexibility differences could reveal additional intervention targets and enhance understanding of biological bases of individual differences.
Implementation Research
Developing simplified assessment tools suitable for clinical deployment could accelerate translation. Behavioral proxies, physiological measures, or brief computerized assessments could enable scalable screening.
Cross-Diagnostic Studies
Examining network flexibility patterns in other mental health conditions could test specificity of findings and explore transdiagnostic applications.
Conclusions
This investigation provides robust evidence that dynamic brain network flexibility during emotional challenges represents an important predictor of depression vulnerability and resilience, pending external validation. The identification of four distinct, stable phenotypes advances understanding of individual differences in emotional functioning and offers a framework for personalized risk assessment.
Our findings demonstrate that network flexibility measures predict depression onset with superior accuracy compared to traditional clinical assessments, suggesting potential value for augmenting current risk stratification approaches. Pending external validation, these neurobiological markers could enhance early identification of at-risk individuals and inform prevention strategies.
The stress-buffering effects of network flexibility provide mechanistic insight into resilience processes, with flexible individuals maintaining psychological stability under high stress while rigid individuals show vulnerability. This understanding suggests that interventions enhancing network flexibility could build durable resilience protecting against future stress exposure.
Important limitations include inability to establish definitive causality, uncertainty regarding state versus trait characteristics, and need for simplified assessment tools enabling clinical implementation. External validation in independent cohorts and intervention studies demonstrating clinical utility are essential next steps.
These findings represent a promising advance toward precision psychiatry, where brain-based biomarkers could complement traditional clinical assessment to enable more personalized, proactive approaches to mental healthcare. However, substantial additional research is required before clinical translation.
Data Sharing Statement
The processed network flexibility phenotype data and analysis code generated during this study will be made available from the first corresponding author, upon reasonable request and following approval of a data use agreement.
Raw neuroimaging data cannot be shared by the authors as we do not hold rights to redistribute these data. Researchers interested in raw neuroimaging data should contact the original database repositories.
Ethics Approval and Consent to Participate
This study involved secondary analysis of de-identified data from seven publicly available neuroimaging databases. All original databases obtained appropriate institutional ethics committee approval and informed consent from participants prior to data collection. Our secondary analysis protocol was reviewed and approved by the Ethics Committee of Zhongnan Hospital of Wuhan University.
All methods were carried out in accordance with the 1964 Helsinki Declaration and its subsequent revisions, as well as the ethical requirements of the institutional research committee. Data access agreements were signed with each database, and all data use complied with GDPR and international data protection standards.
Acknowledgments
The authors would like to thank all participants who took part in the original studies that contributed data to this investigation.
Author Contributions
All authors made a significant contribution to the work reported, whether that is in the conception, study design, execution, acquisition of data, analysis and interpretation, or in all these areas; took part in drafting, revising or critically reviewing the article; gave final approval of the version to be published; have agreed on the journal to which the article has been submitted; and agree to be accountable for all aspects of the work.
Funding
This work was supported by Discipline cultivation project of Zhongnan Hospital of Wuhan University (department of neurological rehabilitation) (ZNXKPY2023021); Clinical nursing research project of Zhongnan Hospital of Wuhan University in 2023 (LCHLYJ202302).
Disclosure
The authors declare that they have no competing interests in this work.
References
1. World Health Organization. Depression and Other Common Mental Disorders: Global Health Estimates. Geneva: World Health Organization; 2017.
2. GBD 2019 Mental Disorders Collaborators. Global, regional, and national burden of 12 mental disorders in 204 countries and territories, 1990-2019: a systematic analysis for the Global Burden of Disease Study 2019. Lancet Psychiatry. 2022;9(2):137–150. doi:10.1016/S2215-0366(21)00395-3
3. Cuijpers P, Karyotaki E, Eckshtain D, et al. Psychotherapy for depression across different age groups: a systematic review and meta-analysis. JAMA Psych. 2020;77(7):694–702. doi:10.1001/jamapsychiatry.2020.0164
4. Rush AJ, Trivedi MH, Wisniewski SR, et al. Acute and longer-term outcomes in depressed outpatients requiring one or several treatment steps: a STAR*D report. Am J Psych. 2006;163(11):1905–1917. doi:10.1176/ajp.2006.163.11.1905
5. Halfin A. Depression: the benefits of early and appropriate treatment. Am J Manag Care. 2007;13(4 Suppl):S92–97.
6. Kessler RC, van Loo HM, Wardenaar KJ, et al. Testing a machine-learning algorithm to predict the persistence and severity of major depressive disorder from baseline self-reports. Mol Psych. 2016;21(10):1366–1371. doi:10.1038/mp.2015.198
7. Iniesta R, Stahl D, McGuffin P. Machine learning, statistical learning and the future of biological research in psychiatry. Psychol Med. 2016;46(12):2455–2465. doi:10.1017/S0033291716001367
8. Schmaal L, Pozzi E, Ho TC, et al. ENIGMA MDD: seven years of global neuroimaging studies of major depression through worldwide data sharing. Transl Psych. 2020;10(1):172. doi:10.1038/s41398-020-0842-6
9. Howard DM, Adams MJ, Clarke TK, et al. Genome-wide meta-analysis of depression identifies 102 independent variants and highlights the importance of the prefrontal brain regions. Nat Neurosci. 2019;22(3):343–352. doi:10.1038/s41593-018-0326-7
10. Huys QJ, Maia TV, Frank MJ. Computational psychiatry as a bridge from neuroscience to clinical applications. Nat Neurosci. 2016;19(3):404–413. doi:10.1038/nn.4238
11. Friston KJ, Stephan KE, Montague R, Dolan RJ. Computational psychiatry: the brain as a phantastic organ. Lancet Psych. 2014;1(2):148–158. doi:10.1016/S2215-0366(14)70275-5
12. Bzdok D, Meyer-Lindenberg A. Machine learning for precision psychiatry: opportunities and challenges. Biol Psychiatry Cogn Neurosci Neuroimag. 2018;3(3):223–230. doi:10.1016/j.bpsc.2017.11.007
13. Dwyer DB, Falkai P, Koutsouleris N. Machine learning approaches for clinical psychology and psychiatry. Annu Rev Clin Psychol. 2018;14:91–118. doi:10.1146/annurev-clinpsy-032816-045037
14. Bassett DS, Sporns O. Network neuroscience. Nat Neurosci. 2017;20(3):353–364. doi:10.1038/nn.4502
15. Fornito A, Zalesky A, Breakspear M. The connectomics of brain disorders. Nat Rev Neurosci. 2015;16(3):159–172. doi:10.1038/nrn3901
16. Bullmore E, Sporns O. The economy of brain network organization. Nat Rev Neurosci. 2012;13(5):336–349. doi:10.1038/nrn3214
17. Avena-Koenigsberger A, Misic B, Sporns O. Communication dynamics in complex brain networks. Nat Rev Neurosci. 2018;19(1):17–33. doi:10.1038/nrn.2017.149
18. Cole MW, Ito T, Bassett DS, Schultz DH. Activity flow over resting-state networks shapes cognitive task activations. Nat Neurosci. 2016;19(12):1718–1726. doi:10.1038/nn.4406
19. Braun U, Schäfer A, Walter H, et al. Dynamic reconfiguration of frontal brain networks during executive cognition in humans. Proc Natl Acad Sci U S A. 2015;112(37):11678–11683. doi:10.1073/pnas.1422487112
20. Menon V. Large-scale brain networks and psychopathology: a unifying triple network model. Trends Cognit Sci. 2011;15(10):483–506. doi:10.1016/j.tics.2011.08.003
21. Etkin A, Büchel C, Gross JJ. The neural bases of emotion regulation. Nat Rev Neurosci. 2015;16(11):693–700. doi:10.1038/nrn4044
22. Kalisch R, Baker DG, Basten U, et al. The resilience framework as a strategy to combat stress-related disorders. Nat Hum Behav. 2017;1(11):784–790. doi:10.1038/s41562-017-0200-8
23. Southwick SM, Bonanno GA, Masten AS, Panter-Brick C, Yehuda R. Resilience definitions, theory, and challenges: interdisciplinary perspectives. Eur J Psychotraumatol. 2014;5(1):25338. doi:10.3402/ejpt.v5.25338
24. Kashdan TB, Rottenberg J. Psychological flexibility as a fundamental aspect of health. Clin Psychol Rev. 2010;30(7):865–878. doi:10.1016/j.cpr.2010.03.001
25. Bonanno GA, Burton CL. Regulatory flexibility: an individual differences perspective on coping and emotion regulation. Perspect Psychol Sci. 2013;8(6):591–612. doi:10.1177/1745691613504116
26. Koster EH, De lissnyder E, Derakshan N, De Raedt R. Understanding depressive rumination from a cognitive science perspective: the impaired disengagement hypothesis. Clin Psychol Rev. 2011;31(1):138–145. doi:10.1016/j.cpr.2010.08.005
27. Gotlib IH, Joormann J. Cognition and depression: current status and future directions. Annu Rev Clin Psychol. 2010;6:285–312. doi:10.1146/annurev.clinpsy.121208.131305
28. Sudlow C, Gallacher J, Allen N, et al. UK biobank: an open access resource for identifying the causes of a wide range of complex diseases of middle and old age. PLoS Med. 2015;12(3):e1001779. doi:10.1371/journal.pmed.1001779
29. Van Essen DC, Smith SM, Barch DM, Behrens TE, Yacoub E, Ugurbil K. The WU-Minn Human Connectome Project: an overview. NeuroImage. 2013;80:62–79. doi:10.1016/j.neuroimage.2013.05.041
30. Weiner MW, Veitch DP, Aisen PS, et al. 2014 update of the alzheimer’s disease neuroimaging Initiative: a review of papers published since its inception. Alzheimers Dement. 2015;11(6):e1–120. doi:10.1016/j.jalz.2014.11.001
31. Di Martino A, Yan CG, Li Q, et al. The autism brain imaging data exchange: towards a large-scale evaluation of the intrinsic brain architecture in autism. Mol Psychiatry. 2014;19(6):659–667. doi:10.1038/mp.2013.78
32. Poldrack RA, Barch DM, Mitchell JP, et al. Toward open sharing of task-based fMRI data: the OpenfMRI project. Front Neuroinfo. 2013;7:12. doi:10.3389/fninf.2013.00012
33. Kennedy DN, Haselgrove C, Hodge SM, Rane PS, Makris N, Frazier JA. CANDIShare: a resource for pediatric neuroimaging data. Neuroinformatics. 2012;10(3):319–322. doi:10.1007/s12021-011-9133-y
34. Scott A, Courtney W, Wood D, et al. COINS: an innovative informatics and neuroimaging tool suite built for large heterogeneous datasets. Front Neuroinfo. 2011;5:33. doi:10.3389/fninf.2011.00033
35. Nasreddine ZS, Phillips NA, Bédirian V, et al. The montreal cognitive assessment, MoCA: a brief screening tool for mild cognitive impairment. J Am Geriatr Soc. 2005;53(4):695–699. doi:10.1111/j.1532-5415.2005.53221.x
36. Lang PJ, Bradley MM, Cuthbert BN. International Affective Picture System (IAPS): Technical Manual and Affective Ratings. Vol. 1. NIMH Center Study Emot Atten; 2008:39–58.
37. Buhle JT, Silvers JA, Wager TD, et al. Cognitive reappraisal of emotion: a meta-analysis of human neuroimaging studies. Cereb Cortex. 2014;24(11):2981–2990. doi:10.1093/cercor/bht154
38. Etkin A, Egner T, Kalisch R. Emotional processing in anterior cingulate and medial prefrontal cortex. Trends Cognit Sci. 2011;15(2):85–93. doi:10.1016/j.tics.2010.11.004
39. Esteban O, Markiewicz CJ, Blair RW, et al. fMRIPrep: a robust preprocessing pipeline for functional MRI. Nat Methods. 2019;16(1):111–116. doi:10.1038/s41592-018-0235-4
40. Power JD, Mitra A, Laumann TO, Snyder AZ, Schlaggar BL, Petersen SE. Methods to detect, characterize, and remove motion artifact in resting state fMRI. NeuroImage. 2014;84:320–341. doi:10.1016/j.neuroimage.2013.08.048
41. Fortin JP, Cullen N, Sheline YI, et al. Harmonization of cortical thickness measurements across scanners and sites. NeuroImage. 2018;167:104–120. doi:10.1016/j.neuroimage.2017.11.024
42. First MB, Williams JBW, Karg RS, Spitzer RL. Structured Clinical Interview for DSM-5—research Version (SCID-5 for DSM-5, Research Version; SCID-5-RV). American Psychiatric Association. 2015.
43. Schaefer A, Kong R, Gordon EM, et al. Local-global parcellation of the human cerebral cortex from intrinsic functional connectivity MRI. Cereb Cortex. 2018;28(9):3095–3114. doi:10.1093/cercor/bhx179
44. Yeo BT, Krienen FM, Sepulcre J, et al. The organization of the human cerebral cortex estimated by intrinsic functional connectivity. J Neurophysiol. 2011;106(3):1125–1165. doi:10.1152/jn.00338.2011
45. Preti MG, Bolton TA, Van De Ville D. The dynamic functional connectome: state-of-the-art and perspectives. NeuroImage. 2017;160:41–54. doi:10.1016/j.neuroimage.2016.12.061
46. Bassett DS, Wymbs NF, Porter MA, Mucha PJ, Carlson JM, Grafton ST. Dynamic reconfiguration of human brain networks during learning. Proc Natl Acad Sci U S A. 2011;108(18):7641–7646. doi:10.1073/pnas.1018985108
47. Bertolero MA, Yeo BT, D’Esposito M. The modular and integrative functional architecture of the human brain. Proc Natl Acad Sci U S A. 2015;112(49):E6798–E6807. doi:10.1073/pnas.1510619112
48. Newman ME. Modularity and community structure in networks. Proc Natl Acad Sci U S A. 2006;103(23):8577–8582. doi:10.1073/pnas.0601602103
49. Beck AT, Steer RA, Brown GK. Beck Depression Inventory (BDI-II). Psychological Corporation; 1996.
50. Montgomery SA, Åsberg M. A new depression scale designed to be sensitive to change. Br J Psychiatry. 1979;134(4):382–389. doi:10.1192/bjp.134.4.382
51. Gratz KL, Roemer L. Multidimensional assessment of emotion regulation and dysregulation: development, factor structure, and initial validation of the difficulties in emotion regulation scale. J Psychopathol Behav Assess. 2004;26(1):41–54. doi:10.1023/B:JOBA.0000007455.08539.94
52. Gross JJ, John OP. Individual differences in two emotion regulation processes: implications for affect, relationships, and well-being. J Pers Soc Psychol. 2003;85(2):348–362. doi:10.1037/0022-3514.85.2.348
53. Brown GW, Harris TO. Social Origins of Depression: A Study of Psychiatric Disorder in Women. Tavistock; 1978.
54. Cohen S, Kamarck T, Mermelstein R. A global measure of perceived stress. J Health Soc Behav. 1983;24(4):385–396. doi:10.2307/2136404
55. Nolen-Hoeksema S, Morrow J. A prospective study of depression and posttraumatic stress symptoms after a natural disaster: the 1989 Loma Prieta earthquake. J Pers Soc Psychol. 1991;61(1):115–121. doi:10.1037/0022-3514.61.1.115
56. Dennis JP, Vander Wal JS. The cognitive flexibility inventory: instrument development and estimates of reliability and validity. Cogn Ther Res. 2010;34(3):241–253. doi:10.1007/s10608-009-9276-4
57. Baer RA, Smith GT, Hopkins J, Krietemeyer J, Toney L. Using self-report assessment methods to explore facets of mindfulness. Assessment. 2006;13(1):27–45. doi:10.1177/1073191105283504
58. Tibshirani R, Walther G, Hastie T. Estimating the number of clusters in a data set via the gap statistic. J R Stat Soc Series B Stat Methodol. 2001;63(2):411–423. doi:10.1111/1467-9868.00293
59. Chekroud AM, Zotti RJ, Shehzad Z, et al. Cross-trial prediction of treatment outcome in depression: a machine learning approach. Lancet Psychiatry. 2016;3(3):243–250. doi:10.1016/S2215-0366(15)00471-X
60. Koutsouleris N, Kambeitz-Ilankovic L, Ruhrmann S, et al. Prediction models of functional outcomes for individuals in the clinical high-risk state for psychosis or with recent-onset depression: a multimodal, multisite machine learning analysis. JAMA Psychiatry. 2018;75(11):1156–1172. doi:10.1001/jamapsychiatry.2018.2165
61. Lundberg SM, Lee SI. A unified approach to interpreting model predictions. Adv Neural Inf Process Syst. 2017;30:4765–4774.
62. Benjamin DJ, Berger JO, Johannesson M, et al. Redefine statistical significance. Nat Hum Behav. 2018;2(1):6–10. doi:10.1038/s41562-017-0189-z
63. Rosseel Y. lavaan: an R package for structural equation modeling. J Stat Softw. 2012;48(2):1–36. doi:10.18637/jss.v048.i02
64. Tedeschi RG, Calhoun LG. Posttraumatic growth: conceptual foundations and empirical evidence. Psychol Inq. 2004;15(1):1–18. doi:10.1207/s15327965pli1501_01
65. Kaiser RH, Andrews-Hanna JR, Wager TD, Pizzagalli DA. Large-scale network dysfunction in major depressive disorder: a meta-analysis of resting-state functional connectivity. JAMA Psychiatry. 2015;72(6):603–611. doi:10.1001/jamapsychiatry.2015.0071
66. Drysdale AT, Grosenick L, Downar J, et al. Resting-state connectivity biomarkers define neurophysiological subtypes of depression. Nat Med. 2017;23(1):28–38. doi:10.1038/nm.4246
67. Strawbridge R, Young AH, Cleare AJ. Biomarkers for depression: recent insights, current challenges and future prospects. Neuropsychiatr Dis Treat. 2017;13:1245–1262. doi:10.2147/NDT.S114542
68. Flint J, Kendler KS. The genetics of major depression. Neuron. 2014;81(3):484–503. doi:10.1016/j.neuron.2014.01.027
69. Monroe SM, Simons AD. Diathesis-stress theories in the context of life stress research: implications for the depressive disorders. Psychol Bull. 1991;110(3):406–425. doi:10.1037/0033-2909.110.3.406
70. Hammen C. Stress and depression. Annu Rev Clin Psychol. 2005;1:293–319. doi:10.1146/annurev.clinpsy.1.102803.143938
71. Poldrack RA, Monahan J, Imrey PB, et al. Predicting violent behavior: what can neuroscience add? Trends Cognit Sci. 2018;22(2):111–123. doi:10.1016/j.tics.2017.11.003
72. Arnsten AF. Stress signalling pathways that impair prefrontal cortex structure and function. Nat Rev Neurosci. 2009;10(6):410–422. doi:10.1038/nrn2648
73. McEwen BS, Gianaros PJ. Stress- and allostasis-induced brain plasticity. Annu Rev Med. 2011;62:431–445. doi:10.1146/annurev-med-052209-100430
74. Keshavan MS, Vinogradov S, Rumsey J, Sherrill J, Wagner A. Cognitive training in mental disorders: update and future directions. Am J Psychiatry. 2014;171(5):510–522. doi:10.1176/appi.ajp.2013.13081075
75. Creswell JD. Mindfulness interventions. Annu Rev Psychol. 2017;68:491–516. doi:10.1146/annurev-psych-042716-051139
76. Young KD, Siegle GJ, Zotev V, et al. Randomized clinical trial of real-time fMRI amygdala neurofeedback for major depressive disorder: effects on symptoms and autobiographical memory recall. Am J Psychiatry. 2017;174(8):748–755. doi:10.1176/appi.ajp.2017.16060637
77. Linehan MM. DBT Skills Training Manual.
 © 2025 The Author(s). This work is published and licensed by Dove Medical Press Limited. The
full terms of this license are available at https://www.dovepress.com/terms
and incorporate the Creative Commons Attribution
- Non Commercial (unported, 4.0) License.
By accessing the work you hereby accept the Terms. Non-commercial uses of the work are permitted
without any further permission from Dove Medical Press Limited, provided the work is properly
attributed. For permission for commercial use of this work, please see paragraphs 4.2 and 5 of our Terms.
© 2025 The Author(s). This work is published and licensed by Dove Medical Press Limited. The
full terms of this license are available at https://www.dovepress.com/terms
and incorporate the Creative Commons Attribution
- Non Commercial (unported, 4.0) License.
By accessing the work you hereby accept the Terms. Non-commercial uses of the work are permitted
without any further permission from Dove Medical Press Limited, provided the work is properly
attributed. For permission for commercial use of this work, please see paragraphs 4.2 and 5 of our Terms.
Recommended articles
A Predictive Machine Learning Tool for Asthma Exacerbations: Results from a 12-Week, Open-Label Study Using an Electronic Multi-Dose Dry Powder Inhaler with Integrated Sensors

Lugogo NL, DePietro M, Reich M, Merchant R, Chrystyn H, Pleasants R, Granovsky L, Li T, Hill T, Brown RW, Safioti G
Journal of Asthma and Allergy 2022, 15:1623-1637
Published Date: 11 November 2022
Immune Cell Infiltration Analysis Based on Bioinformatics Reveals Novel Biomarkers of Coronary Artery Disease
He T, Muhetaer M, Wu J, Wan J, Hu Y, Zhang T, Wang Y, Wang Q, Cai H, Lu Z
Journal of Inflammation Research 2023, 16:3169-3184
Published Date: 26 July 2023
Neural Biomarkers for Identifying Atopic Dermatitis and Assessing Acupuncture Treatment Response Using Resting-State fMRI
Lee IS, Yoon DE, Lee S, Kang JH, Chae Y, Park HJ, Kim J
Journal of Asthma and Allergy 2024, 17:383-389
Published Date: 18 April 2024
Machine Learning-Based Predictive Modeling of Diabetic Nephropathy in Type 2 Diabetes Using Integrated Biomarkers: A Single-Center Retrospective Study
Zhu Y, Zhang Y, Yang M, Tang N, Liu L, Wu J, Yang Y
Diabetes, Metabolic Syndrome and Obesity 2024, 17:1987-1997
Published Date: 10 May 2024
Artificial Intelligence in the Management of Asthma: A Review of a New Frontier in Patient Care
Tan LD, Nguyen N, Lopez E, Peverini D, Shedd M, Alismail A, Nguyen HB
Journal of Asthma and Allergy 2025, 18:1179-1191
Published Date: 16 August 2025