
Back to Journals » International Journal of Chronic Obstructive Pulmonary Disease » Volume 21
Divergent Trajectories and Risk Factor Attribution of Chronic Obstructive Pulmonary Disease Burden in China and the United States, 1990–2023: An Age-Period-Cohort Analysis with Projections to 2035 Based on the Global Burden of Disease Study 2023
Authors Deng Y, Zhu Y  , Chen C, Xu W, Yao W
Received 14 November 2025
Accepted for publication 21 February 2026
Published 13 March 2026 Volume 2026:21 581670
DOI https://doi.org/10.2147/COPD.S581670
Checked for plagiarism Yes
Review by Single anonymous peer review
Peer reviewer comments 3
Editor who approved publication: Dr Jill Ohar
Yunfei Deng,1 Yimin Zhu,2 Chong Chen,3 Wenhui Xu,2 Wenbing Yao1
1International Pharmaceutical Business School, China Pharmaceutical University, Nanjing, Jiangsu, 211198, People’s Republic of China; 2Department of Respiration, the Second Affiliated Hospital of Nanjing University of Traditional Chinese Medicine (Jiangsu Second Hospital of Traditional Chinese Medicine), Nanjing, Jiangsu, 210017, People’s Republic of China; 3Nanjing Municipal Medical Insurance Bureau, Nanjing, Jiangsu, 210017, People’s Republic of China
Correspondence: Wenbing Yao, International Pharmaceutical Business School, China Pharmaceutical University, Nanjing, Jiangsu, 211198, People’s Republic of China, Email [email protected]
Background: Chronic obstructive pulmonary disease (COPD) remains a leading cause of global mortality. China and the United States, the world’s two largest economies accounting for 40% of global COPD burden, lack comprehensive comparative analyses of long-term trends and risk factor attribution.
Objective: This study aimed to compare COPD burden trends, decompose age-period-cohort effects, quantify risk factor contributions, and project future trajectories in China and the United States from 1990 to 2023 with forecasts to 2035.
Methods: We analyzed Global Burden of Disease Study 2023 data for China and the United States, examining incidence, prevalence, mortality, and disability-adjusted life years (DALYs) stratified by sex and 17 age groups. Joinpoint regression identified temporal inflection points. Age-period-cohort models decomposed burden into independent effects. Risk factor attribution analyzed eight major exposures. Bayesian methods projected burden to 2035.
Results: China demonstrated remarkable declines in age-standardized mortality (58.68% decrease to 46.60 per 100,000) and DALY rates (61.12% decrease to 777.86 per 100,000), with dramatic risk factor reductions: particulate matter pollution declined 82.21%, smoking 68.48%. Conversely, the United States exhibited increasing age-standardized mortality (8.90% increase to 28.89 per 100,000), with female mortality rising 45.64% and smoking-attributable burden declining only 14.09%. Period effects deteriorated in the United States (relative risk: 0.67 to 1.34) while improving in China (1.20 to 0.83). Projections indicated Chinese deaths would surge 135.9% by 2035 despite declining age-standardized rates, while American deaths would increase 30.1% with rising age-standardized rates.
Conclusion: Substantial COPD burden reductions are achievable through comprehensive risk factor control as demonstrated by China’s success, while persistent deterioration in the United States highlights critical prevention gaps requiring urgent intervention to avert projected burden escalation.
Keywords: chronic obstructive pulmonary disease, global burden of disease, age-period-cohort analysis, risk factors, epidemiological trends
Introduction
Chronic obstructive pulmonary disease (COPD) represents one of the most pressing global health challenges, ranking as the third leading cause of death worldwide and affecting over 400 million individuals.1 The disease imposes a staggering economic burden, projected to cost $4.326 trillion between 2020 and 2050, equivalent to 0.111% annual tax on global GDP.2 Despite therapeutic advances and public health initiatives over three decades, COPD continues exacting enormous tolls, with 212.3 million prevalent cases and 3.3 million deaths reported in 2019.3 The burden is particularly pronounced in low- and middle-income countries, where 95% of cases remain undiagnosed and access to interventions is severely limited.4 This persistent burden, coupled with demographic shifts and evolving risk factor profiles, underscores urgent needs for comprehensive epidemiological analyses to inform targeted prevention strategies.
Substantial progress has been made in understanding COPD epidemiology. Global Burden of Disease (GBD) studies documented declining age-standardized mortality rates, with global reductions of 41.7% between 1990 and 2019.5 Recent genetic studies identified variants associated with lung function and COPD susceptibility, enhancing understanding of disease mechanisms.6 Risk factor attribution reveals smoking remains the predominant contributor globally, accounting for 46.0% of disability-adjusted life years (DALYs), followed by ambient particulate matter pollution (20.7%) and occupational exposures (15.6%).3 However, risk factor contributions vary dramatically across countries, with household air pollution from solid fuels disproportionately affecting low- and middle-income nations while tobacco smoking dominates high-income countries. Gender-specific analyses uncovered striking disparities, with COPD prevalence among women projected to increase while male prevalence decreases, possibly reflecting slower tobacco reduction and greater exposure to household air pollution from biomass fuel combustion (eg, wood, crop residues, and coal used for cooking and heating) among women.1 Regional studies documented dramatic improvements in certain countries, with China experiencing 68% decline in age-standardized mortality between 1990 and 2021,7 while other nations witnessed concerning upward trends, particularly among females.8
Despite these advances, critical knowledge gaps limit our ability to develop effective, geographically tailored interventions. First, while most studies focused on overall trends, comprehensive age-stratified analyses examining burden shifts across the entire life course remain scarce, particularly for understanding paradoxical patterns in different age groups. Second, the complex interplay between age, period, and cohort effects has not been adequately disentangled, leaving uncertainty about whether trends reflect true epidemiological changes or demographic shifts. Third, direct comparative analyses between high-income and middle-income countries with contrasting healthcare systems and risk factor profiles are lacking, limiting understanding of how socioeconomic contexts influence disease trajectories. Fourth, systematic examination of differential risk factor contributions—particularly smoking, air pollution, and occupational exposures—between nations with divergent trends remains absent. Fifth, while projections suggest continued increases in absolute burden due to population aging,9 quantitative forecasts incorporating age-period-cohort dynamics through 2035 remain absent for major affected nations.10 Finally, the stark disparity between China and the United States—the world’s two largest economies collectively accounting for approximately 40% of global COPD burden with fundamentally different trajectories—has not been systematically examined to identify modifiable factors underlying these divergent patterns.11
To address these gaps, we conducted comprehensive analysis of COPD burden in China and the United States from 1990 to 2023, with projections to 2035, using GBD 2023 data. We employed joinpoint regression to identify temporal inflection points, age-period-cohort modeling to decompose independent contributions of age, period, and birth cohort effects, and risk factor attribution analysis to quantify contributions of eight major exposures including smoking, particulate matter pollution, and occupational factors. Bayesian age-period-cohort methods generated future projections. By stratifying analyses by sex and detailed age groups across the adult life span, we characterized heterogeneous patterns of disease burden evolution and identified critical demographic and epidemiological transitions. This comparative approach between two nations with the highest absolute COPD burdens but markedly different trajectories provides unique insights into effectiveness of different public health strategies and healthcare system responses, with implications for global COPD prevention and control efforts.
Materials and Methods
Data Source and Study Design
This retrospective observational study utilized data from the Global Burden of Disease Study 2023 (GBD 2023), accessed through the Institute for Health Metrics and Evaluation (IHME) database (http://ghdx.healthdata.org/gbd-results-tool)12. The GBD 2023 provides comprehensive estimates of mortality, morbidity, and disability for 292 causes of death across 204 countries and territories from 1990 to 2023. For this analysis, we extracted data on chronic obstructive pulmonary disease (COPD), defined according to the International Classification of Diseases codes J41-J42.4 and J43-J44.9. The study focused on comparing disease burden trends between China and the United States of America over the 34-year period from 1990 to 2023. The study was conducted in accordance with the principles of the Declaration of Helsinki and reported following the Transparent Reporting of a multivariable prediction model for Individual Prognosis or Diagnosis (TRIPOD) guidelines where applicable.
Outcome Measures
Four primary disease burden indicators were analyzed: incidence (new cases per 100,000 population), prevalence (existing cases per 100,000 population), mortality (deaths per 100,000 population), and disability-adjusted life years (DALYs, per 100,000 population). Age-standardized rates (ASR) were calculated using the GBD 2023 world standard population to enable valid comparisons across populations with different age structures. Age-specific rates were examined for 17 age groups ranging from 15 years to 95 years and above, with 5-year intervals. All metrics included point estimates with 95% uncertainty intervals (UI) derived from the GBD modeling framework. Data were stratified by sex (male, female, and both sexes combined), age group, year, and geographic location (China and United States of America).
Statistical Analysis
Temporal trend analyses were conducted using three complementary methodologies to provide comprehensive insights into disease burden evolution. First, the estimated annual percentage change (EAPC) was calculated using a log-linear regression model, where the natural logarithm of age-standardized rates was regressed on calendar year. The EAPC and its 95% confidence interval (CI) were derived from the regression coefficient, with statistical significance determined at p < 0.05. An EAPC significantly greater than zero indicated an increasing trend, while an EAPC significantly less than zero indicated a decreasing trend. Second, joinpoint regression analysis was performed using the Joinpoint Regression Program methodology implemented in R to identify significant changes in temporal trends. This approach fits a series of joined straight lines on a log scale to the trend data, with the joinpoints representing years when significant changes in the slope occurred. The annual percentage change (APC) for each segment between joinpoints and the average annual percentage change (AAPC) over the entire study period were calculated with 95% CI. A maximum of five joinpoints was allowed, and the optimal number was determined using the permutation test. Models were fitted using the logarithmic transformation with constant variance assumption. Statistical significance was assessed using Monte Carlo permutation tests (p < 0.05). Third, age-period-cohort (APC) analysis using the intrinsic estimator method was conducted to disentangle the independent effects of age, time period, and birth cohort on disease burden. The APC model decomposed the temporal trends into age effects (risk variation across different age groups), period effects (factors affecting all age groups simultaneously in specific time periods), and cohort effects (influences on individuals born in the same time period). The intrinsic estimator approach was applied to address the identification problem inherent in APC models. Relative risks (RR) with 95% CI were estimated for each age group (15–19 to 95+ years), time period (1994–1998 to 2019–2023 in 5-year intervals), and birth cohort (1899–1903 to 2004–2008). The analysis required age-specific data in 5-year intervals, with starting age of 15 years and ending age of 95 years, covering the period from 1994 to 2023.
Projection Analysis
Future disease burden projections to 2035 were generated using Bayesian age-period-cohort (BAPC) models. The BAPC approach integrates Bayesian inference with age-period-cohort methodology to account for parameter uncertainty in predictions. Models were stratified by sex and fitted separately for each disease burden indicator (incidence, prevalence, mortality, and DALYs). Population projections were obtained from GBD demographic estimates to calculate future age-standardized rates. The models incorporated age-specific rates for individuals aged 15 years and above, with predictions extending from 2024 to 2035. Both the number of cases and age-standardized rates were projected with 95% credible intervals. Model validation was performed using historical data from 1990 to 2018 to predict the period 2019–2023, and prediction accuracy was assessed by comparing predicted values with observed data.
Data Preprocessing and Quality Control
All analyses were preceded by rigorous data quality checks. Duplicate records were identified and removed. Age groups with any rate values less than or equal to zero were excluded from analysis to ensure logarithmic transformations in trend analyses were mathematically valid. The final dataset included 17 age-specific groups (15–19, 20–24, 25–29, 30–34, 35–39, 40–44, 45–49, 50–54, 55–59, 60–64, 65–69, 70–74, 75–79, 80–84, 85–89, 90–94, and 95 plus years), along with age-standardized and all-ages aggregated data. Variables were systematically checked for consistency, and measure names were standardized (eg, “DALYs (Disability-Adjusted Life Years)” was abbreviated to “DALYs” for clarity). Data spanning 34 consecutive years (1990–2023) were utilized to ensure adequate statistical power for temporal trend detection.
Results
Overall Trends in COPD Burden, 1990–2023
Between 1990 and 2023, COPD burden exhibited divergent patterns between China and the United States (Table 1, Figure 1). In China, incident cases doubled (98.32% increase to 4,440,422) while age-standardized incidence declined 28.23% (to 197.76 per 100,000). Prevalent cases increased 116.72% (to 52,490,910) with age-standardized prevalence decreasing 17.53% (to 2367.20 per 100,000). Deaths rose 46.86% (to 998,237) but age-standardized mortality plummeted 58.68% (to 46.60 per 100,000). DALYs increased 18.90% (to 17,281,133) while age-standardized DALY rates declined 61.12% (to 777.86 per 100,000). Conversely, the United States showed concurrent increases in both absolute numbers and age-standardized rates. Incident cases doubled (102.45% increase to 1,341,405) with age-standardized incidence rising 10.07% (to 236.37 per 100,000). Prevalent cases doubled (100.03% increase to 19,751,607) with age-standardized prevalence increasing 6.66% (to 3315.38 per 100,000). Deaths more than doubled (108.97% increase to 186,785) with age-standardized mortality rising 8.90% (to 28.89 per 100,000). DALYs increased 90.99% (to 4,395,947) with age-standardized rates rising 1.12% (to 719.09 per 100,000).
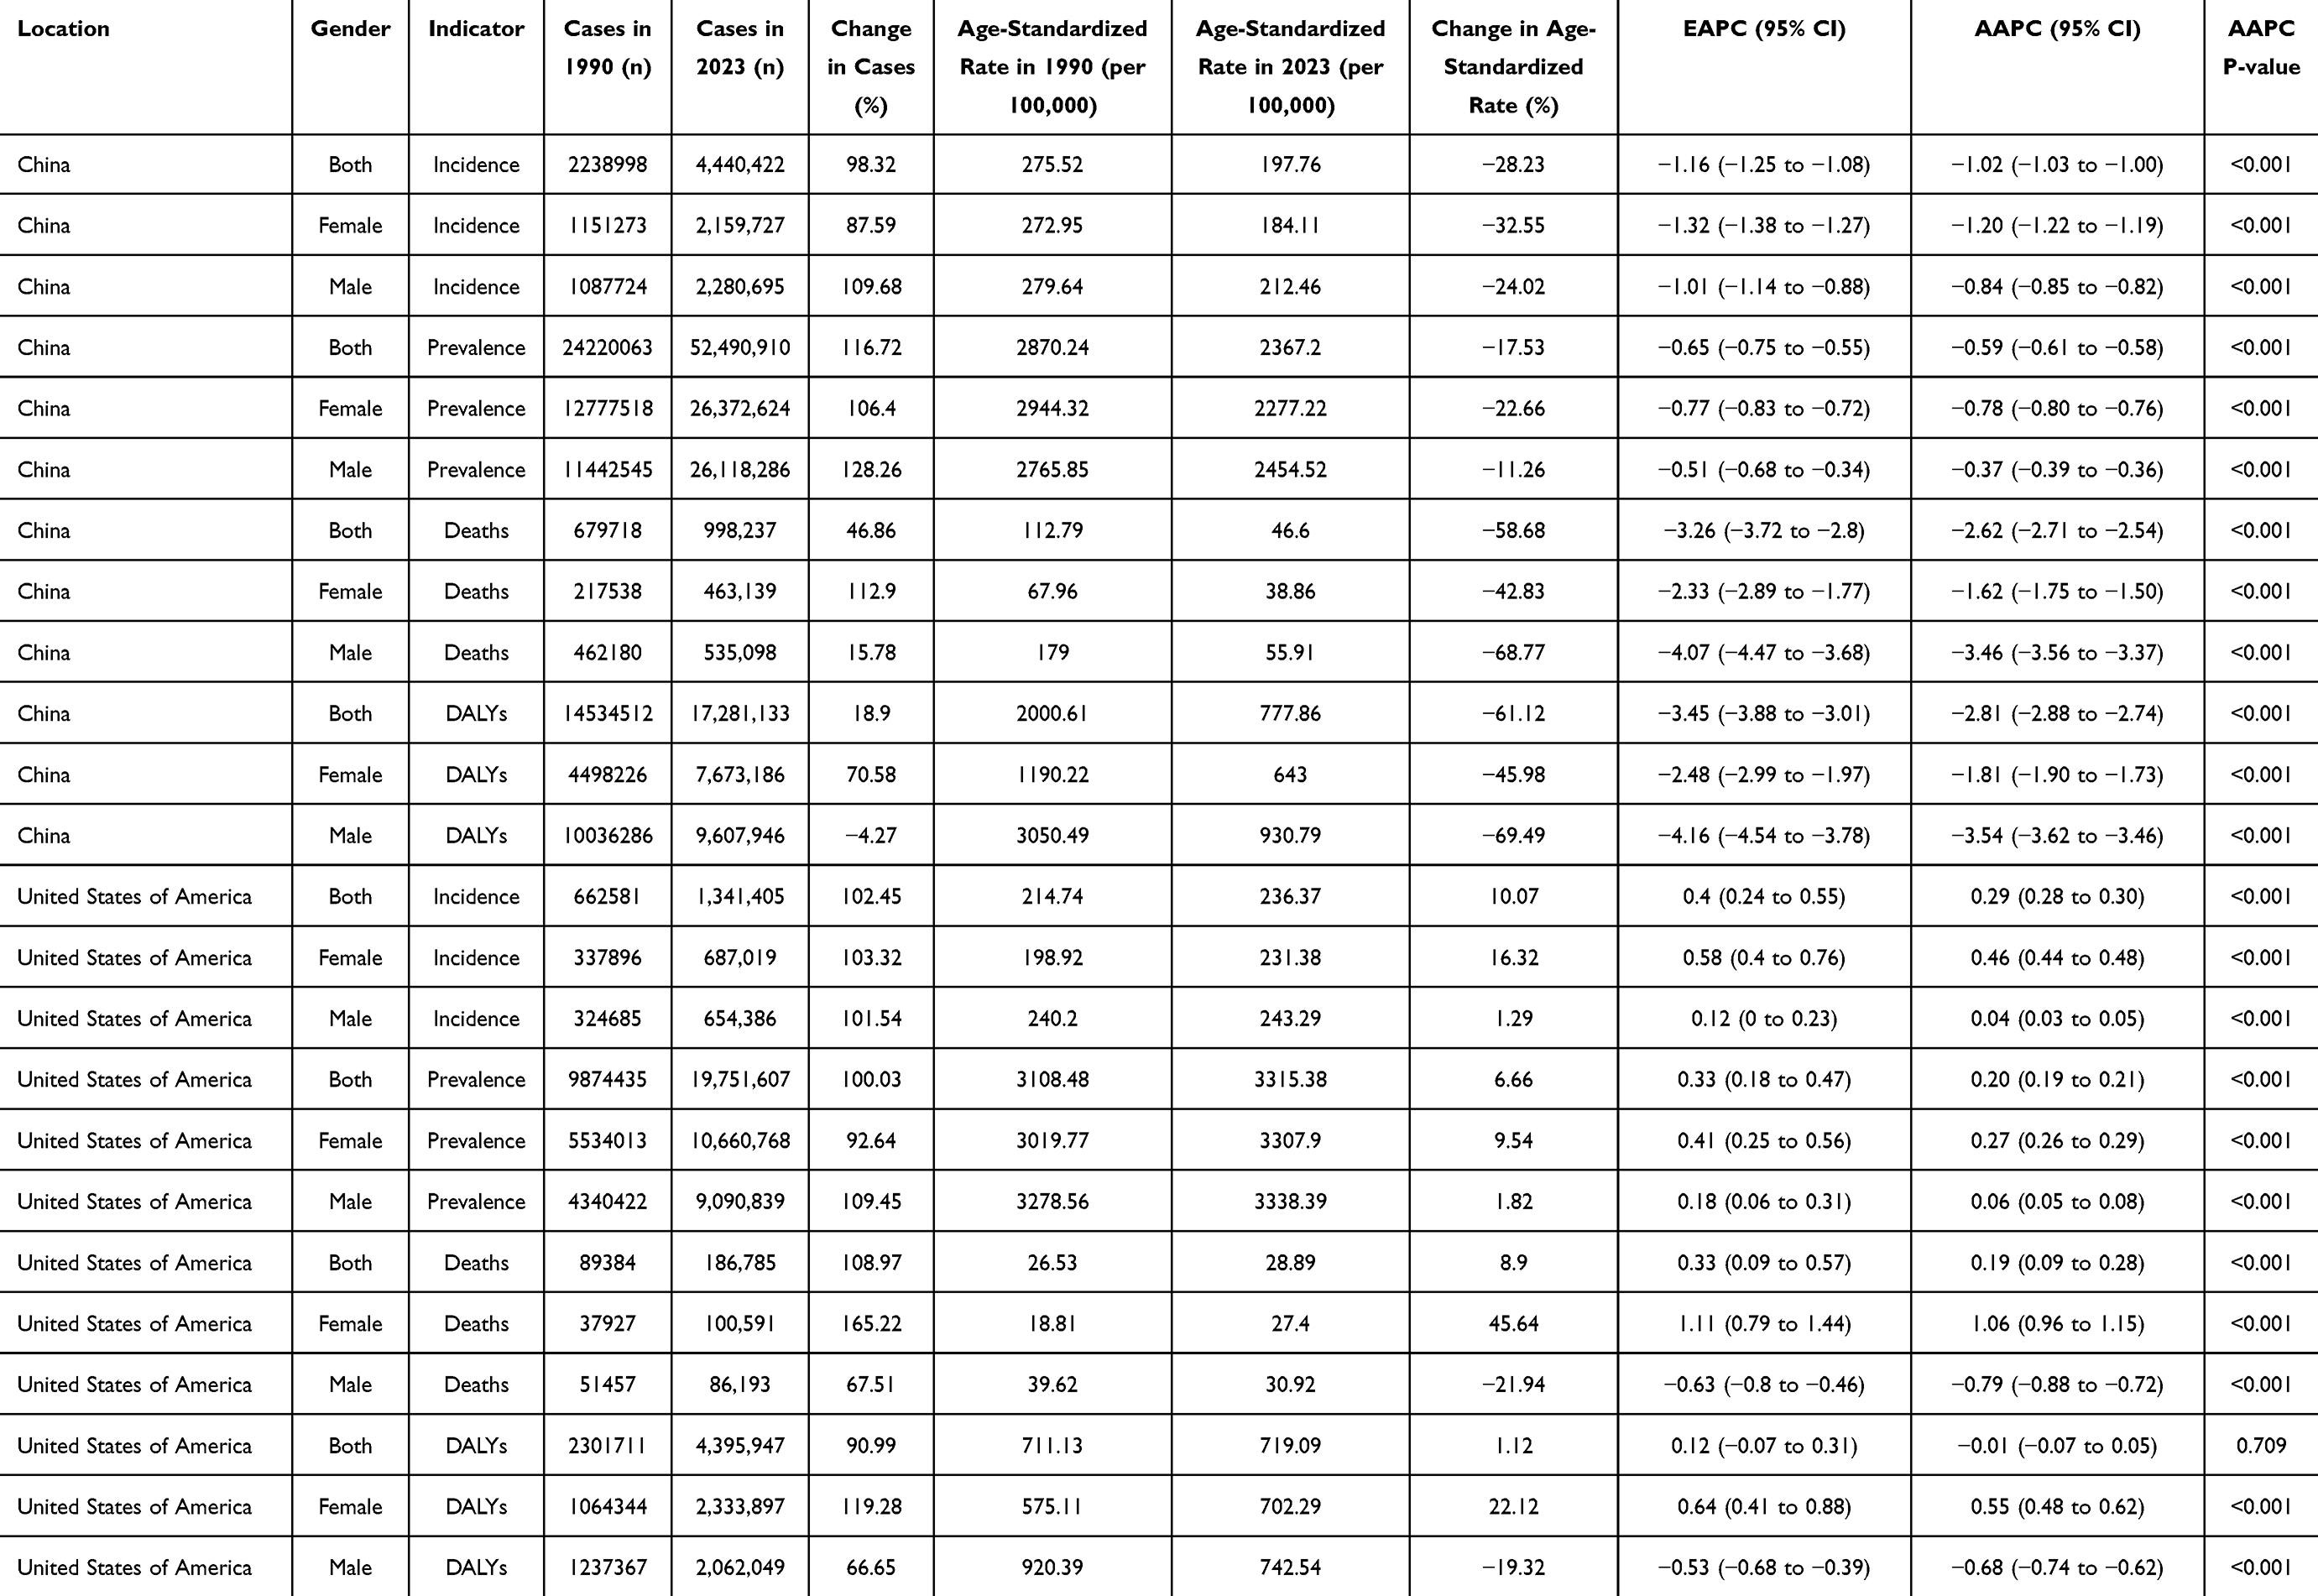 |
Table 1 Overall Trends and Percentage Changes in COPD Burden in China and the United States, 1990–2023 |
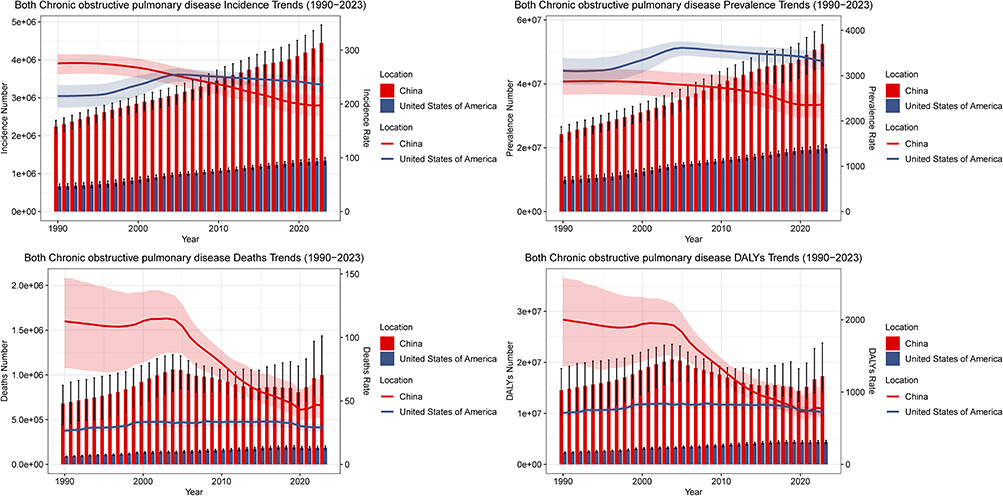 |
Figure 1 Temporal Trends in COPD Incidence, Prevalence, Mortality, and DALYs in China and the United States, 1990–2023 (Both Sexes Combined). This figure displays the temporal evolution of four key disease burden indicators for chronic obstructive pulmonary disease (COPD) in China (red) and the United States (blue) from 1990 to 2023, combining data for both sexes. Each panel presents a dual-axis visualization: the left y-axis and bar charts represent the absolute number of cases (incidence, prevalence, deaths) or DALYs, while the right y-axis and line graphs represent the corresponding age-standardized rates per 100,000 population. Error bars on the bar charts and shaded ribbons around the line graphs indicate 95% uncertainty intervals. |
Sex-stratified analyses revealed substantial disparities (Supplementary Figures 1–2). Chinese males experienced steeper declines in age-standardized mortality (68.77% decrease to 55.91 per 100,000) than females (42.83% decrease to 38.86 per 100,000), with DALY reductions of 69.49% versus 45.98%. In the United States, females exhibited concerning increases in age-standardized mortality (45.64% increase to 27.40 per 100,000) and DALYs (22.12% increase to 702.29 per 100,000), while males demonstrated improvements with mortality declining 21.94% (to 30.92 per 100,000) and DALYs decreasing 19.32% (to 742.54 per 100,000).
Joinpoint Regression Analysis of Temporal Trends
Joinpoint analysis revealed complex non-linear patterns (Figure 2, Supplementary Figures 3–4). In China, age-standardized incidence declined consistently (AAPC: −1.02%, 95% CI: −1.03 to −1.00, p < 0.001), steepest from 2011–2020 (APC: −1.73%). Prevalence showed modest decline (AAPC: −0.59%, p < 0.001) with notable reduction from 2015–2020 (APC: −2.12%) before recent upturn in 2020–2023 (APC: 0.28%). Mortality improved dramatically (AAPC: −2.62%, p < 0.001), with sharpest decline from 2017–2020 (APC: −6.43%) followed by concerning reversal in 2020–2023 (APC: 2.50%). DALYs declined substantially (AAPC: −2.81%, p < 0.001), accelerating from 2017–2020 (APC: −6.08%) before recent upturn in 2020–2023 (APC: 1.99%). The United States demonstrated contrasting patterns: incidence increased overall (AAPC: 0.29%, p < 0.001) with recent decline from 2020–2023 (APC: −0.78%). Prevalence increased modestly (AAPC: 0.20%, p < 0.001) with recent decline (APC: −1.06%). Mortality showed slight overall increase (AAPC: 0.19%, p < 0.001) with significant recent decline from 2017–2023 (APC: −2.72%). DALY rates remained stable (AAPC: −0.01%, p = 0.709) with recent decrease from 2017–2023 (APC: −2.28%).
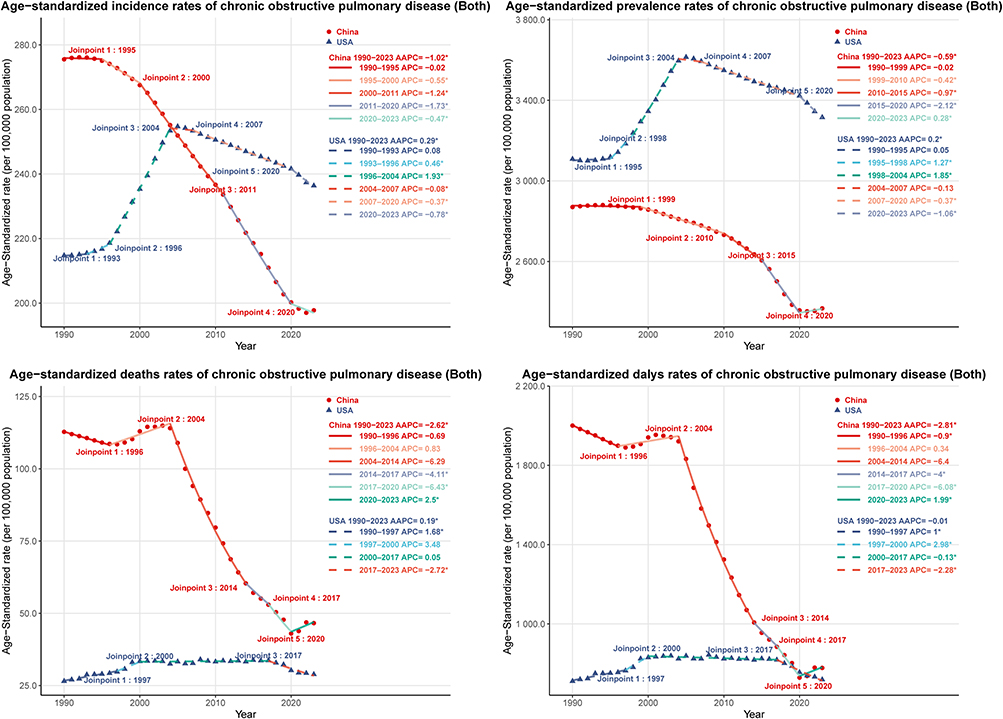 |
Figure 2 Joinpoint Regression Analysis of Age-Standardized COPD Burden in China and the United States, 1990–2023 (Both Sexes Combined). This figure presents the results of joinpoint regression analysis for age-standardized rates of COPD incidence, prevalence, mortality, and DALYs in China (solid lines and circles) and the United States (dashed lines and triangles) from 1990 to 2023, combining data for both sexes. Each panel corresponds to one disease burden indicator. Observed data points are overlaid on model-fitted segmented lines, with different colors representing different time segments identified by the joinpoint analysis. Vertical text annotations mark joinpoint years where significant changes in trends occurred. The legend provides the average annual percentage change (AAPC) for the entire period (1990–2023) and the annual percentage change (APC) for each segment, with asterisks (*) indicating statistical significance (p < 0.05). |
Sex-stratified analyses revealed marked disparities (Supplementary Figures 3–4). Chinese males exhibited steeper declining trends than females: incidence (AAPC: −1.20% vs −0.84%), prevalence (AAPC: −0.78% vs −0.37%), mortality (AAPC: −3.46% vs −1.62%), and DALYs (AAPC: −3.54% vs −1.81%). Both sexes showed concerning recent reversals from 2020–2023 in DALY rates (males: 1.26%, females: 2.65%). In the United States, females demonstrated significant increases in incidence (AAPC: 0.46% vs 0.04%), prevalence (AAPC: 0.27% vs 0.06%), mortality (AAPC: 1.06% vs −0.79%), and DALYs (AAPC: 0.55% vs −0.68%), with particularly pronounced mortality rises from 1990–2001 (APC: 3.79%).
Age-Specific Patterns of COPD Burden
Age-stratified analyses revealed profound heterogeneity (Table 2, Figure 3, Supplementary Figure 5). In China, younger groups (15–39 years) experienced dramatic declines in incidence cases (44.24–62.47% decrease) and rates (21.22–29.79% decrease, AAPC: −0.73% to −1.10%). Middle-aged groups (40–64 years) demonstrated substantial rate reductions: incidence declined 16.91–41.82% (AAPC: −0.57% to −1.66%), mortality decreased 73.16–75.31% (AAPC: −3.92% to −5.22%), and DALYs fell 65.38–70.81% (AAPC: −3.10% to −4.51%). Older groups (≥65 years) exhibited paradoxical patterns: while mortality (AAPC: −1.19% to −3.70%) and DALYs (AAPC: −1.14% to −3.69%) declined significantly, prevalence rates surged in the oldest groups—increasing 9.68% (ages 85–89), 27.08% (ages 90–94), and 50.93% (ages 95+), with absolute prevalence cases rising 585.31%, 1428.21%, and 2761.90%, respectively.
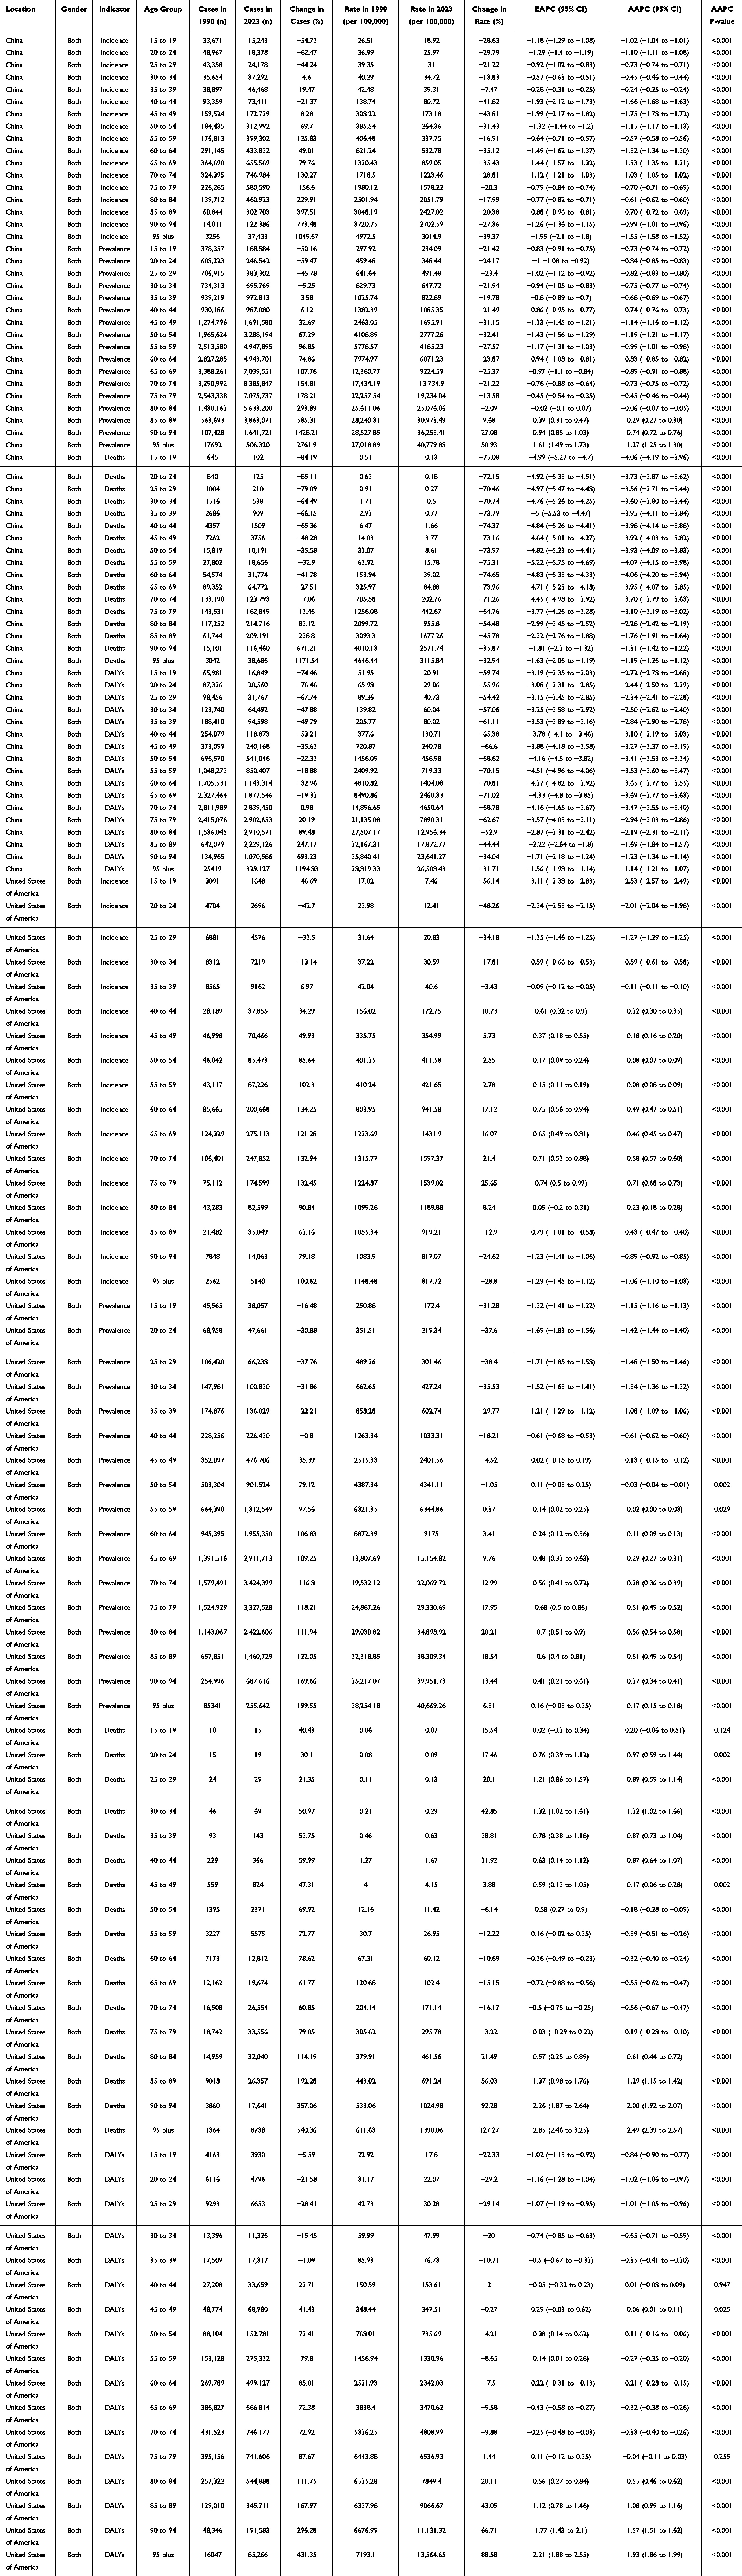 |
Table 2 Age-Specific Trends and Percentage Changes in COPD Burden in China and the United States, 1990–2023 |
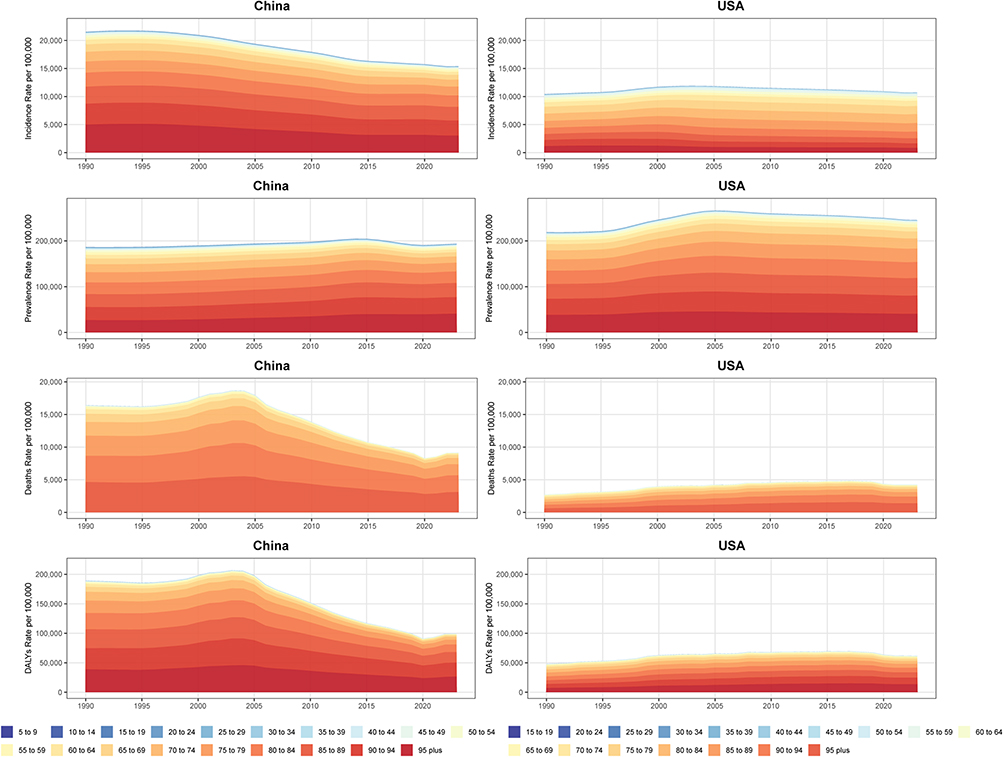 |
Figure 3 Age-Specific Contribution to COPD Burden in China and the United States, 1990–2023 (Both Sexes Combined, Rates). This figure presents stacked area charts depicting the age-specific contribution to total COPD burden (incidence, prevalence, mortality, and DALYs rates per 100,000 population) in China and the United States from 1990 to 2023, for both sexes combined. |
In the United States, younger groups (15–39 years) experienced substantial declines in incidence (cases: 13.14–46.69% decrease, rates: 3.43–56.14% decrease, AAPC: −0.11% to −2.53%) and prevalence (cases: 16.48–37.76% decrease, rates: 29.77–38.40% decrease, AAPC: −1.08% to −1.48%). Middle-aged groups (40–64 years) showed increasing trends in incidence (cases: 34.29–134.25% increase, rates: 2.55–17.12% increase, AAPC: 0.08–0.49%) and prevalence (cases: 35.39–106.83% increase, AAPC: −0.13% to 0.29%), while mortality remained stable or declined modestly (AAPC: −0.18% to −0.56%). Older groups (≥65 years) exhibited alarming increases: prevalence cases rose 109.25–199.55% with rates increasing 6.31–20.21% (AAPC: 0.17–0.56%). Mortality escalated dramatically in the oldest groups, with deaths increasing 192.28–540.36% and rates rising 56.03–127.27% (ages 85+, AAPC: 1.29–2.49%). DALYs mirrored mortality, with younger groups declining (AAPC: −0.35% to −1.02%) while the oldest groups increased substantially (AAPC: 1.08–1.93%).
Age-Period-Cohort Decomposition
Age-period-cohort analysis revealed distinct patterns (Figure 4, Supplementary Figure 6). Age effects demonstrated exponential increases with advancing age in both countries. In China, age-specific relative risk (RR) increased from 0.080 (ages 15–19) to 8.44 (ages 90–94), with steepest escalation between ages 50–54 (RR: 0.75) and 60–64 (RR: 1.73). The United States showed similar patterns with lower peaks (RR: 0.091 to 5.34).
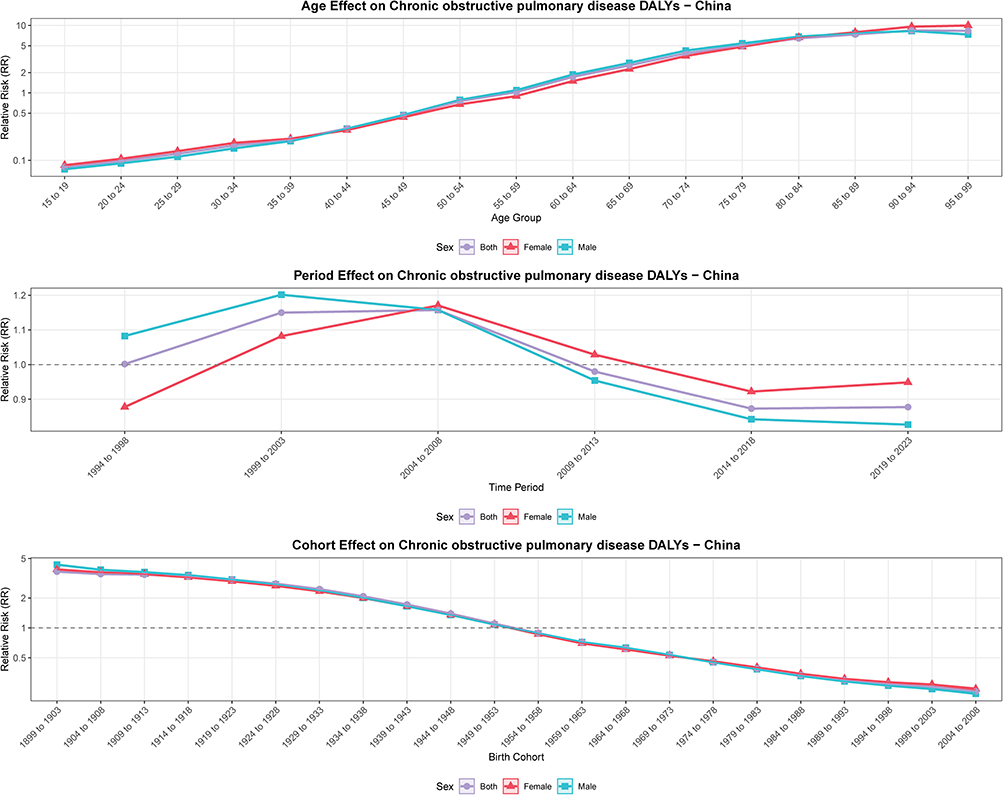 |
Figure 4 Age-Period-Cohort Analysis of COPD DALYs in China, 1994–2023. This figure presents the results of age-period-cohort (APC) analysis using the intrinsic estimator method for COPD disability-adjusted life years (DALYs) in China from 1994 to 2023. The figure consists of three vertically arranged panels representing the three independent temporal effects: (1) Age effects (top panel) show how relative risk (RR) varies across different age groups (15–19 to 95+ years), plotted on a logarithmic scale; (2) Period effects (middle panel) display how RR changes across successive 5-year time periods (1994–1998 to 2019–2023), with a horizontal reference line at RR = 1; (3) Cohort effects (bottom panel) illustrate how RR differs among birth cohorts (1899–1903 to 2004–2008), also plotted on a logarithmic scale with a reference line at RR = 1. |
Period effects revealed divergent dynamics. In China, period RR initially increased from 1.00 (1994–1998) to 1.20 (1999–2003), then declined consistently to 0.83 (2019–2023), with males showing more pronounced improvements. Conversely, the United States demonstrated deteriorating period effects, with RR increasing from 0.67 (1994–1998) to 1.34 (2019–2023), more dramatic in females (0.64 to 1.39) than males (0.72 to 1.27).
Cohort effects exhibited striking generational gradients. In China, earlier cohorts (1899–1903) demonstrated highest RR (3.69), declining progressively to 0.23 (2004–2008 cohort), representing 16-fold reduction. The inflection occurred around the 1949–1953 cohort (RR: 1.10). In the United States, cohort RR declined from 3.10 (1899–1903) to 0.19 (2004–2008), with less pronounced magnitude than China. Females exhibited less favorable cohort effects, with earlier cohorts showing lower RR values than males.
Risk Factor Attribution of COPD Burden
Risk factor attribution analyses revealed substantial reductions in COPD DALY burden associated with most exposures in China, contrasting with more modest changes in the United States (Table 3). In China, age-standardized DALY rates declined dramatically across all major risk factors between 1990 and 2023. Particulate matter pollution demonstrated the steepest absolute decline (82.21% reduction, from 1403.08 to 249.68 per 100,000), followed by smoking (68.48% reduction, from 1027.10 to 323.78 per 100,000), low temperature (67.24% reduction, from 229.07 to 75.04 per 100,000), secondhand smoke (60.89% reduction, from 248.89 to 97.35 per 100,000), ambient ozone pollution (65.33% reduction, from 182.54 to 63.29 per 100,000), and occupational exposures (63.66% reduction, from 179.60 to 65.28 per 100,000). High temperature remained a negligible contributor (declining from 7.90 to 4.63 per 100,000). Conversely, the United States exhibited more modest improvements: particulate matter pollution decreased 72.12% (from 91.72 to 25.57 per 100,000), secondhand smoke declined 33.88% (from 55.19 to 36.49 per 100,000), and ambient ozone pollution decreased 40.16% (from 57.56 to 34.44 per 100,000). However, smoking-attributable burden declined only 14.09% (from 342.35 to 294.10 per 100,000), remaining the dominant risk factor in 2023. Low temperature and occupational exposures showed minimal changes (4.75% and 10.21% reductions, respectively), while high temperature burden increased 2.4-fold (from 1.44 to 3.50 per 100,000), suggesting emerging climate-related challenges.
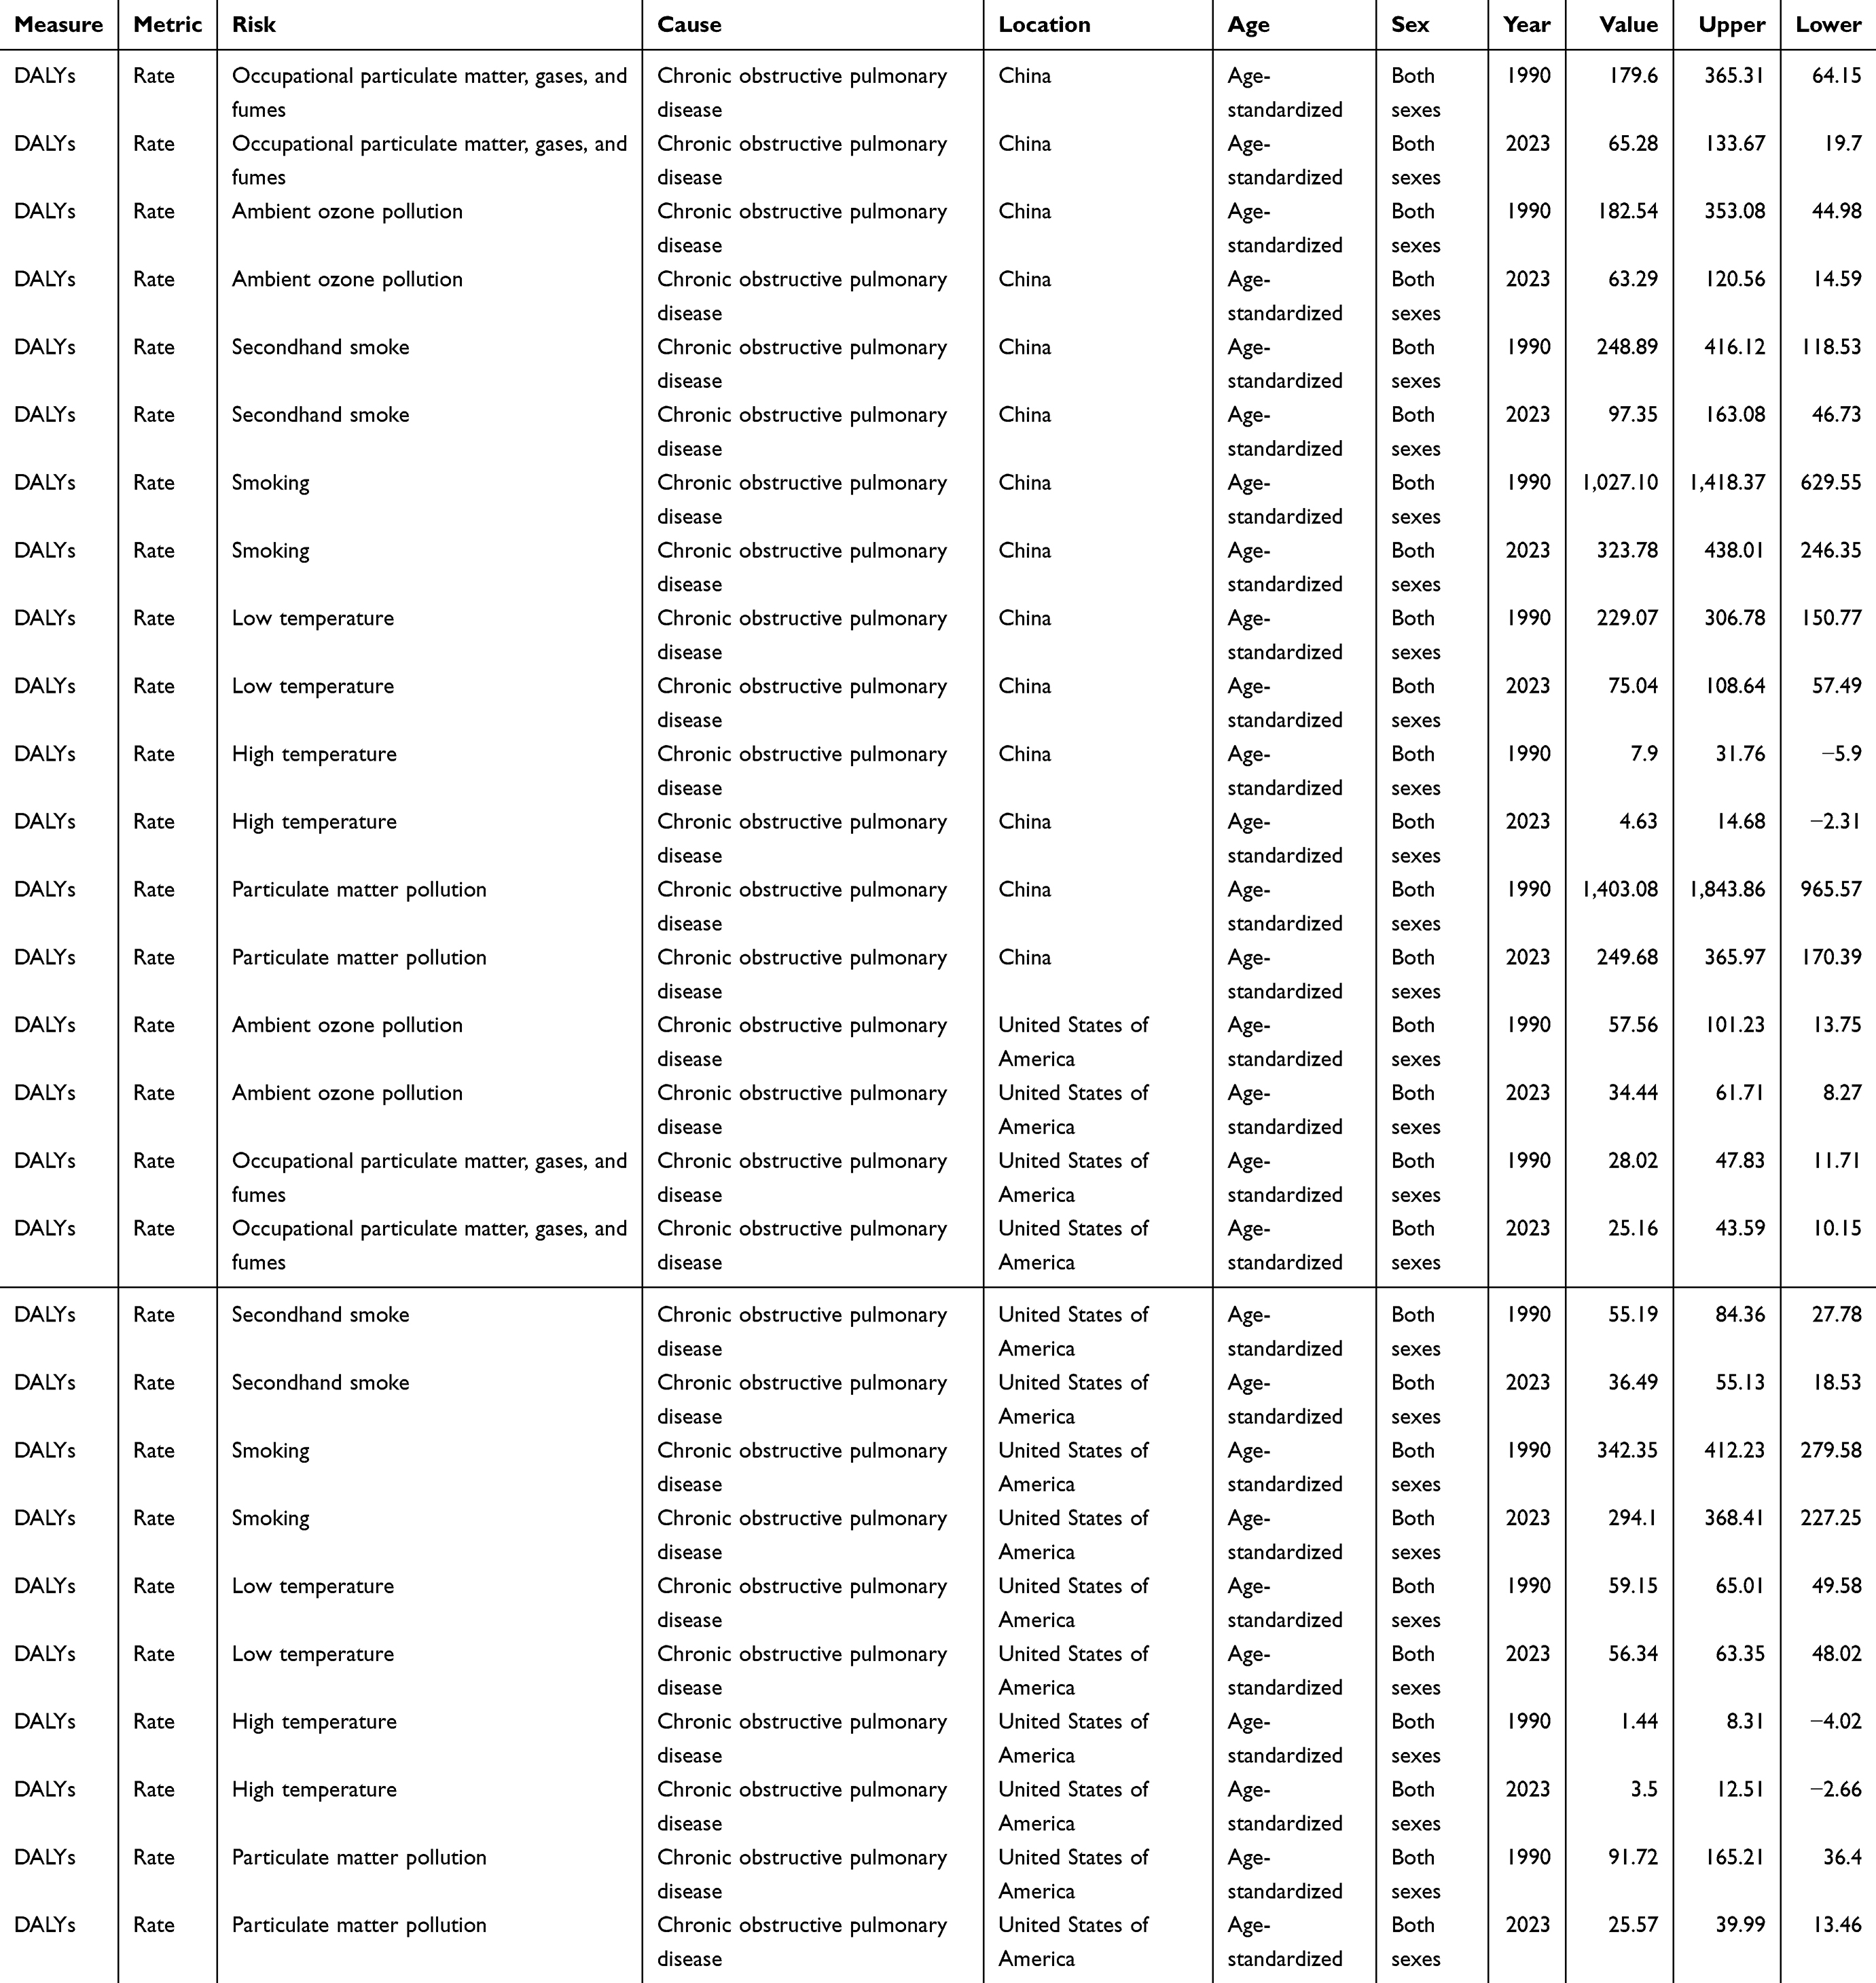 |
Table 3 Age-Standardized DALY Rates Attributable to Major Risk Factors for COPD in China and the United States, 1990 and 2023 |
Projected Future COPD Burden to 2035
Bayesian projections to 2035 revealed divergent trajectories (Figures 5–6). In China, age-standardized incidence rates are projected to increase 30.0% (to 256.98 per 100,000) with absolute cases rising 23.6% (to 5,486,115). Prevalence rates will rise 39.8% (to 3310.97 per 100,000) with cases expanding 32.3% (to 69,464,505), adding 16.97 million individuals. Mortality rates will increase 120.0% (to 102.54 per 100,000) with absolute deaths surging 135.9% (to 2,354,092). DALY rates will rise 92.0% (to 1493.52 per 100,000) with absolute DALYs increasing 95.9% (to 33,856,856), nearly doubling total burden.
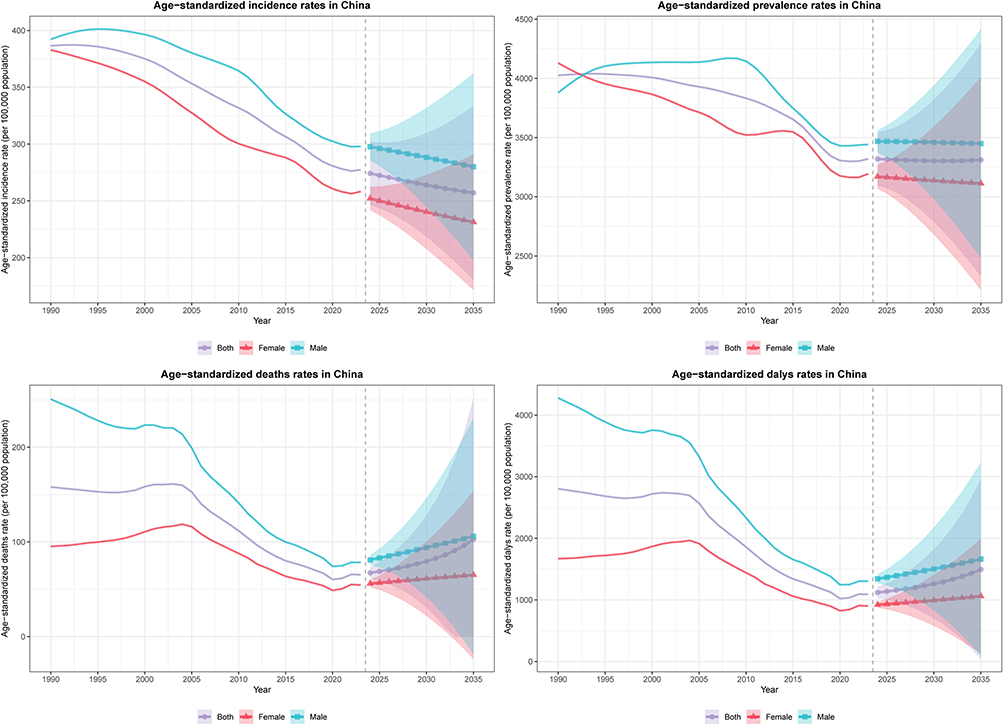 |
Figure 5 Projected COPD Burden in China, 2024–2035. This figure presents Bayesian age-period-cohort (BAPC) model projections of COPD burden in China from 1990 to 2035, combining historical data (1990–2023) with future projections (2024–2035). Four panels display age-standardized rates for incidence, prevalence, mortality, and DALYs (per 100,000 population), stratified by sex (both, female, male). Historical data are shown with thin solid lines without markers, while projected data (2024–2035) are displayed with thicker solid lines and distinct point markers (circles for both sexes, triangles for females, squares for males). Shaded regions around the projected lines represent 95% credible intervals, indicating prediction uncertainty. A vertical dashed line at year. |
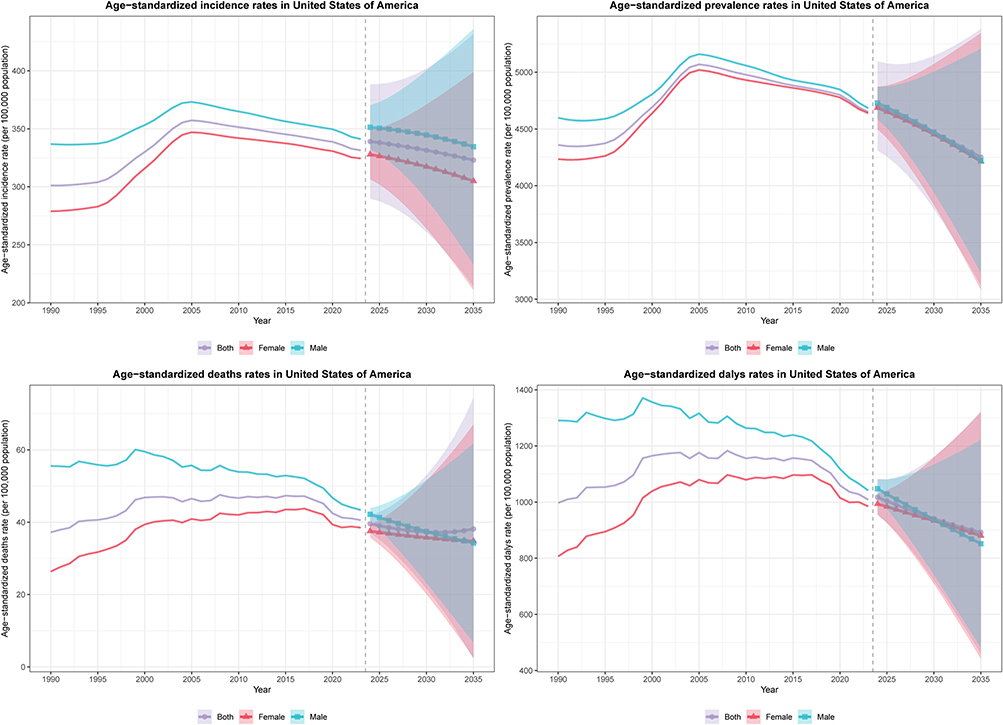 |
Figure 6 Projected COPD Burden in the United States, 2024–2035. This figure presents BAPC model projections for the United States, using the same structure, time frame, and visualization approach as Figure 5. |
In the United States, age-standardized incidence rates will increase 36.6% (to 322.98 per 100,000) with cases rising 15.4% (to 1,547,402). Prevalence rates will escalate 28.2% (to 4251.48 per 100,000) with cases expanding 20.1% (to 23,715,229). Mortality rates will rise 32.0% (to 38.14 per 100,000) with deaths increasing 30.1% (to 243,058). DALY rates will increase 24.1% (to 892.24 per 100,000) with absolute DALYs rising 13.4% (to 4,986,368). Female mortality rates (34.77 per 100,000) are projected to converge with male rates (34.23 per 100,000) by 2035, reflecting concerning continuation of rising female COPD mortality trends.
These contrasting trajectories underscore fundamental differences: China demonstrates declining age-standardized mortality and DALY rates yet faces escalating absolute burden due to population aging, while the United States confronts simultaneous increases in both age-adjusted rates and absolute numbers, highlighting persistent challenges in both nations despite vastly different healthcare systems and risk factor profiles.
Discussion
This comprehensive analysis of COPD burden in China and the United States from 1990 to 2023 revealed markedly divergent epidemiological trajectories. China experienced substantial improvements in age-standardized mortality rates (declining 58.68% from 112.79 to 46.60 per 100,000) and DALY rates (decreasing 61.12% from 2000.61 to 777.86 per 100,000), despite a 116.72% increase in absolute prevalent cases driven by population aging. Conversely, the United States exhibited increasing trends, with mortality rates rising 8.90% (from 26.53 to 28.89 per 100,000) and DALY rates remaining essentially stable (1.12% increase). Joinpoint analyses identified critical inflection points: China demonstrated dramatic mortality declines from 2017–2020 (APC: −6.43%) followed by concerning reversals from 2020–2023 (APC: 2.50%), while the United States showed recent improvements from 2017–2023 (mortality APC: −2.72%). Age-period-cohort decomposition revealed that period effects in China declined from 1.20 (1999–2003) to 0.83 (2019–2023), whereas American period effects deteriorated from 0.67 (1994–1998) to 1.34 (2019–2023). Projections to 2035 indicated dramatic increases in absolute burden: China’s mortality would surge 135.9% with age-standardized rates rising 120.0%, while the United States would experience 30.1% increase in deaths and 32.0% rise in age-standardized mortality.
Risk factor attribution analyses revealed fundamental differences in exposure control between countries. In China, age-standardized DALY rates declined dramatically across all major risk factors: particulate matter pollution decreased 82.21% (from 1403.08 to 249.68 per 100,000), smoking declined 68.48% (from 1027.10 to 323.78 per 100,000), low temperature decreased 67.24% (from 229.07 to 75.04 per 100,000), ambient ozone pollution declined 65.33% (from 182.54 to 63.29 per 100,000), occupational exposures decreased 63.66% (from 179.60 to 65.28 per 100,000), and secondhand smoke declined 60.89% (from 248.89 to 97.35 per 100,000). These reductions align with previous GBD analyses reporting 68.2% and 71.5% reductions in age-standardized death and DALY rates between 1990 and 2021, corroborating earlier documentation of 70% decreases in mortality from 1990−2019.7,13,14 This progress reflects aggressive tobacco control reducing male smoking from 63% in 1996 to 50% in 2018, substantial reductions in household air pollution from solid fuels, and improved healthcare access following reforms.9,14 The dramatic decline in ozone pollution-attributable mortality from 71.2 to 22.8 per 100,000 between 1990 and 2021 further supports environmental protection impacts.7 However, the mortality reversal from 2020–2023 warrants attention, potentially reflecting COVID-19 pandemic disruptions in healthcare delivery and chronic disease management.
Conversely, the United States demonstrated more modest risk factor improvements: particulate matter pollution decreased 72.12% (from 91.72 to 25.57 per 100,000), secondhand smoke declined 33.88% (from 55.19 to 36.49 per 100,000), and ambient ozone pollution decreased 40.16% (from 57.56 to 34.44 per 100,000). Critically, smoking-attributable burden declined only 14.09% (from 342.35 to 294.10 per 100,000), remaining the dominant risk factor in 2023. Low temperature and occupational exposures showed minimal changes (4.75% and 10.21% reductions), while high temperature burden increased 2.4-fold (from 1.44 to 3.50 per 100,000), suggesting emerging climate-related challenges. The increasing burden, particularly among females, aligns with concerning trends: our finding of 45.64% increase in female age-standardized mortality (from 18.81 to 27.40 per 100,000) is consistent with 2010–2019 analyses showing continued deterioration.8 The striking gender disparity—males demonstrating 21.94% mortality decrease while females experienced dramatic increases—mirrors global patterns of slower tobacco reduction among women and reflects historical increases in female smoking now manifesting as elevated COPD burden.1,8 Age-period-cohort analysis revealing deteriorating period effects (RR: 0.67 to 1.34) indicates that temporal factors beyond demographic aging—including persistent smoking, rising obesity, and environmental exposures—drive the American epidemic. The economic burden exceeding $45,532 per patient annually further emphasizes crisis severity.15,16
Age-stratified analyses revealed profound heterogeneity. In China, dramatically declining mortality rates across all ages (32.94–75.31% reductions) combined with prevalence increases in oldest groups (50.93% for ages ≥95 years, AAPC: 1.27%) reflects improved survival with population aging, consistent with global patterns of increasing absolute burden despite declining age-standardized rates.5,17 The 585.31%, 1428.21%, and 2761.90% increases in absolute prevalence among ages 85–89, 90–94, and ≥95 years underscore China’s demographic shift, with life expectancy increasing from 69 to 78 years (1990–2019). In the United States, alarming increases in both prevalence and mortality among oldest groups (rates rising 56.03–127.27% for ages ≥85, AAPC: 1.29–2.49%) contrast sharply with China’s improving survival, suggesting inadequate disease management in advanced age. The concentration of American burden in middle-aged groups (50–69 years) differs markedly from China’s shift toward older populations, potentially reflecting earlier disease onset associated with higher obesity and earlier smoking initiation.8,9
Cohort effects provide crucial insights into long-term secular trends. In China, the 16-fold reduction in cohort-specific DALY risk from 1899–1903 (RR: 3.69) to 2004–2008 (RR: 0.23), with inflection around 1949–1953, reflects dramatic improvements including substantial reductions in indoor air pollution from solid fuels, improved nutrition, and decreasing occupational exposures.7,14 The steeper decline compared to the United States, despite earlier American transition to below-baseline cohort risk (1954–1958 versus 1949–1953), suggests more rapid risk factor modification in China. Less favorable American female cohort effects may reflect historical gender differences in smoking uptake, with women’s prevalence peaking later than men’s.1,8 These findings align with GBD analyses demonstrating smoking and ambient particulate matter remain predominant risk factors globally, accounting for 46.0% and 20.7% of COPD DALYs, respectively.3,5
Our study possesses notable strengths: comprehensive GBD 2023 data ensuring comparability, extended 33-year time series with projections to 2035,9,18,19 multiple advanced analytical methods (joinpoint regression, age-period-cohort modeling, Bayesian projections), and detailed age-sex stratification revealing heterogeneous patterns.17,19 Compared with a recent similar study analyzing COPD burden in China and the United States based on GBD 2021 data (1990–2021),20 our study provides updated estimates using GBD 2023 data extending to 2023, offers more comprehensive risk factor attribution analysis quantifying seven major risk factors, and includes detailed age-stratified analysis across 17 age groups to better characterize burden evolution across the life course. However, limitations warrant consideration: reliance on statistical modeling introducing uncertainty, potential diagnostic variations and misclassification in death certification, projection assumptions not accounting for future changes, inability to examine urban-rural differences or COPD phenotypes, the inability of GBD data to capture critical social and healthcare determinants such as treatment adherence, medication access, and health insurance coverage, and cautious interpretation required for 2020–2023 trends given COVID-19 disruptions.20–22 Additionally, the GBD database does not include data on cannabis smoking, which is the second most widely smoked substance after tobacco in the United States. While cannabis smoke contains many components similar to tobacco smoke that are injurious to lung tissue, it also contains cannabinoid compounds including delta-9-tetrahydrocannabinol (THC) with potential immunosuppressive and anti-inflammatory properties.23 Current evidence regarding the association between cannabis smoking and COPD remains mixed. A recent state-of-the-art review found no association between cannabis smoking and the development of COPD, although cannabis smoking was strongly associated with chronic bronchitis symptoms and airway inflammation.24 However, studies in patients with established COPD have shown that combined cannabis and tobacco smokers demonstrated higher rates of bullous emphysema compared to tobacco-only smokers.25 Given the increasing legalization and use of cannabis in many countries, future research should investigate the independent and combined effects of cannabis and tobacco smoking on COPD development and progression.
Our findings have important implications. Divergent trajectories demonstrate that substantial burden reductions are achievable through comprehensive interventions, as evidenced by China’s 60% mortality decline, which may be attributed to tobacco control, air quality improvements, and healthcare strengthening.14,22 However, these findings should be interpreted with caution, as alternative explanations cannot be excluded, including potential underreporting, changes in case detection and screening practices, revisions in diagnostic criteria, and methodological adjustments in epidemiological modeling over time. Furthermore, while China’s comprehensive COPD countermeasures may serve as a model for developing countries, the trends observed in the United States may represent the future trajectory for developed nations and potentially for China as well. As China continues its epidemiological transition with population aging and lifestyle changes, current successful interventions may face increasing challenges, and mortality rates could rise in the future, similar to patterns observed in the United States. Our projections indicating a 135.9% surge in Chinese deaths and 120.0% increase in age-standardized mortality by 2035 support this concern. Cost-effectiveness analyses showing population-based screening could achieve $8,034-$13,209 per QALY suggest case-finding benefits.22 Persistently high American burden highlights needs for smoking cessation, particularly among women, addressing obesity, and ensuring equitable therapy access.1,4 These dramatic projected increases underscore urgent healthcare system preparation needs, including pulmonary rehabilitation expansion, respiratory professional training, and sustainable financing.2,4 Age-specific patterns suggest tailored strategies: intensive risk reduction for younger populations preventing onset, while ensuring screening and management for older adults bearing current burden.1,18 Future research priorities include: prospective cohorts validating estimates and characterizing phenotypes; evaluating novel interventions including pharmacotherapies and digital health technologies; examining COPD intersection with comorbidities, particularly cardiovascular disease and diabetes; and investigating social determinants informing equity-oriented interventions.21,26
Conclusions
This comprehensive 33-year analysis reveals fundamentally divergent COPD trajectories between China and the United States. China achieved remarkable 58.68% and 61.12% reductions in age-standardized mortality and DALY rates through successful tobacco control, environmental interventions, and dramatic risk factor reductions—particulate matter pollution declining 82.21%, smoking 68.48%, and occupational exposures 63.66%—while the United States experienced concerning increases particularly among females and older adults, with mortality rising 8.90%, female mortality escalating 45.64%, and smoking-attributable burden declining only 14.09%. Despite contrasting epidemiological patterns, both nations face dramatic projected increases in absolute burden by 2035: Chinese deaths increasing 135.9%, American deaths 30.1%, driven predominantly by population aging. Age-period-cohort analyses revealed deteriorating American period effects (RR: 0.67 to 1.34) versus improving Chinese effects (RR: 1.20 to 0.83), reflecting fundamental differences in risk factor control. Profound age-specific heterogeneity—Chinese prevalence increasing 50.93% among ages ≥95 years alongside mortality declines, versus American mortality rising 127.27% in oldest groups—underscores needs for age-tailored strategies. These findings demonstrate substantial burden reductions are achievable through comprehensive interventions as evidenced by China’s success, while persistent American trends despite greater resources highlight critical prevention and management gaps requiring urgent attention to avert projected escalation.
Data Sharing Statement
All data used in this study are publicly available from the Global Burden of Disease Study 2023 database through the Institute for Health Metrics and Evaluation (IHME) Global Health Data Exchange (http://ghdx.healthdata.org/gbd-results-tool). The analytical code and supplementary materials are available from the corresponding author upon reasonable request.
Ethics Statement
This study was conducted in accordance with the principles of the Declaration of Helsinki. All data were obtained from the Global Burden of Disease Study 2023 database, which is publicly accessible through the Institute for Health Metrics and Evaluation (IHME) and contains aggregated, de-identified population-level estimates that do not involve individual patient data. According to Articles 32(1) and 32(2) of the “Measures for Ethical Review of Life Science and Medical Research Involving Human Subjects” issued by the National Health Commission of the People’s Republic of China on February 18, 2023, research using legally obtained publicly available data or data that cannot identify specific individuals through information technology is exempt from ethical review. Therefore, this study did not require ethical approval. The authors have completed the Introduction to GBD Online Course certified by the Institute for Health Metrics and Evaluation at the University of Washington, demonstrating proficiency in GBD data, methods, findings, and implications.
Acknowledgments
We acknowledge the Institute for Health Metrics and Evaluation and all contributors to the Global Burden of Disease Study 2023 for providing open access to comprehensive epidemiological data.
Author Contributions
All authors made a significant contribution to the work reported, whether that is in the conception, study design, execution, acquisition of data, analysis and interpretation, or in all these areas; took part in drafting, revising or critically reviewing the article; gave final approval of the version to be published; have agreed on the journal to which the article has been submitted; and agree to be accountable for all aspects of the work.
Funding
There is no funding to report.
Disclosure
The authors declare that they have no competing interests.
References
1. De Oca MM, Perez-Padilla R, Celli B, et al. The global burden of COPD: epidemiology and effect of prevention strategies. Lancet Respir Med. 2025;13(8):709–23. doi:10.1016/S2213-2600(24)00339-4
2. Chen S, Kuhn M, Prettner K, et al. The global economic burden of chronic obstructive pulmonary disease for 204 countries and territories in 2020–50: a health-augmented macroeconomic modelling study. Lancet Glob Health. 2023;11(8):e1183–e1193. doi:10.1016/S2214-109X(23)00217-6
3. Safiri S, Carson-Chahhoud K, Noori M, et al. Burden of chronic obstructive pulmonary disease and its attributable risk factors in 204 countries and territories, 1990-2019: results from the global burden of disease study 2019. BMJ. 2022;378:e069679. doi:10.1136/bmj-2021-069679
4. Florman KEH, Siddharthan T, Pollard SL, et al. Unmet diagnostic and therapeutic opportunities for chronic obstructive pulmonary disease in low- and middle-income countries. Am J Respir Crit Care Med. 2023;208(4):442–450. doi:10.1164/rccm.202302-0289OC
5. Momtazmanesh S, Moghaddam SS, Ghamari S-H. Global burden of chronic respiratory diseases and risk factors, 1990–2019: an update from the global burden of disease study 2019. EClinicalMedicine. 2023;59:101936. doi:10.1016/j.eclinm.2023.101936
6. Sayers I, John C, Chen J, et al. Genetics of chronic respiratory disease. Nat Rev Genet. 2024;25(8):534–547. doi:10.1038/s41576-024-00695-0
7. Jiang Y, Yan F, Kan H, et al. Burden of chronic obstructive pulmonary disease attributable to ambient ozone pollution across China and its provinces, 1990-2021: an analysis for the global burden of disease study 2021. Chin Med J. 2024;137(24):3126–3135. doi:10.1097/CM9.0000000000003415
8. Mei F, Dalmartello M, Bonifazi M, et al. Chronic obstructive pulmonary disease (COPD) mortality trends worldwide: an update to 2019. Respirology. 2022;27(11):941–950. doi:10.1111/resp.14328
9. Boers E, Barrett M, Su JG, et al. Global burden of chronic obstructive pulmonary disease through 2050. JAMA Network Open. 2023;6(12):e2346598. doi:10.1001/jamanetworkopen.2023.46598
10. Liew CQ, Hsu S-H, Ko C-H, et al. Acute exacerbation of chronic obstructive pulmonary disease in United States emergency departments, 2010–2018. BMC Pulm Med. 2023;23(1):217. doi:10.1186/s12890-023-02518-0
11. Klinger JR, Wu B, Morland K, et al. Burden of pulmonary hypertension due to chronic obstructive pulmonary disease: analysis of exacerbations and healthcare resource utilization in the United States. Respir Med. 2023;219:107412. doi:10.1016/j.rmed.2023.107412
12. Collaborators GBDCOD. Global burden of 292 causes of death in 204 countries and territories and 660 subnational locations, 1990-2023: a systematic analysis for the global burden of disease study 2023. Lancet. 2025;406(10513):1811–1872.
13. Li R, Cheng X, Yang Y, et al. Global deaths associated with population aging — 1990–2019. China CDC Weekly. 2023;5(51):1150–1154. doi:10.46234/ccdcw2023.216
14. Guo B, Gan H, Xue M, et al. The changing and predicted trends in chronic obstructive pulmonary disease burden in China, the United States, and India from 1990 to 2030. Int J Chron Obstruct Pulmon Dis. 2024;19:695–706. doi:10.2147/COPD.S448770
15. Ghaswalla P, Thompson-Leduc P, Cheng WY, et al. Increased health care resource utilization and costs associated with herpes zoster among patients aged ≥50 years with chronic obstructive pulmonary disease in the United States. Chronic Obstr Pulm Dis. 2021;8(4):502–516. doi:10.15326/jcopdf.2021.0222
16. Nili M, Dwibedi N, Adelman M, et al. Economic burden of asthma-chronic obstructive pulmonary disease overlap among older adults in the United States. COPD. 2021;18(3):357–366. doi:10.1080/15412555.2021.1909549
17. Li H-Y, Gao T-Y, Fang W, et al. Global, regional and national burden of chronic obstructive pulmonary disease over a 30-year period: estimates from the 1990 to 2019 global burden of disease study. Respirology. 2023;28(1):29–36. doi:10.1111/resp.14349
18. Zhai Y, Zhu C, Zhu T, et al. Global, regional, and national burden of chronic respiratory diseases,1990–2021 and predictions to 2035: analysis of data from the global burden of disease study 2021. Ann Med. 2025;57(1):2530225. doi:10.1080/07853890.2025.2530225
19. Wang Z, Lin J, Liang L, et al. Global, regional, and national burden of chronic obstructive pulmonary disease and its attributable risk factors from 1990 to 2021: an analysis for the global burden of disease study 2021. Respir Res. 2025;26(1):2. doi:10.1186/s12931-024-03051-2
20. Li R, Li Y, Xiong C, et al. Burden of chronic obstructive pulmonary disease in China: an analysis based on the GBD 2021 compared with the United States. PLoS One. 2025;20(4):e0321470. doi:10.1371/journal.pone.0321470
21. Zhou Z, Wang L, Zhou M, et al. Chronic obstructive pulmonary disease-associated mortality - China, 2014-2021. China CDC Wkly. 2024;6(43):1105–1110. doi:10.46234/ccdcw2024.226
22. Chen Q, Fan Y, Huang K, et al. Cost-effectiveness of population-based screening for chronic obstructive pulmonary disease in China: a simulation modeling study. Lancet Reg Health West Pac. 2024;46:101065. doi:10.1016/j.lanwpc.2024.101065
23. Tashkin DP, Barjaktarevic I. Marijuana use as a risk factor for chronic obstructive pulmonary disease: not there yet. Am J Respir Crit Care Med. 2023;208(4):501–502. doi:10.1164/rccm.202303-0404LE
24. Khoj L, Zaga V, Amram DL, et al. Effects of cannabis smoking on the respiratory system: a state-of-the-art review. Respir Med. 2024;221:107494. doi:10.1016/j.rmed.2023.107494
25. Cherian SV, Karanth S, Oldham SA, et al. Impact of cannabis smoking in patients with COPD: a retrospective cross-sectional study in a safety- net hospital. Heart Lung. 2026;75:263–269. doi:10.1016/j.hrtlng.2025.10.011
26. Raina M, Hu J, Shah R, et al. The health burden of chronic diseases in the United States attributable to air particulate matter. Clin Med Lond. 2025;25(5):100493. doi:10.1016/j.clinme.2025.100493
 © 2026 The Author(s). This work is published and licensed by Dove Medical Press Limited. The
full terms of this license are available at https://www.dovepress.com/terms
and incorporate the Creative Commons Attribution
- Non Commercial (unported, 4.0) License.
By accessing the work you hereby accept the Terms. Non-commercial uses of the work are permitted
without any further permission from Dove Medical Press Limited, provided the work is properly
attributed. For permission for commercial use of this work, please see paragraphs 4.2 and 5 of our Terms.
© 2026 The Author(s). This work is published and licensed by Dove Medical Press Limited. The
full terms of this license are available at https://www.dovepress.com/terms
and incorporate the Creative Commons Attribution
- Non Commercial (unported, 4.0) License.
By accessing the work you hereby accept the Terms. Non-commercial uses of the work are permitted
without any further permission from Dove Medical Press Limited, provided the work is properly
attributed. For permission for commercial use of this work, please see paragraphs 4.2 and 5 of our Terms.
Recommended articles

Chronic Obstructive Pulmonary Disease Prevalence and Associated Risk Factors in Adults Aged 40 Years and Older in Southeast China: A Cross-Sectional Study During 2019–2020
Chen J, Yin Y, Zhang Y, Lin X, Chen T, Yang Z, Wang D, Zhong W
International Journal of Chronic Obstructive Pulmonary Disease 2022, 17:2317-2328
Published Date: 17 September 2022
β2-Adrenoceptor Agonists in Asthma or Chronic Obstructive Pulmonary Disease and Risk of Parkinson’s Disease: Nested Case-Control Study
Paakinaho A, Tiihonen M, Koskela H, Koponen M, Tiihonen J, Hartikainen S, Tolppanen AM
Clinical Epidemiology 2023, 15:695-705
Published Date: 12 June 2023

Global, Regional, and National Burden of COPD Attributable to Occupational Particulate Matter, Gases, and Fumes, 1990–2019: Findings from the Global Burden of Disease Study 2019
Su X, Gu H, Li F, Shi D, Wang Z
International Journal of Chronic Obstructive Pulmonary Disease 2023, 18:2971-2983
Published Date: 12 December 2023
Extrapulmonary Comorbidities Associated with Chronic Obstructive Pulmonary Disease: A Review
Xiang Y, Luo X
International Journal of Chronic Obstructive Pulmonary Disease 2024, 19:567-578
Published Date: 29 February 2024
The Changing and Predicted Trends in Chronic Obstructive Pulmonary Disease Burden in China, the United States, and India from 1990 to 2030
Guo B, Gan H, Xue M, Huang Z, Lin Z, Li S, Zheng P, Sun B
International Journal of Chronic Obstructive Pulmonary Disease 2024, 19:695-706
Published Date: 8 March 2024