Back to Journals » Psychology Research and Behavior Management » Volume 19
Dissecting Depression in Cardiovascular Disease in Middle-Aged and Older Adults: Evidence That Comorbidity is Associated with Higher Depression Network Strength
Authors Lin R, Xiong Y, Wang L, Chen Y, Lin J ![]() , Du N
, Du N
Received 22 February 2026
Accepted for publication 15 May 2026
Published 25 May 2026 Volume 2026:19 604559
DOI https://doi.org/10.2147/PRBM.S604559
Checked for plagiarism Yes
Review by Single anonymous peer review
Peer reviewer comments 2
Editor who approved publication: Dr Gabriela Topa
Rouyi Lin,1,2,* Yinshi Xiong,1,* Lin Wang,1 Yuchan Chen,1 Jiaci Lin,3 Na Du1
1Heart Center, Guangzhou Women and Children’s Medical Center, Guangzhou Medical University, Guangzhou, People’s Republic of China; 2Guangdong Provincial Key Laboratory of Research in Structural Birth Defect Disease, Guangzhou Women and Children’s Medical Center, Guangzhou Medical University, Guangzhou, People’s Republic of China; 3School of Social and Behavioral Science, Nanjing University, Nanjing, People’s Republic of China
*These authors contributed equally to this work
Correspondence: Na Du, Heart Center, Guangzhou Women and Children’s Medical Center, Guangzhou Medical University, No. 9 Jinsui Road, Tianhe District, Guangzhou, Guangdong Province, People’s Republic of China, Email [email protected] Jiaci Lin, School of Social and Behavioral Science, Nanjing University, 163 Xianlin Road, Qixia District, Nanjing, People’s Republic of China, Email [email protected]
Objective: Depression is prevalent among older adults with cardiovascular disease (CVD). This study utilized network analysis to examine depressive symptom structures in older adults with and without CVD and explored the impact of comorbidities.
Methods: Based on 15,234 participants from the 2018 CHARLS data, propensity score matching (PSM) was used to construct a matched cohort of CVD and non-CVD individuals. Depressive symptoms were assessed via the CESD-10. Network analysis identified central symptoms and compared network connectivity and strength.
Results: The CVD group exhibited significantly higher depression prevalence and symptom severity than the non-CVD group. In the CVD network, “depressed”, “could not get going”, and “bothered” were the most central symptoms. Notably, CVD patients with comorbidities showed significantly higher global network strength (S=0.44, P=0.008) than those without, indicating a more tightly coupled and potentially more persistent symptom structure.
Conclusion: Older adults with CVD demonstrate distinct depression symptom interactions. The increased network density in patients with comorbidities suggests a higher vulnerability to self-sustaining depressive states. Targeting central symptoms like “feeling depressed” and “inability to get going” may optimize psychological interventions and clinical management for this population.
Keywords: cardiovascular disease, depression, network analysis, middle-aged and older adults, comorbidity
Introduction
Population aging is a global trend, with projections indicating that by 2050, over 20% of the world’s population will be over 65, and 80% of them will be living in low- and middle-income countries.1 Cardiovascular disease (CVD) including coronary heart disease (CHD) and stroke, is one of the most common somatic conditions and a growing global challenge due to its rising incidence and progression with the continuous aging of the population.2,3 Recent Global Burden of Disease data indicate that CVD remains the leading cause of mortality worldwide, accounting for nearly 20 million deaths annually, with continued increases in prevalence, particularly among aging populations.4 A national survey in China reported that the prevalence of CVD has been increasing, with approximately 330 million cases in 2020, including 13 million strokes and 11.39 million with CHD.5 Meanwhile, CVD-related deaths rose from 3.09 million in 2005 to 4.58 million in 2020, making it the leading cause of death, surpassing cancer and other diseases.5,6 Despite improvements in CVD prevention, diagnosis, and early intervention, older adults with heart disease remain at risk not only for mortality and physical decline but also for mental health problems.7
Some studies have shown that patients with CVD experience greater psychological stress, resulting in an increased risk of various mental health disorders particularly depression.8–10 Recent clinical guidelines increasingly recognize depression as an important prognostic and modifiable factor in cardiovascular care, emphasizing the need for early psychological assessment and integrated management in patients with CVD.7,11 Depression, a prevalent mental disorder, is characterized by sadness, fatigue, and a sense of worthlessness.12,13 A meta-analysis reported that the prevalence of depression in patients with CHD in China ranged from 34.6% to 45.8%, with severe depression ranging from 3.1% to 11.2%,14 significantly higher than the global prevalence of 31.3% in cardiac patients.15 Moreover, depression following CVD may contribute to adverse cardiac outcomes including increased mortality, ventricular arrhythmias, and heart failure-related hospitalizations through depression-related behavioral (eg., physical inactivity, poor diet) and physiological changes (eg., inflammation, platelet dysfunction).2,9,16 Several studies to date have demonstrated that the relationship between CVD and depression is likely bidirectional and may involve shared etiological pathways.2,17 For instance, depressive symptoms have been identified as risk factors for increased CVD risk, while cardiovascular risk factors are also associated with depression.17 The bidirectional link between CVD and depression may be driven by shared pathophysiological mechanisms, including chronic inflammation, endothelial, autonomic dysfunction, and neuroendocrine dysregulation.2,9,17 Given the high prevalence and adverse impact of depression in CVD patients, and their complex relationship, a deeper understanding of depression’s psychopathological mechanisms and targeted symptom management is essential to reduce risk and improve treatment outcomes.
However, most previous studies examining the relationship between CVD and depression have largely been based on the binary characteristic or total scores of depressive symptoms, rather than individual symptoms.2,8,9,17,18 Such traditional methods may obscure the differential effects of CVD on individual symptoms and the interrelationships among those symptoms.19 A recent study identified that restless sleep and loneliness were significantly associated with incident CVD,10 but whether these symptoms are viable intervention targets and how they relate to other symptoms remain unclear. Depression involves various individual symptoms such as low mood, reduced energy, hopelessness, sleep disturbances, worthlessness, impaired concentration.8,13,20 These symptoms vary in their clinical outcomes, underlying risk factors, and neurobiological mechanisms and one symptom may influence changes of others during treatments.21 Therefore, examining depression at the symptom level may offer valuable insights into its potential causes and support more effective biopsychosocial interventions.
Network analysis, as an advanced data analysis method, can identify central symptoms and describe causal relationships among symptoms in depressive network structure.22 Central symptoms can trigger the onset and maintenance of psychological disorders and influence their progression,23 making them key targets for intervention. Symptom interrelations are central to understanding psychiatric comorbidity, based on the view that mental disorders emerge from causal interactions between symptoms.24 More recently, a study applied network analysis to examine the network structure of anxiety and depression symptoms in CVD patients, providing new insights.25 However, its findings have limited generalizability to middle-aged and older adults, as participants included individuals aged 18 and above. Given that older adults often experience more severe CVD pathology, age-related differences may significantly influence depressive symptoms expression.3 Moreover, the study did not include a comparison with the general population, limiting the ability to identify depressive network specificity in the CVD group. Lastly, the study did not account for the presence of comorbidity conditions in CVD patients, which may further influence the depressive symptom network. This consideration is supported by a previous research showing that specific depressive symptoms may be uniquely associated with depression in older adults with multimorbidity.26
To address these gaps, the present study used data from China Health and Retirement Longitudinal Study (CHARLS) to: 1) explore the prevalence and network characteristics of depressive symptoms among demographically matched middle-aged and older adults with and without CVD; and 2) investigate the impact of other comorbidities on the depressive symptoms network within the CVD group.
Method
Study Design and Population
This study was a secondary analysis based on data from the fourth wave (2018) of the CHARLS (http://charls.pku.edu.cn/en). The CHARLS is an ongoing, nationally representative longitudinal survey that uses a standardized questionnaire to collect high-quality data, from over 17,500 individuals aged 45 years or older selected from 28 provinces in China. The baseline survey was conducted in 2011–2012, and all participants have been followed up every 2 years since then. The CHARLS study was approved by the Institutional Review Board of Peking University (IRB00001052-11015) and all participants provided informed consent. Detailed information about the study design and cohort profile have been previously reported.27
In CHARLS 2018, a total of 19816 individuals were involved, 4582 were excluded for following reasons: no information about age (N = 322); age less than 45 years (N = 227); uncompetitive and missing depression data (N = 3671); lack of CVD data (N = 107), missing information on residence (N=255), leaving 15234 participants for final analysis. A detailed flow chart was presented in Figure 1.
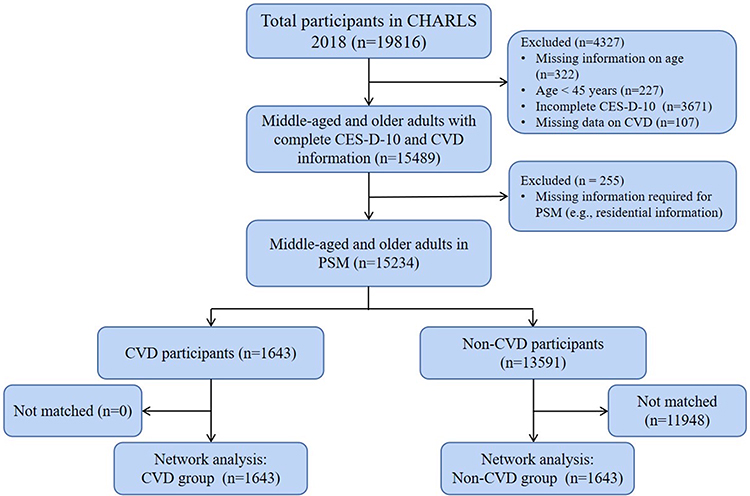 |
Figure 1 Flowchart showing the participant selection process. Abbreviations: CHARLS, China Health and Retirement Longitudinal Study; CES-D-10, 10-item Center for Epidemiologic Studies Depression Scale; CVD, cardiovascular disease; PSM, propensity score matching. |
Assessment of Depression
Depressive symptoms were assessed using the 10-item Center for Epidemiologic Studies Depression Scale (CES-D-10),28 a widely used instrument with demonstrated reliability and construct validity in elderly people.12,29 The CES-D-10 comprising 10 original items included: 1) BOTHER (I was bothered by things that usually do not bother me); 2) MIND (I had trouble keeping my mind on what I was doing); 3) DEPRESS (I felt depressed); 4) EFFORT (I felt everything I did was an effort); 5) HOPEFUL (I felt hopeful about the future); 6) FEARFUL (I felt fearful); 7) SLEEP (My sleep was restless); 8) HAPPY (I was happy); 9) LONELY (I felt lonely); 10) GOING (I could not get “going”). These ten items assessed three dimensions of depression: negative affect (DEPRESS, FEARFUL, LONELY), somatic symptoms (BOTHER, MIND, EFFORT, SLEEP, GOING), and anhedonia (HOPEFUL, HAPPY), which aligns with DSM-5 conceptualization of depression.12,13,30 Each item was rated on a four-point Likert scale ranging from 0 (rarely or none of the time) to 3 (all of the time) with total scores ranging from 0 to 30. In our analysis, the positive items “HOPEFUL” and “HAPPY” were reverse-scored to reflect hopelessness and unhappiness, respectively. Higher scores indicated more severe depressive symptoms. Based on the total score, participants were categorized into two groups: the depressive symptom group (DS; score ≥10) and the non-depressive symptom group (NDS; score <10).30
Assessment of CVD Events
Our primary outcome of this study was the incident of CVD events including heart disease and stroke. Consistent with previous research,31,32 we identified the incident of CVD events through the following standardized questions: “Have you been told by a doctor that you have been diagnosed with a heart attack, coronary heart disease, angina, congestive heart failure, or other heart problems?” or “Have you been told by a doctor that you have been diagnosed with a stroke?” Participants who reported heart disease or stroke during the follow-up period were defined as having incident CVD.
Covariates
We selected covariates based on prior literature indicating their associations with both CVD and depression.10,30,32,33 These included age; gender (male and female); marital status (married and others, including never married, separated, divorced, or widowed); living residence (urban and rural); educational level (elementary school and below, secondary school, and college and above); and comorbidities were defined as the number of chronic diseases other than CVD, including hypertension, dyslipidemia, diabetes, cancer, chronic lung disease, liver disease, kidney disease, stomach disease, arthritis, and asthma, and were categorized into three groups (0, 1–3, and ≥4).30
Statistical Analysis
Statistical analysis was conducted using R software version 4.5.0.34 To minimize baseline imbalances between the CVD and Non-CVD groups, we performed 1:1 propensity score matching (PSM) using the R package Matchlt, with a caliper width of 0.2 on the propensity score scale. Matching factors included age, gender, marital status, living residence, comorbidities. A statistically significant level was set at P < 0.05 (two-tailed).
Network Estimation
The mean, standard deviation (SD), expected influence (EI), predictability of all the depressive symptoms were calculated. In the network analysis, each depressive symptom was depicted as “node”, and relationship between two nodes was depicted as “edge”. For network visualization, edge colors indicated the direction of correlations: green for positive and red for negative. The thickness of each edge represented the strength of the correlation, with thicker edges indicating stronger associations.21 We used R package qgraph to build the network model.35 The network was calculated based on Gaussian Graphical Model (GGM), with the graphic least absolute shrinkage and selection operator (LASSO) and an Extended Bayesian Information Criterion (EBIC) model, which can improve the accuracy of the prediction, sparse and interpretability of the network model in the R package qgraph.36,37 The EI of each symptom was calculated as the sum of the weights of all its edges and a higher EI indicated a more central and influential symptom within the network.23 Node predictability was estimated using R package mgm which quantifies the extent to which the variance of a node in a network can be inferred from its neighboring nodes.38
Network Accuracy and Stability
The R package bootnet was used to assess the accuracy and stability of the network based on 1000 bootstraps performed for each node.39 The accuracy of edge weights was measured using the nonparametric bootstrap method to calculated 95% confidence intervals (CIs), with narrower bootstrapped CIs indicating greater network reliability.40 The stability of centrality indices including strength and node EI was assessed using case-dropping bootstrap to calculate the correlation stability coefficients (CS-C).41 A CS-C value of 0.25 or higher is considered acceptable, while a value of 0.5 or greater is preferred.39 Bootstrapped difference tests were conducted using the R package bootnet to assess whether differences in edge weights were statistically significant, based on non-overlapping 95% CIs.39,42
Network Comparison
We compared the network characteristics differences between CVD and Non-CVD groups after PSM. Additionally, considering the influences of aforementioned covariates on depressive symptoms, we also compared network characteristics differences based on age (<60 years old vs ≥60 years old), gender (male vs female), marital status (married vs others), living residence (urban vs rural), educational level (elementary school and below vs others), comorbidity (no vs yes) in the CVD group.10,30,32,33 A Network Comparison Test (NCT) was conducted to assess differences in network structure and global strength between two networks, using 1000 permutations as recommended previously.21,30 Holm-Bonferroni correction was used to control multiple tests between two networks. All tests were performed using R package Network Comparison Test.43
Results
A total of 15234 participants were included in the final analyses, consisting of 1643 (10.8%) individuals with CVD, 13591 (89.2%) individuals without CVD. Before PSM, the two groups exhibited significant demographic differences. After PSM, the CVD and Non-CVD groups each consisted of 1643 participants. There were no significant differences in age, gender, marital status, living residence, educational level, and comorbidities (all P ≥ 0.52). The CVD group showed significantly higher depression prevalence (P < 0.0001) and lower life satisfaction (P = 0.004). With the exception of “HOPEFUL” (P = 0.07), the CVD group exhibited significantly higher mean levels of other depressive symptoms compared to the Non-CVD group (all P ≤ 0.005) (Tables 1 and 2).
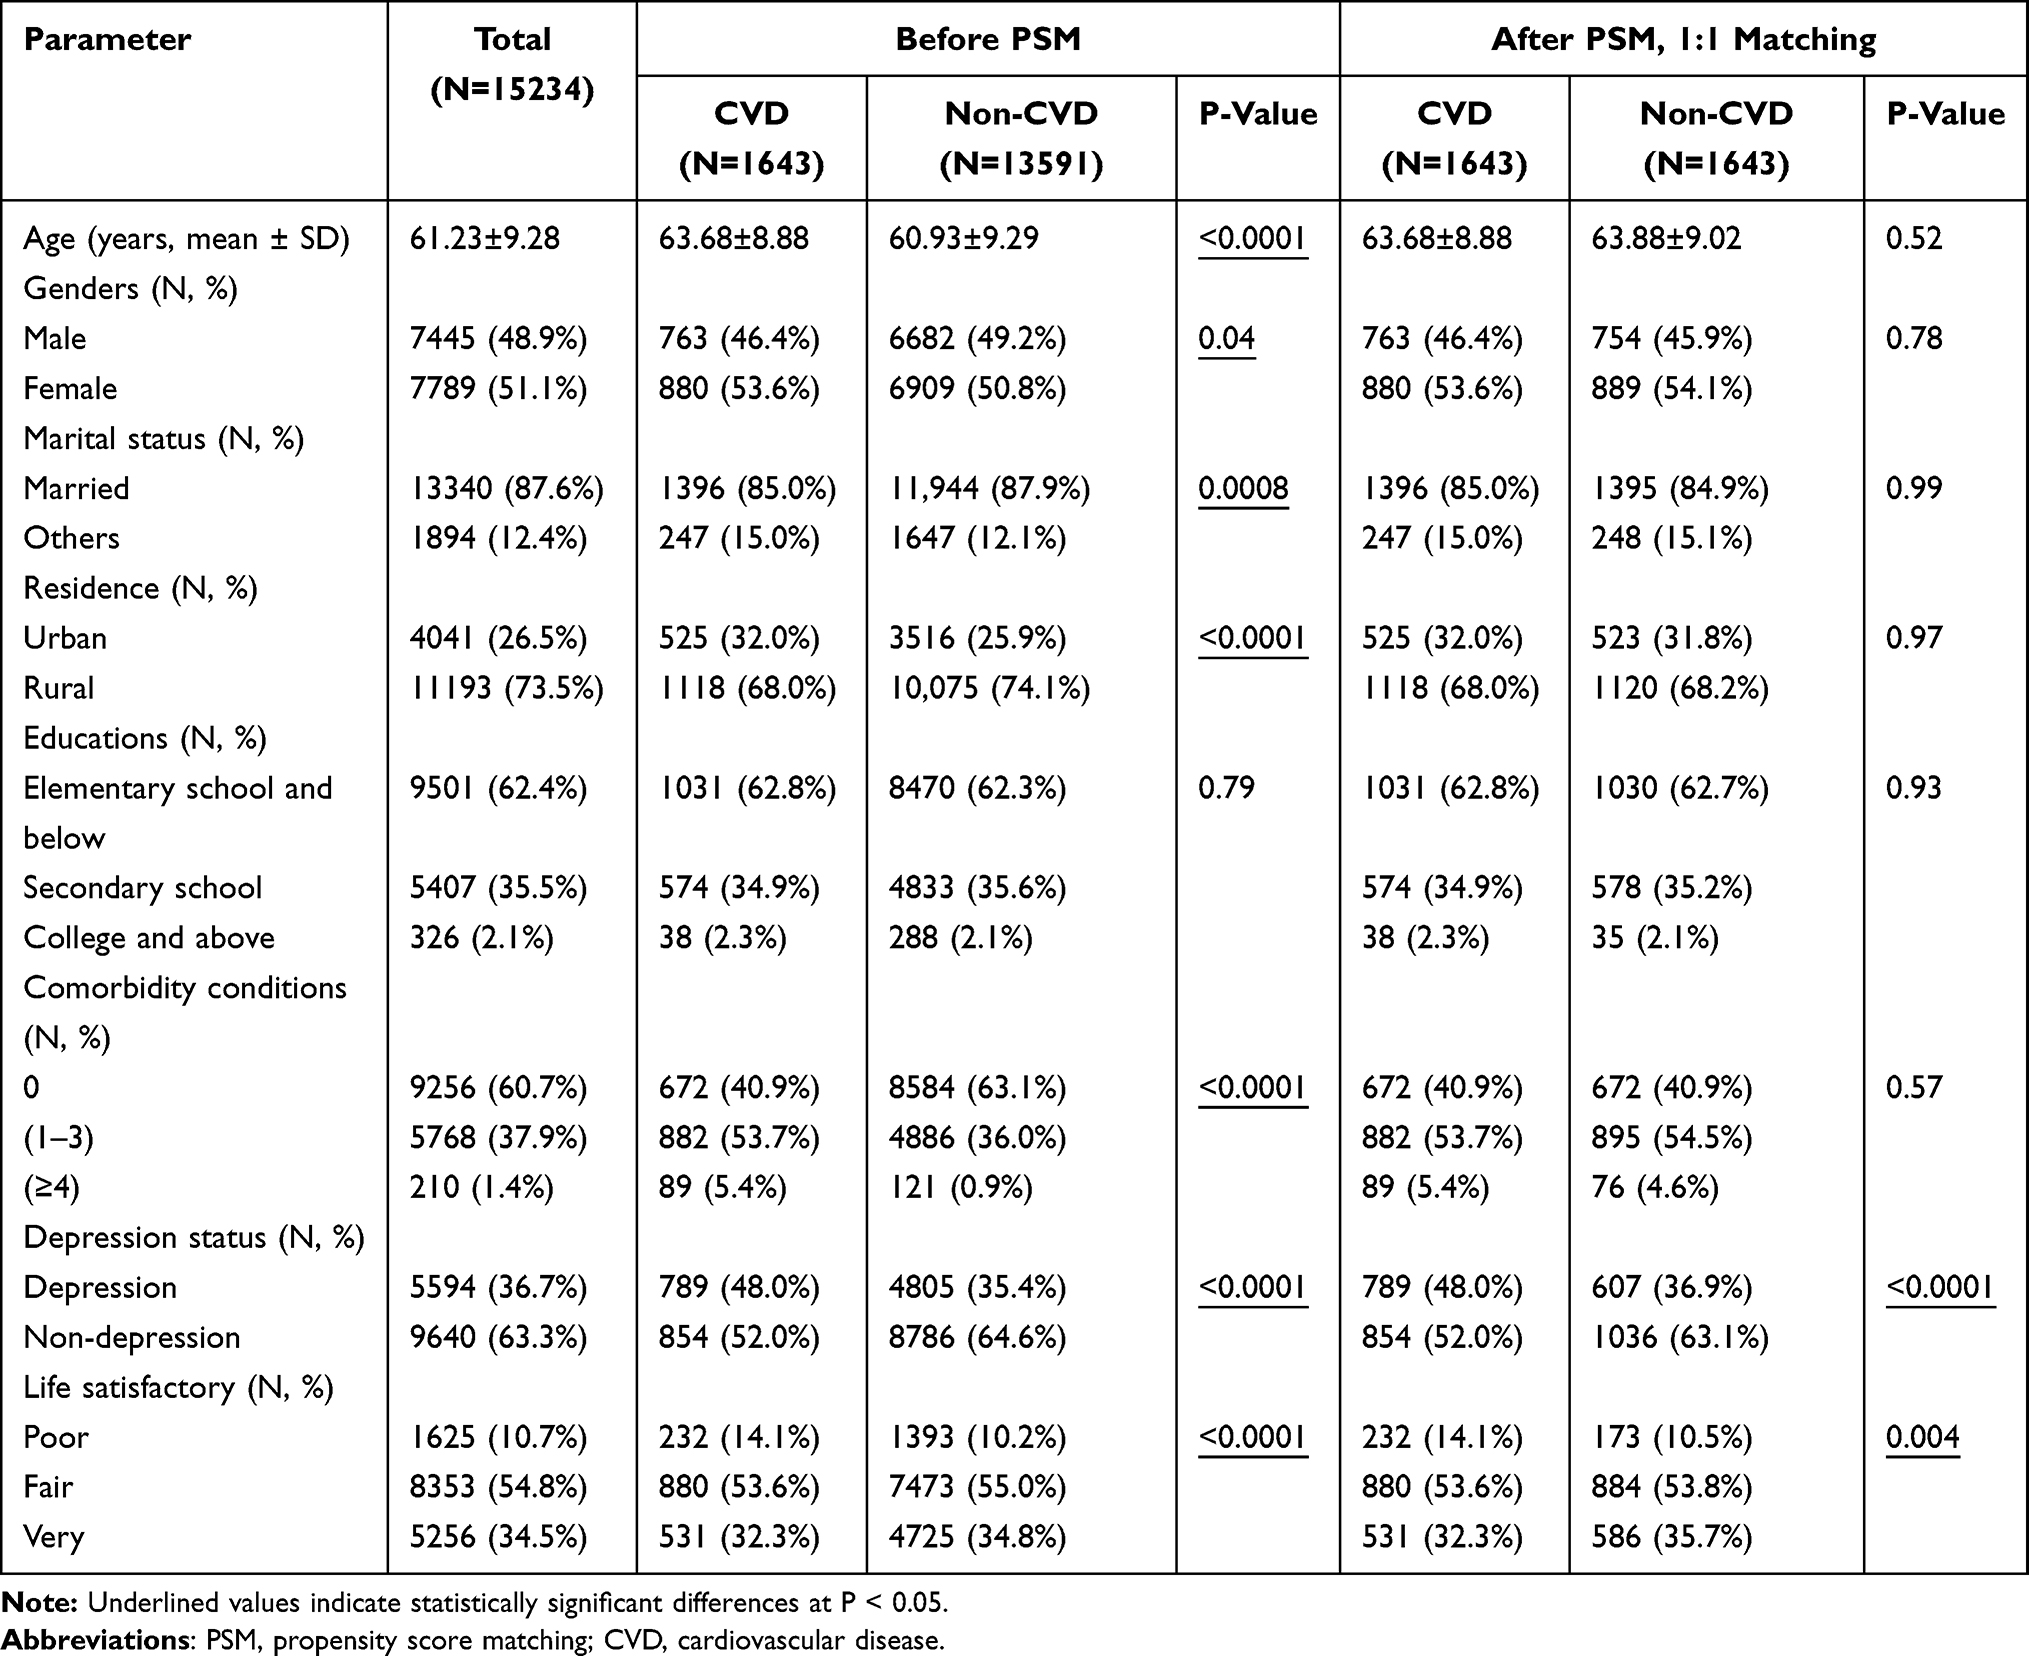 |
Table 1 Baseline Characteristics Before and After PSM |
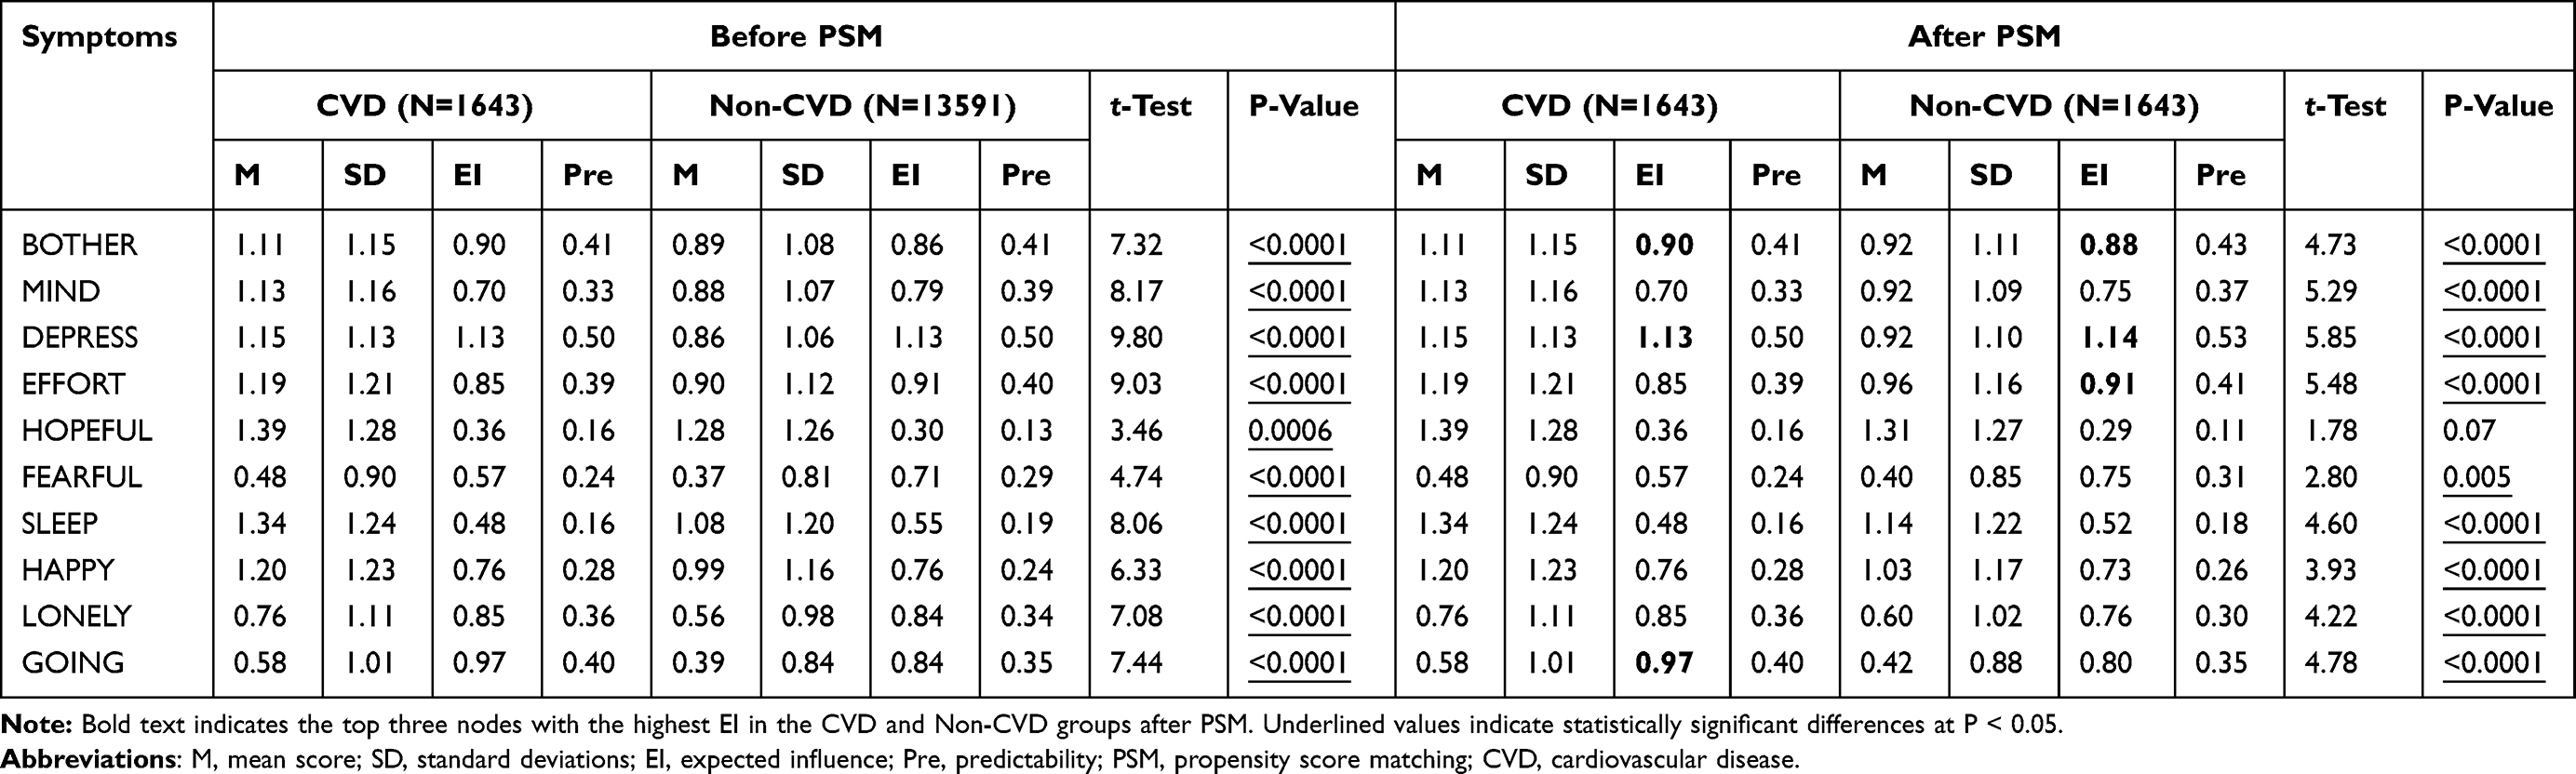 |
Table 2 Mean, Standard Deviation, Expected Influence, Predictability of Depressive Symptoms in CVD and Non-CVD Groups Before and After PSM |
Network Description in CVD and Non-CVD Group After PSM
The mean, SD, EI, predictability of each depressive symptoms for both CVD and Non-CVD groups were presented in Table 2. Network models of depressive symptoms were shown in Figure 2. The mean predictability values for the CVD and Non-CVD groups were 0.322 and 0.324, respectively, and were represented by ring-shaped pie charts in this figure. The corresponding numbers of nonzero edges were 37/45 and 39/45, respectively, and the majority of edges being positive. The CVD group network model indicated that the top three nodes with the highest EI were DEPRESS (EI value = 1.13, z = 1.56), GOING (EI value = 0.97, z = 0.90), BOTHER (EI value = 0.90, z = 0.60). The connection HOPEFUL-HAPPY (weight = 0.35) was the strongest positive edge. This correlation should be interpreted cautiously because both items are positively worded and reverse scored in the CES-D-10. For Non-CVD group network model, the top three nodes with the highest EI were DEPRESS (EI value = 1.14, z = 1.71), EFFORT (EI value = 0.91, z = 0.67), and BOTHER (EI value = 0.88, z = 0.55). The connection BOTHER-DEPRESS (weight = 0.32) was the strongest positive edge (Table 2, Supplemental Table 1 and Figure 3). The bootstrapped 95% CI for all edge weights showed that the results were reliable and accurate (Supplemental Figure 1). The bootstrapped difference test were shown in Supplemental Figure 2. The case-dropping subset bootstrap procedure yielded that the CS-C value of EI and strength for all networks was computed to be 0.75 exceeding the recommended threshold and indicating robust centrality indices (Supplemental Figure 3).
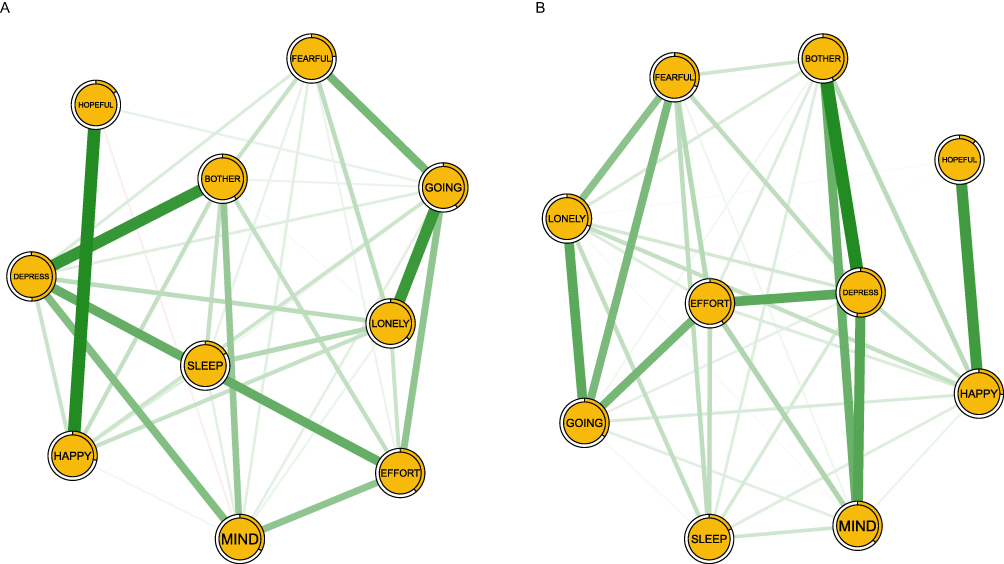 |
Figure 2 Network structures of depressive symptoms among CVD and Non-CVD groups. (A) Network structure of the CVD group after propensity score matching (n=1643). (B) Network structure of the Non-CVD group after propensity score matching (n=1643). Abbreviation: CVD, cardiovascular disease. |
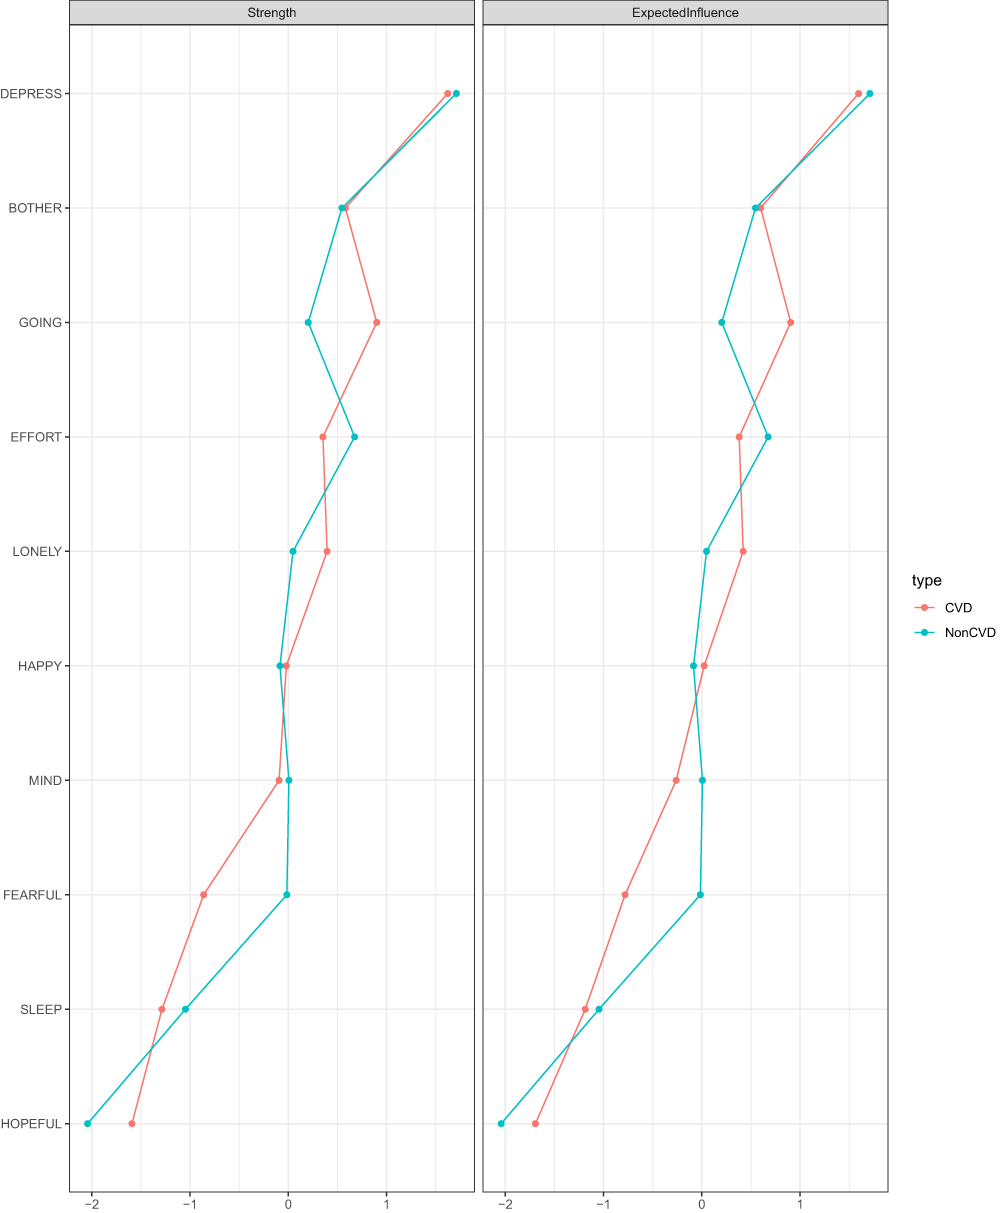 |
Figure 3 Centrality plot showing the strength and expected influence (z-scores) of each depressive symptom in the CVD and Non-CVD group networks after propensity score matching. Z-scores were calculated by subtracting the network-specific mean centrality value across symptoms from each symptom’s centrality value and dividing by the corresponding standard deviation. These standardized values reflect the relative importance of each symptom within its respective network, with higher z-scores indicating greater symptom centrality compared to other symptoms in the same network. Abbreviation: CVD, cardiovascular disease. |
The network comparison between CVD and Non-CVD group revealed no significant differences in global strength (S = 0.07, P = 0.72) or network structure (M = 0.08, P = 0.76) (Supplemental Figure 4).
Sub-Group Network Comparison in the CVD Group
No significant age (S = 0.08, M = 0.11, all P ≥ 0.67), gender (S = 0.0001, M = 0.09, all P ≥ 0.88), marital status (S = 0.37, M = 0.20, all P ≥ 0.09), living residence (S = 0.009, M = 0.12, all P ≥ 0.56), and educational level (S = 0.07, M = 0.11, all P ≥ 0.61) differences were observed in network global strength and structure among CVD patients. For comorbidity, the network global strength was significant (yes: 4.13 vs no: 3.69; S = 0.44, P = 0.008); however, the network structure was insignificant (M = 0.12, P = 0.47) (Figure 4 and Supplemental Figure 5).
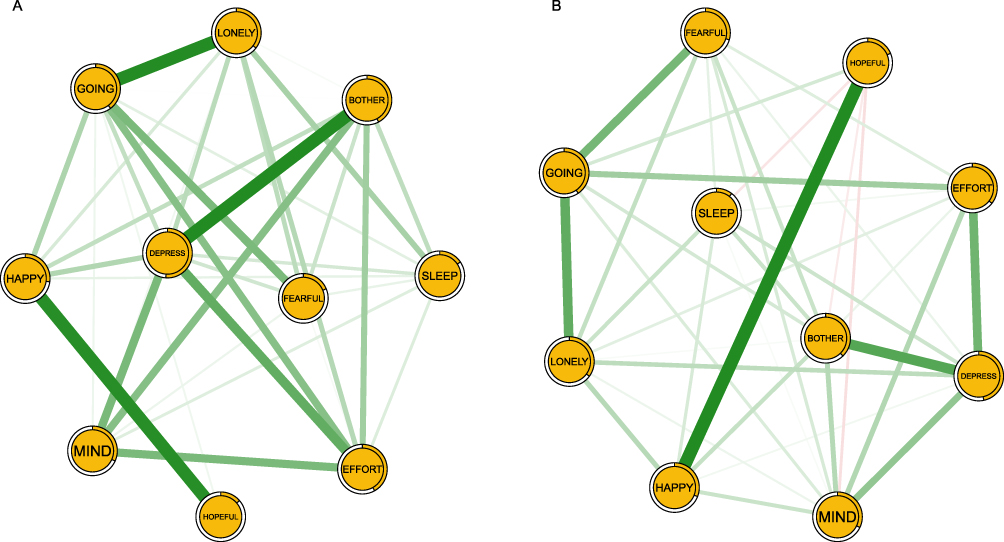 |
Figure 4 Network structures of depressive symptoms in CVD patients with and without comorbidity. (A) Network structure of the Comorbidity group. (B) Network structure of the Non-comorbidity group. Abbreviation: CVD, cardiovascular disease. |
Discussion
This study compared the prevalence and network structures of depressive symptoms between demographically matched CVD group and Non-CVD group, as well as conducted a comprehensive subgroup network analysis within the CVD group using data from CHARLS. We found that individuals with CVD exhibited a higher prevalence and greater severity of depressive symptoms and lower life satisfaction. In the CVD group, DEPRESS, GOING, and BOTHER were the most influential symptoms with the HOPEFUL-HAPPY connection showing the strongest positive association. In the Non-CVD group, DEPRESS, EFFORT, and BOTHER were the most influential symptoms and the connection BOTHER-DEPRESS was the strongest positive edge. Additionally, within the CVD group, network global strength was significantly higher among individuals with comorbidities compared to those without.
After applying PSM to reduce demographic differences between groups, the CVD group showed significantly higher prevalence and severity of depression compared to the Non-CVD group. These findings are largely consistent with previous studies showing that elevated depressive symptoms are significantly associated with CVD among middle-aged and older adults.9,10,18,44 Such associations may be explained by genetic factors, treatment-related effects of depression or CVD, and the increased physical and emotional burdens associated with heart disease.17 Notably, in our cohort, the prevalence of depression (48.0%) among individuals with CVD was relatively high, whereas this figure ranged 20%–35% in previous reports.9,10,25 This discrepancy may be attributed to several factors, including differences in assessment methods, measurement tools and cut-off criteria, timing of assessment, inclusion and exclusion criteria, as well as variations in regions and demographic characteristics.8,18,25 Taken together, these findings highlight the importance of assessing depression for early CVD detection and prevention.
From a network perspective, DEPRESS emerged as the most central symptom of depressive symptoms network in both groups, indicating its key role in the onset and maintenance of depressive symptoms. DEPRESS reflects negative affect, defined as feeling “upset or unpleasantly engaged rather than peaceful” and is the most characteristic and consistent symptom required for a depression diagnosis according to the DSM-5.12,13 Similarly, the central role of DEPRESS has been consistently observed across diverse elderly populations, including those with disabilities,45 hypertension,46 multimorbidity,26,47 those living alone,48 indicating its widespread prevalence in depressed older adults. These results may be explained by age-related increases physical impairments, psychosocial stressors, and comorbid illnesses in elderly, who are also less equipped to manage negative emotions, contributing to persistent depressed mood.20,47 The sudden onset and severity of the CVD, long-term physical impairment and treatment-related economic burden, also contribute to increased negative emotions such as depressed mood.25 Furthermore, the CVD can induce physiological changes including immune dysregulation, altered neuroplasticity, and elevated inflammatory markers, which underlie negative emotions.2 Thus, targeting the DEPRESS symptom through focused interventions may be a more effective strategy for reducing the risk of depression in older adults with or without CVD.
EFFORT emerged as an additional core symptom in the Non-CVD group, aligning with previous studies that identified “Everything was an effort” as a common depressive symptom among older adults across multiple countries, including the UK and China.22,49 In contrast, GOING (Could not get going) was another central symptom in CVD group. This finding was consistent with several depressed network analysis studies among older adults with multimorbidity, functional disabilities, and widowed elderly.26,45,50 EFFORT and GOING have similar meanings and as noted by Bradley et al, that both are the items of somatic retardation factor of the scale.51 The difference between them may be elderly with CVD encounter more challenges and burdens which may lead to feelings of powerlessness and the belief that life can no longer continue as usual.52 CVD, as a life threatening condition along with chronic illness, persistent pain, social functioning decline, may serve as negative stressors that cause older adults with CVD could not go on.2,26 Additionally, patients with heart disease often require dependency on family or friends and increased social support, thus insufficient support may increase their vulnerability to depression, leading to reduced motivation.25,26 Therefore, interventions targeting the central symptom “GOING” may be effective in managing depression among older adults with CVD.
The strong relationship between HOPEFUL and HAPPY in CVD group supports previous study finding that hopelessness about the future may foster the feeling of unhappiness.53 According to the hopelessness theory of depression, adverse life events like CVD may evoke feelings of helplessness, despair, and worthlessness in older adults, resulting in an unhappy mood.54 Elderly individuals with CVD are at increased subsequent risk of suicide attempt, and such hopelessness, can lead to avoidance of medical appointments and social interactions.2,26 These behaviors could reinforce hopelessness, thereby contributing to the onset of unhappiness.26 Notably, the two anhedonia symptoms (HOPEFUL and HAPPY) are more indicative of depression severity than of the presence and absence of depression.13 This may partly explain why this cluster appears relatively distinct, as individuals with CVD are more likely to exhibit severe depressive symptoms.10,18 Additionally, the strong correlation between HOPEFUL and HAPPY may partly reflect shared method variance due to their positive wording and reverse-scoring structure, rather than representing a unique psychopathological process. Therefore, this finding should be interpreted cautiously when considering its clinical or theoretical implications. Unlike the CVD group, the strong association between BOTHER and DEPRESS in the non-CVD group indicated that specific stressors such as chronic diseases, social isolation, and cognitive decline related to aging could contribute to negative feelings in older adults.
To the best of our knowledge, this is the first study to report significantly higher global strength in CVD individuals with comorbidities compared to those without. This finding indicates that comorbidity burden in older adults is associated with a more densely connected depressive symptom network, which may complicate depression management in CVD group. It is possible that comorbidities particularly diabetes, cancer, and chronic lung disease, are associated with chronic pain, physical limitations, and financial burden, intensifying feelings of hopelessness, helplessness, and loneliness, which may contribute to greater depressive symptom burden.55–57 Individuals with multimorbidity have twice the risk of depression compared to those with a single chronic illness, and three times the risk compared to those without any chronic physical illness.57 Moreover, a previous study applied network analysis to examine cognitive performance and depressive symptoms in older adults with multimorbidity, revealing a distinct symptom network in this population.26 Differences in edge weights among older adults with CVD across comorbidity subgroups highlight the need to consider comorbidity profiles when planning interventions. It should also be noted that network analysis based on cross-sectional data identifies statistical associations among symptoms rather than definitive causal relationships. Therefore, interpretations of symptom interactions and network connectivity should remain cautious.
Strengths and Limitations
The strengths of this study included the use of nationally representative data with a large sample size, application of PSM to balance sociodemographic characteristics across groups, and the employment of network analysis to comprehensively explore the depressive symptoms structures in individuals with and without CVD. However, several limitations should be noted. 1) This study was a cross-sectional study, thus the causal inferences and dynamic interactions between depression and CVD could not be determine. 2) Depressive symptoms were assessed using self-reported measures (CESD-10) rather than clinical diagnostic interviews, which may introduce potential bias. 3) We did not specifically examine different CVD phases, severity or subtypes, which may directly affect their depressive symptoms. 4) As the analysis was based on the CHARLS dataset only involving Chinese participants, generalizability to other populations may be limited.
Conclusions
This study highlighted the higher prevalence and severity of depression among middle-aged and older individuals with CVD, and distinct patterns of depressive symptom interactions compared to those without. Central symptoms identified within the network may represent important intervention targets for preventing and addressing depression in this population. Clinical strategies should also consider comorbidity-related differences in symptom expression. Future longitudinal studies are needed to confirm these structural associations and further clarify the temporal relationships among CVD, comorbidities, and depressive symptoms.
Abbreviations
CVD, Cardiovascular disease; CHD, Coronary heart disease; CHARLS, China Health and Retirement Longitudinal Study; CES-D-10, The 10-item Center for Epidemiologic Studies Depression Scale; PSM, Propensity score matching; SD, Standard deviation; EI, Expected influence; GGM, Gaussian Graphical Model; LASSO, Least absolute shrinkage and selection operator; EBIC, Extended Bayesian Information Criterion; CIs, Confidence intervals; CS-C, Correlation stability coefficients; NCT, Network Comparison Test.
Ethical Approval
All CHARLS investigations were approved by the Biomedical Ethics Review Committee of Peking University, Beijing, China (IRB00001052-11015). As this study was a secondary analysis of anonymized public-use data and did not involve direct interaction with human participants or access to identifiable private information, additional ethical approval was not required according to Article 32 of the Measures for Ethical Review of Life Science and Medical Research Involving Human Subjects (China, February 18, 2023), which exempts research using legally obtained public or anonymized data from further ethical review.
Acknowledgments
We thank all participants and staffs at the study sites for their cooperation. We wish to thank the reviewers for their insightful comments and suggestions.
Author Contributions
All authors made substantial contributions to conception and design, acquisition of data, or analysis and interpretation of data; took part in drafting the article or revising it critically for important intellectual content; agreed to submit to the current journal; gave final approval of the version to be published; and agree to be accountable for all aspects of the work.
Funding
This study is supported by the Guangdong Basic and Applied Basic Research on Fundamentals and Applied Fundamentals of Guangzhou University (Institute) Joint Funding Project (No.2024A03J1165), Guangzhou Health and Wellness Science and Technology Project (No. 20231A010021), and the National Natural Science Foundation of China (NSFC) (82570470).
Disclosure
The authors declare that they have no conflicts of interest.
References
1. United Nations DoEaSA. Population division. World Population Ageing 2019. United Nations; 2020.
2. Yang J, Zeng Y, Yang H, et al. Cardiovascular disease, genetic susceptibility, and risk of psychiatric disorders and suicide attempt: a community-based matched cohort study based on the uk biobank. J Am Heart Assoc. 2024;13(15):e031280. doi:10.1161/JAHA.123.031280
3. North BJ, Sinclair DA. The intersection between aging and cardiovascular disease. Circ Res. 2012;110(8):1097–13. doi:10.1161/CIRCRESAHA.111.246876
4. Wang Y, Wang X, Wang C, Zhou J. Global, regional, and national burden of cardiovascular disease, 1990–2021: results from the 2021 global burden of disease study. Cureus. 2024;16(11):e74333. doi:10.7759/cureus.74333
5. Writing Committee of the Report on Cardiovascular Health and Diseases in China. Report on cardiovascular health and diseases in China 2022: an updated summary. Biomed Environ Sci. 2023;36(8):669–701. doi:10.3967/bes2023.106
6. Wang W, Liu Y, Liu J, et al. Mortality and years of life lost of cardiovascular diseases in China, 2005–2020: empirical evidence from national mortality surveillance system. Int J Cardiol. 2021;340:105–112. doi:10.1016/j.ijcard.2021.08.034
7. Visseren FLJ, Mach F, Smulders YM, et al. 2021 esc guidelines on cardiovascular disease prevention in clinical practice. Eur Heart J. 2021;42(34):3227–3337. doi:10.1093/eurheartj/ehab484
8. Moise N, Khodneva Y, Richman J, Shimbo D, Kronish I, Safford MM. Elucidating the association between depressive symptoms, coronary heart disease, and stroke in black and white adults: the reasons for geographic and racial differences in stroke (regards) study. J Am Heart Assoc. 2016;5(8). doi:10.1161/JAHA.116.003767
9. van der Lingen ACJ, Rijnierse MT, Hooghiemstra AM, et al. The link between cardiac status and depression and anxiety in implantable cardioverter defibrillator patients: design and first results of the psyche-icd study. J Psychosom Res. 2023;167:111182. doi:10.1016/j.jpsychores.2023.111182
10. Li H, Zheng D, Li Z, et al. Association of depressive symptoms with incident cardiovascular diseases in middle-aged and older Chinese adults. JAMA Network Open. 2019;2(12):e1916591. doi:10.1001/jamanetworkopen.2019.16591
11. Levine GN, Cohen BE, Commodore-Mensah Y, et al. Psychological health, well-being, and the mind-heart-body connection: a scientific statement from the American heart association. Circulation. 2021;143(10):e763–e783. doi:10.1161/CIR.0000000000000947
12. Carleton RN, Thibodeau MA, Teale MJ, et al. The center for epidemiologic studies depression scale: a review with a theoretical and empirical examination of item content and factor structure. PLoS One. 2013;8(3):e58067. doi:10.1371/journal.pone.0058067
13. American Psychiatric Association. Dsm-5 Task Force. In: Dsm-5: Diagnostic and Statistical Manual of Mental Disorders.
14. Ren Y, Yang H, Browning C, Thomas S, Liu M. Prevalence of depression in coronary heart disease in China: a systematic review and meta-analysis. Chin Med J. 2014;127(16):2991–2998. doi:10.3760/cma.j.issn.0366-6999.20140036
15. Karami N, Kazeminia M, Karami A, Salimi Y, Ziapour A, Janjani P. Global prevalence of depression, anxiety, and stress in cardiac patients: a systematic review and meta-analysis. J Affect Disord. 2023;324:175–189. doi:10.1016/j.jad.2022.12.055
16. Polcwiartek C, Atwater BD, Kragholm K, et al. Association between ecg abnormalities and fatal cardiovascular disease among patients with and without severe mental illness. J Am Heart Assoc. 2021;10(2):e019416. doi:10.1161/JAHA.120.019416
17. Wium-Andersen MK, Wium-Andersen IK, Prescott EIB, Overvad K, Jorgensen MB, Osler M. An attempt to explain the bidirectional association between ischaemic heart disease, stroke and depression: a cohort and meta-analytic approach. Br J Psychiatry. 2020;217(2):434–441. doi:10.1192/bjp.2019.130
18. Harshfield EL, Pennells L, Schwartz JE, et al. Association between depressive symptoms and incident cardiovascular diseases. JAMA. 2020;324(23):2396–2405. doi:10.1001/jama.2020.23068
19. Fried EI, Nesse RM. Depression sum-scores don’t add up: why analyzing specific depression symptoms is essential. BMC Med. 2015;13(1):72. doi:10.1186/s12916-015-0325-4
20. Chen MY, Bai W, Zhang L, et al. Associations of tai chi with depression and anxiety among older adults: nationwide study findings from a network perspective. J Geriatr Psychiatry Neurol. 2025;38(4):241–253. doi:10.1177/08919887241313248
21. Cheung T, Jin Y, Lam S, et al. Network analysis of depressive symptoms in Hong Kong residents during the covid-19 pandemic. Transl Psychiatry. 2021;11(1):460. doi:10.1038/s41398-021-01543-z
22. Schlechter P, Ford TJ, Neufeld SAS. The development of depressive symptoms in older adults from a network perspective in the English longitudinal study of ageing. Transl Psychiatry. 2023;13(1):363. doi:10.1038/s41398-023-02659-0
23. Beard C, Millner AJ, Forgeard MJ, et al. Network analysis of depression and anxiety symptom relationships in a psychiatric sample. Psychol Med. 2016;46(16):3359–3369. doi:10.1017/S0033291716002300
24. Borsboom D, Cramer AO. Network analysis: an integrative approach to the structure of psychopathology. Annu Rev Clin Psychol. 2013;9(1):91–121. doi:10.1146/annurev-clinpsy-050212-185608
25. Zhao Q, Zhang Y, Ji L, Pan Z. Network analysis of anxiety and depressive symptoms among patients with cardiovascular disease. BMC Public Health. 2025;25(1):1085. doi:10.1186/s12889-025-22269-3
26. Zheng T, Zheng X, Xue B, Xiao S, Zhang C. A network analysis of depressive symptoms and cognitive performance in older adults with multimorbidity: a nationwide population-based study. J Affect Disord. 2025;383:78–86. doi:10.1016/j.jad.2025.04.122
27. Zhao Y, Hu Y, Smith JP, Strauss J, Yang G. Cohort profile: the China health and retirement longitudinal study (CHARLS). Int J Epidemiol. 2014;43(1):61–68. doi:10.1093/ije/dys203
28. Bjorgvinsson T, Kertz SJ, Bigda-Peyton JS, McCoy KL, Aderka IM. Psychometric properties of the ces-d-10 in a psychiatric sample. Assessment. 2013;20(4):429–436. doi:10.1177/1073191113481998
29. Clark LA, Watson D. Constructing validity: new developments in creating objective measuring instruments. Psychol Assess. 2019;31(12):1412–1427. doi:10.1037/pas0000626
30. Wang R, Su H, Xu T, et al. The association between urbanization and depression in the elderly: a network analysis from the complexity science perspective. J Affect Disord. 2024;356:72–79. doi:10.1016/j.jad.2024.04.026
31. Xie W, Zheng F, Yan L, Zhong B. Cognitive decline before and after incident coronary events. J Am Coll Cardiol. 2019;73(24):3041–3050. doi:10.1016/j.jacc.2019.04.019
32. Centers for Disease C Prevention. Current depression among adults-United States, 2006 and 2008. MMWR Morb Mortal Wkly Rep. 2010;59(38):1229–1235.
33. Jones DP, Wootton RE, Gill D, et al. Mental health as a mediator of the association between educational inequality and cardiovascular disease: a mendelian randomization study. J Am Heart Assoc. 2021;10(17):e019340. doi:10.1161/JAHA.120.019340
34. R Core Team. R: a language and environment for statistical computing. Msor Connections. 2022;1:1
35. Epskamp S, Cramer A, Waldorp L, Schmittmann V, Borsboom D. Qgraph: network visualizations of relationships in psychometric data. J Stat Softw. 2012;48(4):1–18. doi:10.18637/jss.v048.i04
36. Bringmann LF, Elmer T, Epskamp S, et al. What do centrality measures measure in psychological networks? J Abnorm Psychol. 2019;128(8):892–903. doi:10.1037/abn0000446
37. Epskamp S, Rhemtulla M, Borsboom D. Generalized network psychometrics: combining network and latent variable models. Psychometrika. 2017;82(4):904–927. doi:10.1007/s11336-017-9557-x
38. JMB Haslbeck, LJ Waldorp. Mgm: estimating time-varying mixed graphical models in high-dimensional data. J Stat Softw. 2020;93(8):1–46.
39. Epskamp S, Borsboom D, Fried EI. Estimating psychological networks and their accuracy: a tutorial paper. Behav Res Methods. 2018;50(1):195–212. doi:10.3758/s13428-017-0862-1
40. Bollen KA, Stine RA. Bollen ka, Stine RA. Bootstrapping goodness-of-fit measures in structural equation models. Sociol Method Res. 1992;21(2):205–229. doi:10.1177/0049124192021002004
41. Costenbader E, Valente TW. Costenbader e, valente tw. The stability of centrality measures when networks are sampled. Soc Netw. 2003;25(4):283–307. doi:10.1016/S0378-8733(03)00012-1
42. Epskamp S, Fried EI. Package ‘bootnet’. 2018. Available from: https://cran.R-project.Org/web/packages/bootnet/index.html.
43. van Borkulo CD, van Bork R, Boschloo L, et al. Comparing network structures on three aspects: a permutation test. Psychol Methods. 2023;28(6):1273–1285. doi:10.1037/met0000476
44. Yan R, Hu Y, Yang J, Wang H, Wang Y, Song G. Depressive symptoms trajectories and cardiovascular disease in Chinese middle-aged and older adults: a longitudinal cohort study. J Affect Disord. 2025;380:456–465. doi:10.1016/j.jad.2025.03.154
45. Zhang P, Wang L, Zhou Q, et al. A network analysis of anxiety and depression symptoms in Chinese disabled elderly. J Affect Disord. 2023;333:535–542. doi:10.1016/j.jad.2023.04.065
46. Ma H, Zhao M, Liu Y, Wei P. Network analysis of depression and anxiety symptoms and their associations with life satisfaction among Chinese hypertensive older adults: a cross-sectional study. Front Public Health. 2024;12:1370359. doi:10.3389/fpubh.2024.1370359
47. Fan HY, Sun HL, Feng Y, et al. Prevalence of depression and its network structure and association with quality of life in older adults with hypertension: findings of a national survey. Psychogeriatrics. 2025;25(3):e70034. doi:10.1111/psyg.70034
48. Chang Z, Zhang Y, Liang X, et al. A network analysis of depression and anxiety symptoms among Chinese elderly living alone: based on the 2017–2018 chinese longitudinal healthy longevity survey (clhls). BMC Psychiatry. 2025;25(1):28. doi:10.1186/s12888-024-06443-2
49. Bai W, Zhang J, Smith RD, et al. Inter-relationship between cognitive performance and depressive symptoms and their association with quality of life in older adults: a network analysis based on the 2017–2018 wave of Chinese longitudinal healthy longevity survey (clhls). J Affect Disord. 2023;320:621–627. doi:10.1016/j.jad.2022.09.159
50. Pan H, Liu Q. Difference of depression between widowed and non-widowed older people in China: a network analysis approach. J Affect Disord. 2021;280:68–76. doi:10.1016/j.jad.2020.11.058
51. Bradley KL, Bagnell AL, Brannen CL. Factorial validity of the center for epidemiological studies depression 10 in adolescents. Issues Ment Health Nurs. 2010;31(6):408–412. doi:10.3109/01612840903484105
52. Ziwei Z, Hua Y, Liu A. Bidirectional association between depressive symptoms and cardiovascular disease in the middle-aged and elderly Chinese: a 5-year longitudinal study. BMJ Open. 2023;13(7):e071175. doi:10.1136/bmjopen-2022-071175
53. Eli B, Zhou Y, Chen Y, Huang X, Liu Z. Symptom structure of depression in older adults on the qinghai-Tibet plateau: a network analysis. Int J Environ Res Public Health. 2022;19(21):13810. doi:10.3390/ijerph192113810
54. Abramson LY, Metalsky GI, Alloy LB. Hopelessness depression: a theory-based subtype of depression. Psychol Rev. 1989;96(2):358–372. doi:10.1037/0033-295X.96.2.358
55. Hairi NN, Cumming RG, Blyth FM, Naganathan V. Chronic pain, impact of pain and pain severity with physical disability in older people--is there a gender difference? Maturitas. 2013;74(1):68–73. doi:10.1016/j.maturitas.2012.10.001
56. Treede RD, Rief W, Barke A, et al. Chronic pain as a symptom or a disease: the IASP classification of chronic pain for the international classification of diseases (icd-11). Pain. 2019;160(1):19–27. doi:10.1097/j.pain.0000000000001384
57. Jiang CH, Zhu F, Qin TT. Relationships between chronic diseases and depression among middle-aged and elderly people in China: a prospective study from CHARLS. Curr Med Sci. 2020;40(5):858–870. doi:10.1007/s11596-020-2270-5
 © 2026 The Author(s). This work is published and licensed by Dove Medical Press Limited. The
full terms of this license are available at https://www.dovepress.com/terms
and incorporate the Creative Commons Attribution
- Non Commercial (unported, 4.0) License.
By accessing the work you hereby accept the Terms. Non-commercial uses of the work are permitted
without any further permission from Dove Medical Press Limited, provided the work is properly
attributed. For permission for commercial use of this work, please see paragraphs 4.2 and 5 of our Terms.
© 2026 The Author(s). This work is published and licensed by Dove Medical Press Limited. The
full terms of this license are available at https://www.dovepress.com/terms
and incorporate the Creative Commons Attribution
- Non Commercial (unported, 4.0) License.
By accessing the work you hereby accept the Terms. Non-commercial uses of the work are permitted
without any further permission from Dove Medical Press Limited, provided the work is properly
attributed. For permission for commercial use of this work, please see paragraphs 4.2 and 5 of our Terms.
Recommended articles
Understanding Comorbidity Between Non-Suicidal Self-Injury and Depressive Symptoms in a Clinical Sample of Adolescents: A Network Analysis
Niu S, Yin X, Pan B, Chen H, Dai C, Tong C, Chen F, Feng X
Neuropsychiatric Disease and Treatment 2024, 20:1-17
Published Date: 4 January 2024
The Inter-Relationships Between Depressive Symptoms and Suicidality Among Macau Residents After the “Relatively Static Management” COVID-19 Strategy: A Perspective of Network Analysis
Lam MI, Cai H, Chen P, Lok KI, Chow IHI, Si TL, Su Z, Ng CH, An FR, Xiang YT
Neuropsychiatric Disease and Treatment 2024, 20:195-209
Published Date: 3 February 2024
Intrinsic Association Between Death Anxiety and Depression Among Men Living with HIV/AIDS in China: A Network Analysis
Zheng C, Liang L, Kiyum M, Yuan T, Fei J, Wang H, Gao J, Liu X, Mei S, Du N
Psychology Research and Behavior Management 2024, 17:4073-4085
Published Date: 29 November 2024
Prevalence and Risk Factors of Cardiovascular Disease in Rheumatoid Arthritis Patients: A Comparative Analysis of Real-World Data
Tekeoglu S
International Journal of General Medicine 2024, 17:5859-5868
Published Date: 6 December 2024
Family Functioning, Anxiety and Depression in Chinese Higher Vocational School Students: A Network Analysis
Ye L, Chen S, Chen QW, Luo X
Psychology Research and Behavior Management 2024, 17:4399-4412
Published Date: 25 December 2024