
Back to Journals » International Journal of Chronic Obstructive Pulmonary Disease » Volume 21
Diagnostic Value of Bilateral Pectoralis Major Total Cross-Sectional Area in Patients with AECOPD Complicated by Malnutrition
Authors Lu Q  , Wang L, Pei D, Jiang X, Liu L, Yue L
Received 12 April 2026
Accepted for publication 4 June 2026
Published 12 June 2026 Volume 2026:21 616277
DOI https://doi.org/10.2147/COPD.S616277
Checked for plagiarism Yes
Review by Single anonymous peer review
Peer reviewer comments 2
Editor who approved publication: Prof. Dr. Zijing Zhou
Qin Lu,1,* Lu Wang,2,* Dong Pei,1 Xianqin Jiang,1 Lu Liu,1 Longfei Yue1
1Department of General Medicine, People’s Hospital of Anshun, Guizhou, People’s Republic of China; 2Department of Medical Imaging, People’s Hospital of Anshun, Guizhou, People’s Republic of China
*These authors have contributed equally to this work
Correspondence: Longfei Yue; Lu Liu, Email [email protected]; [email protected]
Introduction: Patients with acute exacerbations of chronic obstructive pulmonary disease (AECOPD) often suffer from malnutrition, and traditional assessment methods struggle to fully capture muscle loss. The value of total pectoralis major area (tPMA) measured by CT remains to be determined. This study aimed to investigate the relationship between tPMA and malnutrition in patients with AECOPD and its diagnostic value.
Methods: A total of 123 patients with AECOPD were enrolled (35 in the malnutrition group and 88 in the non-malnutrition group). Clinical and imaging parameters were compared between the two groups. Logistic regression analysis was used to assess the independent association between tPMA and malnutrition, and ROC curves were employed to evaluate its diagnostic performance when used alone or in combination with albumin (ALB) or total protein (TP). Spearman correlation analysis was used to examine the relationship between tPMA and other nutritional and disease severity indicators.
Results: tPMA levels were significantly lower in the malnourished group than in the non-malnourished group (P < 0.01). tPMA was a protective factor against malnutrition in patients with AECOPD (OR = 0.998, P < 0.001); this association remained statistically significant after adjusting for confounding factors (P < 0.05). The AUC of tPMA for the standalone diagnosis of malnutrition was 0.770; when combined with ALB or TP, the AUC increased to 0.901 and 0.916, respectively (P < 0.05). tPMA was positively correlated with nutritional indicators and negatively correlated with the NRS2002 and CAT (P < 0.05).
Discussion: tPMA is an independent associated factor against malnutrition in patients with AECOPD; when combined with ALB or TP, it significantly improves diagnostic performance and can serve as an objective adjunctive assessment indicator.
Keywords: acute exacerbation of chronic obstructive pulmonary disease, malnutrition, pectoralis major cross-sectional area, muscle loss, computed tomography
Introduction
Chronic Obstructive Pulmonary Disease (COPD) is one of the most common chronic respiratory diseases.1 It is characterized by structural changes in the airways and/or alveoli, leading to persistent airflow limitation. Acute exacerbation of chronic obstructive pulmonary disease (AECOPD) typically refers to worsening clinical symptoms.2 Repeated acute exacerbations intensify inflammation, cause significant decline in lung function, and further accelerate disease progression while increasing treatment difficulty. The World Health Organization projects that by 2030, COPD will become the third leading cause of death globally.3 Additionally, COPD is strongly associated with extrapulmonary comorbidities such as heart disease, osteoporosis, diabetes, and muscle wasting.4,5 AECOPD represents a critical event in disease progression, significantly increasing morbidity and mortality. Its inflammatory state also induces systemic effects, particularly muscle wasting and malnutrition, further worsening patient prognosis.6 The prevalence of malnutrition among AECOPD patients reaches 30%-60%.7 When AECOPD is complicated by malnutrition, the mortality risk nearly triples, closely associated with adverse outcomes including higher acute exacerbation risk and mortality,8–10 while also imposing substantial economic burdens. Therefore, early identification and intervention of nutritional risk in AECOPD patients are crucial for improving clinical outcomes.
Currently, we generally diagnose malnutrition using the Global Leadership Initiative on Malnutrition (GLIM). The diagnosis of malnutrition is based on the GLIM diagnostic criteria, which require at least one clinical criterion—such as unintentional weight loss, low BMI, or reduced muscle mass—and one etiological criterion—such as reduced food intake, inflammation, or a disease state. Because patients with AECOPD have chronic inflammation, which can be considered consistent with etiological criteria, some AECOPD studies use a body mass index cutoff of 18.5 kg/m2 to diagnose malnutrition.11,12 However, BMI is typically influenced by multiple factors. For instance, AECOPD combined with heart failure and chronic kidney disease increases fluid retention, leading to fluid overload and weight gain that does not accurately reflect nutritional status.13 Traditional nutritional assessment tools like BMI may fail to comprehensively capture the complex body composition changes and occult muscle wasting observed in AECOPD patients.14 This has prompted researchers to seek more precise, objective, and readily accessible indicators for assessing nutritional status in COPD patients. One study demonstrated that the Pectoralis Major Cross-sectional Area (PMA), quantified via computed tomography (CT) at the level of the aortic arch during total inspiration, outperforms BMI in evaluating muscle wasting.15 PMA can be conveniently measured via routine chest CT scans and plays a crucial role in assessing muscle mass and atrophy in COPD patients.16 Research has confirmed that PMA is a crucial indicator for assessing total body muscle mass and is negatively correlated with declining lung function and emphysema severity in COPD patients.15,17 Therefore, pectoralis major cross-sectional area is considered a promising alternative indicator for evaluating the overall nutritional status and disease severity in patients with acute exacerbation of COPD (AECOPD).17,18
Although previous studies have demonstrated an association between pectoralis major area and overall COPD severity,17,18 and low skeletal muscle area has been established as a prognostic marker for mortality in various patient populations,19 detailed investigations into its relationship with the specific risk of malnutrition in patients with AECOPD remain relatively limited. First, previous studies have primarily used PMA as a prognostic indicator for mortality or the frequency of acute exacerbations, rather than assessing its diagnostic value for malnutrition as an independent, treatable outcome. Second, although biochemical markers (albumin, total protein) are commonly used for nutritional assessment in patients with AECOPD, their diagnostic accuracy is limited by confounding factors associated with acute-phase inflammation; and the added value of combining CT muscle measurements with these traditional markers has not yet been quantified. Third, during acute exacerbations, the potential synergistic effects of combining structural muscle reserves (tPMA) with functional protein markers (ALB/TP) that reflect complementary pathophysiological dimensions have not yet been explored.
Therefore, this retrospective study aims to achieve three specific objectives: (1) to investigate the association between bilateral tPMA and malnutrition in hospitalized patients with AECOPD; (2) to assess whether tPMA provides additional diagnostic value beyond existing clinical and biochemical markers; and (3) to evaluate the diagnostic performance of a multimodal model combining tPMA with serum albumin or total protein. We propose the following hypotheses: (a) after adjusting for confounding factors, tPMA is independently associated with malnutrition; (b) a combined assessment approach yields superior discriminatory ability compared to a single-test approach; (c) this multimodal approach aligns with the conceptual framework of comprehensive nutritional assessment by simultaneously addressing both structural and functional dimensions. These findings may provide a basis for developing comprehensive nutritional screening protocols for AECOPD patients in acute care settings.
Method
Study Design and Subjects
This study employed a retrospective cohort design to investigate the relationship between tMPA and malnutrition in patients with AECOPD. The study recruited patients with AECOPD who were hospitalized at Anshun People’s Hospital between December 2022 and August 2023 (identified based on consecutive admission records and ICD-10 codes). Inclusion criteria:6 (1) Met the diagnostic criteria for AECOPD:20 According to the Global Initiative for Chronic Obstructive Lung Disease (GOLD) 2023 guidelines, AECOPD is defined as an acute exacerbation of respiratory symptoms (dyspnea, cough, and/or sputum production) that exceeds the range of normal daily fluctuations and requires escalation of treatment or hospitalization. The severity of the acute exacerbation was classified as moderate (requiring systemic corticosteroids and/or antibiotics in an outpatient or emergency setting) or severe (requiring evaluation in the emergency department or hospitalization); (2) Age ≥ 45 years; (3) Alert and oriented with normal communication ability; (4) Chest CT scan completed within 72 hours of admission. Exclusion criteria: (1) Missing height or weight data preventing BMI calculation; (2) Patients with other pulmonary diseases, such as bronchial asthma, bronchiectasis, and lung cancer; (3) Patients with psychiatric disorders or cognitive impairment; (4) Patients with organic diseases (including severe liver or kidney failure, malignant tumors); (5) Patients who did not undergo a chest CT scan or whose CT image quality was insufficient to assess muscle mass-related indicators; (6) Patients who were lost to follow-up. This study was approved by the hospital’s Institutional Review Board (Ethics No.: 2023 Specialty 1), and all patients provided informed consent and participated voluntarily. The study protocol complied with the Declaration of Helsinki.
Malnutrition is defined as a body mass index (BMI) <18.5 kg/m2, calculated based on height and weight measured within 24 hours of admission. We acknowledge that this definition represents a simplified operational criterion and does not fully align with the Global Leadership Initiative on Malnutrition (GLIM) criteria—which require the simultaneous fulfillment of phenotypic criteria (weight loss, reduced muscle mass, low BMI) and etiological criteria (reduced food intake, disease burden/inflammation). Due to the retrospective nature of this study, a comprehensive GLIM assessment (including history of weight change, direct quantification of muscle mass via other methods, and evaluation of systemic inflammation) was not feasible; this constitutes a methodological limitation that may result in the misclassification of patients with normal BMI but sarcopenia.
Data Collection
The study collected baseline demographic data (gender, age), smoking history, height, body mass index (BMI), comorbidities (hypertension, coronary heart disease, diabetes), COPD duration, number of AECOPD episodes, and clinical indicators during hospitalization.
General Information
Collected data included gender, age, smoking status, body mass index (BMI), mid-arm circumference (MAC), calf circumference (CC), comorbidities, NRS2002 score, disease duration, number of acute exacerbations within the past year, CAT score, and mMRC grading for all study subjects.6
During hospitalization, all patients underwent pulmonary function testing. Data collected included forced vital capacity (FVC), forced expiratory volume in 1 second (FEV1), and FEV1%/pre (FEV1 as a percentage of predicted value). Participants were classified according to the Global Initiative for Chronic Obstructive Lung Disease (GOLD) criteria: GOLD Stage 2 (50% ≤ FEV1%/pre < 80%), GOLD Stage 3 (30% ≤ FEV1%/pre < 50%), and GOLD Stage 4 (FEV1%/pre < 30%).
The smoking index (SI) reflected smoking history = number of packs smoked per day × number of years smoked (pack-years).
Comorbidities: Collect self-reported baseline medical history at admission (hypertension [HT], diabetes mellitus [DM], coronary heart disease [CHD]).
BMI Measurement: Instruct patients to measure height and weight on the morning of the second day after admission, after emptying bowels and bladder, wearing light clothing and without shoes. Take two measurements and calculate the average. BMI = weight (kg) / height2 (m2).
MAC measurement: With both upper limbs hanging naturally, measure the circumference at the midpoint between the acromion and olecranon process on the non-dominant side using a tape measure. Take two measurements and calculate the average. CC measurement: With the subject standing naturally with feet shoulder-width apart, measure the circumference at the thickest part of the non-dominant calf using a tape measure. Take two measurements and calculate the average.
NRS2002 Assessment Scale: Trained personnel from the Nutrition Department of Anshun People’s Hospital administered standardized questionnaires to all subjects during on-site surveys. NRS2002 total score = Disease Status + Nutritional Status + Age. A score ≥3 indicates malnutrition risk, while <3 indicates no malnutrition risk.
Pectoralis Major Muscle Cross-Sectional Area (PMA) Measurement
All patients underwent volume scanning, thin-slice imaging, and chest CT scans in the supine position during both full inspiration and expiration. CT images were acquired using a first-generation dual-source CT scanner (Somatom Definition; Siemens Healthineers, Forchheim, Germany) in the craniocaudal direction with the following parameters: 140 kVp, 100 mA, 0.9–1 beam spacing, and slice thicknesses of 0.6 mm and 3 mm. The pectoralis major muscle cross-sectional area was measured from chest CT images. The PM cross-sectional area was quantified on a single axial chest CT slice at the apex of the aortic arch,17 including the left pectoralis major muscle cross-sectional area (Left PMA), right pectoralis major muscle cross-sectional area (Right PMA), and the total bilateral pectoralis major muscle cross-sectional area (tPMA) calculated as their sum. PMA quantification was performed using Aquarius iNtuition software (TeraRecon Inc., Durham, NC). The total area of bilateral PM (in cm2) was quantified by an experienced radiologist who was blinded to the diagnoses and outcomes of all subjects.
Other Clinical Biochemical Indicators
Peripheral venous blood was drawn from all subjects under fasting conditions for complete blood count (CBC) and biochemical testing. Collected blood samples were transported to the Anshun People’s Hospital Laboratory within 2 hours for analysis of white blood cells (WBC), neutrophils (NEUT), lymphocytes (LY), monocytes (MONO), platelet count (PLT), hemoglobin (Hb), serum total protein (TP), serum albumin (ALB), and C-reactive protein (CRP). The following indices were calculated: neutrophil-to-lymphocyte ratio (NLR), lymphocyte-to-monocyte ratio (LMR), platelet-to-lymphocyte ratio (PLR), and Prognosis Nutrition Index (PNI). PNI = Serum Albumin + 5 × Lymphocyte Count.
All subjects underwent arterial blood gas analysis using the first blood sample drawn from the radial artery after admission, while resting quietly without supplemental oxygen. Parameters collected included pH, PaO2, and PaCO2.
Statistical Analysis
The distribution of continuous variables was assessed using the Shapiro–Wilk test. Variables with a skewed distribution (P < 0.05) were expressed as the median (interquartile range), and intergroup comparisons were performed using the Mann–Whitney U-test; variables with a normal distribution were expressed as the mean ± standard deviation, and comparisons were performed using the independent samples t-test; categorical variables were compared using the chi-square test or Fisher’s exact test.
We used univariate logistic regression analysis to assess the factors associated with malnutrition in patients with AECOPD and calculated the odds ratios (OR) and their 95% confidence intervals (CI). Multivariate logistic regression was used to evaluate the independent association between the tPMA and malnutrition. To address potential multicollinearity among nutritional parameters (tPMA index, MAC, CC, ALB, TP), we calculated the variance inflation factor (VIF) for each predictor variable; variables with a VIF value >5 were considered to have moderate multicollinearity and were therefore addressed by simplifying the model. To avoid overfitting, we monitored the event-to-variable ratio (EPV) for each variable; the final model ensured EPV ≥ 10 by limiting the number of predictor variables. Standardized odds ratios (per standard deviation increase) were calculated for continuous predictor variables to facilitate clinical interpretation. Model calibration was assessed using the Hosmer-Lemeshow goodness-of-fit test.
The Spearman rank correlation coefficient was used to assess the bivariate association between the tPMA index and clinical parameters. To address the issue of multiple comparisons, the Bonferroni correction was applied; the corrected significance threshold was set at α = 0.05/n (where n represents the number of pairwise tests conducted). The interpretation criteria for correlation coefficients were as follows: |r| < 0.30 indicates a weak correlation, 0.30–0.50 indicates a moderate correlation, and >0.50 indicates a strong correlation.
Using receiver operating characteristic (ROC) curve analysis, we evaluated the diagnostic performance of the tPMA index, albumin (ALB), total protein (TP), and their combinations in predicting malnutrition. Combined models (tPMA + ALB; tPMA + TP) were constructed using predictive probabilities derived from multivariate logistic regression, with malnutrition status as the binary outcome variable. The areas under the curve (AUC) of the respective ROC curves were statistically compared using the DeLong test.
Statistical analyses were performed using Stata version 17.0. In the primary analyses, a two-sided P-value of <0.05 was considered statistically significant; the Bonferroni correction was used for multiple comparisons.
Result
Comparison of Baseline Characteristics and Clinical Indicators
This study included 123 patients with acute exacerbation of chronic obstructive pulmonary disease (AECOPD), comprising 35 patients in the malnutrition group and 88 in the non-malnutrition group. No statistically significant differences were observed between groups in gender, age, smoking history (pack-years), height, hypertension, coronary heart disease, diabetes, COPD duration, or frequency of AECOPD episodes (P>0.05), indicating comparable baseline characteristics (Table 1). However, significant differences existed in multiple nutrition-related indicators and disease severity measures. Compared with the non-malnourished group, the malnourished group exhibited significantly lower body mass index (BMI), mid-arm circumference (MAC), and calf circumference (CC) (P<0.01). The Nutrition Risk Screening 2002 (NRS2002) score was significantly elevated in the malnourished group (P<0.01), indicating higher nutritional risk.
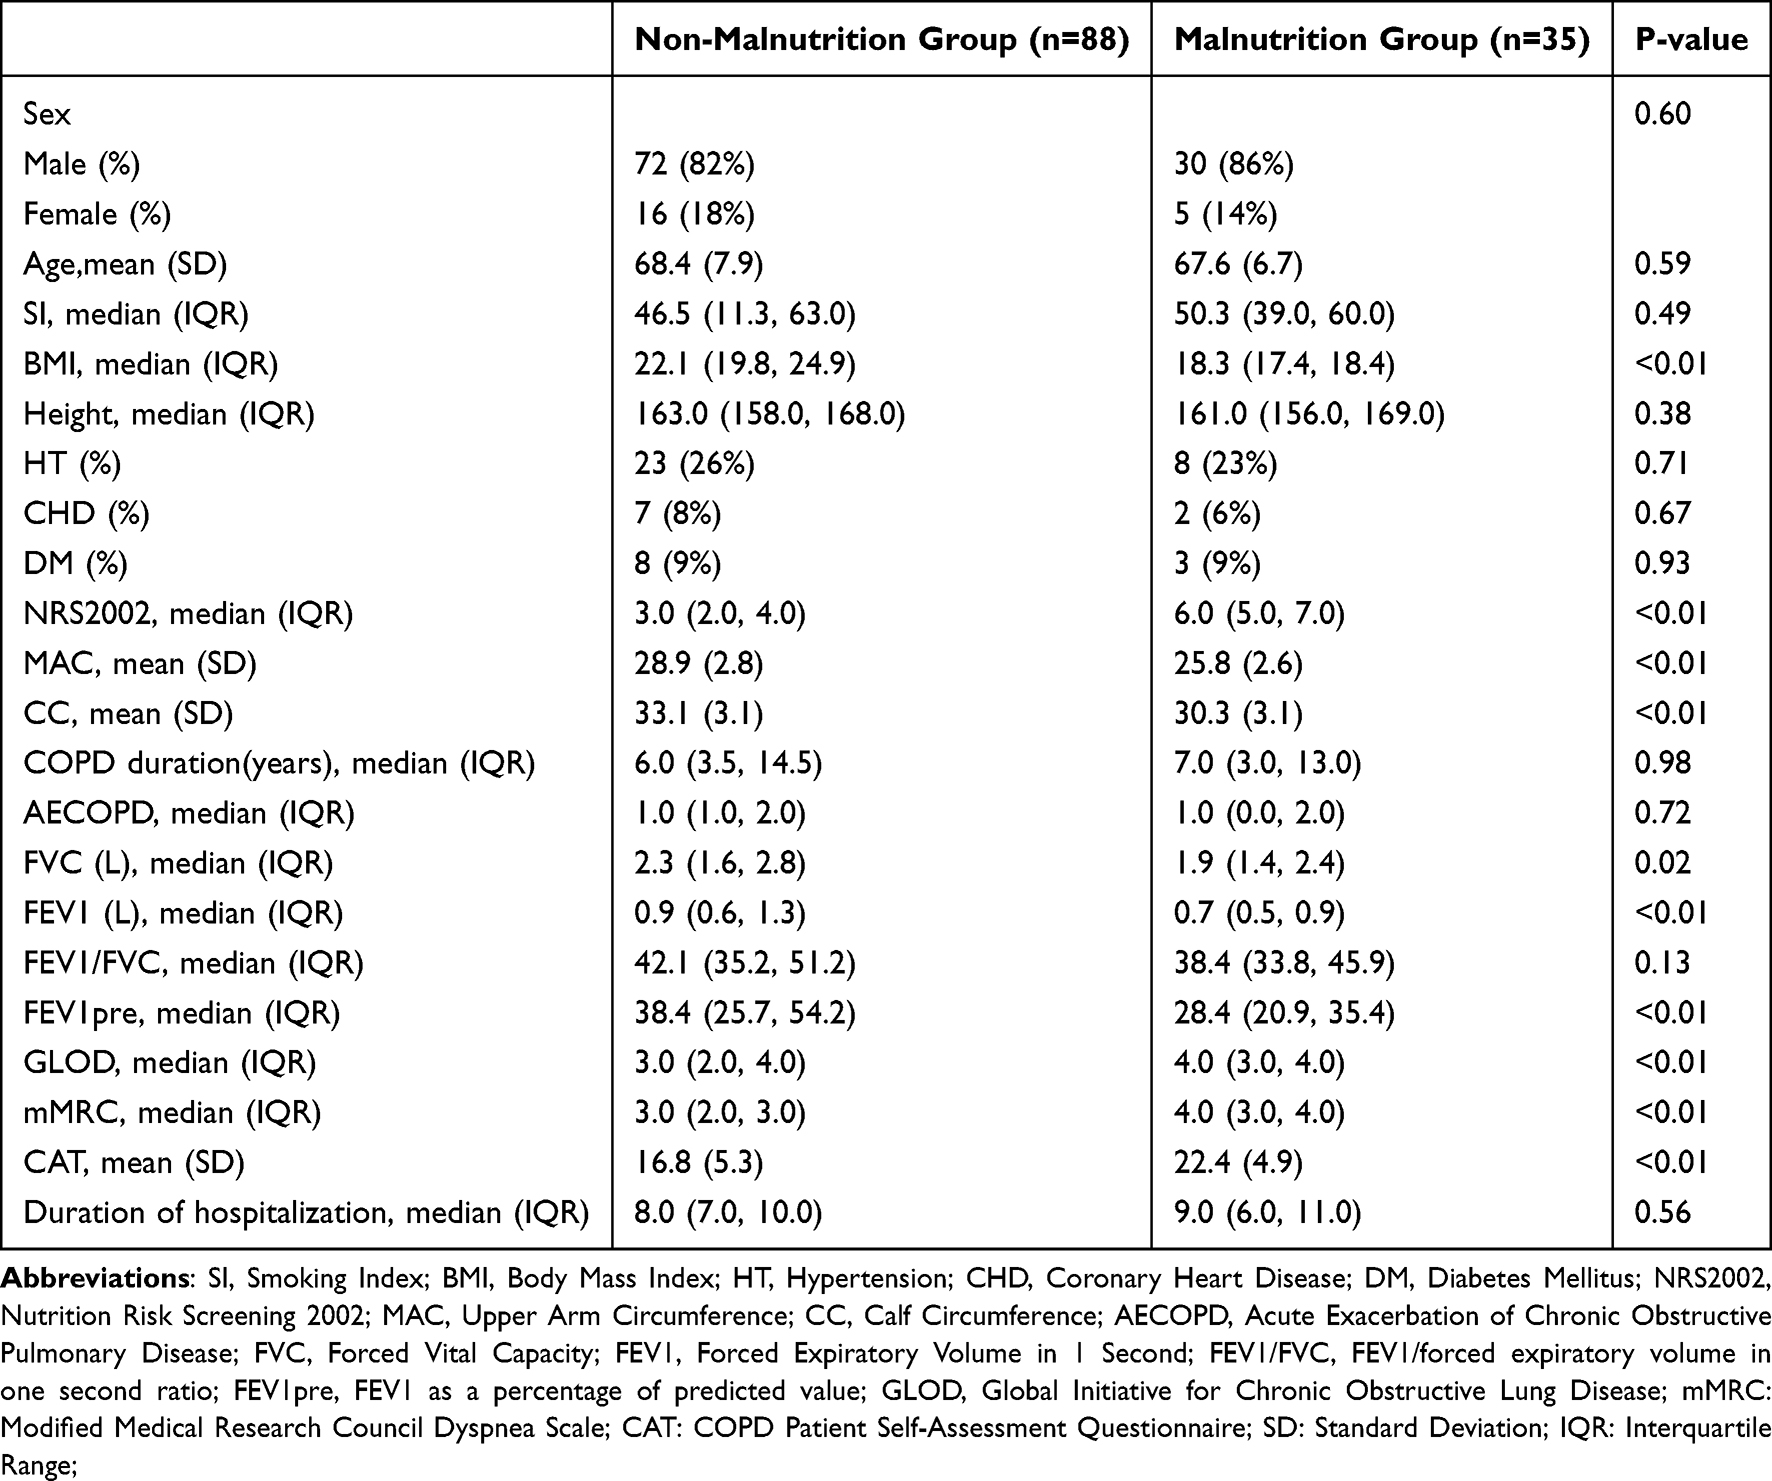 |
Table 1 Comparison of General Baseline Characteristics Between Groups |
In terms of pulmonary function, the forced vital capacity (FVC) and forced expiratory volume in one second (FEV1) were significantly lower in the malnourished group compared to the non-malnourished group (P<0.05), while the FEV1/FVC ratio and FEV1pre showed no statistically significant differences. Significant differences were also observed between the two groups in Global Initiative for Chronic Obstructive Lung Disease (GOLD) staging, modified Medical Research Council (mMRC) dyspnea scale scores, and COPD Assessment Test (CAT) scores. The malnourished group exhibited higher values for these indicators compared to the non-malnourished group (P<0.01), indicating more severe dyspnea and poorer disease control.
Regarding clinical biochemical indicators (Table 2), serum albumin (ALB) and total protein (TP) levels were significantly lower in the malnourished group compared to the non-malnourished group (P<0.01), while C-reactive protein (CRP) levels were significantly elevated (P<0.05). More importantly, the left pectoralis major muscle cross-sectional area (Left PMA), right pectoralis major muscle cross-sectional area (Right PMA), and total bilateral pectoralis major muscle cross-sectional area (tPMA) were significantly lower in the malnourished group than in the non-malnourished group (P<0.01).
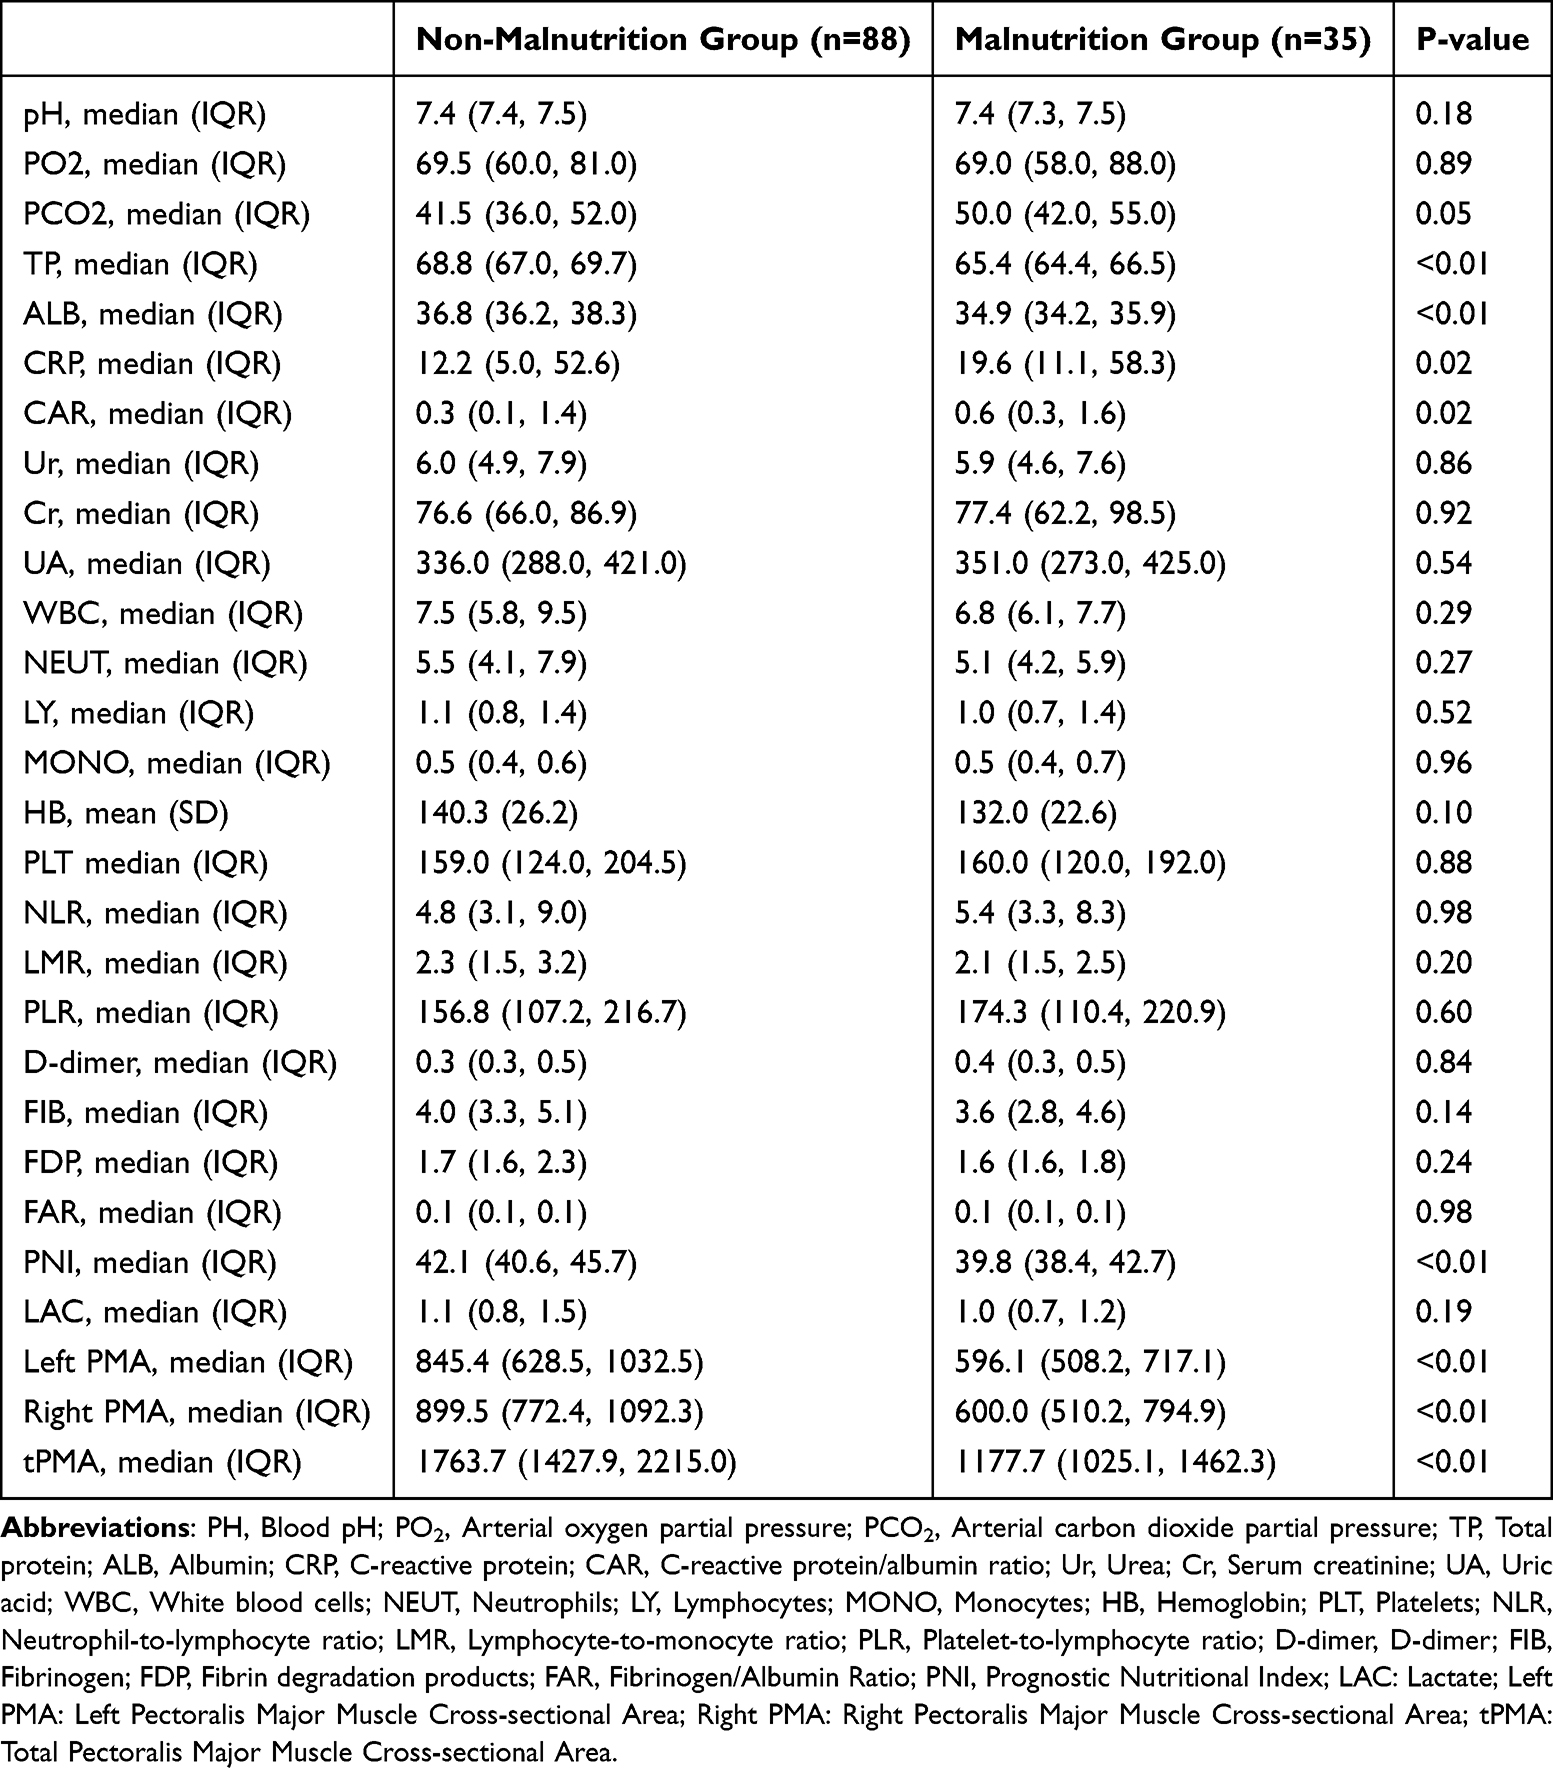 |
Table 2 Comparison of Clinical Indicators Between the Two Groups |
Risk Factors for Malnutrition in Patients with AECOPD
The results of the binary logistic regression analysis (Table 3) showed that multiple factors were significantly associated with the risk of malnutrition in patients with AECOPD. Upper arm circumference (MAC, OR=0.654, P<0.001), calf circumference (CC, OR=0.707, P<0.001), NRS2002 score (OR=9.141, P<0.001), FVC (OR=0.483, P=0.016), FEV1 (OR=0.192, P=0.006), FEV1pre (OR=0.966, P=0.007), GLOD stage (OR=2.026, P=0.009), mMRC score (OR=3.730, P<0.001), CAT score (OR=1.231, P<0.001), serum total protein (TP, OR=0.376, P<0.001), and albumin (ALB, OR=0.256, P<0.001) were all associated with malnutrition in patients with AECOPD.
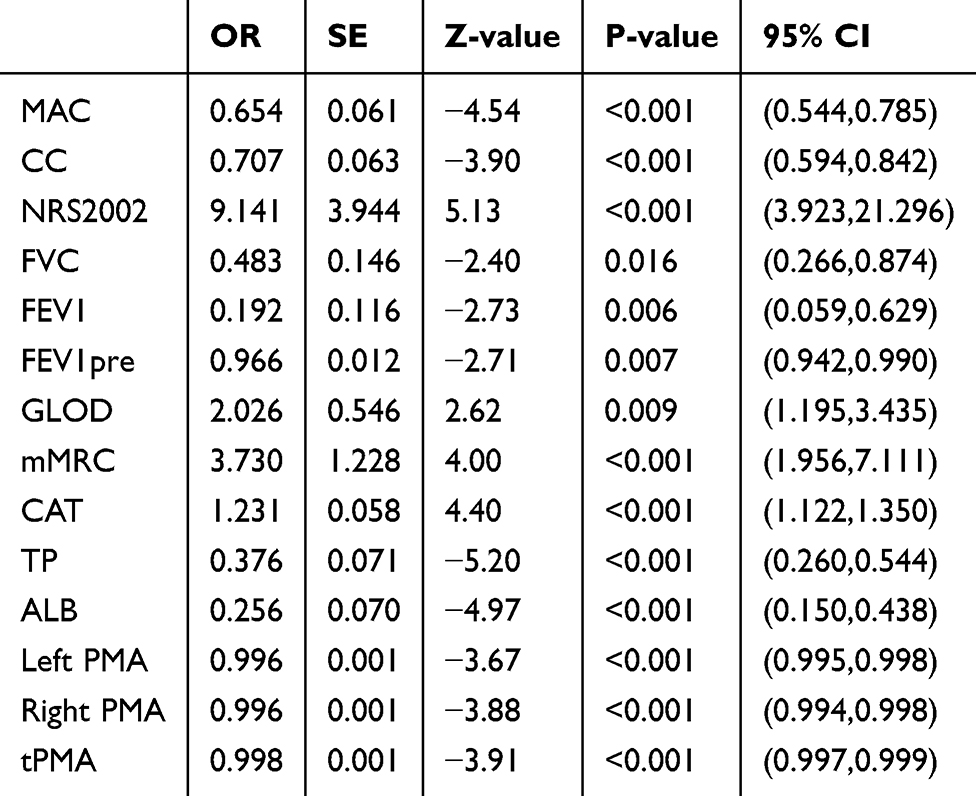 |
Table 3 Binary Logistic Regression Analysis of Risk Factors for Malnutrition in Patients with AECOPD |
Notably, left pectoralis major cross-sectional area (OR=0.996, P<0.001), right pectoralis major cross-sectional area (OR=0.996, P<0.001), and total bilateral pectoralis major cross-sectional area (OR=0.998, P<0.001) were identified as a factor associated with malnutrition in patients with AECOPD. This indicates that a reduction in pectoralis major muscle cross-sectional area is significantly associated with an increased risk of malnutrition.
Association Between Total Bilateral Pectoralis Major Muscle Cross-Sectional Area and Malnutrition Risk
This study included a total of 123 patients with AECOPD, of whom 35 (28.5%) were in the malnutrition group. To avoid overfitting, we calculated VIF values and simplified the model based on these values and the clinical significance of the variables. Following the EPV principle (requiring EPV ≥ 10), the final model included a maximum of 3–4 independent variables. Combining the results of variable selection with clinical significance, tPMA, MAC, and ALB were ultimately included in the multivariate logistic regression model (see Supplementary Table 1). To assess the independent association between tPMA and malnutrition in AECOPD patients, we constructed a stepwise logistic regression model (Table 4); In the unadjusted model (Model 1), tPMA was significantly negatively associated with malnutrition (OR = 0.998, P < 0.001). After adjusting for age and sex (Model 2), the effect of tPMA remained unchanged (OR = 0.998, P < 0.001). After further adjustment for MAC and ALB (Model 3), tPMA was an independent associated factor against malnutrition (OR = 0.998, P = 0.024); for every 100 m2 increase in tPMA, the risk of malnutrition decreased by approximately 20%. ALB was the strongest protective factor (OR = 0.246, P < 0.001). In the sensitivity analysis incorporating the CAT score (Model 4), the effect of tPMA remained consistent (OR = 0.998, P = 0.025), suggesting robust results.
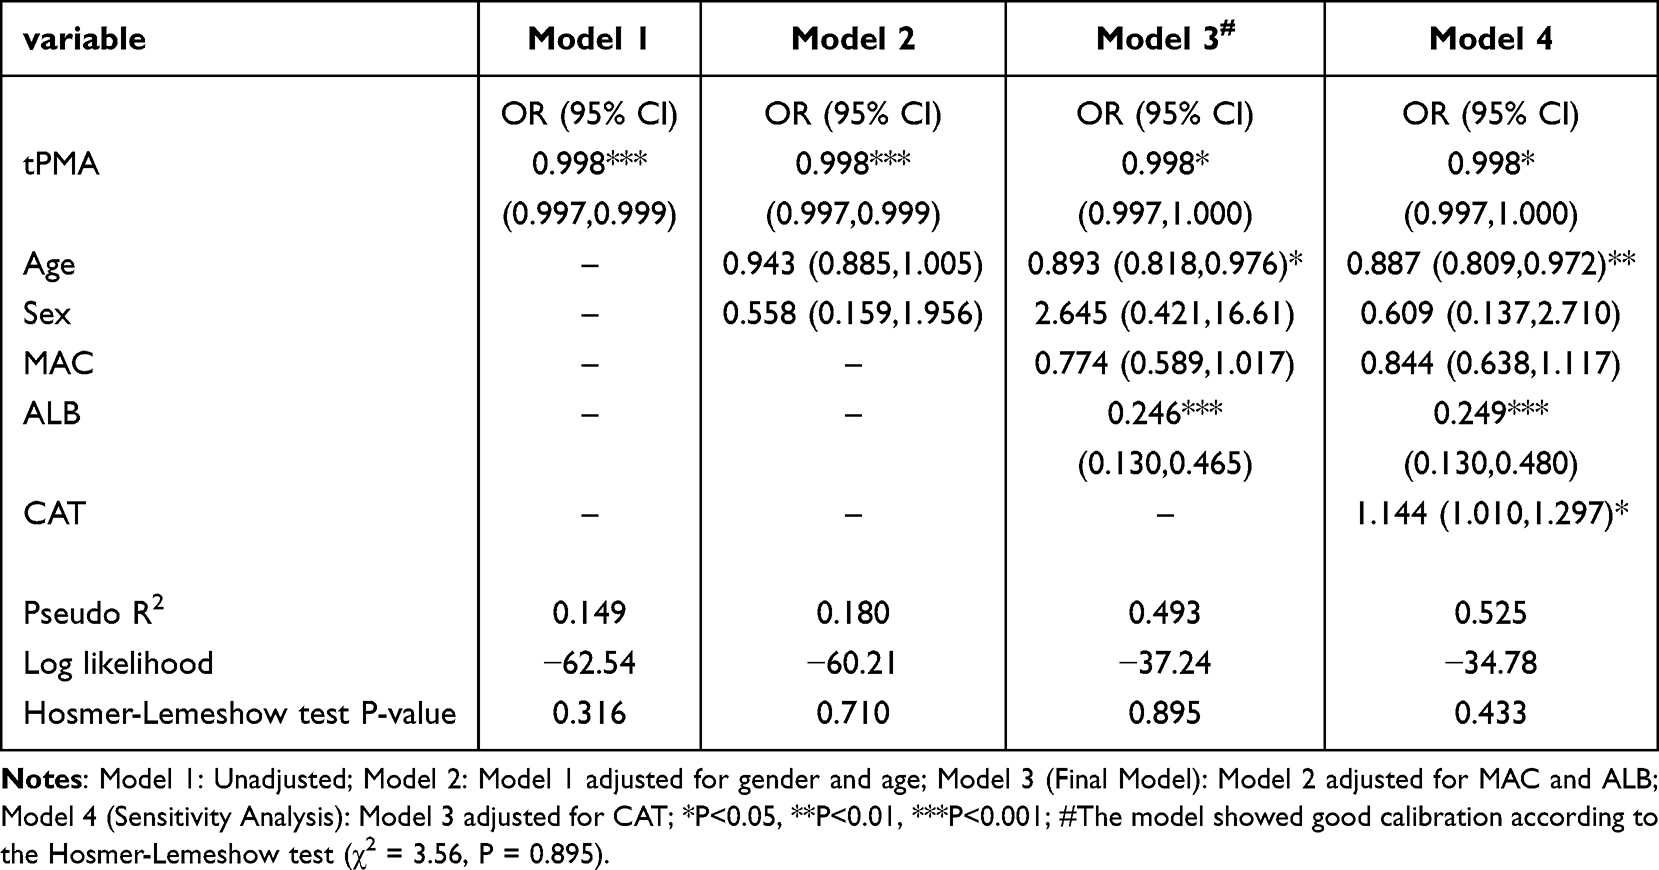 |
Table 4 Multivariate Logistic Regression Analysis of Factors Affecting Malnutrition in Patients with AECOPD (Nested Model) |
In addition, to compare the magnitude of the effects of each variable, we standardized the continuous variables (mean = 0, standard deviation = 1). Multivariate logistic regression analysis showed (see Supplementary Table 2): ALB was the strongest protective factor; for every 1-standard-deviation increase (approximately 4 g/L), the risk of malnutrition decreased by 95.1% (OR = 0.049, P < 0.001); for every 1 standard deviation increase in tPMA (approximately 500 mm2), the risk decreased by 65.7% (OR = 0.343, P = 0.025).
Diagnostic Value of tPMA for AECOPD with Malnutrition
This study evaluated the diagnostic value of total pectoralis major muscle area (tPMA), serum albumin (ALB), total protein (TP), and their combined use for diagnosing AECOPD with malnutrition (Table 5 and Figure 1). The area under the curve (AUC) for TP was 0.894 (95% CI: 0.836, 0.952), with an optimal cutoff value of 66.85, sensitivity of 0.81, and specificity of 0.83. ALB’s AUC was 0.871 (95% CI: 0.805, 0.936), with an optimal cutoff value of 36.15, sensitivity of 0.75, and specificity of 0.86. The AUC for tPMA was 0.770 (95% CI: 0.673, 0.867), with an optimal cutoff value of 1483.50, sensitivity of 0.70, and specificity of 0.80. When tPMA was combined with ALB, diagnostic performance significantly improved, with an AUC of 0.901 (95% CI: 0.842, 0.959), sensitivity of 0.83, and specificity of 0.84. Combining tPMA with TP further enhanced diagnostic performance, yielding the highest AUC of 0.916 (95% CI: 0.867, 0.965), sensitivity of 0.91, and specificity of 0.78. All AUC comparisons were performed using the DeLong test, for example: tPMA+ALB vs. ALB (ΔAUC = +0.03, P =0.003); tPMA+ALB vs. tPMA (ΔAUC = +0.131, P < 0.001); tPMA+TP vs. TP (ΔAUC = +0.022, P =0004); tPMA+TP vs. tPMA (ΔAUC = +0.146, P < 0.001); This indicates that combining tPMA with traditional nutritional indicators can provide a more accurate diagnosis of malnutrition.
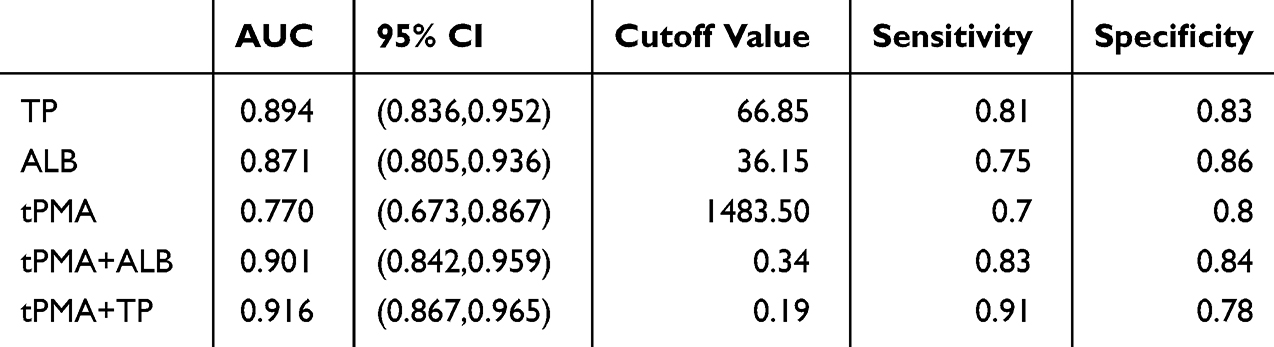 |
Table 5 Diagnostic Value of Bilateral Pectoralis Major Total Cross-Sectional Area, Serum Albumin, and Total Protein Individually and in Combination in Patients with AECOPD and Malnutrition |
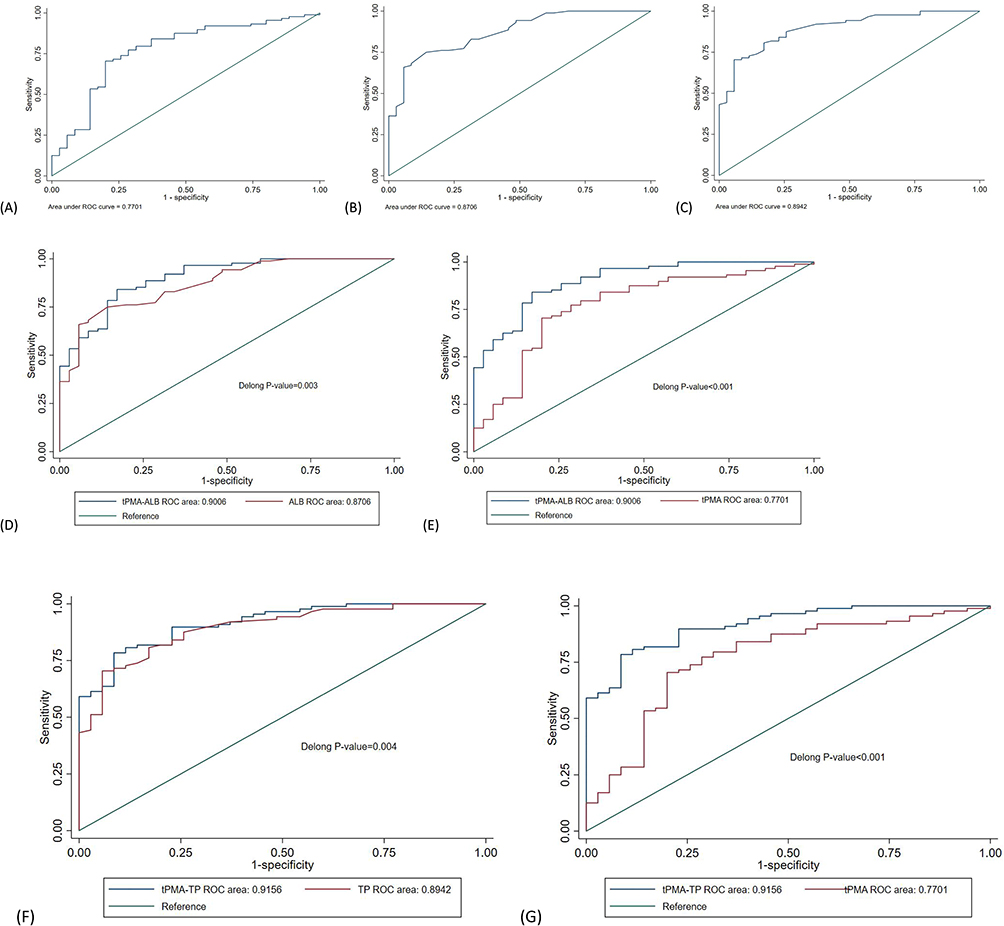 |
Figure 1 ROC curves for diagnosing malnutrition in AECOPD patients. (A) tPMA alone; (B) ALB alone; (C) TP alone; (D) Comparison of the Combined tPMA-ALB Model with ALB; (E) Comparison of the Combined tPMA-ALB Model with tPMA; (F) Comparison of the Combined tPMA-TP Model with TP; (G) Comparison of the Combined tPMA-TP Model with tPMA. Combined models were constructed using logistic regression-derived predicted probabilities. AUC comparisons were performed using DeLong’s test. |
Correlation Analysis
To investigate the correlation between tPMA and various clinical indicators, this study performed Spearman correlation analysis on 10 core variables (Figure 2 and Table 6). To control for Type I errors arising from multiple comparisons, a Bonferroni correction was applied (10 variables, 45 comparisons in total; corrected α = 0.05/45 ≈ 0.00111).
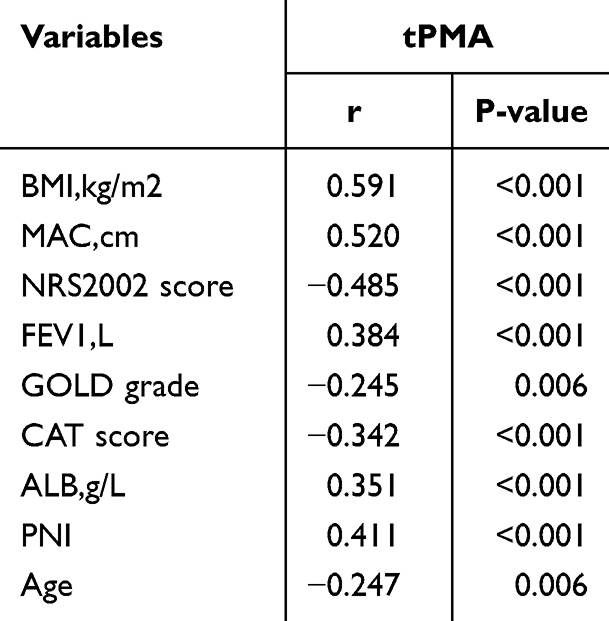 |
Table 6 Correlation Analysis of Total Cross-Sectional Area of Bilateral Pectoralis Major Muscles (tPMA) with Other Clinical Indicators (Bonferroni-Corrected for 45 Comparisons, Corrected α = 0.05/45 ≈ 0.00111) |
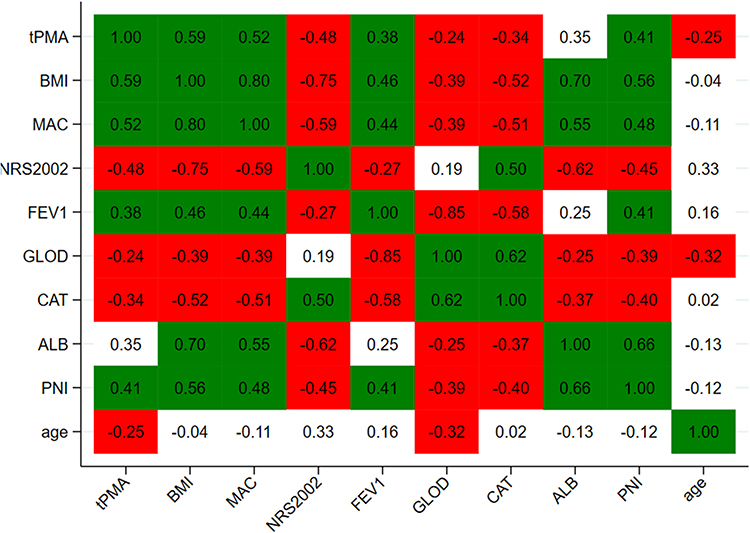 |
Figure 2 Spearman correlation heatmap between total pectoralis major muscle area (tPMA) and clinical indicators. Green indicates positive correlation; red indicates negative correlation. Color intensity corresponds to correlation strength. |
tPMA showed moderate positive correlations with BMI, MAC, ALB, and PNI, suggesting that a larger pectoralis major muscle area is associated with better overall nutritional status in patients. tPMA was positively correlated with FEV1 and negatively correlated with GLOD and CAT, indicating that a larger pectoralis major muscle area is associated with better lung function and milder dyspnea. tPMA showed a weak negative correlation with age, suggesting that the pectoralis major muscle area tends to decrease with advancing age. BMI was highly positively correlated with MAC, ALB was highly positively correlated with PNI, and FEV1 was highly negatively correlated with GLOD, suggesting multicollinearity among these indicators, consistent with previous VIF diagnostic results. These findings further support the value of tPMA as a potential indicator for assessing nutritional status and disease severity in patients with AECOPD.
Discussion
This study is the first to systematically evaluate the relationship between tPMA and malnutrition in patients with AECOPD. Key findings include: (1) tPMA levels were significantly lower in the malnourished group of AECOPD patients compared to the non-malnourished group; ② Multivariate logistic regression analysis showed that tPMA is an independent associated factor against malnutrition (OR = 0.998, P = 0.025); for every 1-standard-deviation increase (approximately 500 mm2), the risk of malnutrition decreased by approximately 65.7%; ③ tPMA was moderately positively correlated with BMI, MAC, ALB, and PNI, and negatively correlated with NRS2002, GLOD staging, and CAT score; ④ ROC curve analysis showed that the AUC for tPMA in diagnosing malnutrition was 0.770, with an optimal cutoff value of 1483.50 mm2; when tPMA was used in combination with total protein, the AUC increased to 0.916 (DeLong test, P < 0.001), with a sensitivity of 0.91, indicating that the combined diagnostic model possesses excellent discriminatory ability.
Numerous studies have confirmed that muscle mass (PMA) in patients with COPD is closely associated with disease severity, lung function, and prognosis.17,18,21,22 For example, Qiao et al found that PMA in patients with COPD was associated with clinical characteristics and disease severity.17 Li et al also noted that PMA in patients with COPD was lower than in healthy controls and was associated with respiratory symptoms.21 A prospective cohort study by Zhou et al demonstrated that reduced PMA is associated with the severity of airflow limitation and an increased risk of future acute exacerbations.22 Other studies have also shown that reduced muscle mass in COPD patients is closely linked to malnutrition.23,24 Building on these findings, this study is the first to analyze malnutrition as an independent outcome measure, rather than focusing solely on mortality or the frequency of acute exacerbations, thereby expanding the application value of PMA in nutritional assessment of patients with AECOPD. It is worth noting that assessments of other muscle groups have also been conducted in COPD patients. For example, the cross-sectional area of the rectus femoris is associated with the severity of airflow limitation and the severity of AECOPD.25 The cross-sectional area of the erector spinae muscles has also been identified as a poor prognostic indicator for hospitalized AECOPD patients.26 These studies further support the importance of assessing muscle mass via imaging modalities such as CT in the management of COPD patients.20,27,28 This study focuses on the pectoralis major—a muscle group that can be conveniently measured on routine chest CT scans, offering the unique advantage of requiring no additional scans and incurring no extra medical costs.
This study found that traditional nutritional indicators—including BMI, MAC, CC, ALB, and TP—were significantly lower in the malnourished group of AECOPD patients compared to the non-malnourished group. This is consistent with the general characteristics of malnutrition in COPD patients reported in previous studies and reflects the objective presence of protein-energy wasting.8 Correlation analysis further revealed that tPMA was significantly positively correlated with BMI, MAC, ALB, and PNI, and negatively correlated with the NRS2002 score, GLOD stage, and CAT score. These results confirm the validity of the pectoralis major muscle as a surrogate marker for systemic muscle loss and disease severity,17,18 and support the view that pectoralis major muscle cross-sectional area is negatively correlated with lung function and disease severity in COPD patients.15,17
A key finding of this study is that the diagnostic performance is significantly improved when tPMA is used in combination with serum albumin, with a greater discriminatory ability than either marker used alone (DeLong test: P < 0.05). This synergistic effect can be explained by complementary pathophysiological mechanisms:29 tPMA reflects skeletal muscle structural reserves and serves as a comprehensive indicator of chronic nutritional status, physical activity levels, and long-term systemic catabolism;30 serum albumin/total protein, on the other hand, represents acute-phase hepatic synthetic function and is dynamically influenced by inflammatory cytokine activity, capillary leakage, and nutritional intake during acute exacerbations.31 The complementarity of these two markers across the “structure-function” and “chronic-acute” dimensions forms the basis for their combined diagnostic value. From a clinical perspective, this combined diagnostic approach facilitates precise stratification based on pathophysiological mechanisms:31 ① Low tPMA but normal albumin: Suggests chronic muscle wasting with preserved acute synthetic capacity; such patients may benefit from structured nutritional rehabilitation and resistance training; ② Normal tPMA but low albumin: Suggests acute inflammatory protein loss; anti-inflammatory treatment and acute-phase nutritional support should be prioritized; ③ Both are abnormal: Represents the highest-risk phenotype, requiring intensive multidisciplinary intervention.
The practical value of tPMA should be understood within specific clinical contexts: ① Acute care settings: When laboratory testing turnaround times lead to diagnostic delays (eg, emergency admission for AECOPD), measuring tPMA via routine chest CT provides immediate, concurrent nutritional risk information without the need for additional blood draws, increased costs, or extended wait times. ② When biochemical markers are compromised: Albumin levels may be reduced due to acute inflammation, liver dysfunction, or fluid overload; total protein levels are influenced by hydration status and immunoglobulin levels. In such cases, muscle mass assessed via CT provides a relatively stable nutritional indicator that is not affected by inflammation. ③ Resource-limited settings: When comprehensive metabolomic testing is unavailable, tPMA based on chest imaging can facilitate basic nutritional risk stratification.
Although this study provides evidence of an association between tPMA and malnutrition in patients with AECOPD, several limitations remain: this study employed a single-center, retrospective design, which may introduce selection bias; therefore, the findings require validation in prospective, multicenter cohort studies. This study used a BMI < 18.5 kg/m2 as the criterion for malnutrition rather than the GLIM criteria, which encompass both phenotypic and etiological aspects, potentially leading to some classification bias. As this study employed a cross-sectional design, causal inferences cannot be drawn; the causal relationship between tPMA and malnutrition requires confirmation through longitudinal studies. tPMA is a static measure of muscle mass and does not fully capture changes in muscle function. Future studies could incorporate functional assessments, such as the 6-minute walk test,32–34 to provide a more comprehensive evaluation of muscle status. Currently, there is a lack of established reference ranges for pectoralis major area in the Chinese AECOPD population, which limits the standardized application of tPMA; in sarcopenia, fat infiltration is an equally important pathological change; therefore, without additional analysis, CT cannot distinguish between muscle mass and fat infiltration.
In summary, this study has established a strong association between tPMA and malnutrition in patients with AECOPD. Not only is tPMA an independent predictor of malnutrition, but its combination with traditional biochemical markers can significantly improve the diagnostic accuracy for malnutrition. Future studies should further explore the combination of tPMA with other muscle assessment methods and functional indicators, and conduct prospective validation in multicenter cohorts using comprehensive GLIM criteria to define malnutrition, in order to clarify the value of tPMA in guiding nutritional interventions and improving clinical outcomes in patients with AECOPD.
Data Sharing Statement
Data are available upon reasonable request.
Author Contributions
All authors made a significant contribution to the work reported, whether that is in the conception, study design, execution, acquisition of data, analysis and interpretation, or in all these areas; took part in drafting, revising or critically reviewing the article; gave final approval of the version to be published; have agreed on the journal to which the article has been submitted; and agree to be accountable for all aspects of the work.
Funding
The study was also financially supported by the grants from Guizhou Provincial Health Commission Science and Technology Fund Project (gzwkj2025-189) and the Anshun Science and Technology Bureau Foundation (Grant No. 2026-13).
Disclosure
The authors declare that the research was conducted in the absence of any commercial or financial relationships that could be construed as a potential conflict of interest.
References
1. Decramer M, Janssens W, Miravitlles M. Chronic obstructive pulmonary disease. Lancet. 2012;379(9823):1341–14. doi:10.1016/S0140-6736(11)60968-9
2. Ritchie AI, Wedzicha JA. Definition, causes, pathogenesis, and consequences of chronic obstructive pulmonary disease exacerbations. Clin Chest Med. 2020;41(3):421–438. doi:10.1016/j.ccm.2020.06.007
3. Safiri S, Carson-Chahhoud K, Noori M, et al. Burden of chronic obstructive pulmonary disease and its attributable risk factors in 204 countries and territories, 1990-2019: results from the global burden of disease study 2019. BMJ. 2022;378:e069679. doi:10.1136/bmj-2021-069679
4. Lopez AD, Mathers CD, Ezzati M, Jamison DT, Murray CJ. Global and regional burden of disease and risk factors, 2001: systematic analysis of population health data. Lancet. 2006;367(9524):1747–1757. doi:10.1016/S0140-6736(06)68770-9
5. Hwang YI, Park YB, Yoo KH. Recent trends in the prevalence of chronic obstructive pulmonary disease in Korea. Tuberc Respir Dis. 2017;80(3):226–229. doi:10.4046/trd.2017.80.3.226
6. Li T, Xu H, Chen L, et al. The association between skeletal muscle mass and all-cause mortality in acute exacerbation of chronic obstructive pulmonary disease. Front Nutr. 2025;12:1568527. doi:10.3389/fnut.2025.1568527
7. Deng M, Lu Y, Zhang Q, Bian Y, Zhou X, Hou G. Global prevalence of malnutrition in patients with chronic obstructive pulmonary disease: systemic review and meta-analysis. Clin Nutr. 2023;42(6):848–858. doi:10.1016/j.clnu.2023.04.005
8. Zhang X, Wang Y, Xu M, Zhang Y, Lyu Q. The malnutrition in AECOPD and its association with unfavorable outcomes by comparing PNI, GNRI with the GLIM criteria: a retrospective cohort study. Front Nutr. 2024;11:1365462. doi:10.3389/fnut.2024.1365462
9. Jerng JS, Tang CH, Cheng RW, Wang MY, Hung KY. Healthcare utilization, medical costs and mortality associated with malnutrition in patients with chronic obstructive pulmonary disease: a matched cohort study. Curr Med Res Opin. 2019;35(7):1265–1273. doi:10.1080/03007995.2019.1574460
10. Dávalos-Yerovi V, Marco E, Sánchez-Rodríguez D, et al. Malnutrition according to GLIM criteria is associated with mortality and hospitalizations in rehabilitation patients with stable chronic obstructive pulmonary disease. Nutrients. 2021;13(2):369. doi:10.3390/nu13020369
11. Shi G, Yue L, Tang Z, Wang Y, Hu X, Tong Y. Serum growth differentiation factor 15 as a biomarker for malnutrition in patients with acute exacerbation of chronic obstructive pulmonary disease. Front Nutr. 2024;11:1404063. doi:10.3389/fnut.2024.1404063
12. Maeda K, Ishida Y, Nonogaki T, Mori N. Reference body mass index values and the prevalence of malnutrition according to the global leadership initiative on malnutrition criteria. Clin Nutr. 2020;39(1):180–184. doi:10.1016/j.clnu.2019.01.011
13. Carrero JJ, Avesani CM. Pros and cons of body mass index as a nutritional and risk assessment tool in dialysis patients. Semin Dial. 2015;28(1):48–58. doi:10.1111/sdi.12287
14. Shen X, Qian R, Wei Y, et al. Prediction model and assessment of malnutrition in patients with stable chronic obstructive pulmonary disease. Sci Rep. 2024;14(1):6508. doi:10.1038/s41598-024-56747-2
15. O’Brien ME, Zou RH, Hyre N, et al. CT pectoralis muscle area is associated with DXA lean mass and correlates with emphysema progression in a tobacco-exposed cohort. Thorax. 2023;78(4):394–401. doi:10.1136/thoraxjnl-2021-217710
16. McDonald ML, Diaz AA, Ross JC, et al. Quantitative computed tomography measures of pectoralis muscle area and disease severity in chronic obstructive pulmonary disease. A cross-sectional study. Ann Am Thorac Soc. 2014;11(3):326–334. doi:10.1513/AnnalsATS.201307-229OC
17. Qiao X, Hou G, Kang J, Wang QY, Yin Y. CT attenuation and cross-sectional area of the pectoralis are associated with clinical characteristics in chronic obstructive pulmonary disease patients. Front Physiol. 2022;13:833796. doi:10.3389/fphys.2022.833796
18. Bak SH, Kwon SO, Han SS, Kim WJ. Computed tomography-derived area and density of pectoralis muscle associated disease severity and longitudinal changes in chronic obstructive pulmonary disease: a case control study. Respir Res. 2019;20(1):226. doi:10.1186/s12931-019-1191-y
19. Zhi J, Shan Q, Liang L, Liu H, Huang H. Low skeletal muscle area as a prognostic marker for chronic obstructive pulmonary disease in elderly patients admitted to ICU. Sci Rep. 2019;9(1):19117. doi:10.1038/s41598-019-55737-z
20. Ramírez-Fuentes C, Mínguez-Blasco P, Ostiz F, et al. Ultrasound assessment of rectus femoris muscle in rehabilitation patients with chronic obstructive pulmonary disease screened for sarcopenia: correlation of muscle size with quadriceps strength and fat-free mass. Eur Geriatr Med. 2019;10(1):89–97. doi:10.1007/s41999-018-0130-7
21. Li C, Lian X, He J, et al. Association of computed tomography-derived pectoralis muscle area and density with disease severity and respiratory symptoms in patients with chronic obstructive pulmonary disease: a case-control study. Respir Med. 2024;233:107783. doi:10.1016/j.rmed.2024.107783
22. Zhou K, Wu F, Zhao N, et al. Association of pectoralis muscle area on computed tomography with airflow limitation severity and respiratory outcomes in COPD: a population-based prospective cohort study. Pulmonology. 2025;31(1):2416782. doi:10.1016/j.pulmoe.2023.02.004
23. Espíndola de Araújo B, Teixeira PP, Valduga K, da Silva Fink J, Silva FM. Prevalence, associated factors, and prognostic value of sarcopenia in patients with acute exacerbated chronic obstructive pulmonary disease: a cohort study. Clin Nutr ESPEN. 2021;42:188–194. doi:10.1016/j.clnesp.2021.01.042
24. Yogesh M, Patel J, Makwana N, Mody M. The triad of physiological challenges: investigating the intersection of sarcopenia, malnutrition, and malnutrition-sarcopenia syndrome in patients with COPD - a cross-sectional study. BMC Pulm Med. 2024;24(1):71. doi:10.1186/s12890-024-02884-3
25. Wang W, Bao H, Zhu F, Dong L, Hu X, Song W. Correlation between rectus femoris muscle cross-sectional area and severity of acute exacerbations of chronic obstructive pulmonary disease. J Coll Physicians Surg Pak. 2025;35(3):331–334.
26. Gong S, Wu Y, Huang X, Di N, Wu Q, Hu G. The cross-sectional area of the erector spinae muscle is an adverse indicator for patient with acute exacerbation of chronic obstructive pulmonary disease. Sci Rep. 2025;15(1):31083. doi:10.1038/s41598-025-16578-1
27. Nijholt W, Beek LT, Hobbelen J, et al. The added value of ultrasound muscle measurements in patients with COPD: an exploratory study. Clin Nutr ESPEN. 2019;30:152–158. doi:10.1016/j.clnesp.2019.01.001
28. Gödiker J, Schwind L, Jacob T, et al. Ultrasound-defined sarcopenia independently predicts acute decompensation in advanced chronic liver disease. J Cachexia, Sarcopenia Muscle. 2024;15(6):2792–2802. doi:10.1002/jcsm.13630
29. Franco-Palacios DJ, Franco-Palacios CR, Crowley S, et al. Effect of total psoas muscle area and serum albumin on outcomes after lung transplantation. Clin Transplant. 2025;39(9):e70308. doi:10.1111/ctr.70308
30. Manolis AA, Manolis TA, Melita H, et al. Low serum albumin: a neglected predictor in patients with cardiovascular disease. Eur J Intern Med. 2022;102:24–39. doi:10.1016/j.ejim.2022.05.004
31. Irmak Kaya Z, Karabağ A, Gurcu S, et al. Psoas muscle indices, visceral fat distribution, inflammatory markers and 90-day mortality in palliative medicine: retrospective cohort study. BMJ Support Palliative Care;2026. spcare–2026–006215. doi:10.1136/spcare-2026-006215
32. Murakami T, Kobayashi T, Ono H, et al. Phase angle as an indicator of sarcopenia and malnutrition in patients with chronic obstructive pulmonary disease. Respir Investig. 2024;62(4):651–656. doi:10.1016/j.resinv.2024.05.012
33. Quadflieg K, Machado A, de Lima FF, et al. Physical status, symptoms and health-related quality of life during a severe exacerbation of COPD: recovery and discriminative capacity for future events. Respir Med. 2023;220:107437. doi:10.1016/j.rmed.2023.107437
34. Perrot L, Greil A, Boirie Y, et al. Prevalence of sarcopenia and malnutrition during acute exacerbation of COPD and after 6 months recovery. Eur J Clin Nutr. 2020;74(11):1556–1564. doi:10.1038/s41430-020-0623-6
 © 2026 The Author(s). This work is published and licensed by Dove Medical Press Limited. The
full terms of this license are available at https://www.dovepress.com/terms
and incorporate the Creative Commons Attribution
- Non Commercial (unported, 4.0) License.
By accessing the work you hereby accept the Terms. Non-commercial uses of the work are permitted
without any further permission from Dove Medical Press Limited, provided the work is properly
attributed. For permission for commercial use of this work, please see paragraphs 4.2 and 5 of our Terms.
© 2026 The Author(s). This work is published and licensed by Dove Medical Press Limited. The
full terms of this license are available at https://www.dovepress.com/terms
and incorporate the Creative Commons Attribution
- Non Commercial (unported, 4.0) License.
By accessing the work you hereby accept the Terms. Non-commercial uses of the work are permitted
without any further permission from Dove Medical Press Limited, provided the work is properly
attributed. For permission for commercial use of this work, please see paragraphs 4.2 and 5 of our Terms.
Recommended articles
Explainable Machine Learning Model Based on Routine Admission Laboratory Tests for Predicting New-Onset Hypoalbuminemia in Hospitalized Older Patients with Acute Exacerbation of COPD
Xiao L, Qin Y, Wen Y, Guo X, Wang Y, Wang Y, Wang Z
Clinical Interventions in Aging 2026, 21:604454
Published Date: 17 May 2026
Assessing Invasiveness of Ground-Glass Nodules Using Ternary-Class CT Radiomics Models: A Multi-Center Study with SHAP Explanations
Zhao P, Chen H, Gu H, Lin Y, Ma Y
Cancer Management and Research 2026, 18:602730
Published Date: 5 June 2026