Back to Journals » Clinical Interventions in Aging » Volume 21
Explainable Machine Learning Model Based on Routine Admission Laboratory Tests for Predicting New-Onset Hypoalbuminemia in Hospitalized Older Patients with Acute Exacerbation of COPD
Authors Xiao L, Qin Y, Wen Y, Guo X ![]() , Wang Y, Wang Y, Wang Z
, Wang Y, Wang Y, Wang Z
Received 21 February 2026
Accepted for publication 6 May 2026
Published 17 May 2026 Volume 2026:21 604454
DOI https://doi.org/10.2147/CIA.S604454
Checked for plagiarism Yes
Review by Single anonymous peer review
Peer reviewer comments 2
Editor who approved publication: Dr Maddalena Illario
Li Xiao,1,* Yan Qin,2,* Youli Wen,3 Xiaocong Guo,1 Yingqi Wang,4 Yinghui Wang,5 Zilin Wang1
1Department of Clinical Laboratory, Zigong First People’s Hospital, Zigong, Sichuan, People’s Republic of China; 2Department of Respiratory and Critical Care Medicine, The First People’s Hospital of Longquanyi District, Chengdu, Sichuan, People’s Republic of China; 3Department of Respiratory Medicine, Zigong First People’s Hospital, Zigong, Sichuan, People’s Republic of China; 4Hunan Provincial Key Laboratory of the Research and Development of Novel Pharmaceutical Preparations, Changsha Medical University, Changsha, Hunan, People’s Republic of China; 5Department of Clinical Laboratory, Guizhou Qiannan People’s Hospital, Duyun, Guizhou, People’s Republic of China
*These authors contributed equally to this work
Correspondence: Zilin Wang, Department of Clinical Laboratory, Zigong First People’s Hospital, Zigong, Sichuan, People’s Republic of China, Email [email protected]
Background: Malnutrition in older patients hospitalized for acute exacerbation of chronic obstructive pulmonary disease (AECOPD) is frequently overlooked. New-onset hypoalbuminemia during hospitalization is an important signal of worsening nutritional and inflammatory burden and is closely associated with adverse outcomes such as prolonged mechanical ventilation, readmission, and mortality. Early proactive warning tools based on admission data are lacking.
Methods: This dual-center retrospective cohort study included patients aged ≥ 65 years who were hospitalized for AECOPD between January 2023 and December 2025 and had normal serum albumin at admission (≥ 35 g/L). The Zigong cohort (n=1,502) was used for model development and internal validation, whereas the Qiannan cohort (n=1,086) served as the external test cohort. Among the Zigong cohort, 1052 patients were assigned to the training set and 450 to the internal validation set. The primary outcome was defined as new-onset hypoalbuminemia recorded in the discharge diagnosis during the same hospitalization among patients with normal admission albumin. Because the retrospective source database did not retain a standardized schedule for inpatient albumin re-testing, albumin measurement frequency and the median time from admission to outcome ascertainment could not be evaluated. To minimize information leakage, all feature-selection procedures were performed exclusively in the training set. Missing data were handled using multiple imputation. Candidate predictors were demographics and routine laboratory tests completed within 24 hours of admission. Core features were selected using the intersection of univariable screening, least absolute shrinkage and selection operator (LASSO) regression, and the Boruta algorithm. Logistic regression, decision tree, random forest, XGBoost, LightGBM, support vector machine, and artificial neural network models were developed with five-fold cross-validation and grid-search tuning. Discrimination, calibration, and decision-curve analysis were evaluated in an internal validation set and an external test set. Model interpretability was assessed with SHapley Additive exPlanations (SHAP), and the optimal model was deployed as an online risk calculator.
Results: Among 1502 older AECOPD inpatients, 335 (22.3%) met the study definition of new-onset hypoalbuminemia by discharge. Eight core predictors available at admission were retained: cholinesterase (CHE), high-sensitivity C-reactive protein (hs-CRP), hematocrit (HCT), anion gap (AG), serum magnesium (Mg), alanine aminotransferase (ALT), age, and international normalized ratio (INR). XGBoost achieved AUCs of 0.85 in the internal validation set and 0.83 in the external test set, compared with 0.84 and 0.82, respectively, for logistic regression, indicating only a modest performance advantage. SHAP indicated that lower CHE, HCT, AG, and Mg and higher hs-CRP, age, and INR were associated with higher risk.
Conclusion: An interpretable model derived from routine admission laboratory tests may support early risk stratification for new-onset hypoalbuminemia in older hospitalized patients with AECOPD. Nevertheless, further prospective validation is required to confirm its clinical utility and generalizability.
Keywords: acute exacerbation of chronic obstructive pulmonary disease, older adults, hypoalbuminemia, malnutrition, machine learning, risk prediction
Introduction
Chronic obstructive pulmonary disease (COPD) is a major global health challenge and one of the leading causes of death worldwide.1–4 Previous studies have identified respiratory diseases as the second leading cause of mortality, highlighting the significant contribution of respiratory pathology and reinforcing the clinical importance of conditions such as COPD.5 In older adults, AECOPD is not only a respiratory event but also a systemic inflammatory and catabolic process. In this context, hypoalbuminemia is a key yet often underestimated prognostic determinant.6 Serum albumin is more than a nutritional marker; as a potent negative acute-phase reactant, it reflects systemic inflammation, endothelial permeability, and hepatic synthetic reserve.7,8 Epidemiological data suggest that 20%–50% of hospitalized older AECOPD patients exhibit hypoalbuminemia, which is associated with sarcopenia, prolonged mechanical ventilation, and increased mortality.8–10 Prior COPD prediction studies have also shown that routinely collected clinical and laboratory variables can be used to model important acute outcomes, supporting the feasibility of laboratory-based risk prediction for metabolic complications such as hypoalbuminemia in this population.11,12 Despite its clinical importance, early risk stratification remains challenging because metabolic dysregulation can be insidious in this heterogeneous population.
Current management is largely reactive. Clinicians often rely on serial albumin measurements to confirm hypoalbuminemia, so interventions are usually initiated only after hypoalbuminemia has already become clinically apparent. Albumin kinetics during acute illness are more complex than a simple half-life argument: serum concentrations may decrease because of inflammation-driven reprioritization of hepatic protein synthesis, capillary leak, hemodilution, and redistribution, even when overt malnutrition is not yet clinically recognized. Although prealbumin (PA) is sometimes recommended for early nutritional assessment, it is not universally available and its specificity decreases markedly during the inflammatory storm of AECOPD.13–15 Traditional scores, such as the BODE index (body mass index, airflow obstruction, dyspnea, and exercise capacity), the DOSE index (dyspnea, obstruction, smoking, and exacerbation), and APACHE II, were developed for global outcomes rather than specific metabolic complications, and many existing prediction tools still rely on linear logistic regression that may not capture complex non-linear interactions among age, coagulation indices, and inflammatory biomarkers in older patients.11,12,16
Machine learning (ML) can model high-dimensional non-linear relationships, but clinical adoption has been limited by concerns about “black-box” behavior and usability.17–19 Many published models remain academic prototypes and are difficult to apply at the bedside. Therefore, we aimed to develop and externally validate an interpretable ML model using only routine admission laboratory tests to predict new-onset hypoalbuminemia among older hospitalized AECOPD patients and to translate the optimal model into an interactive web calculator as an exploratory risk-stratification aid rather than evidence of immediate outcome benefit or clinical readiness.
Methods
Study Design and Ethics
This was a dual-center, retrospective cohort study. The study protocol was approved by the Ethics Committee of Zigong First People’s Hospital (Approval No.: (M)2026–015) and Qiannan People’s Hospital, Guizhou Province (Approval No.: 2026-qnzy-04). Due to the retrospective design, informed consent was waived. Data were collected from January 2023 to December 2025. The study was conducted in accordance with the Declaration of Helsinki. Study design, predictor handling, model development, and external validation were reported with reference to key items from the TRIPOD+AI statement and domains emphasized by PROBAST+AI.20,21
Participants and Eligibility Criteria
Eligible patients were aged ≥65 years and hospitalized with a primary diagnosis of AECOPD. AECOPD was defined according to the GOLD 2023 report as an acute worsening of respiratory symptoms (dyspnea, cough, and/or sputum) usually occurring within 14 days and accompanied by increased local or systemic inflammation.22 The underlying diagnosis of COPD was confirmed by prior spirometry meeting GOLD criteria (post-bronchodilator FEV1/FVC <0.7).
Outcome definition: Patients had normal serum albumin at admission (index albumin ≥35 g/L measured within the first 24 hours of admission). Patients were classified as having new-onset hypoalbuminemia if hypoalbuminemia was listed in the discharge diagnosis.23 Because the source database did not retain a standardized inpatient albumin re-testing schedule, the exact albumin measurement frequency and the median time from admission to outcome identification were unavailable and were therefore not analyzed.
Exclusion criteria were applied to reduce confounding from secondary hypoalbuminemia due to primary organ failure: (1) albumin <35 g/L within the first 24 hours of admission; (2) severe hepatic dysfunction (decompensated cirrhosis or Child-Pugh score ≥7 [class B/C]);24 (3) severe renal dysfunction (eGFR <30 mL/min/1.73 m2, CKD stage 4–5, or nephrotic syndrome); (4) other acute high-consumption conditions within the preceding 4 weeks (major surgery, severe burns, or severe non-respiratory infections such as sepsis or peritonitis); and (5) missing data: no albumin measurement within the first 24 hours of admission or >20% missingness in key predictors.
Sample Size and Data Preprocessing
We used the events-per-variable (EPV) principle to assess sample adequacy. With eight predictors in the final model and 235 outcome events, EPV was ~29.3 (235/8), exceeding the commonly recommended threshold (≥10), suggesting adequate sample size to reduce overfitting. Missing values were addressed by multiple imputation, and all analyses were performed on imputed datasets.
Feature Selection, Model Development, and Validation
The Zigong cohort served as the development dataset and was randomly split 7:3 into a training set and an internal validation set. The Qiannan cohort served as an independent external test set to evaluate generalizability. Candidate variables included sex, age, and routine laboratory indices obtained within 24 hours of admission that were consistently available across both centers and are commonly included in the standard admission work-up for AECOPD, including complete blood count, coagulation tests, liver/kidney function, electrolytes, and inflammatory markers. These tests were chosen because they capture inflammatory burden, hematologic status, hepatic synthetic function, renal-metabolic reserve, and electrolyte imbalance without requiring additional examinations.25,26
Feature selection followed a multi-stage strategy performed exclusively within the training set to avoid information leakage: univariable screening, LASSO regression with cross-validation to shrink coefficients and reduce multicollinearity, and Boruta feature selection based on random-forest importance. The intersection of variables selected by all three methods was used as the final core feature set.
Seven models were trained: logistic regression (LR), decision tree (DT), random forest (RF), XGBoost, LightGBM, support vector machine (SVM), and artificial neural network (ANN). Hyperparameters were tuned using grid search with five-fold cross-validation, optimizing AUC. Performance was evaluated in terms of discrimination (ROC/AUC and related metrics), calibration (calibration curves), and clinical utility (decision curve analysis).
Model Interpretability and Web Deployment
Model interpretability was assessed using SHapley Additive exPlanations (SHAP), including global feature-importance rankings, beeswarm plots, and dependence plots, as well as individual-level waterfall and force plots. The best-performing model was deployed as an interactive web calculator (https://elderly-hypoalb-calc.streamlit.app/) to enable bedside risk estimation at admission (Figure 1).
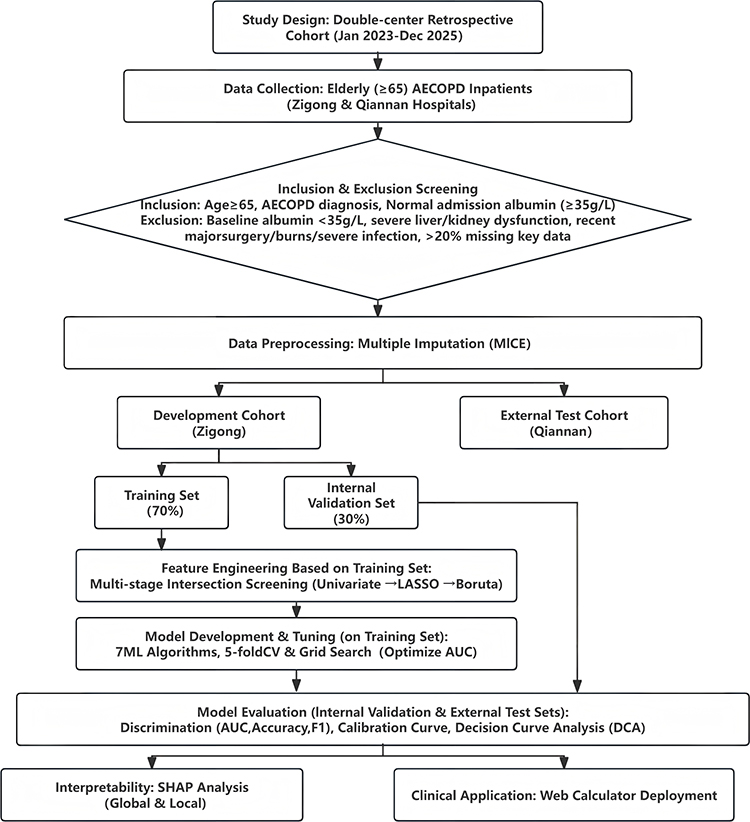 |
Figure 1 Patient selection flow diagram for older AECOPD inpatients. |
Statistical Analysis
Normality was assessed using the Kolmogorov–Smirnov test. Normally distributed variables are presented as mean ± standard deviation and compared using Student’s t-test; non-normally distributed variables are presented as median (interquartile range) and compared using the Wilcoxon rank-sum test. Categorical variables are presented as counts (percentages) and compared using the chi-square test or Fisher’s exact test. All tests were two-sided with P<0.05 considered statistically significant. Because the univariable analyses were used only as an exploratory screening step within the training set rather than for formal confirmatory inference, multiplicity correction was not applied; instead, variable retention required concordance across univariable screening, LASSO shrinkage, and Boruta selection. Feature selection was performed in R (version 4.5.1; MICE, LASSO, Boruta), and model training and SHAP analyses were performed in Python (version 3.10).
Results
Baseline Characteristics
The training cohort included 1,052 older inpatients with AECOPD after inclusion and exclusion criteria were applied (Figure 1). All patients had normal albumin on the first admission test. By discharge, 235 patients met the study definition of new-onset hypoalbuminemia (normal admission albumin plus a discharge diagnosis of hypoalbuminemia), and 817 did not. The cohort was predominantly male, with most patients aged 70–80 years. Compared with patients without hypoalbuminemia, those who were classified as having new-onset hypoalbuminemia were older and already showed higher inflammatory burden and reduced synthetic/metabolic reserve at admission, including lower CHE and higher hs-CRP. They also had lower hematocrit, lower anion gap and magnesium, higher INR, and mildly higher ALT. Detailed distributions and between-group comparisons are shown in Table 1.
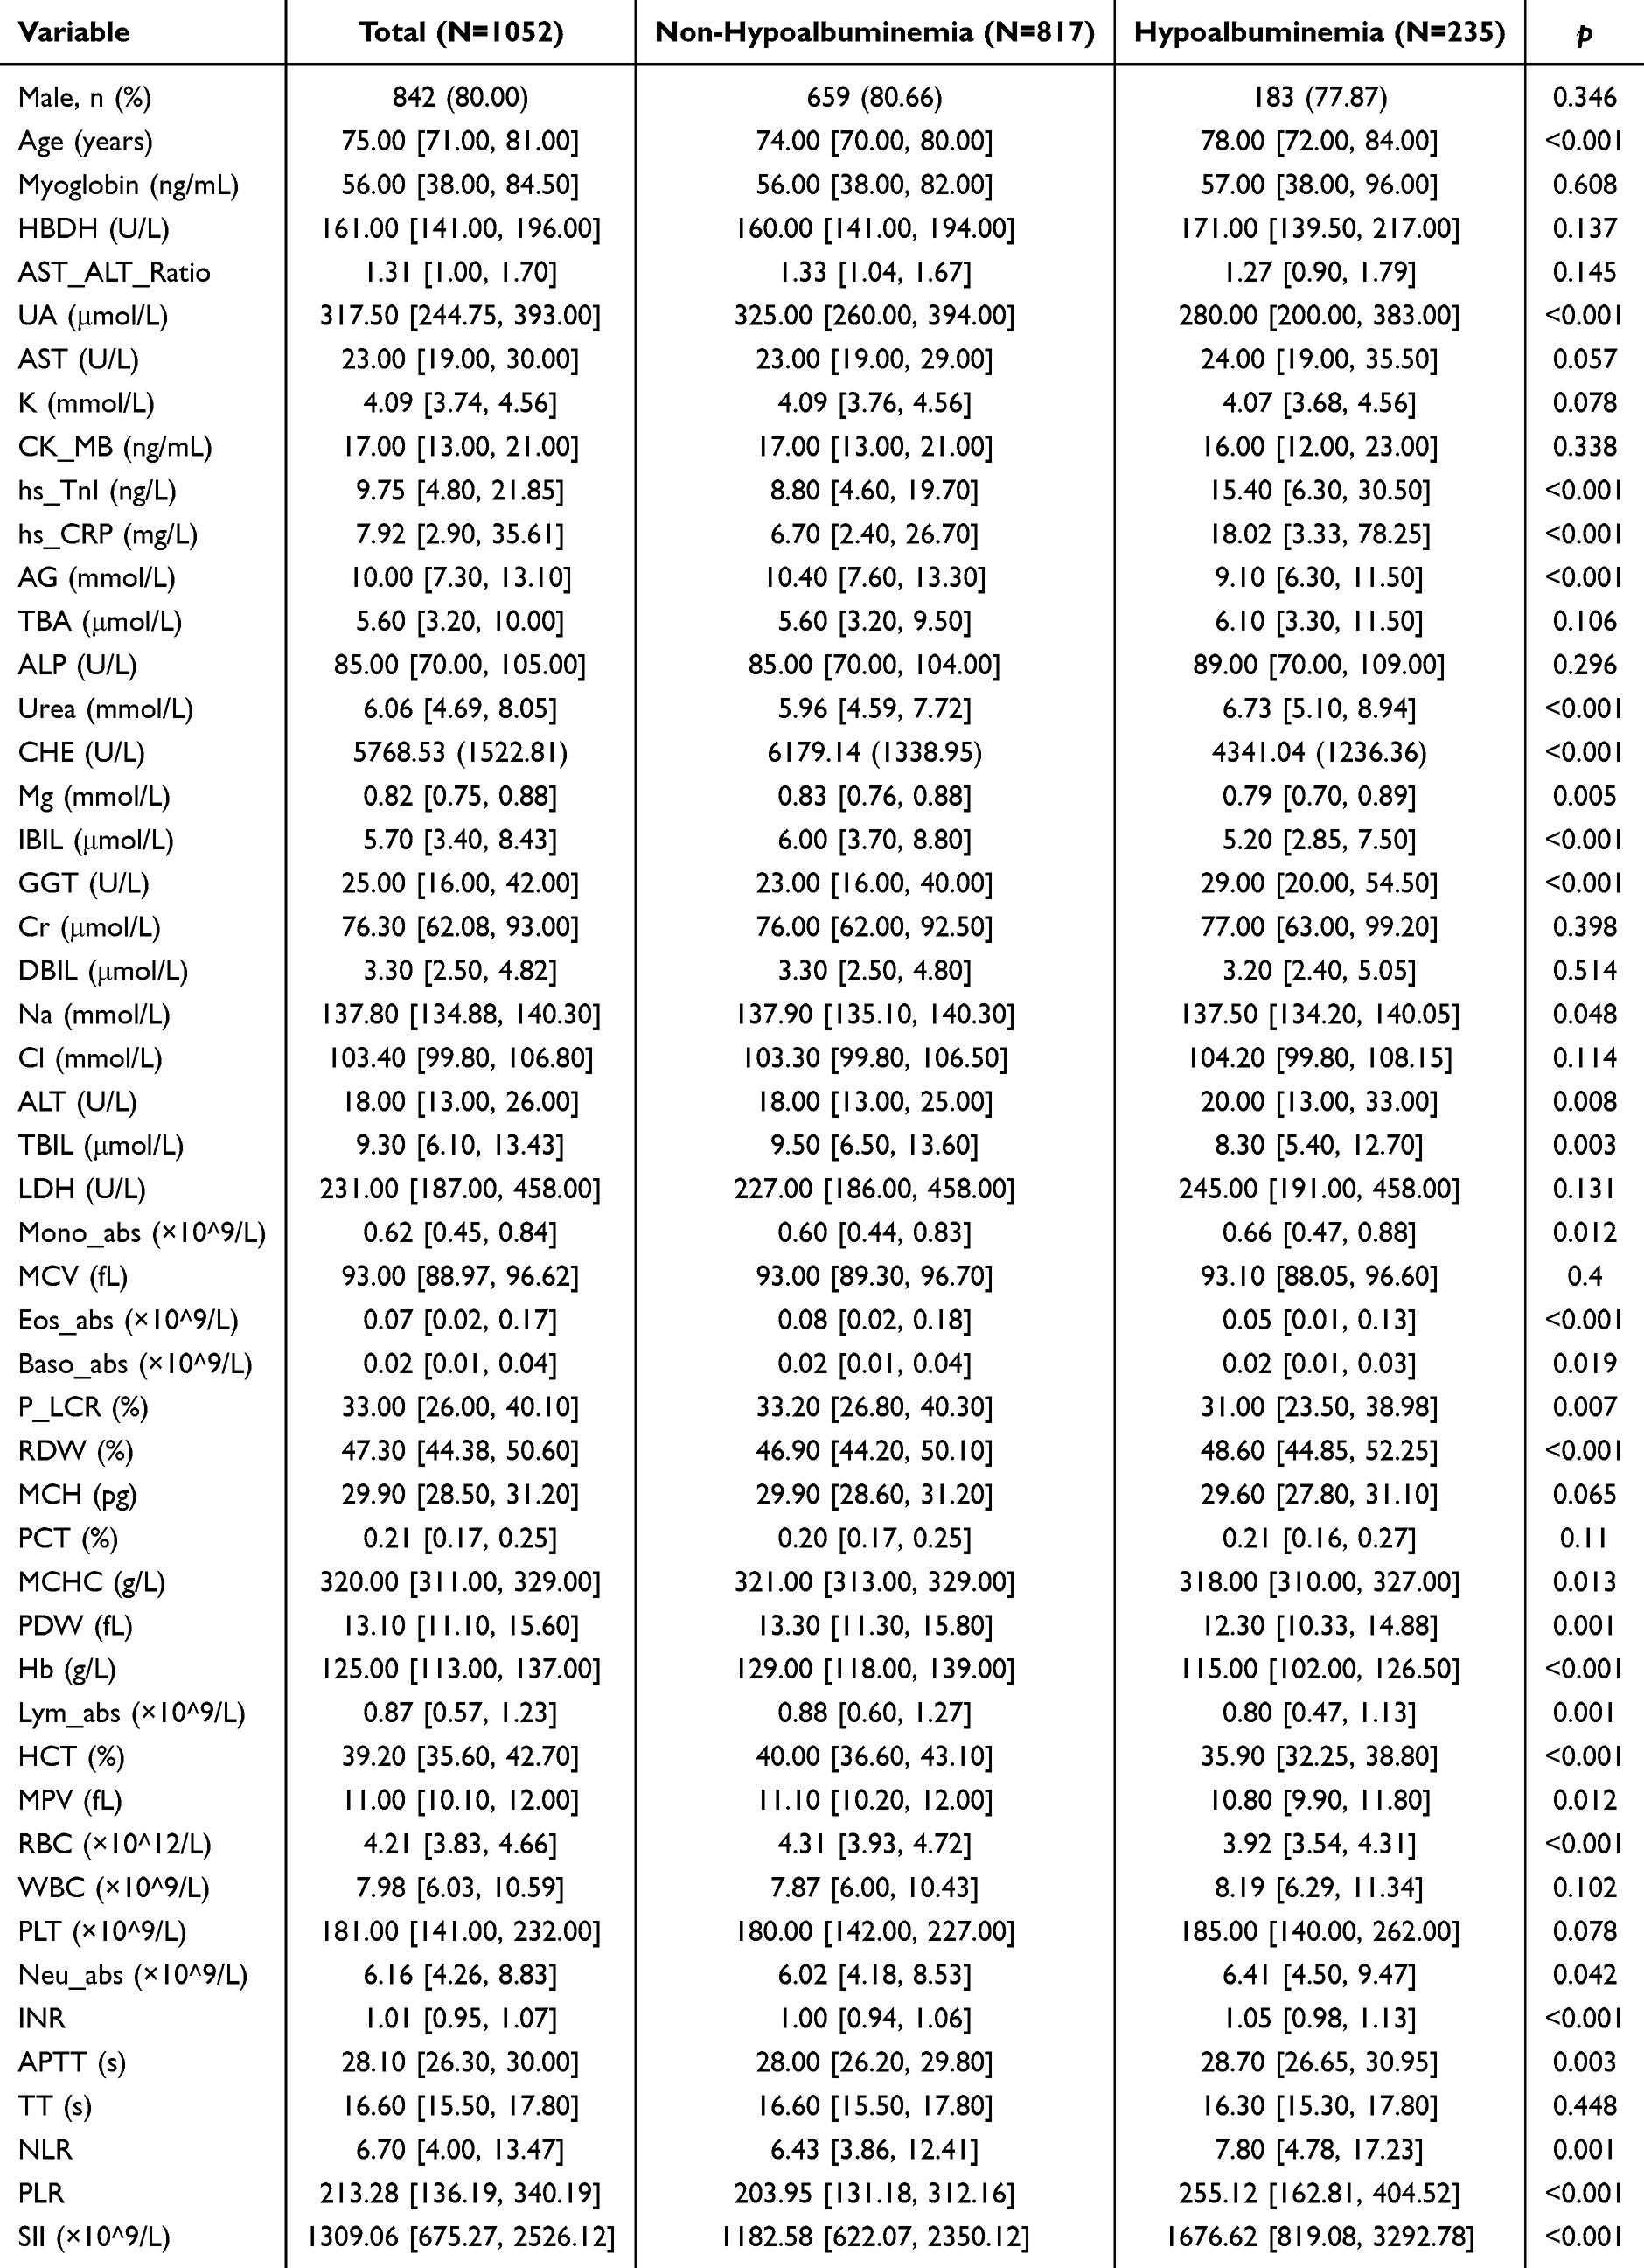 |
Table 1 Baseline Characteristics of the Training Cohort |
Feature Selection and Core Predictors
Univariable analyses were first conducted to screen candidate predictors associated with new-onset hypoalbuminemia. LASSO regression was then used to shrink coefficients and reduce multicollinearity, with cross-validation identifying an optimal penalty parameter (Figure 2a and b). In parallel, Boruta identified variables with stable importance across resampling (Figure 2c). The intersection of the three approaches yielded eight core predictors: CHE, hs-CRP, HCT, AG, Mg, ALT, age, and INR (Figure 2d). All predictors were obtained from routine admission tests within 24 hours.
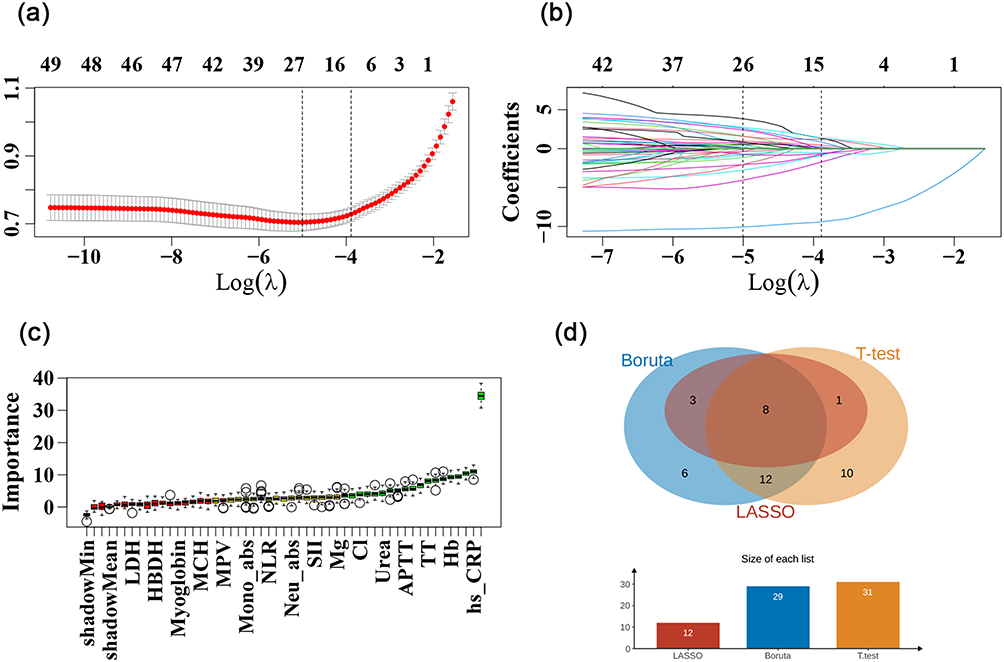 |
Figure 2 Feature-selection workflow and identification of the core predictors. (a) Coefficient path plot of the LASSO regression model; (b) selection of the optimal penalty parameter (λ) based on cross-validation; (c) Boruta algorithm results classifying features as important versus unimportant; (d) intersection of features selected by univariable analysis, LASSO regression, and the Boruta algorithm, yielding eight core predictors. |
Model Performance Comparison
Based on the eight core variables identified above, seven classification models were developed in the training set: LR, DT, RF, XGBoost, LightGBM, SVM, and ANN. Hyperparameter tuning was performed using a grid search combined with five-fold cross-validation, with AUC as the optimization objective.
In the internal validation set, all models demonstrated favorable discrimination (Figure 3a). The XGBoost model achieved an AUC of 0.85, which was numerically but only slightly higher than logistic regression and random forest (both AUC = 0.84). XGBoost also achieved a relatively balanced performance in terms of accuracy (0.78), sensitivity (0.79), specificity (0.78), and F1 score (0.62) (Table 2). While LightGBM, SVM, and ANN also presented AUCs ranging from 0.83 to 0.84, some of these models exhibited compromised sensitivity or specificity. Calibration curves indicated a satisfactory fit between predicted probabilities and observed frequencies across all models (Figure 3b). Decision curve analysis (DCA) suggested that within the majority of reasonable clinical threshold ranges, employing any of the models provided a positive net benefit compared with the treat-all or treat-none strategies (Figure 3c).
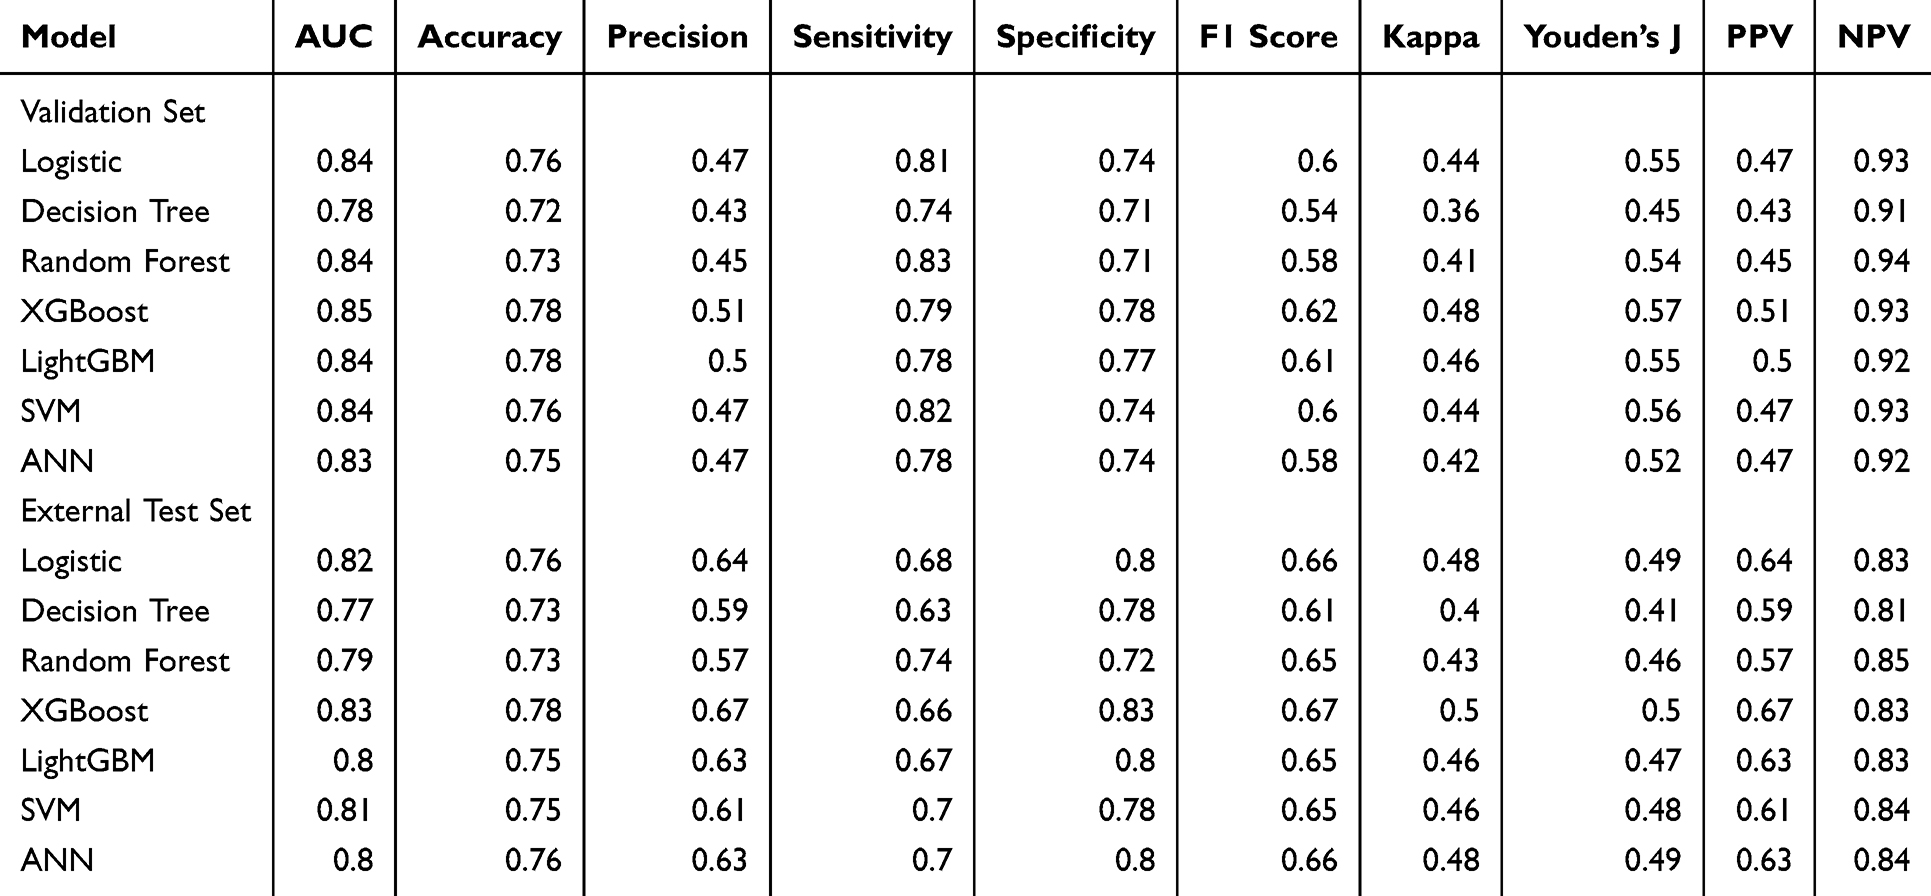 |
Table 2 Performance of Models in Internal Validation and External Test Sets |
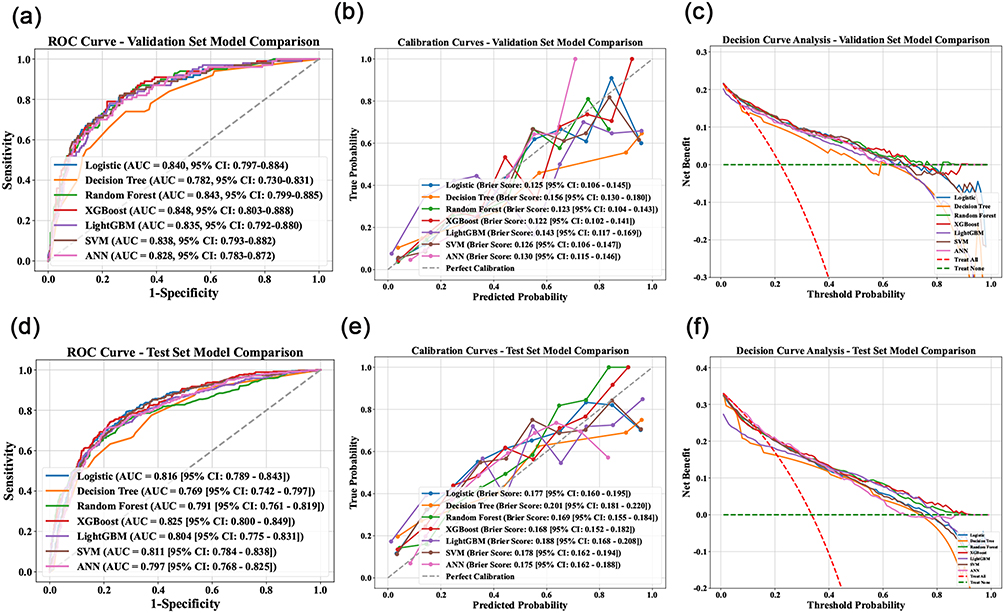 |
Figure 3 Model performance comparison. (a) ROC curves of all models in the internal validation set; (b) calibration curves in the internal validation set, showing agreement between predicted probabilities and observed event rates; (c) decision curve analysis in the internal validation set, illustrating net clinical benefit across a range of threshold probabilities; (d) ROC curves of all models in the external test set; (e) calibration curves in the external test set; (f) decision curve analysis in the external test set. |
In the independent external test set, the performance of all models declined slightly compared with the internal validation set but remained acceptable overall (Figure 3d). XGBoost retained the highest observed discrimination, with an AUC of 0.83 compared with 0.82 for logistic regression, indicating only a modest absolute difference in AUC. XGBoost achieved an accuracy of 0.78, sensitivity of 0.66, specificity of 0.83, and F1 score of 0.67 (Table 2). Accordingly, XGBoost was selected as the final model because of its overall balance across discrimination, calibration, and decision-curve performance rather than because of a large gain in discrimination alone. The external calibration curve demonstrated that the predicted probabilities of the XGBoost model aligned well with the actual risks (Figure 3e), and the external DCA further confirmed stable net benefit across a wide range of threshold probabilities (Figure 3f).
Global SHAP Analysis and Non-Linear Effects of Key Features
To enhance model interpretability, a global SHAP analysis was conducted on the final XGBoost model. The feature importance bar plot demonstrated that CHE had the highest mean absolute SHAP value regarding model output, identifying it as the most significant predictor. This was followed by hs-CRP, HCT, AG, Mg, ALT, age, and INR (Figure 4a). The SHAP beeswarm plot further elucidated the relationship between variable values and the direction of prediction: generally, lower values of CHE, HCT, AG, and Mg, as well as higher values of hs-CRP, age, and INR, tended to shift the model output toward the “occurrence of hypoalbuminemia” (SHAP value > 0), whereas values in the opposite direction were associated with lower risk (Figure 4b). SHAP dependence plots revealed non-linear and threshold effects for select key variables (Figure 4c). For instance, as CHE levels decreased, its positive SHAP value exhibited an approximately monotonic increase; specifically, when CHE was significantly lower than the population mean, its driving effect on risk became particularly prominent. Conversely, the positive contribution of hs-CRP to risk increased sharply at moderate-to-high levels, suggesting that a higher inflammatory burden correlates with a greater likelihood of hypoalbuminemia. Regarding HCT, when levels approached or fell below the lower quartile, the negative shift in model output (indicating a diminished protective effect) was evident. Notably, AG exhibited a “low-value risk” pattern; at low-normal or even mildly reduced levels, its SHAP values were predominantly located on the risk-increasing side, implying that hypoalbuminemia might mask certain signals of potential metabolic acidosis. Overall, the model’s decision-making process was primarily driven by multidimensional indicators, including liver synthetic function (CHE), systemic inflammation level (hs-CRP), anemia/volume status (HCT), acid-base/metabolic burden (AG), and coagulation function.
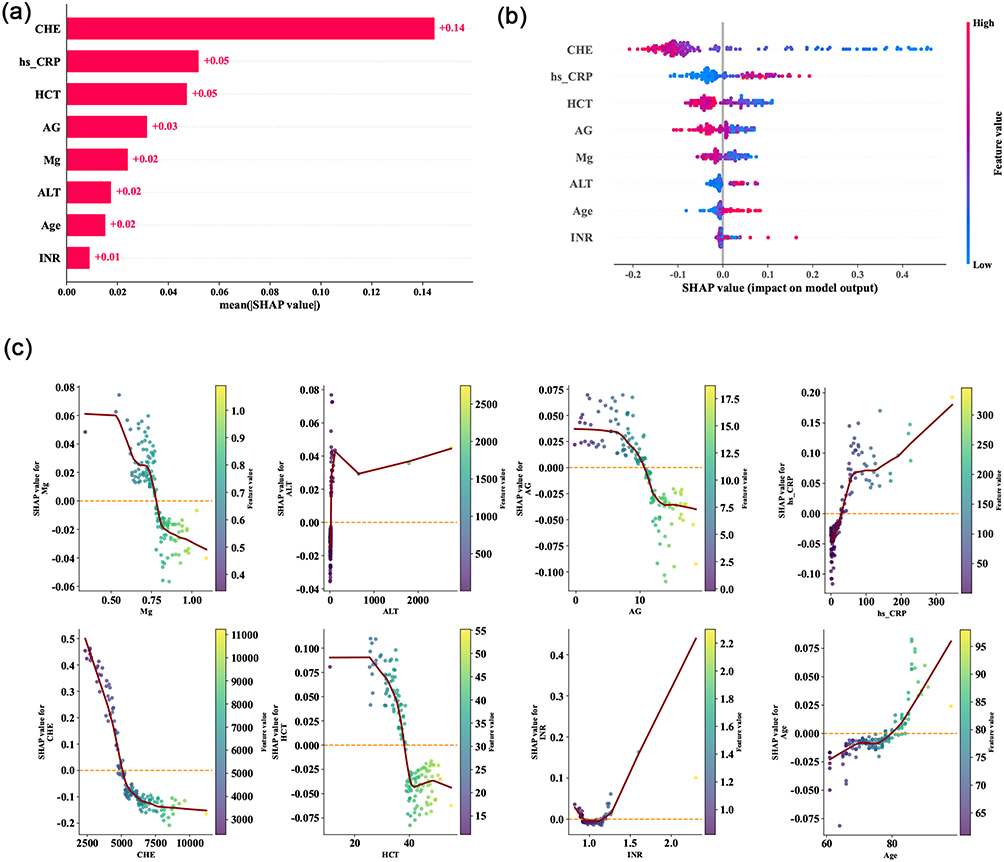 |
Figure 4 Global SHAP interpretability analysis of the XGBoost model. (a) SHAP feature-importance bar plot showing the mean absolute SHAP value for each predictor; (b) SHAP beeswarm plot illustrating the overall distribution of feature values and their corresponding contributions to predicted risk; (c) SHAP dependence plots for key predictors. |
Individual-Level SHAP Interpretation and Consistency Verification of the Web Calculator
To demonstrate the model’s interpretability at the individual patient level and to verify the consistency between the offline model and the online calculator, two representative elderly AECOPD patients were selected for illustration (Figure 5).
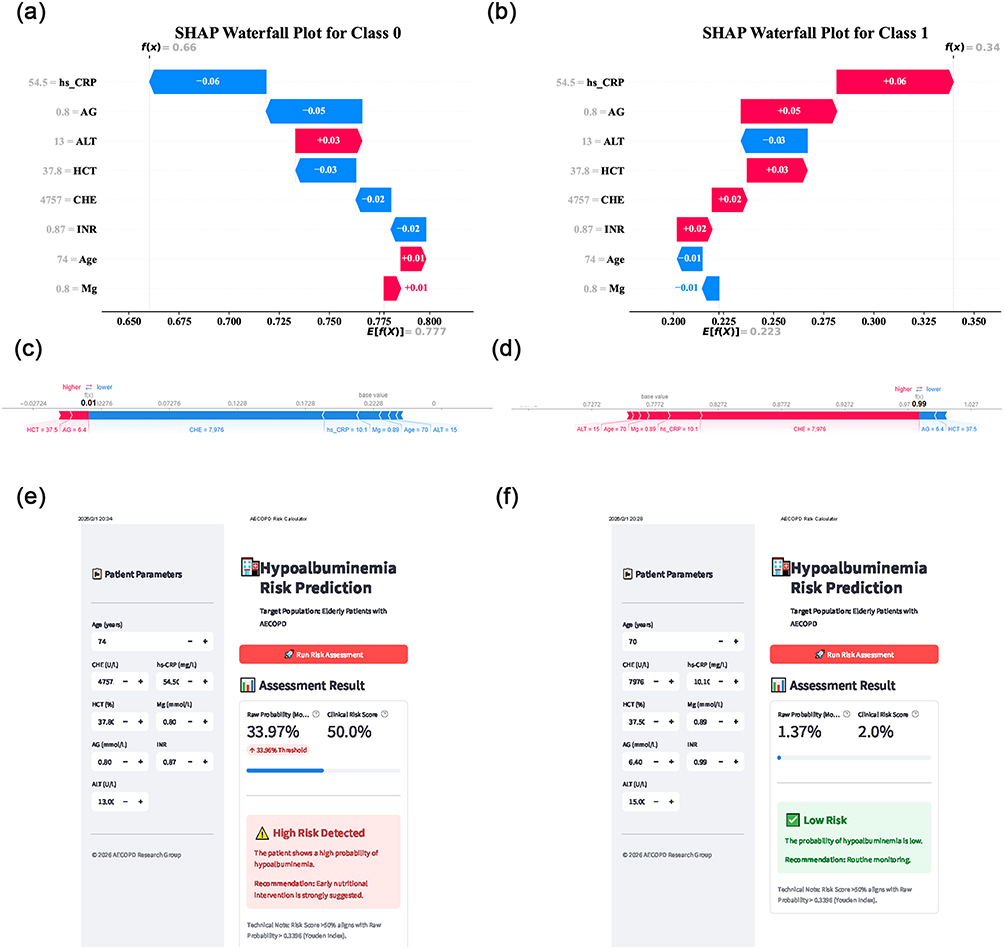 |
Figure 5 Individual-level SHAP interpretation and consistency verification of the web calculator. (a and b) SHAP waterfall plots for the high-risk case; (c and d) SHAP force plots for the low-risk case; (e) web-calculator output for the high-risk case; (f) web-calculator output for the low-risk case. |
For Case 1, admission laboratory results revealed a marked reduction in CHE, along with elevated hs-CRP and INR levels, accompanied by lower HCT, slightly decreased AG, and mild hypomagnesemia. Based on these features, the XGBoost model predicted a probability of hypoalbuminemia exceeding 33%, which surpassed the pre-set clinical intervention threshold of the web calculator. Consequently, the interface automatically prompted a “High Risk” alert, recommending “strengthened nutritional monitoring and intervention” (Figure 5e). The corresponding SHAP waterfall plot indicated that low CHE, low HCT, and low AG, combined with high hs-CRP and INR, were the primary positive contributors driving the risk upward. In contrast, certain indicators approaching normal ranges exerted a partial mitigating effect on the risk (Figure 5a and b).
In Case 2, indicators such as CHE, HCT, AG, and Mg were essentially within or near normal ranges, while hs-CRP and INR were only mildly elevated (Figure 5f). The model predicted a hypoalbuminemia probability of approximately 2%, falling far below the intervention threshold. The web calculator concluded “Low Risk,” suggesting “routine follow-up” (Figure 5f). The SHAP force plot demonstrated that the majority of features (eg., higher CHE, relatively normal HCT and AG) made negative contributions to the model output, shifting the prediction toward the non-occurrence of hypoalbuminemia (Figure 5c and d). Although factors such as slightly elevated hs-CRP and age marginally increased the risk, they were insufficient to alter the overall judgment. The risk probabilities obtained from the online calculator for both patients were completely consistent with the inferences from the offline model. This supports numerical consistency between the deployed calculator and the offline model; however, the web calculator should still be regarded as an exploratory aid until prospective clinical-impact validation is available.
Discussion
In this study, we developed an interpretable XGBoost-based model for predicting the risk of hypoalbuminemia in older patients with AECOPD. Among 1,052 patients, 22.3% met the study definition of new-onset hypoalbuminemia by discharge. This incidence falls within the mid-range of nutritional risk previously reported in respiratory disease populations.8 Based on eight routine indicators collected within 24 hours of admission (CHE, hs-CRP, HCT, AG, Mg, ALT, age, and INR), the final model achieved an AUC of 0.83 in the external test set, compared with 0.82 for logistic regression. Thus, the observed advantage of XGBoost was modest, but the model still provided an interpretable framework for early nutritional risk stratification using routinely available admission data. Compared with tools such as the BODE index, our model does not require exercise testing and may therefore be easier to apply in older, acutely ill patients. However, prediction alone does not demonstrate improved prognosis, and prospective validation is required before routine implementation.
In our model, CHE and hs-CRP exhibited the highest feature contribution, reflecting the interplay between hepatic synthetic capacity and systemic inflammatory burden. While albumin is a relatively delayed marker of acute stress, CHE is also synthesized by the liver and may decrease earlier when synthetic reserve is impaired. Our SHAP analysis showed that lower CHE levels at admission were associated with a higher predicted risk of subsequent hypoalbuminemia.27 Elevated CRP likewise reflects inflammatory burden during AECOPD.28 Taken together, these findings suggest that CHE and hs-CRP may capture the inflammatory-catabolic milieu of AECOPD, but they should not be interpreted as proving a direct mechanistic pathway. Age also emerged as an independent predictor, likely reflecting accumulated frailty, multimorbidity, chronic inflammation, and diminished physiologic reserve in older hospitalized patients.29
The inclusion of INR and ALT in our model adds a broader systemic-hepatic dimension to nutritional risk assessment. We found that mild elevations in ALT and prolonged INR were associated with hypoalbuminemia, and low HCT was also more common among patients who developed the outcome. One possible explanation is that these variables reflect systemic illness, hypoxic stress, occult hepatic dysfunction, or venous congestion; however, in the absence of echocardiographic or hemodynamic data, any interpretation in terms of cardio-hepatic congestion remains speculative. Accordingly, these markers should be viewed as associative risk signals rather than proof of a specific causal pathway.30
Additionally, we observed a non-linear relationship between AG and the risk of hypoalbuminemia. Since albumin is a major plasma anion, a decrease in albumin concentration can lower uncorrected AG readings, which may complicate the interpretation of acid-base balance.31 Our model identified low-normal AG values as potentially informative, but this finding should be interpreted cautiously and requires further mechanistic study. Hypomagnesemia was also associated with higher risk. Prior studies have reported frequent hypomagnesemia during acute COPD exacerbations,32 and magnesium is biologically relevant to multiple enzymatic and metabolic pathways.33 Nevertheless, our study did not capture corticosteroid dose or other treatment exposures, so the relationship between lower magnesium and hypoalbuminemia should be regarded as observational rather than causal.
Compared with existing prognostic tools, our model offers practical advantages. Traditional scores such as the BODE index (body mass index, airflow obstruction, dyspnea, and exercise capacity) and the DOSE index (dyspnea, obstruction, smoking, and exacerbation) require symptom- or performance-based assessment that may be difficult to obtain in older patients during the acute phase. In contrast, all variables in our model are derived from routine tests. By integrating inflammatory (CRP) and hepatic synthetic (CHE) indicators, the model achieves nutritional risk prediction without incurring additional examination costs. It is worth noting that PA (prealbumin), although recommended for nutritional assessment, is itself a negative acute-phase protein that decreases rapidly under inflammatory conditions, making nutritional interpretation challenging.34 The main practical appeal of our model is therefore its accessibility. At the same time, the performance gain of XGBoost over logistic regression was small; its value in this study lies more in handling non-linearity and providing SHAP-based interpretability than in a large increase in AUC.
Several limitations of this study must be acknowledged. First, the retrospective design may introduce selection bias; although we mitigated this through multicenter external validation, prospective validation remains necessary. Second, the source database lacked several clinically relevant confounders, including body mass index (BMI), smoking status, COPD severity, corticosteroid dose, structured nutritional assessment at admission, and active malignancy/chemotherapy status; these unmeasured factors may have influenced both albumin dynamics and model predictions. Third, because the outcome was identified by normal admission albumin plus a discharge diagnosis of hypoalbuminemia, the exact inpatient albumin remeasurement frequency and the median time from admission to outcome identification were unavailable. Fourth, the model used only baseline admission data and did not capture treatment effects during hospitalization, including nutritional support and other evolving therapies. Fifth, although multicenter validation was performed, center-specific laboratory calibration differences may still affect transportability. Finally, the external sensitivity of 66% indicates that some at-risk patients would still be missed. Therefore, the calculator should be viewed as an adjunctive risk-stratification tool rather than evidence that early detection improves outcomes; prospective impact studies are needed before clinical implementation.
Conclusion
In summary, we developed and externally tested an interpretable machine learning model to predict the risk of new-onset hypoalbuminemia in older AECOPD patients. Using routine admission laboratory indicators, the model may help identify patients who warrant closer nutritional monitoring without additional testing. However, its incremental advantage over logistic regression was modest, and prospective studies are still needed to further evaluate its clinical utility before routine implementation.
Abbreviations
AECOPD, acute exacerbation of chronic obstructive pulmonary disease; AG, anion gap; EPV, events-per-variable; AUC, area under the curve; DCA, decision curve analysis; SHAP, SHapley Additive exPlanations; XGBoost, extreme gradient boosting; ALT, alanine aminotransferase; BMI, body mass index; BODE, body mass index, airflow obstruction, dyspnea, and exercise capacity; CHE, cholinesterase; COPD, chronic obstructive pulmonary disease; DOSE, dyspnea, obstruction, smoking, and exacerbation; GOLD, Global Initiative for Chronic Obstructive Lung Disease; HCT, hematocrit; INR, international normalized ratio; Mg, magnesium; NPV, negative predictive value; PA, prealbumin; PPV, positive predictive value; NLR, neutrophil-to-lymphocyte ratio; PLR, platelet-to-lymphocyte ratio; SII, systemic immune-inflammation index.
Data Sharing Statement
Data will be available upon reasonable request to the corresponding author (via email) after institutional approval and with a signed data access agreement or with the permission of our hospital.
Ethics Declarations
This was a dual-center, retrospective cohort study. The study protocol was approved by the Ethics Committee of Zigong First People’s Hospital (Approval No.: (M)2026-015) and Qiannan People’s Hospital, Guizhou Province (Approval No.: 2026-qnzy-04). Due to the retrospective design, informed consent was waived. Data were collected from January 2023 to December 2025. The study was conducted in accordance with the Declaration of Helsinki. Study design, predictor handling, model development, and external validation were reported with reference to key items from the TRIPOD+AI statement and domains emphasized by PROBAST+AI.
Author Contributions
All authors made a significant contribution to the work reported, whether in the conception, study design, execution, acquisition of data, analysis and interpretation, or in all these areas; took part in drafting, revising, or critically reviewing the article; gave final approval of the version to be published; agreed on the journal to which the article has been submitted; and agree to be accountable for all aspects of the work.
Funding
This work was supported by the 2025 Zigong Institute of Integrated Chinese and Western Medicine Collaborative Innovation Research Program (Grant No. 2025ZXY0209) and the Scientific Research Project of the Health Commission of Guizhou Province (Grant No. gzwkj2024-467).
Disclosure
The authors declare no competing interests.
References
1. Liu S, Liu T, Lu C, et al. Associations of socioeconomic status and health lifestyles with chronic obstructive pulmonary disease: two nationwide population-based studies. BMC Public Health. 2025;25(1):2310. doi:10.1186/s12889-025-23568-5
2. Fan Y, Chen Q, Sun H, et al. Economic evaluations of screening and case-finding for Chronic Obstructive Pulmonary Disease (COPD): a systematic review. NPJ Prim Care Respir Med. 2026;36(1):7. doi:10.1038/s41533-025-00467-1
3. Li Y, Tang X, Zhang R, et al. Research progress in early states of chronic obstructive pulmonary disease: a narrative review on PRISm, pre-COPD, young COPD and mild COPD. Expert Rev Respir Med. 2025;19(10):1063–13. doi:10.1080/17476348.2025.2526775
4. Qin J, Wang G, Liao Y, Shang W, Han D. High flow nasal therapy versus noninvasive ventilation for AECOPD with acute hypercapnic respiratory failure: a meta-analysis of randomized controlled trials. Ann Intensive Care. 2025;15(1):64. doi:10.1186/s13613-025-01480-w
5. Kanani J. Autopsy Analysis of Sudden Deaths in Adults: causes and Demographics from a One-Year Prospective Study. Curr Health Sci J. 2025;51(3):343–349. doi:10.12865/chsj.51.03.05
6. Zinellu E, Fois AG, Sotgiu E, et al. Serum Albumin Concentrations in Stable Chronic Obstructive Pulmonary Disease: a Systematic Review and Meta-Analysis. J Clin Med. 2021;10(2):269. doi:10.3390/jcm10020269
7. Soeters PB, Wolfe RR, Shenkin A. Hypoalbuminemia: pathogenesis and Clinical Significance. JPEN J Parenter Enteral Nutr. 2019;43(2):181–193. doi:10.1002/jpen.1451
8. Zhang X, Wang Y, Xu M, Zhang Y, Lyu Q. The malnutrition in AECOPD and its association with unfavorable outcomes by comparing PNI, GNRI with the GLIM criteria: a retrospective cohort study. Front Nutr. 2024;11:1365462. doi:10.3389/fnut.2024.1365462
9. Yu Z, He J, Chen Y, Zhou Z, Wang L. Chronic obstructive pulmonary disease as a risk factor for sarcopenia: a systematic review and meta-analysis. PLoS One. 2024;19(4):e0300730. doi:10.1371/journal.pone.0300730
10. Ding CW, Huang SS, Xu YH, et al. Lactate dehydrogenase to albumin ratio and prognosis in patients with acute exacerbation of chronic obstructive pulmonary disease: a retrospective cohort study. BMC Pulm Med. 2025;25(1):154. doi:10.1186/s12890-025-03622-z
11. Iwagami M, Inokuchi R, Kawakami E, et al. Comparison of machine-learning and logistic regression models for prediction of 30-day unplanned readmission in electronic health records: a development and validation study. PLOS Digit Health. 2024;3(8):e0000578. doi:10.1371/journal.pdig.0000578
12. Jia Q, Chen Y, Zen Q, et al. Development and Validation of Machine Learning-Based Models for Prediction of Intensive Care Unit Admission and In-Hospital Mortality in Patients with Acute Exacerbations of Chronic Obstructive Pulmonary Disease. Chronic Obstr Pulm Dis. 2024;11(5):460–471. doi:10.15326/jcopdf.2023.0446
13. Yin Q, Guo N, Fu P, Zhong H. Assessment of iron metabolism and iron deficiency in incident patients on incident continuous ambulatory peritoneal dialysis. Open Med. 2024;19(1):20241035. doi:10.1515/med-2024-1035
14. Wang Y, Ye Y, Xuan L, et al. Impact of early high protein intake in critically ill patients: a randomized controlled trial. Nutr Metab. 2024;21(1):39. doi:10.1186/s12986-024-00818-8
15. Hrnciarikova D, Juraskova B, Hyspler R, et al. A changed view of serum prealbumin in the elderly: prealbumin values influenced by concomitant inflammation. Biomed Pap Med Fac Univ Palacky Olomouc Czech Repub. 2007;151(2):273–276. doi:10.5507/bp.2007.046
16. Li CL, Chang HC, Tseng CW, et al. Comparison of BODE and ADO Indices in Predicting COPD-Related Medical Costs. Medicina. 2023;59(3):577. doi:10.3390/medicina59030577
17. Chaddad A, Peng J, Xu J, Bouridane A. Survey of Explainable AI Techniques in Healthcare. Sensors. 2023;23(2):634. doi:10.3390/s23020634
18. Muhammad D, Bendechache M. Unveiling the black box: a systematic review of Explainable Artificial Intelligence in medical image analysis. Comput Struct Biotechnol J. 2024;24:542–560. doi:10.1016/j.csbj.2024.08.005
19. Narasimhan P, Iqbal U, Li YC. Artificial intelligence in clinical risk prediction: promise, performance and the path forward? BMJ Health Care Inform. 2025;32(1):e101707. doi:10.1136/bmjhci-2025-101707
20. Moons KGM, Damen JAA, Kaul T, et al. PROBAST+AI: an updated quality, risk of bias, and applicability assessment tool for prediction models using regression or artificial intelligence methods. BMJ. 2025;388:e082505. doi:10.1136/bmj-2024-082505
21. Collins GS, Moons KGM, Dhiman P, et al. TRIPOD+AI statement: updated guidance for reporting clinical prediction models that use regression or machine learning methods. BMJ. 2024;385:e078378. doi:10.1136/bmj-2023-078378
22. Agustí A, Celli BR, Criner GJ, et al. Global Initiative for Chronic Obstructive Lung Disease 2023 Report: GOLD Executive Summary. Eur Respir J. 2023;61(4):2300239. doi:10.1183/13993003.00239-2023
23. Park HJ, Song Y, Kim Y, et al. Low levels of serum albumin and blood basophils as 10-year mortality predictors in a nationwide Korean COPD cohort. Sci Rep. 2025;15(1):43924. doi:10.1038/s41598-025-27653-y
24. Hu Y, Wang X, Xiao S, et al. Development and validation of a risk nomogram model for predicting pulmonary hypertension in patients with stage 3-5 chronic kidney disease. Int Urol Nephrol. 2023;55(5):1353–1363. doi:10.1007/s11255-022-03431-x
25. Chen YW, Leung JM, Sin DD. A Systematic Review of Diagnostic Biomarkers of COPD Exacerbation. PLoS One. 2016;11(7):e0158843. doi:10.1371/journal.pone.0158843
26. Nuñez A, Marras V, Harlander M, et al. Association Between Routine Blood Biomarkers and Clinical Phenotypes and Exacerbations in Chronic Obstructive Pulmonary Disease. Int J Chron Obstruct Pulmon Dis. 2020;15:681–690. doi:10.2147/copd.S240720
27. Xu Y, Zhang L, Zhu L, et al. Prognostic Value of Biomarkers in Chronic Obstructive Pulmonary Disease: a Comprehensive Review. Int J Chron Obstruct Pulmon Dis. 2025;20:3123–3134. doi:10.2147/copd.S531935
28. Hoult G, Gillespie D, Wilkinson TMA, Thomas M, Francis NA. Biomarkers to guide the use of antibiotics for acute exacerbations of COPD (AECOPD): a systematic review and meta-analysis. BMC Pulm Med. 2022;22(1):194. doi:10.1186/s12890-022-01958-4
29. Chen Z, Zha L, Feng G, et al. Prognostic Value of Serum Cholinesterase Levels for In-Hospital Mortality among Patients with Acute Exacerbation of Chronic Obstructive Pulmonary Disease. Copd. 2023;20(1):178–185. doi:10.1080/15412555.2023.2209178
30. Miida S, Kamimura H, Fujiki S, et al. Image analysis of cardiac hepatopathy secondary to heart failure: machine learning vs gastroenterologists and radiologists. World J Gastroenterol. 2025;31(34):108807. doi:10.3748/wjg.v31.i34.108807
31. Qu J, Tang X, Cheng Y, Xiong W, Zhao Y. Association Between Albumin Corrected Anion Gap and 28-Day All-Cause Mortality in Patients With Acute Respiratory Failure in ICU: a Retrospective Study Based on the MIMIC-IV Database. Clin Respir J. 2025;19(7):e70100. doi:10.1111/crj.70100
32. Makwana S, Patel A, Sonagara M. Correlation Between Serum Magnesium Level and Acute Exacerbation in Patients With Chronic Obstructive Pulmonary Disease (COPD). Cureus. 2022;14(6):e26229. doi:10.7759/cureus.26229
33. Fawcett WJ, Haxby EJ, Male DA. Magnesium: physiology and pharmacology. Br J Anaesth. 1999;83(2):302–320. doi:10.1093/bja/83.2.302
34. Lourenço P, Silva S, Friões F, et al. Low prealbumin is strongly associated with adverse outcome in heart failure. Heart. 2014;100(22):1780–1785. doi:10.1136/heartjnl-2014-305747
 © 2026 The Author(s). This work is published and licensed by Dove Medical Press Limited. The
full terms of this license are available at https://www.dovepress.com/terms
and incorporate the Creative Commons Attribution
- Non Commercial (unported, 4.0) License.
By accessing the work you hereby accept the Terms. Non-commercial uses of the work are permitted
without any further permission from Dove Medical Press Limited, provided the work is properly
attributed. For permission for commercial use of this work, please see paragraphs 4.2 and 5 of our Terms.
© 2026 The Author(s). This work is published and licensed by Dove Medical Press Limited. The
full terms of this license are available at https://www.dovepress.com/terms
and incorporate the Creative Commons Attribution
- Non Commercial (unported, 4.0) License.
By accessing the work you hereby accept the Terms. Non-commercial uses of the work are permitted
without any further permission from Dove Medical Press Limited, provided the work is properly
attributed. For permission for commercial use of this work, please see paragraphs 4.2 and 5 of our Terms.
Recommended articles
Development and Validation of a Nomogram for Predicting Risk of Emergency Department Revisits in Chinese Older Patients
Fan L, Xue H, Wang Q, Yan Y, Du W
Risk Management and Healthcare Policy 2022, 15:2283-2295
Published Date: 6 December 2022
Interprofessional Management of (Risk of) Malnutrition and Sarcopenia: A Grounded Theory Study from the Perspective of Professionals
Boxum SD, van Exter SH, Reinders JJ, Koenders N, Drenth H, van den Berg MGA, Tieland M, Spoorenberg SLW, Finnema EJ, van der Wees PJ, Jager-Wittenaar H
Journal of Multidisciplinary Healthcare 2024, 17:4677-4692
Published Date: 9 October 2024
Risk Factors for Gout in Taiwan Biobank: A Machine Learning Approach
Liu YR, Nfor ON, Zhong JH, Lin CY, Liaw YP
Journal of Inflammation Research 2024, 17:9847-9856
Published Date: 26 November 2024
Identification of Risk Group for Root Caries and Analysis of Associated Factors in Older Adults Using Unsupervised Machine Learning Clustering
Jiang L, Huang S, Reissmann DR, Schmalz G, Li J
Clinical Interventions in Aging 2025, 20:483-493
Published Date: 24 April 2025
Construction and Validation of a Machine Learning-Based Risk Prediction Model for Sleep Quality in Patients with OSA
Tong Y, Wen K, Li E, Ai F, Tang P, Wen H, Guo B
Nature and Science of Sleep 2025, 17:1271-1289
Published Date: 12 June 2025