Back to Journals » Risk Management and Healthcare Policy » Volume 19
Development and Validation of a Risk-Prediction Nomogram for Nutritional Risk in Non-Dialysis Chronic Renal Failure Patients
Authors Yu C, Xu F, Lin Q, Li L
Received 15 September 2025
Accepted for publication 26 January 2026
Published 7 February 2026 Volume 2026:19 567783
DOI https://doi.org/10.2147/RMHP.S567783
Checked for plagiarism Yes
Review by Single anonymous peer review
Peer reviewer comments 2
Editor who approved publication: Dr Keon-Hyung Lee
Chenxin Yu,1 Fei Xu,2 Qin Lin,3 Ling Li3
1The Fourth Clinical Medical College, Zhejiang Chinese Medical University, Hangzhou, 310053, People’s Republic of China; 2School of Nursing, Zhejiang Chinese Medical University, Hangzhou, 310053, People’s Republic of China; 3School of Nursing, Zhejiang Shuren University, Hangzhou, 310015, People’s Republic of China
Correspondence: Ling Li, School of Nursing, Zhejiang Shuren University, No. 8 Shuren Street, Gongshu District, Hangzhou, 310015, People’s Republic of China, Tel +86 17364527138, Email [email protected]
Objective: This study aimed to develop and validate a risk prediction model for malnutrition in non-dialysis chronic renal failure (ND-CRF) patients, and to explore its status and influencing factors.
Methods: A total of 421 ND-CRF patients treated at a tertiary general hospital in Zhejiang Province from August 1, 2022, to September 30, 2023, were enrolled. By comparing various indicators between the malnutrition group (119 patients) and the normal nutrition group (302 patients), univariate and multivariate logistic regression analyses were performed to identify influencing factors. A risk prediction model was developed and internally validated using the Bootstrap resampling method. Subsequently, 117 ND-CRF patients from another tertiary hospital in Zhejiang Province (October 1, 2023, to January 31, 2024) were selected for external validation. Calibration plots and decision curve analysis (DCA) were used to assess discrimination and clinical utility.
Results: The incidence of malnutrition was 27.70%. The final nomogram incorporated four clinical predictors (gender, serum albumin, glomerular filtration rate, triglycerides) and two psychological predictors (anxiety and depression), with an AUC of 0.795 (95% CI: 0.745– 0.844). Internal and external validation yielded AUCs of 0.776 (95% CI: 0.836– 0.904) and 0.825 (95% CI: 0.742– 0.908), respectively. The calibration curve indicated good agreement between predicted and actual probabilities of malnutrition. DCA demonstrated the model’s clinical net benefit across a range of threshold probabilities in both the development and validation cohorts.
Conclusion: A nomogram-based risk prediction model for malnutrition in ND-CRF patients has been successfully developed and validated. This model shows good predictive performance and can assist clinicians in early identification of high-risk individuals, providing a foundation for developing and implementing personalized intervention strategies.
Keywords: non-dialysis chronic renal failure, malnutrition, model development, model validation, predictive model
Introduction
Chronic kidney disease (CKD) refers to structural or functional abnormalities of the kidneys persisting for more than three months.1 Globally, approximately 697.5 million people are affected by CKD, with a prevalence of about 9.10%.2 Nearly one‑third of cases are in China and India, with an estimated 113.23 million individuals affected in China.2 Chronic renal failure (CRF) is the progressive outcome of various CKDs, characterized by kidney damage, decreased glomerular filtration rate, and associated metabolic disturbances.3 In China, the annual incidence of CRF ranges from 100 to 150 cases per million people.4 Most CRF patients rely on hemodialysis, peritoneal dialysis, or kidney transplantation to delay progression and extend survival. However, the prolonged course and high treatment costs impose significant economic and psychological burdens on patients, families, and society. Malnutrition is a key risk factor in CKD progression.5 Its prevalence among CRF patients in China is notably high: 60–80% overall, 11.70–47.80% in peritoneal dialysis patients, 30–66.70% in hemodialysis patients, and 38.20–43% in ND-CRF patients.6–9 Studies show high rates of protein‑energy malnutrition in both advanced non‑dialysis and dialysis patients.10 Contributing factors include inflammation, oxidative and carbonyl stress, hormonal imbalance, reduced intestinal nutrient absorption, protein loss during dialysis—especially peritoneal dialysis—and metabolic acidosis.11–14 ND-CRF patients are particularly prone to sarcopenia, anemia, calcium‑phosphate disorders, renal bone disease, cardiovascular complications, and infections.15–18 These complications contribute to high morbidity and mortality and severely impair quality of life.15 Therefore, early prediction of nutritional risk in ND-CRF patients is critically important.
Currently, research on malnutrition risk prediction models for CRF patients, both domestically and internationally, has primarily focused on hemodialysis and peritoneal dialysis populations. For hemodialysis patients, Liu Xueqin,19 Ma Guoting,20 and Wei Min21 developed risk prediction models for malnutrition using logistic regression. Tsai et al22 applied the C5.0 decision tree, logistic regression, and support vector machine (SVM) methods to analyze influencing factors for malnutrition in this group. Yang23 reported a deep learning-based model predicting the risk of low serum albumin in new hemodialysis patients. In peritoneal dialysis, Chai Guifen24 and Mei et al25 used logistic regression to identify predictors and construct models for protein-energy wasting. However, nutritional assessment for non-dialysis patients has received insufficient attention, with only Li Xueqin26 developing a malnutrition risk prediction model specifically for hospitalized CKD patients. Most existing models only incorporate dietary status, laboratory indicators, and disease-related factors, neglecting psychological aspects. Moreover, apart from studies by Liu Xueqin19 and Chai Guifen,24 most previous research has been retrospective, inevitably introducing selection and information biases that may affect model accuracy. Additionally, while internal and external validation are crucial for developing reliable prediction models, most studies—except for Liu Xueqin,19 which conducted external validation only—have performed internal validation alone, lacking external validation support. Furthermore, many studies, such as those by Tsai,22 Chai Guifen,24 and Li Xueqin,26 did not adequately report on model discrimination, calibration, or clinical utility, limiting the assessment of their practical application value.
This study will adopt a cross-sectional survey to analyze influencing factors of malnutrition in ND-CRF patients. Based on this analysis, we will develop a malnutrition risk prediction model for this population and perform both internal and external validation, aiming to provide a reference for nutritional interventions in these patients.
Methods
Research Objects
ND-CRF patients were enrolled using convenience sampling from a tertiary Grade A general hospital in Hangzhou, Zhejiang Province, between August 1, 2022, and September 30, 2023. For external validation, convenience sampling was also applied to recruit ND-CRF patients from the nephrology department of another tertiary Grade A general hospital in Shaoxing, Zhejiang Province, from October 1, 2023, to January 31, 2024. The general characteristics of both groups of ND-CRF patients are presented in Table 1.
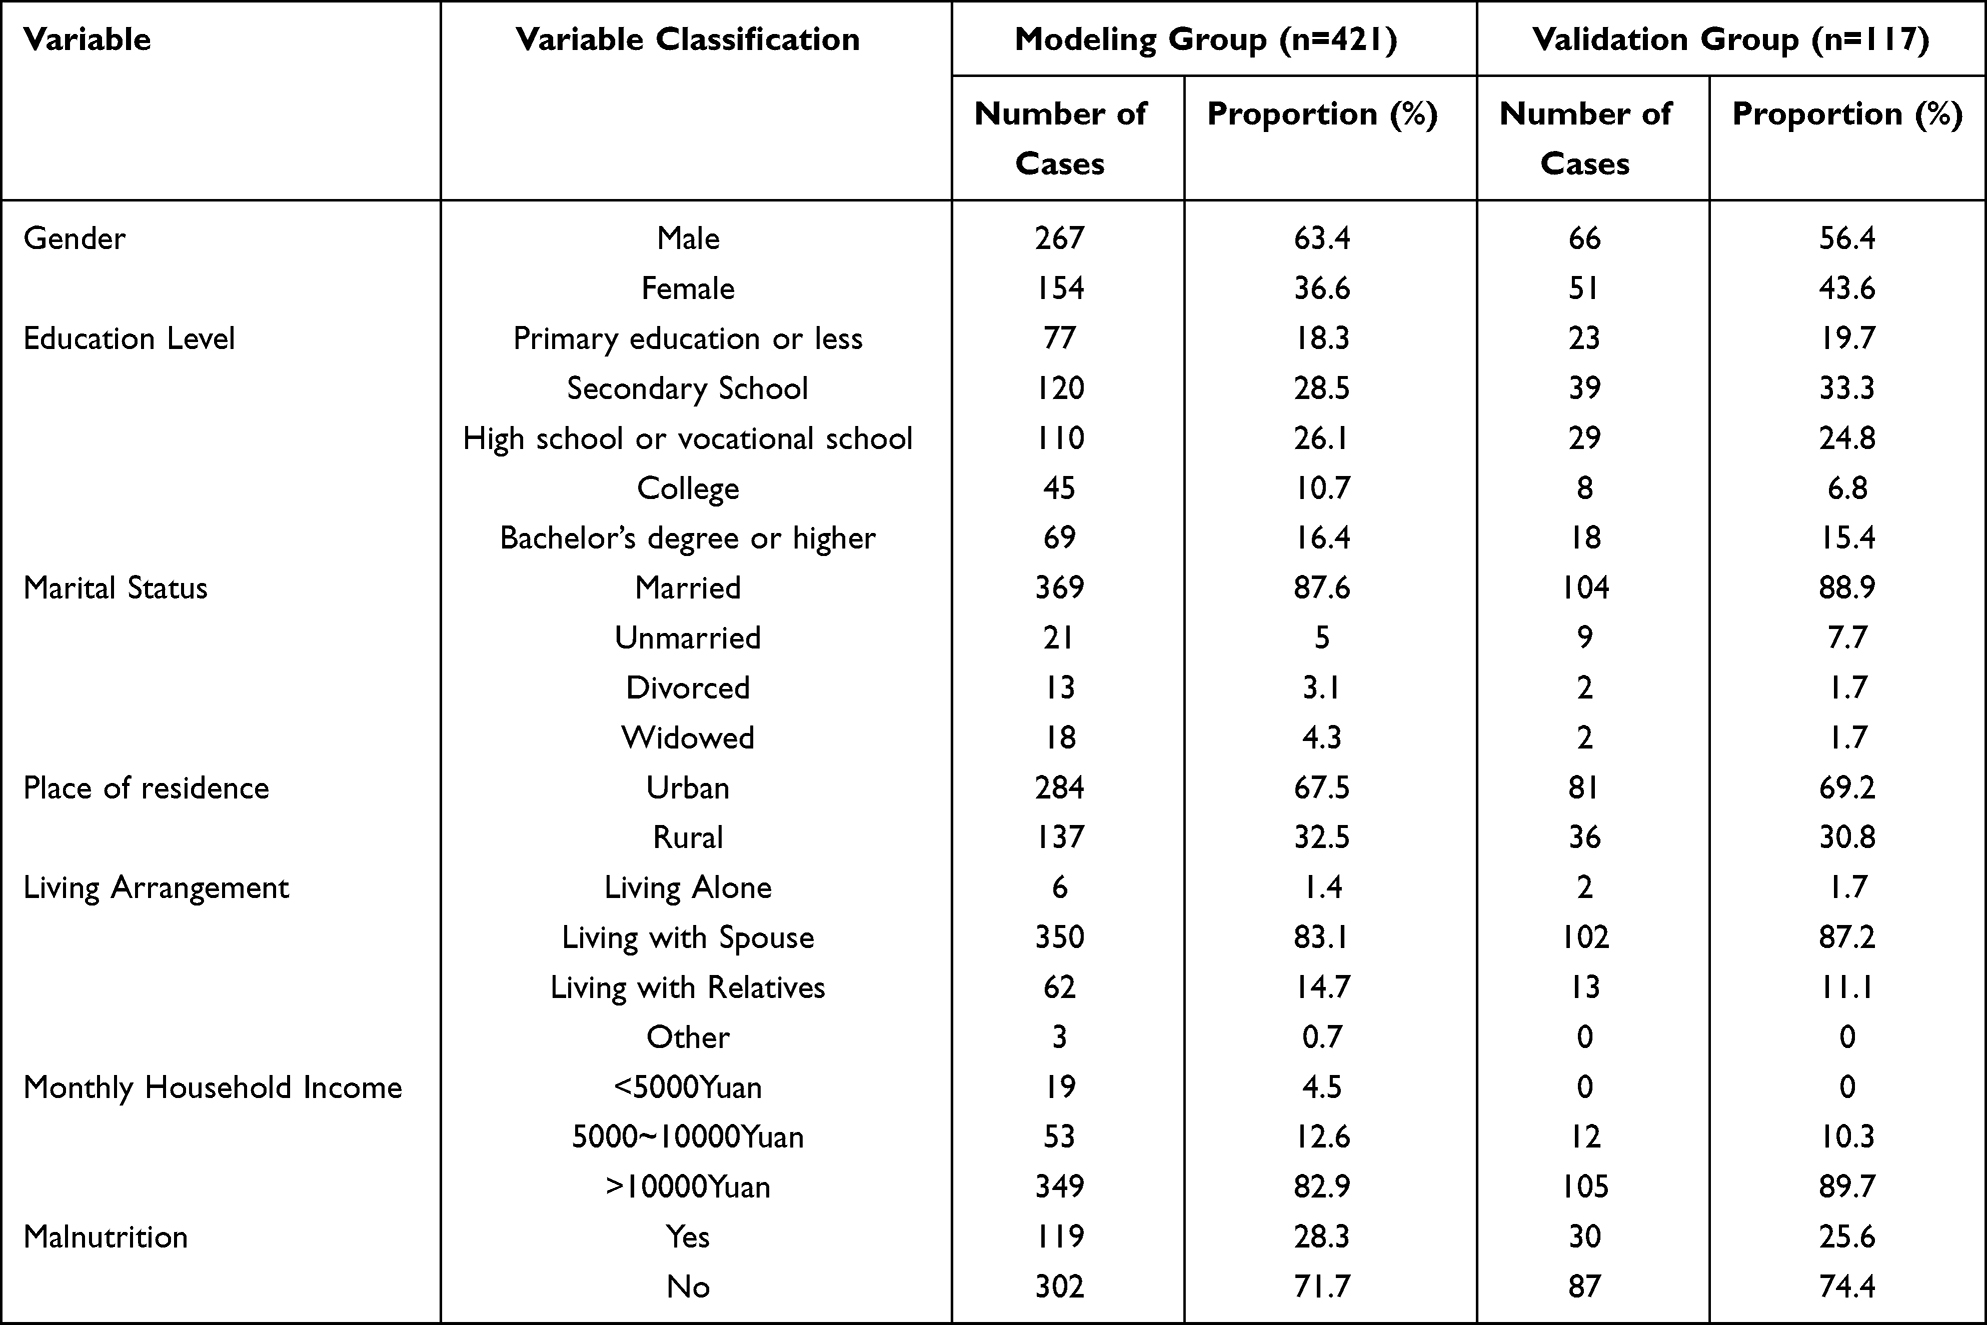 |
Table 1 General Characteristics of ND-CRF Patients in the Development and Validation Cohorts (n=421 and n=117, Respectively) |
Inclusion Criteria
- Patients diagnosed with CRF according to the Guidelines for Integrated Traditional Chinese and Western Medicine Diagnosis and Treatment of CRF,27 who had not undergone dialysis or transplantation;
- Age ≥ 18 years;
- Sufficient reading comprehension and language skills to independently complete questionnaires;
- Understanding of the study and voluntary participation with signed informed consent.
Exclusion Criteria
- Pregnant or lactating women;
- Patients with a history or current diagnosis of psychiatric disorders;
- Patients with severe organ dysfunction or other metabolic diseases;
- Patients unwilling to participate or who withdrew from the study.
Sample Size Calculation
This study is an observational predictive modeling study. For the modeling group, a rough estimate based on multifactorial logistic regression suggests 5–10 patients per influencing variable.28 The dependent variable in this study has two levels (normal nutrition and malnutrition). Through literature review and expert consultation, 20 predictors were initially considered. With a reported malnutrition prevalence of approximately 36% among ND-CRF patients,29 and assuming a 10% loss‑to‑follow‑up rate, the minimum sample size was calculated as: 20 × 5 ÷ 36% ÷ 0.9 ≈ 309 patients. The actual sample size enrolled was 421, meeting statistical requirements. For external validation, the recommended sample size is generally 1/4 to 1/2 of the modeling group sample.30 Assuming a 10% loss‑to‑follow‑up rate, the required external validation sample size would be: 421 × (1/4 to 1/2) ÷ 0.9 ≈ 117 to 234 patients. This study ultimately enrolled 117 ND-CRF patients for external validation.
Research Tools
Hospital Anxiety and Depression Scale (HADS)
The Hospital Anxiety and Depression Scale (HADS)31 was used to assess anxiety and depression in this study. Developed by Zigmond and Snaith in 1983, the scale consists of two subscales: anxiety and depression. Each subscale includes 7 items, with a total of 14 items scored from 0 to 3. The total score for each subscale ranges from 0 to 21, with a score ≥8 indicating the presence of anxiety or depressive symptoms. In this study, the Cronbach’s α coefficients for the anxiety and depression subscales were 0.820 and 0.763, respectively.
Diagnosis of Malnutrition
This study first used the Nutritional Risk Screening 2002 (NRS2002) scale to identify nutritional risk. NRS2002 is a tool recommended by the European Society for Clinical Nutrition and Metabolism for nutritional risk screening in hospitalized patients.32 The scale assesses three domains: disease severity (score 0–3), nutritional status (score 0–3), and age (score 0–1). A total score ≥3 indicates nutritional risk.
If nutritional risk was identified, malnutrition was further evaluated using the Global Leadership Initiative on Malnutrition (GLIM) criteria.33 The GLIM criteria comprise three phenotypic and two etiologic components. Diagnosis of malnutrition requires at least one phenotypic and one etiologic criterion.
Phenotypic criteria include:
- Weight loss: >5% within 6 months or >10% beyond 6 months;
- Low BMI: <18.5 kg/m2 for patients aged <70 years, or <20 kg/m2 for those aged ≥70 years;
- Reduced muscle mass: calf circumference <30 cm in men or <29 cm in women.
Etiologic criteria include:
- Reduced food intake or absorption: energy intake ≤50% of requirement for >1 week, reduced intake for >2 weeks, or impaired gastrointestinal function;
- Inflammation: acute disease/injury or chronic disease-related inflammation.
This study was reviewed and approved by the Ethics Committee of Zhejiang Shuren University in July 2022 (Approval No. 202202035).
Data Collection
Data collection included the following components: Sociodemographic details of ND-CRF patients: age, gender, educational level, marital status, place of residence, living arrangement, and monthly household income. Physiological parameters: serum albumin, glomerular filtration rate, creatinine, hemoglobin, total cholesterol, triglycerides, and parathyroid hormone; along with clinical conditions such as diabetic nephropathy, hypertensive nephropathy, coexisting diabetes, and coexisting hypertension. Psychological measures: anxiety and depression. Missing data were handled using a principled approach that combined a predefined rule (items with >1/3 missing data were excluded) with statistical imputation. Continuous variables were imputed using multiple imputation, while categorical variables were imputed using model-based multiple imputation. Sensitivity analyses were performed to confirm the robustness of the results.
Statistical Methods
Statistical analysis was performed using SPSS 25.0, R 4.3.1, and R Studio. Normality was assessed for quantitative data. Normally distributed data are presented as mean ± standard deviation and compared using t‑tests; non‑normally distributed data are reported as median and interquartile range and compared using non‑parametric tests. Categorical variables are expressed as frequency and percentage, with comparisons conducted via chi‑square tests. Risk factors showing statistical significance (P < 0.05) in univariate analysis were included as independent variables in multivariable logistic regression (backward LR method based on maximum likelihood estimation) to identify independent predictors and establish a prediction model formula. A nomogram was then constructed using R software. Model performance was evaluated using the area under the receiver operating characteristic curve (AUC), the Hosmer–Lemeshow goodness‑of‑fit test, and decision curve analysis (DCA) to assess the model’s discriminative ability, calibration, and clinical utility.
Each participant included in this study was an independent individual, with no repeated measurements or clustered data. Prior to performing multivariable logistic regression analysis, we examined the model assumptions. By calculating the variance inflation factor (all VIFs < 2.45), we confirmed that there was no severe multicollinearity among the independent variables. To test the linearity of continuous independent variables with the logit(p), we included interaction terms between the continuous variables and their natural logarithmic values in the regression equation and performed hypothesis testing using the Box-Tidwell method. The results showed that all adjusted p-values were > 0.05, indicating a linear relationship between the continuous independent variables and the log-odds. The primary outcome of this study was malnutrition. In the modeling group, a total of 119 malnutrition events were observed. The final model incorporated six predictor variables, resulting in an events-per-variable ratio of 119/6 ≈ 20:1. This far exceeds the widely recommended standard of at least 10–15 events per variable for logistic regression model development, thereby meeting the fundamental requirement for model stability. The total sample was randomly divided into a modeling group (n = 421) and a validation group (n = 117) in an approximate 7:3 ratio. This allocation proportion is commonly adopted in the field of predictive modeling (eg, nomogram development) to ensure the precision of model parameter estimation while reserving enough independent data for internal validation.
Results
Development of a Risk Prediction Model for Malnutrition in ND-CRF Patients
Univariate Analysis of Risk Factors for Malnutrition in the Development Cohort
Comparisons were made between the malnutrition group and the non-malnutrition group regarding sociodemographic, physiological, and psychological data. Univariate analysis revealed statistically significant differences (P < 0.05) in age, gender, marital status, coexisting hypertension, serum albumin, glomerular filtration rate, creatinine, triglycerides, anxiety, and depression. Detailed information is provided in Table 2.
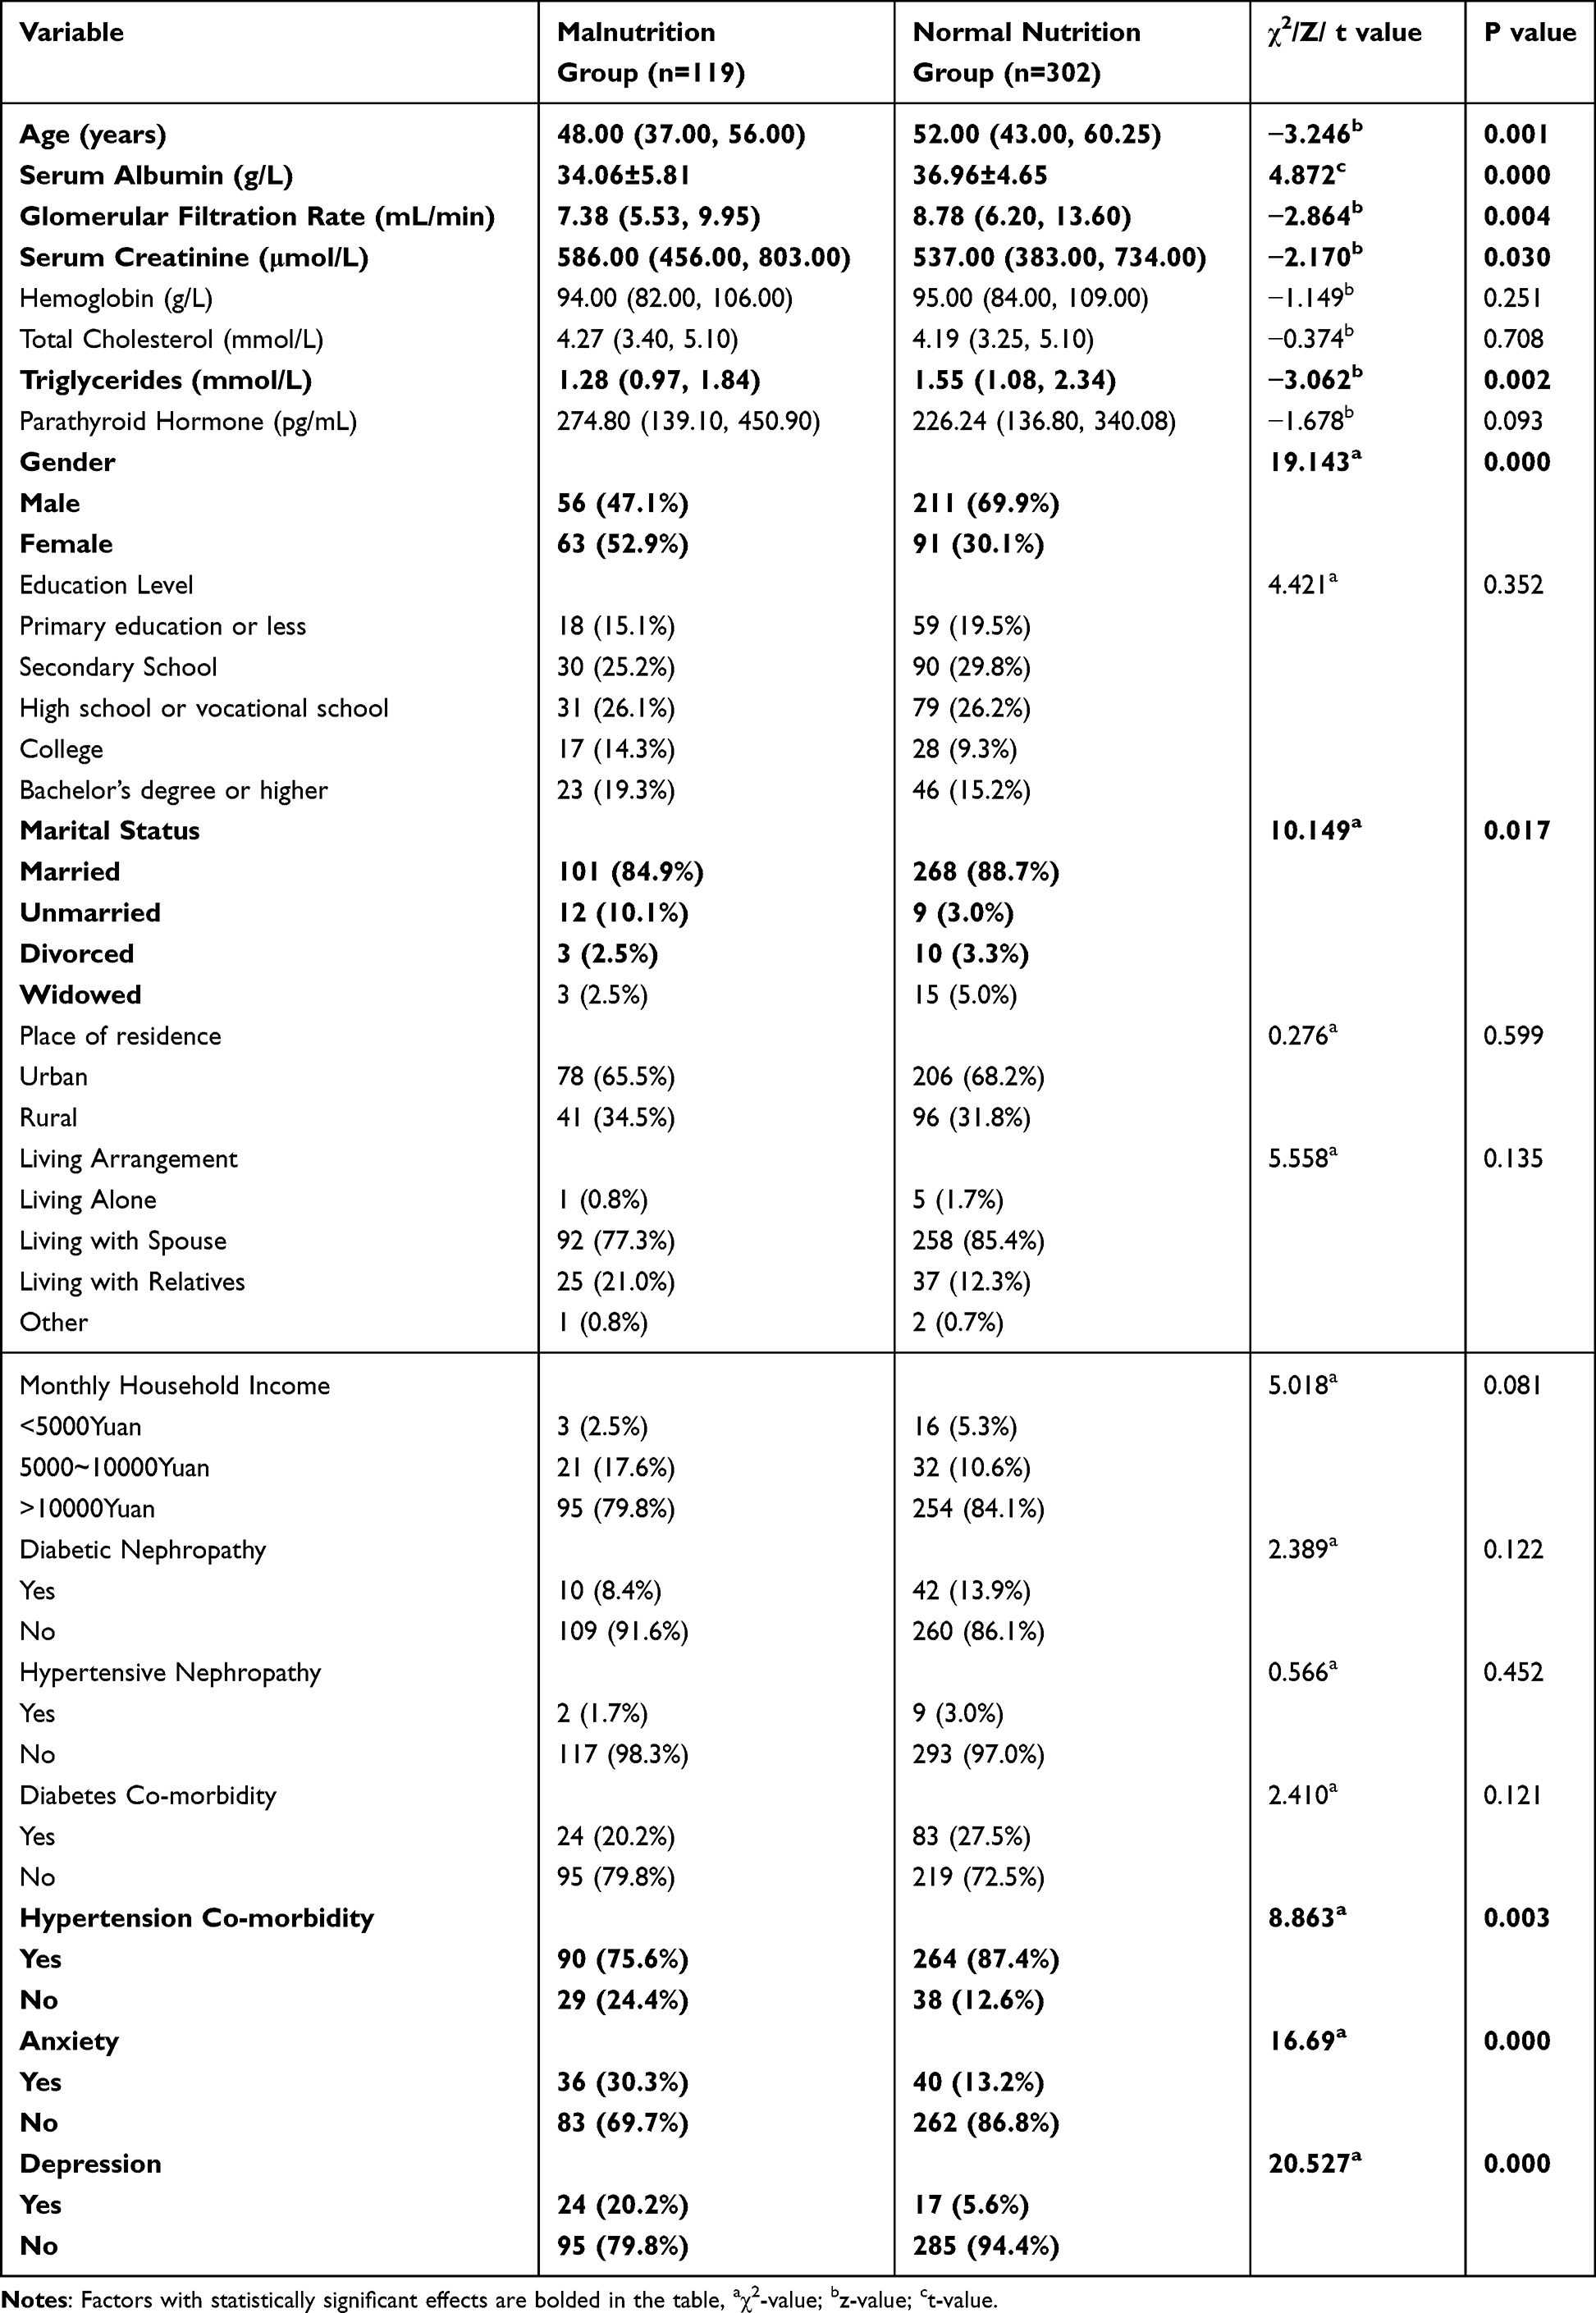 |
Table 2 Comparison of Baseline Characteristics Between Malnourished and Normal-Nourished Patients |
Multivariable Logistic Regression Analysis of Malnutrition Risk Factors in the Development Cohort
The ten risk factors found to be statistically significant in the univariate analysis (age, gender, marital status, coexisting hypertension, serum albumin, glomerular filtration rate, creatinine, triglycerides, anxiety, and depression) were included as independent variables. The presence or absence of malnutrition was used as the dependent variable in a multivariable logistic regression analysis using the backward LR method. Detailed variable assignments are provided in Additional file 1. The results identified six independent predictors of malnutrition: gender, serum albumin, glomerular filtration rate, triglycerides, anxiety, and depression. Details are presented in Table 3.
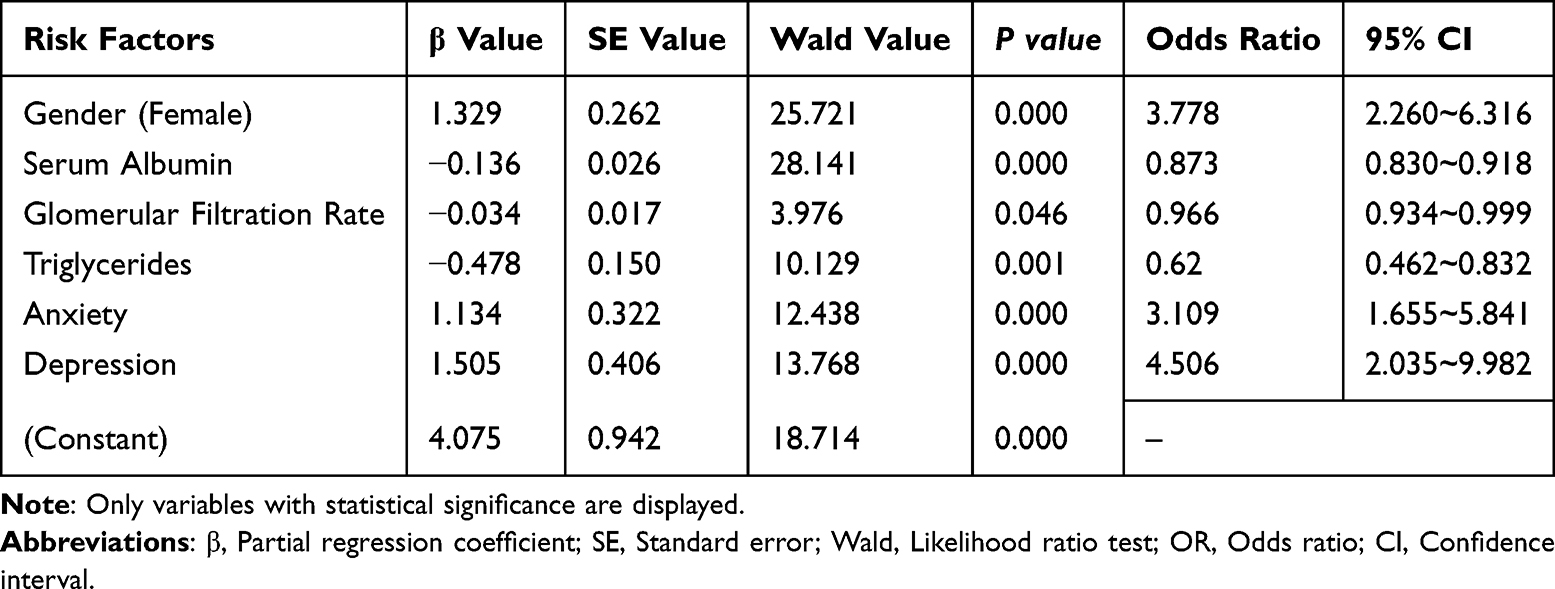 |
Table 3 Multivariable Logistic Regression Analysis of Malnutrition in ND-CRF Patients |
Development and Nomogram Construction of a Malnutrition Risk Prediction Model for ND-CRF Patients
Based on the multivariable logistic regression analysis, six independent predictors were identified: gender, serum albumin, glomerular filtration rate, triglycerides, anxiety, and depression. The prediction model was constructed as follows: Probability of Malnutrition = eZ / (1 + eZ) × 100%,
where Z = 4.075 + 1.329 × gender (female) – 0.136 × serum albumin – 0.034 × glomerular filtration rate – 0.478 × triglycerides + 1.134 × anxiety + 1.505 × depression. A nomogram was subsequently developed based on this model, as detailed in Figure 1.
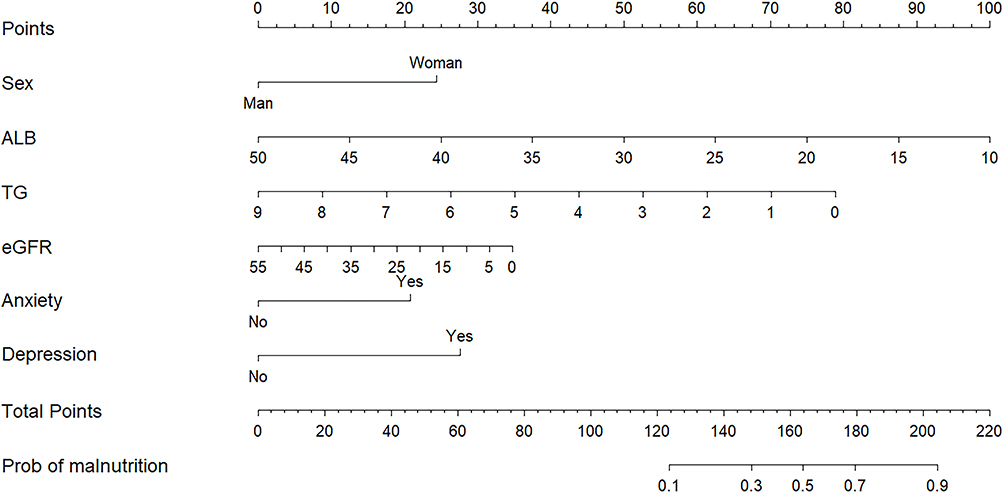 |
Figure 1 Nomogram for the Malnutrition Risk Prediction Model in Non-Dialysis Patients with Chronic Renal Failure. |
Evaluation of the Malnutrition Risk Prediction Model for ND-CRF Patients
The discriminative ability of the developed prediction model was assessed using ROC curve analysis. The results showed an AUC of 0.795 (95% CI: 0.745–0.844, P < 0.001), indicating that the model has good discriminatory power and can effectively distinguish between patients with and without malnutrition. The optimal cutoff value for the model was determined based on the maximum Youden index. In this study, the maximum Youden index was 0.465, corresponding to a sensitivity of 77.3% and a specificity of 69.2%. The associated cutoff probability was 0.27, which corresponded to a total nomogram score cutoff of 144 points. The Hosmer–Lemeshow goodness-of-fit test was used to evaluate model calibration (χ2 = 12.639, P= 0.125). The result indicated no significant lack of fit, suggesting good agreement between predicted and observed outcomes.
The decision curve analysis (DCA) of the malnutrition risk prediction model developed for ND-CRF patients demonstrates favorable clinical utility. The model shows a relatively high net clinical benefit when the threshold probability ranges from 10% to 83%. The ROC curve, calibration curve, and DCA curve from the internal validation of the model are detailed in Figure 2.
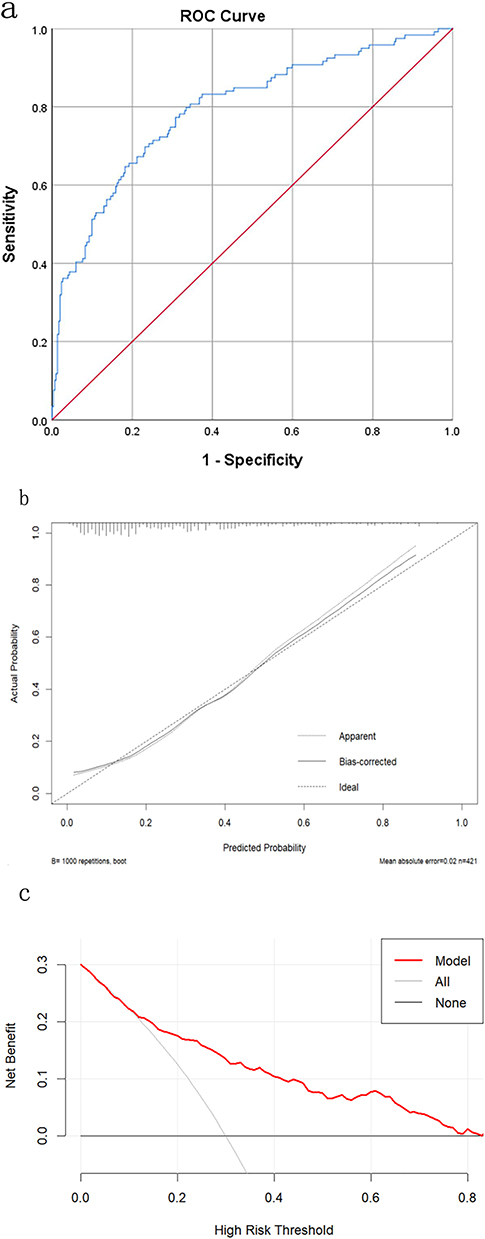 |
Figure 2 The ROC curve (a), calibration curve (b), and DCA curve (c) of the internal validation of the prediction model. |
Validation of the Malnutrition Risk Prediction Model for ND-CRF Patients
First, internal validation was performed using the bootstrap method with 1000 resamples. The area under the ROC curve after resampling was 0.776 (95% CI: 0.836–0.904), indicating good discriminative ability of the nomogram prediction model. The calibration curve fluctuated closely around the ideal line, with an absolute error of 0.02, demonstrating good agreement between predicted and observed risks.
Baseline characteristics were comparable between the model development group and the external validation group, except for monthly household income. External validation was conducted using 117 participants. The results showed an AUC of 0.825 (95% CI: 0.742–0.908). The calibration curve (logistic calibration) closely followed the ideal line, and the Hosmer–Lemeshow test (χ2 = 5.699, P = 0.770) indicated good predictive accuracy of the model. Decision curve analysis (DCA) further confirmed the model’s favorable clinical utility. The model provided a high net clinical benefit within a threshold probability range of 0.5% to 72%. Detailed results are presented in Figure 3.
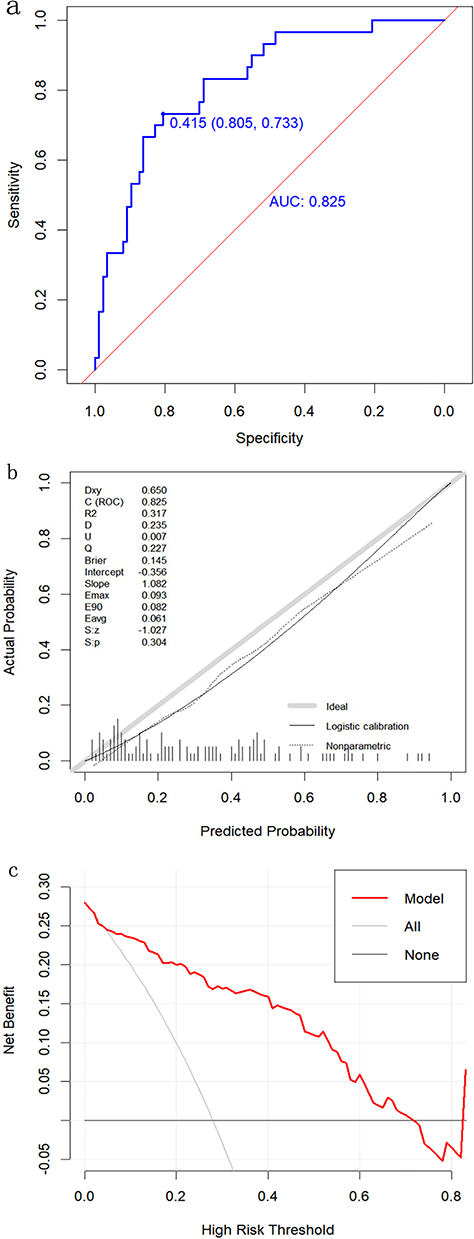 |
Figure 3 The ROC curve (a), calibration curve (b), and DCA curve (c) for the external validation of the prediction model. |
Discussion
Analysis of Malnutrition Incidence in ND-CRF Patients
Among the 538 patients in the development and validation cohorts of this study, 149 were diagnosed with malnutrition, resulting in an overall incidence of 27.70%. This rate is lower than the findings reported by Caravaca,29 Prakash,34 Yan,9 and others. It is also lower than the pooled prevalence of 44.2% reported in the meta‑analysis by Rashid.35 The study cohort in our research is drawn from broader sources and has a larger sample size compared to the studies by Yan,9 Caravaca,29 and Prakash et al. Regarding assessment tools, this study adopted the Global Leadership Initiative on Malnutrition (GLIM) diagnostic criteria, which are more stringent than the Subjective Global Assessment. Geographic variation, differences in healthcare levels, and variations in disease staging may also contribute to the observed differences in malnutrition incidence. Although existing studies do not show completely consistent results regarding malnutrition incidence in ND-CRF patients, they collectively indicate a high malnutrition risk in this population. Therefore, early screening for nutritional risk, identification of high‑risk individuals, analysis of influencing factors, and implementation of personalized interventions are essential for chronic kidney disease management.
Analysis of Influencing Factors for Malnutrition in ND-CRF Patients
In this study, the incidence of malnutrition was 40.9% in female patients and 21.0% in male patients. The risk of malnutrition in women was 3.778 times higher than in men, consistent with previous findings.36,37 This may be due to greater psychological sensitivity in women, leading to negative emotions, gastrointestinal reactions, and increased malnutrition risk. Additionally, body image concerns among women may contribute to dietary restrictions and insufficient nutrient intake. However, the relationship between malnutrition and gender remains debated38–40 and warrants further study. Healthcare providers should prioritize nutritional management in female patients through timely screening and targeted interventions.
Second, anxiety and depression were identified as independent risk factors for malnutrition, aligning with studies on maintenance hemodialysis and stage 5 CKD patients by Liu19 and Chen,41 among others. Negative emotions can activate the sympathetic nervous system, suppress gastrointestinal function, and reduce appetite. They may also stimulate cortisol secretion via the HPA axis, promote inflammatory cytokine release, and accelerate protein catabolism,42,43 thereby worsening nutritional status. Notably, malnutrition and emotional states may have a bidirectional relationship;44 malnutrition itself can increase anxiety and depression, as seen in ND-CRF patients with reported anxiety and depression rates of 49.5% and 45.22%, respectively.45,46 Early psychological assessment and intervention are therefore crucial in preventing malnutrition in this population.
Third, glomerular filtration rate (GFR) was a protective factor against malnutrition (OR = 0.966), consistent with prior studies.11,34,47 Declining renal function leads to toxin accumulation, gastrointestinal symptoms, and malnutrition, which in turn accelerates the loss of GFR and renal blood flow.48 Close monitoring and early nutritional support are recommended for patients with low GFR.
Fourth, serum albumin was also a protective factor (OR = 0.873), supporting its established inverse association with malnutrition.19,24,26 Reduced dietary intake and gastrointestinal issues in ND-CRF patients lower exogenous protein supply and endogenous albumin levels, impairing nutrient transport.19 Dynamic monitoring and correction of hypoalbuminemia are important in clinical management.
Fifth, triglycerides acted as a protective factor (OR = 0.620), like observations in heart failure and elderly hospitalized patients.49,50 Triglycerides serve as a biomarker of nutritional status51 and play a key role in energy supply and fat storage. Low triglyceride levels may reflect inadequate dietary intake.52 Although >40% of CKD patients exhibit elevated triglycerides,53 malnourished individuals often show normal or low levels. Regular monitoring and correction of low triglyceride levels are advised.
This study first applied the NRS2002 to screen for nutritional risk, then used GLIM criteria to diagnose malnutrition. Compared with Li Xueqin’s model for hospitalized CKD patients26—which included four factors such as CKD stage, age, psychological index, and serum albumin—our model shares predictors like serum albumin, anxiety, and depression, but differs by including gender, GFR, and triglycerides. Variations may arise from differences in the study population (all ND-CRF patients in our study versus 56.6% stage 1 CKD patients in Li’s study), consideration of comorbidities like diabetic nephropathy and hypertension, and regional disparities. Furthermore, while previous studies have reported age ≥65 years as a risk factor for malnutrition in non‑dialysis chronic kidney disease patients,54 age did not show statistical significance in the multivariate analysis in this study. A possible explanation is that the mean age of our cohort was relatively young (50.73 ± 13.17 years), with only 54 patients (12.8%) aged 65 years or older, which may account for the inconsistency in findings.
Analysis of the Clinical Value of the Malnutrition Risk Prediction Model for ND-CRF Patients
Based on univariate and multivariate logistic regression analyses, a risk prediction model for malnutrition in ND-CRF patients was developed. The model showed good discriminative ability, with AUC values greater than 0.7 in the derivation, internal validation, and external validation cohorts, indicating effective identification of malnutrition risk in this population.
Furthermore, the Hosmer–Lemeshow test yielded P‑values greater than 0.05 in both the derivation and validation sets, and the calibration curves from internal and external validation demonstrated good fit, suggesting that the model aligns well with the actual nutritional status of patients. The decision curve analysis (DCA) curves for both the derivation and external validation groups were above the extreme line, supporting the model’s favorable clinical utility.
These results indicate that the developed prediction model possesses strong discriminative ability, accuracy, and clinical applicability, and can serve as a practical tool for predicting malnutrition in ND-CRF patients.
Implications of the Malnutrition Risk Prediction Model for Clinical Practice in ND-CRF Patients
For the management of female ND-CRF patients, a systematic and integrated care approach is recommended. Nutritional assessment should be conducted every 2–3 months, accompanied by strengthened nutrition education and risk prevention guidance for both patients and their families. In clinical monitoring, key indicators such as serum albumin, glomerular filtration rate, and triglycerides should be regularly evaluated. If abnormalities are detected, prompt analysis and targeted interventions should be implemented—for example, nutritional support for hypoalbuminemia, and active management of risk factors such as hypertension, hyperglycemia, infection, and acidosis in patients with declining glomerular filtration rate, along with guidance on a low‑sodium, low‑fat, and moderate‑protein diet. Attention should also be given to patients’ psychological well‑being. Regular screening for anxiety and depression is advised, along with efforts to help patients build a robust social support network. These measures can comprehensively improve disease management, slow disease progression, and enhance quality of life and long‑term outcomes.
This study has several limitations. First, due to constraints in time, manpower, and patient availability, the external validation sample size was relatively small. Future studies should expand the sample to further verify the model’s stability. Second, insufficient sample sizes in certain variable subgroups may have led to the omission of important risk factors. Research on influencing factors for malnutrition in ND-CRF patients remains incomplete, and more potential factors should be explored in the future. Finally, as the sample was drawn from only two hospitals in Zhejiang Province, the model’s applicability in other regions needs to be validated through multicenter studies.
Conclusions
Gender, glomerular filtration rate, serum albumin, triglycerides, anxiety, and depression are influencing factors for malnutrition in ND-CRF patients. The nomogram model developed based on these variables can assist healthcare professionals in identifying patients at risk of malnutrition within this population. This study provides preliminary validation of the prediction model. Future multicenter, large‑sample studies are needed to explore additional risk factors and further verify the model’s generalizability.
Abbreviations
CKD, Chronic Kidney Disease; ND-CKD, Non-Dialysis Chronic Kidney Disease; ND-CRF, Non-dialysis chronic renal failure; CI, Confidence Interval; CRF, Chronic Renal Failure; ROC, Receiver Operating Characteristic; AUC, Area Under the Curve; DCA, Decision Curve Analysis; GFR, glomerular filtration rate; SVM, support vector machine; HADS, Hospital Anxiety and Depression Scale; NRS2002, Nutritional Risk Screening 2002; GLIM, Global Leadership Initiative on Malnutrition; Backward LR, Backward Stepwise Likelihood Ratio Method based on Maximum Likelihood Estimation; OR, Odds Ratio; HPA Axis, Hypothalamic-Pituitary-Adrenal Axis.
Data Sharing Statement
The identified datasets analyzed during the current study are available from the corresponding author on reasonable request.
Ethics Approval
This study was reviewed and approved by the Ethics Committee of Zhejiang Shuren University in July 2022 with the number (202202035) and was conducted in accordance with the Declaration of Helsinki and its later amendments. All participants provided informed consent, and patients were assured that participation was voluntary, and they could withdraw at any time without penalty if they wished.
Funding
This study was supported by: Zhejiang Medicine and Health Science and Technology Project in 2022 (2023KY213).
Disclosure
The authors declare that there are no conflicts of interest in this work.
References
1. Lin W, Liu M, Wu X, et al. Altered cerebral blood flow in the progression of chronic kidney disease. J Pers Med. 2023;13(1):142. doi:10.3390/jpm13010142
2. Carney EF. The impact of chronic kidney disease on global health. Nat Rev Nephrol. 2020;16(5):251. doi:10.1038/s41581-020-0268-7
3. Zhou XY, Chang JB. Effect of two health education methods on psychological status of elderly patients with chronic renal failure. Chin J Gerontol. 2012;32(12):2624–14. doi:10.3969/j.issn.1005-9202.2012.12.090
4. Lei L, Luo Y, Ren J, et al. Analysis on the rule of TCM prescription for treating chronic renal failure based on data mining. Chin Tradit Patent Med. 2019;41(12):3079–3082. doi:10.3969/j.issn.1001-1528.2019.12.052
5. Luo Y, Huang H, Wang Q, et al. An exploratory study on a new method for nutritional status assessment in patients with chronic kidney disease. Nutrients. 2023;15(11):2640. doi:10.3390/nu15112640
6. Deng C, Wei LB, Wang DT, et al. Effect of Shenshuaiyangzhen Capsule on UPP pathway in malnourished rats with chronic renal failure. Chin J Integr Tradit West Med. 2018;38(3):356–360. doi:10.7661/.cjim.20170821.202
7. Xi WZ, Wu C, Liang YL, Wang LL, Cao YH. Analysis of malnutrition factors for inpatients with chronic kidney disease. Front Nutr. 2023;9:1002498. doi:10.3389/fnut.2022.1002498
8. Jia WJ. Investigation of Nutritional Status and Related Factors in Patients with Stage 3-4 Chronic Kidney Disease. Zhejiang: Zhejiang University; 2011.
9. Yan Y, Hong MY, Wang NS, et al. Relationship between microinflammation, albumin, prealbumin and malnutrition in patients with non-dialysis renal failure. Chin J Integr Tradit West Nephropathy. 2009;10(6):520–523.
10. Merga C, Girma M, Teshome MS. Protein-energy wasting and associated factors among chronic kidney disease patients at St. Paul’s Hospital Millennium Medical College, Addis Ababa, Ethiopia. Int J Nephrol Renovasc Dis. 2020;13:307–318. doi:10.2147/IJNRD.S273874
11. Kalantar-Zadeh K, Ikizler TA, Block G, Avram MM, Kopple JD. Malnutrition-inflammation complex syndrome in dialysis patients: causes and consequences. Am J Kidney Dis. 2003;42(5):864–881. doi:10.1016/j.ajkd.2003.07.016
12. Ballmer PE, McNurlan MA, Hulter HN, Anderson SE, Garlick PJ, Krapf R. Chronic metabolic acidosis decreases albumin synthesis and induces negative nitrogen balance in humans. J Clin Invest. 1995;95(1):39–45. doi:10.1172/JCI117668
13. Lecker SH, Goldberg AL, Mitch WE. Protein degradation by the ubiquitin-proteasome pathway in normal and disease states. J Am Soc Nephrol. 2006;17(7):1807–1819. doi:10.1681/ASN.2006010083
14. Cueto Manzano AM. Hipoalbuminemia en diálisis. Es marcador de desnutrición o de inflamación? [Hypoalbuminemia in dialysis. Is it a marker for malnutrition or inflammation?]. Rev Invest Clin. 2001;53(2):152–158.
15. Beiraghdar F, Panahi Y, Einollahi B, et al. Evaluation of a biosimilar recombinant alpha epoetin in the management of anemia in hemodialysis patients. Saudi Pharm J. 2015;23(5):544–548. doi:10.1016/j.jsps.2015.02.007
16. Alemu B, Techane T, Dinegde NG, Tsige Y. Prevalence of anemia and its associated factors among chronic kidney disease patients attending selected public hospitals of Addis Ababa, Ethiopia: institutional-based cross-sectional study. Int J Nephrol Renovasc Dis. 2021;14:67–75. doi:10.2147/IJNRD.S296995
17. Fan Z, Li R, Pan M, et al. Relationship between serum phosphorus and mortality in non-dialysis chronic kidney disease patients: evidence from NHANES 2001–2018. BMC Nephrol. 2024;25(1):89. doi:10.1186/s12882-024-03525-x
18. Machowska A, Sun J, Qureshi AR, et al. Plasma pentosidine and its association with mortality in patients with chronic kidney disease. PLoS One. 2016;11(10):e0163826. doi:10.1371/journal.pone.0163826
19. Liu XQ, Liu XH, Ping ZG. Construction and validation of risk prediction model and online calculator for malnutrition in maintenance hemodialysis patients. J Nurs. 2023;30(16):12–18. doi:10.16460/j.issn1008-9969.2023.16.012
20. Ma GT, Xiang YH, Yang Q, et al. Development of a diagram to predict malnutrition risk in maintenance hemodialysis patients. J Nurs Sci. 2023;38(2):34–39. doi:10.3870/j.issn.1001-4152.2023.02.034
21. Wei M, Liu J. Construction of a risk prediction model for malnutrition in maintenance hemodialysis patients. J Clin Med Pract. 2023;27(10):67–71,78. doi:10.7619/jcmp.20231186
22. Tsai YT, Yang FJ, Lin HM, Yeh JC, Cheng BW. Constructing a prediction model for physiological parameters for malnutrition in hemodialysis patients. Sci Rep. 2019;9(1):10767. doi:10.1038/s41598-019-47130-7
23. Yang CH, Chen YS, Chen JB, Huang HC, Chuang LY. Application of deep learning to predict the low serum albumin in new hemodialysis patients. Nutr Metab. 2023;20(1):24. doi:10.1186/s12986-023-00746-z
24. Chai GF, Zhou MH, Wang H, et al. Construction and validation of a model for predicting factors and risks affecting malnutrition in maintenance peritoneal dialysis patients. Prog Mod Biomed. 2022;22(16):3182–3186. doi:10.13241/j.cnki.pmb.2022.16.037
25. Mei Z, Zhu B, Sun X, et al. Development and validation of a nomogram to predict protein-energy wasting in patients with peritoneal dialysis: a multicenter cohort study. PeerJ. 2023;11:e15507. doi:10.7717/peerj.15507
26. Li XQ, Chen CC, Luo Y, et al. Risk factor analysis and prediction model construction for malnutrition in chronic kidney disease inpatients. West China Med J. 2023;38(7):1014–1020, 78. doi:10.7507/1002-0179.202212048
27. Chen XM, Ni ZH, Liu YN, et al. Diagnosis and treatment guide of integrated Chinese and Western medicine for chronic renal failure. Hebei Tradit Chin Med. 2015;35(9):1029–1033. doi:10.3969/j.issn.1002-2619.2016.02.049
28. Hu LL, Niu HY, Han XY, Zhu XY, Liu JF. The development and application of a risk prediction model for extracorporeal circuit clotting during continuous renal replacement therapy. Chin J Nurs. 2023;58(15):1845–1851. doi:10.3761/j.issn.0254-1769.2023.15.009
29. Caravaca F, Arrobas M, Pizarro JL, et al. Uraemic symptoms, nutritional status and renal function in pre‐dialysis end‐stage renal failure patients. Nephrol Dial Transplant. 2001;16(4):776–782.
30. Jiang SX. Construction of Frailty Risk Prediction Model for Maintenance Hemodialysis Patients. Zhejiang: Huzhou Normal University; 2022.
31. Zhang XY, Jiang ZX, Liu QL, et al. Analysis of potential categories and influencing factors of fatigue trajectories in post-intensive care syndrome patients. Chin J Nurs. 2022;57(3):272–278. doi:10.3761/j.issn.0254-1769.2022.03.003
32. Lu DS, Feng YJ, Wang WF, et al. Influence of individualized nutrition intervention on quality of life and survival prognosis of patients with locally advanced nasopharyngeal carcinoma. Chin Oncol. 2021;31(12):1202–1208. doi:10.19401/j.cnki.1007-3639.2021.12.008
33. Miao JP. Effects of Malnutrition on Lymphocyte Subsets and changes of Regulatory T Cells. Hubei: Huazhong University of Science and Technology; 2020.
34. Prakash J, Raja R, Mishra RN, et al. High prevalence of malnutrition and inflammation in undialyzed patients with chronic renal failure in developing countries: a single center experience from eastern India. Ren Fail. 2007;29(7):811–816. doi:10.1080/08860220701573491
35. Rashid I, Bashir A, Tiwari P, et al. Estimates of malnutrition associated with chronic kidney disease patients globally and its contrast with India: an evidence based systematic review and meta-analysis. Clin Epidemiol Global Health. 2021;12:100855.
36. Yin L, Liu J, Lin X, et al. Nutritional features-based clustering analysis as a feasible approach for early identification of malnutrition in patients with cancer. Eur J Clin Nutr. 2021;75(8):1291–1301. doi:10.1038/s41430-020-00844-8
37. Park JH, Kim E, Seol EM, et al. Prediction model for screening patients at risk of malnutrition after gastric cancer surgery. Ann Surg Oncol. 2021;28(8):4471–4481. doi:10.1245/s10434-020-09559-3
38. Hao HM, Huang HL, Zhang W, et al. Construction and verification of a nomogram prediction model for malnutrition risk in patients with chronic heart failure. Mod Preventive Med. 2022;49(17):3130–3135. doi:10.20043/J.CNKI.MPM.202203011
39. Li JC, Zhuang XH, Tian XH, et al. Study on the influencing factors of the phase angle and its predictive significance for malnutrition in continuous ambulatory peritoneal dialysis patients. Chin J Blood Purif. 2021;20(09):595–598. doi:10.3969/j.issn.1671-4091.2021.09.005
40. Zhao M, Song JX, Zhou DY, et al. Prevalence and associated risk factors of malnutrition in hospitalized older adults with chronic heart failure. Chin Circ J. 2023;38(11):1164–1170. doi:10.3969/j.issn.1000-3614.2023.11.010
41. Chen YJ. Study on the Correlation Between Nutritional Status and Health Literacy and Anxiety/Depression in Patients with Stage 5 Chronic Kidney Disease. Hunan: Hunan Normal University; 2019.
42. Xiao H, Kong DS, Zhang Y, et al. Patients’Perception of doctor-patient empathy and inflammatory factors in COPD patients: the mediating effects of anxiety, self-efficacy and sleep. Chin J Clin Psychol. 2020;28(3):611–614. doi:10.16128/j.cnki.1005-3611.2020.03.036
43. Zhou ZY. Efficacy Evaluation of Oral Nutritional Supplements in the Treatment of Stable COPD Patients. Guangdong: Guangzhou Medical University; 2023.
44. Liu J, Chen XH, Zou JZ. Analysis of psychological and cognitive functions in maintenance hemodialysis patients. Chin J Blood Purif. 2020;19(10):688–691. doi:10.3969/j.issn.1671-4091.2020.10.010
45. Song WY. Analysis of Anxiety Status and Related Factors in Non-Dialysis Patients with Chronic Kidney Disease Stage 3-5. Shanxi: Shanxi Medical University; 2023.
46. Xiong L, Wu YZ, Mu QY, et al. Depression and quality of life in non-dialysis patients with chronic renal failure: analysis of 356 cases. J Third Mil Med Univ. 2019;41(02):163–169. doi:10.16016/j.1000-5404.201808033
47. Kopple JD, Greene T, Chumlea WC, et al. Relationship between nutritional status and the glomerular filtration rate: results from the MDRD study. Kidney Int. 2000;57(4):1688–1703. doi:10.1046/j.1523-1755.2000.00014.x
48. Zheng LX. Application of mobile Internet technology in nutrition management of maintenance hemodialysis patients. Mod Nurs. 2023;30(13):135–138.
49. Liu J, Xu S, Wang J, et al. A novel nomogram for predicting risk of malnutrition in patients with heart failure. Front Cardiovasc Med. 2023;10:1162035. doi:10.3389/fcvm.2023.1162035
50. Long YH, Sun M, Yang XL, et al. Diagnostic indicators of malnutrition in hospitalized elderly patients. Chin J Gerontol. 2020;40(19):4139–4142. doi:10.3969/j.issn.1005-9202.2020.19.035
51. Nam GE, Huh Y, Jung JH, Han K, Kim SM. Association of high-density lipoprotein cholesterol phenotypes with the risk of cardiovascular diseases and mortality: a cohort study in Korea. Endocrinol Metab. 2022;37(2):261–271. doi:10.3803/EnM.2021.1259
52. Yu Y, Yan P, Cheng G, et al. Correlation between serum lipid profiles and cognitive impairment in old age: a cross-sectional study. Gen Psychiatr. 2023;36(2):e101009. doi:10.1136/gpsych-2023-101009
53. Lee SM, An WS. Cardioprotective effects of ω −3 PUFAs in chronic kidney disease. Biomed Res Int. 2013;2013:712949. doi:10.1155/2013/712949
54. Zhu JC, Zhao CX, Zhang HF. Analysis of nutritional status and influencing factors of malnutrition before dialysis in chronic kidney disease patients. Chin J Gen Pract. 2019;17(12):2026–2030. doi:10.16766/j.cnki.issn.1674-4152.001119
 © 2026 The Author(s). This work is published and licensed by Dove Medical Press Limited. The
full terms of this license are available at https://www.dovepress.com/terms
and incorporate the Creative Commons Attribution
- Non Commercial (unported, 4.0) License.
By accessing the work you hereby accept the Terms. Non-commercial uses of the work are permitted
without any further permission from Dove Medical Press Limited, provided the work is properly
attributed. For permission for commercial use of this work, please see paragraphs 4.2 and 5 of our Terms.
© 2026 The Author(s). This work is published and licensed by Dove Medical Press Limited. The
full terms of this license are available at https://www.dovepress.com/terms
and incorporate the Creative Commons Attribution
- Non Commercial (unported, 4.0) License.
By accessing the work you hereby accept the Terms. Non-commercial uses of the work are permitted
without any further permission from Dove Medical Press Limited, provided the work is properly
attributed. For permission for commercial use of this work, please see paragraphs 4.2 and 5 of our Terms.
Recommended articles
Risk Factors for Granulomatous Mastitis and Establishment and Validation of a Clinical Prediction Model (Nomogram)
Zeng Y, Zhang D, Fu N, Zhao W, Huang Q, Cui J, Chen Y, Liu Z, Zhang X, Zhang S, Mansoor KM
Risk Management and Healthcare Policy 2023, 16:2209-2222
Published Date: 20 October 2023
Risk Factors and Nomogram Prediction Model for Healthcare-Associated Infections (HAIs) in COVID-19 Patients
Li Z, Li J, Zhu C, Jiao S
Infection and Drug Resistance 2024, 17:3309-3323
Published Date: 2 August 2024
Development and Internal Validation of a Predictive Model for Deep Venous Thrombosis Following Colpocleisis in Elderly Patients with Pelvic Organ Prolapse
Wang Q, Manodoro S, Jiang X, Lin C
Risk Management and Healthcare Policy 2025, 18:3041-3050
Published Date: 15 September 2025
Development and Validation of a Nomogram for Predicting Sepsis-Associated Acute Respiratory Distress Syndrome
Yan C, Cai Y, Cai W, Wang Q, Li W, Geng Q
International Journal of General Medicine 2025, 18:5917-5925
Published Date: 29 September 2025
Development and Validation of a Postoperative Delirium Prediction Model for Patients Undergoing Gastrointestinal Surgery
Huang Z, Deng Y, Li Q, Hu T, Xu X, Luo Y
Clinical and Experimental Gastroenterology 2026, 19:534370
Published Date: 20 February 2026