Back to Journals » Infection and Drug Resistance » Volume 19
Development and Validation of a Predictive Model for Surgical Site Infection in Open Hand Injuries
Authors Nie X, Wang G, Ba Y, Zhao H, Chen Y, Wang W, Wang J, Lu T
Received 30 December 2025
Accepted for publication 25 February 2026
Published 10 March 2026 Volume 2026:19 589797
DOI https://doi.org/10.2147/IDR.S589797
Checked for plagiarism Yes
Review by Single anonymous peer review
Peer reviewer comments 2
Editor who approved publication: Dr Oliver Planz
Xingguo Nie,1 Guodong Wang,2 Yiwen Ba,1 Haijian Zhao,1 Yundong Chen,1 Weixin Wang,3 Junbo Wang,1 Tan Lu1
1Department of Orthopedics, The First Affiliated Hospital of Henan Medical University, Weihui, Henan, People’s Republic of China; 2Department of Emergency Medicine, The First Affiliated Hospital of Henan Medical University, Weihui, Henan, People’s Republic of China; 3Department of Stomatology, The First Affiliated Hospital of Henan Medical University, Weihui, Henan, People’s Republic of China
Correspondence: Tan Lu, Department of Orthopedics, The First Affiliated Hospital of Henan Medical University, 88 Jiankang Road, Weihui, Henan, 453100, People’s Republic of China, Email [email protected]
Purpose: Surgical site infection (SSI) is a major complication in patients with open hand injuries. However, current clinical risk assessment largely relies on subjective judgment or traditional scoring systems, which often lack predictive precision and generalizability. This study aimed to develop, compare, and externally validate multiple machine learning (ML) models for predicting SSI in open hand injuries using routinely collected clinical indicators.
Methods: A total of 800 patients with open hand injuries were retrospectively enrolled. The primary cohort (n=500) was randomly divided into training (70%, n=350) and internal testing (30%, n=150) sets, while an independent cohort (n=300) was used for external validation. Eight ML algorithms were constructed and compared, including logistic regression, decision tree, random forest, support vector machine, k-nearest neighbor, naive Bayes, extreme gradient boosting, and light gradient boosting machine. Model performance was evaluated using area under the curve (AUC), accuracy, sensitivity, specificity, and other metrics in internal cross-validation and external validation. SHapley Additive exPlanations (SHAP) were applied for feature interpretability.
Results: The random forest model demonstrated the best performance, with an AUC of 0.903 (95% CI 0.863 to 0.943) in training, 0.870 (95% CI 0.822 to 0.918) in internal testing, and 0.849 (95% CI 0.802 to 0.896) in external validation. Six key variables (age, smoking, diabetes mellitus, time from injury to surgery, wound contamination, and negative pressure drainage) were identified as the most influential predictors. SHAP analysis provided interpretable insights into their contributions to infection risk.
Conclusion: The random forest model showed robust predictive performance and generalizability for SSI in open hand injuries. These findings highlight the model’s potential as a clinical decision-support tool to assist surgeons in early risk stratification and personalized interventions, potentially reducing morbidity and improving outcomes. Future prospective studies are needed for further validation.
Keywords: open hand injuries, postoperative incision infection, machine learning, random forest, clinical decision support
Introduction
Open hand injuries are common in clinical practice and often result from industrial accidents, traffic collisions, and household or recreational incidents.1 These injuries frequently involve complex damage to skin, soft tissue, tendons, blood vessels, and nerves, and can lead to substantial functional impairment of the hand.2 In addition to the direct impact on limb function and quality of life, open hand injuries impose a considerable socioeconomic burden through prolonged work absence, repeated hospitalizations, and high medical costs.3 Among the various complications, SSI is one of the most serious, as it can delay wound healing, necessitate repeated debridement or revision surgery, prolong hospital stay, and in severe cases result in deep tissue destruction, osteomyelitis, or amputation.4
The incidence of postoperative infection after open injuries of the extremities has been reported in the range of 10% to 25%, although the exact rate varies according to injury mechanism, contamination level, and treatment strategies.5 Multiple factors are known or suspected to influence the risk of infection, including patient-related characteristics such as age, smoking status, and comorbidities, injury-related factors such as type and severity of injury, wound contamination, and time from injury to surgery, as well as perioperative management such as choice of anesthesia, operation time, intraoperative blood loss, use of antibiotics, and wound drainage.6 However, in routine clinical practice, surgeons often rely on subjective experience to estimate infection risk, which may lead to underestimation or overestimation in individual patients.
Traditional risk prediction tools, including scoring systems and logistic regression-based models, have been applied to SSI in trauma and orthopedic surgery.7,8 Although these approaches have provided useful insights, they commonly show only moderate discriminative ability and are limited in capturing complex and nonlinear relationships among multiple predictors.9,10 In addition, many existing models lack external validation and are not specifically tailored to open hand injuries, which differ from other trauma types in anatomical structure, contamination patterns, and functional requirements. With the rapid development of artificial intelligence, machine learning methods have demonstrated advantages in processing high-dimensional clinical data and improving prediction performance for various postoperative complications.11 Nevertheless, studies focusing on machine learning models for predicting SSI specifically in open hand injuries remain scarce, and few have incorporated both external validation and interpretable algorithms suitable for clinical decision support.
In this context, there is a clear need to develop robust and clinically applicable prediction tools that can accurately identify patients with open hand injuries who are at high risk of postoperative incision infection. Early and individualized risk assessment could help clinicians optimize surgical timing, refine perioperative management, and allocate preventive measures such as more intensive wound care or drainage, thereby potentially reducing infection-related morbidity and improving outcomes.
Therefore, the present study aimed to construct and validate prediction models for SSI in patients with open hand injuries using routinely collected clinical data from two independent medical centers. Multiple machine learning algorithms were developed and compared, and variables related to patient characteristics, injury patterns, and perioperative factors were systematically evaluated. Furthermore, explainable machine learning techniques were introduced to enhance model transparency and facilitate clinical interpretation. Through this approach, we sought to provide an evidence-based and interpretable tool to support early risk stratification and informed decision-making in the management of open hand injuries.
Materials and Methods
Inclusion and Exclusion Criteria
This retrospective cohort study utilized data extracted from the electronic medical records system of The First Affiliated Hospital of Henan Medical University. The study period was defined as patients diagnosed with open hand injuries between January1,2020, and December31,2024. For external validation, we assembled an independent cohort of 300 patients meeting the same eligibility criteria at the First Central Hospital of Baoding during the same period. Patients were included if they were clinically diagnosed with open hand injuries requiring surgical intervention, aged 18years or older, and had complete clinical, laboratory, and perioperative data available in the hospital information system. Patients were excluded if essential clinical information was missing, if the injury involved pathological fractures, burns, or chemical or electrical trauma, or if there was a pre-existing infection or chronic osteomyelitis at the injury site prior to surgery. Moreover, patients who died during hospitalization, those who underwent amputation as a salvage procedure, or those with repeated admissions for the same injury episode were also excluded. All eligible cases were consecutively identified according to the inclusion and exclusion criteria to ensure data integrity and cohort representativeness.
Data Collection
A total of 21 variables were analyzed in this study, comprising both continuous and categorical variables. All data were obtained from the electronic medical records system as detailed in Table1.
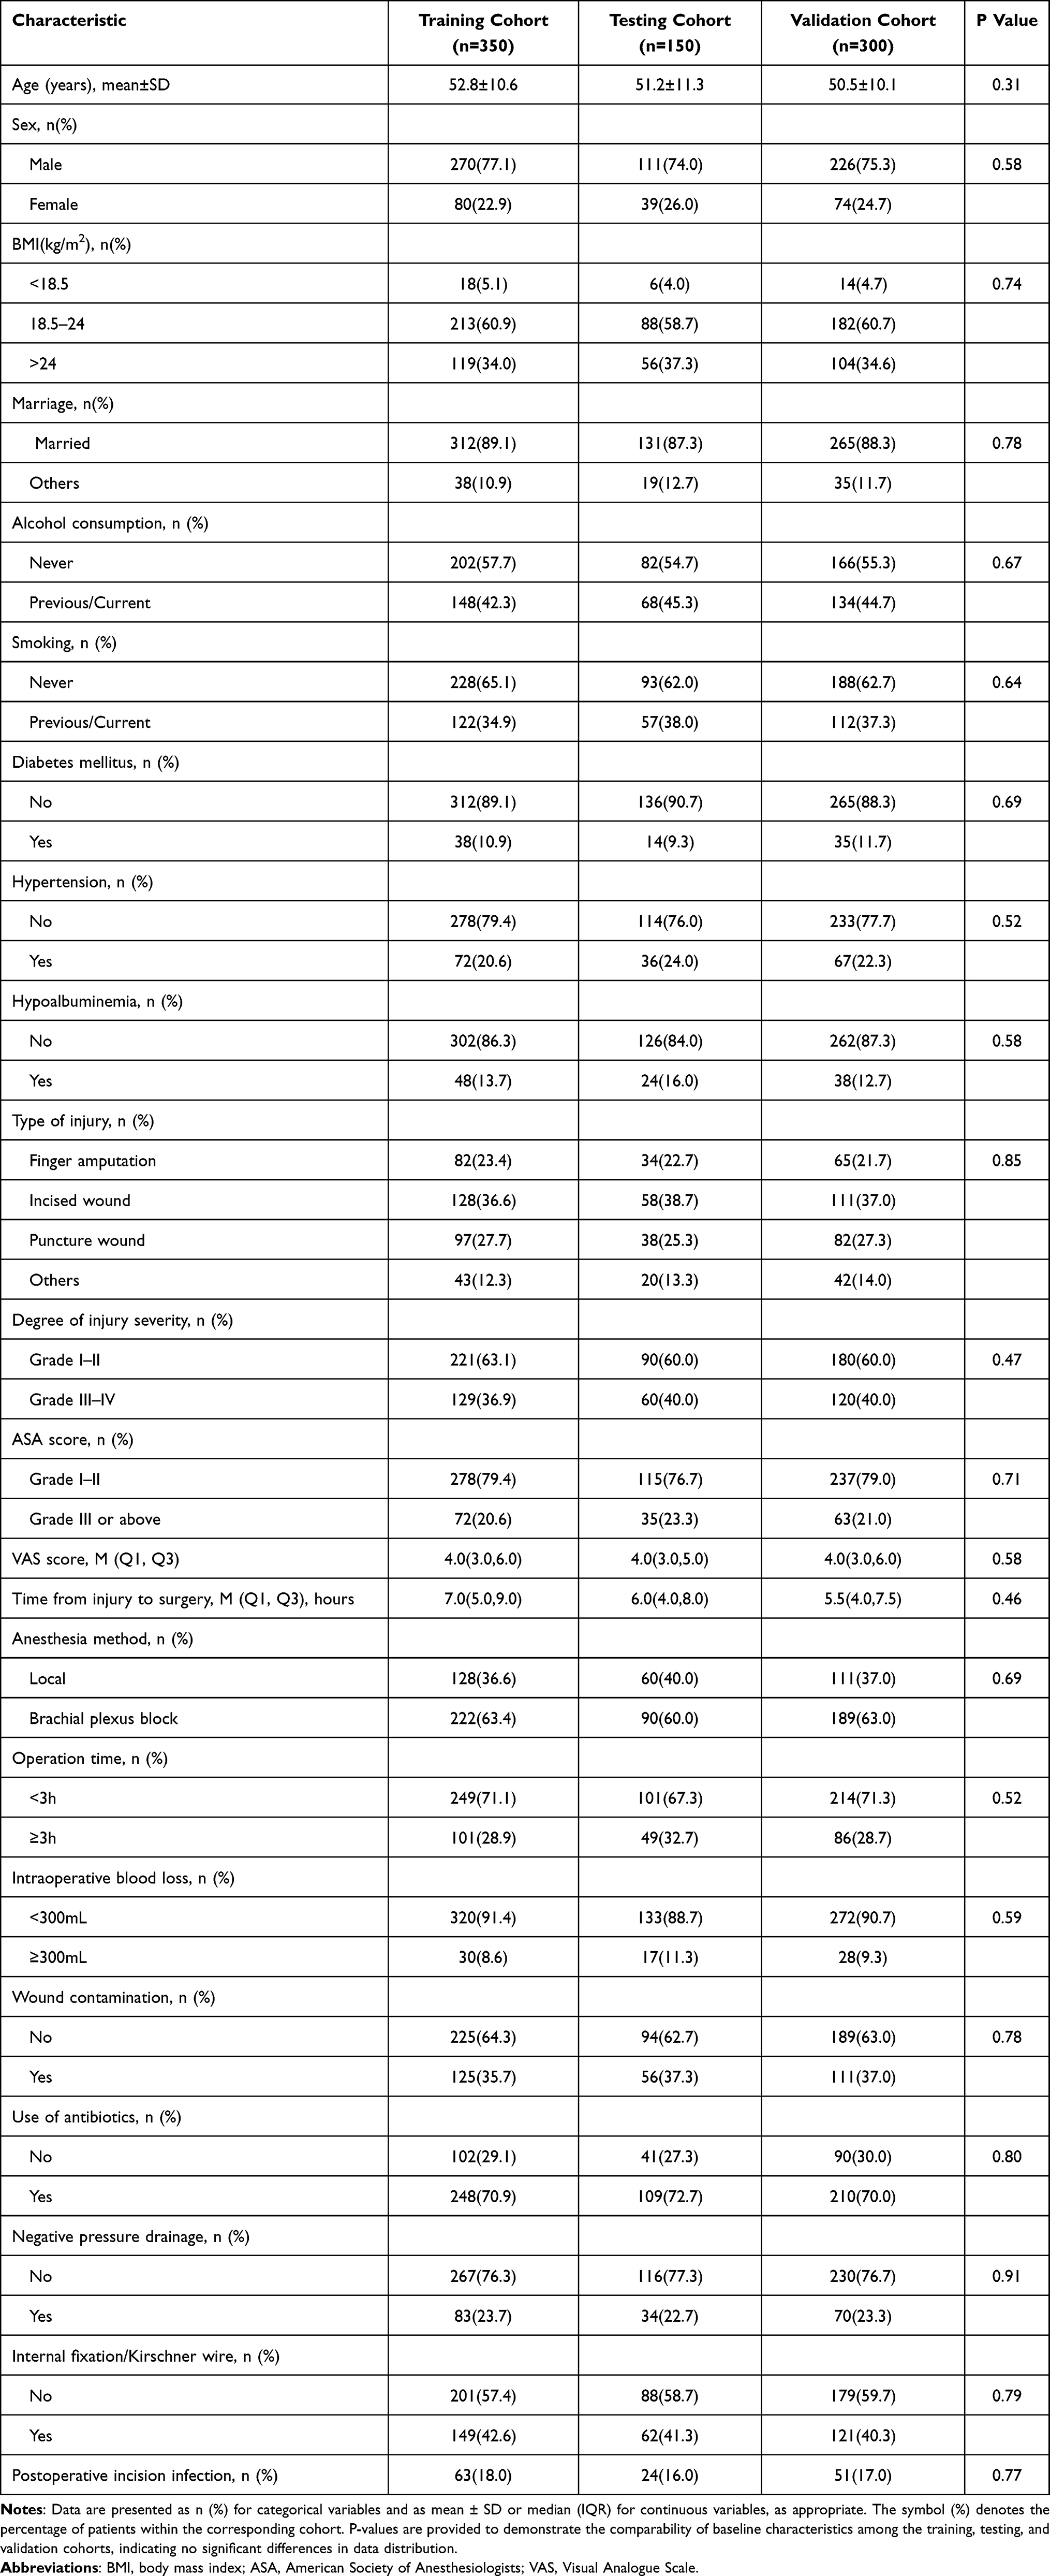 |
Table 1 Baseline Characteristics of Patients in the Training, Testing, and Validation Cohorts |
Continuous variables included age, visual analogue scale (VAS) score, and time from injury to surgery. Categorical variables included sex (male or female), body mass index (BMI) categorized as underweight (<18.5kg/m2), normal weight (18.5–24kg/m2), or overweight (>24.0kg/m2), marital status (married or others), alcohol consumption (never or previous/current), smoking status (never or previous/current), diabetes mellitus (yes or no), hypertension (yes or no), hypoalbuminemia (yes or no), type of injury (finger amputation, incised wound, puncture wound, or others), degree of injury severity (GradeI–II or GradeIII–IV), ASA score (GradeI–II or ≥GradeIII), anesthesia method (local or brachial plexus block), operation time (<3h or ≥3h), intraoperative blood loss (<300mL or ≥300mL), wound contamination (yes or no), use of antibiotics (defined as standard perioperative prophylaxis according to institutional protocols; yes or no), negative pressure drainage (yes or no), and internal fixation/Kirschner wire fixation (yes or no).
All variables were routinely recorded by attending surgeons and nursing staff at the time of hospitalization or surgery. Data were independently extracted and verified by two researchers to ensure completeness and accuracy. Any discrepancies were resolved through discussion under the supervision of the principal investigator.
Outcome Measures
The primary outcome of this study was SSI following surgery for open hand injuries. The diagnosis was made according to the Centers for Disease Control and Prevention (CDC) criteria for SSI, combined with the Chinese Society for Hand Surgery clinical guidelines.12 SSI was defined as the presence of at least one of the following findings within 30days after surgery: purulent drainage from the incision; a positive bacterial culture from fluid or tissue obtained aseptically from the wound; local signs of inflammation such as redness, swelling, warmth, tenderness, or dehiscence with or without fever as determined by the attending surgeon; or a clinical diagnosis of infection requiring extended antibiotic therapy, wound irrigation, or surgical debridement.13,14 All suspected cases were independently reviewed by two senior surgeons, and disagreements were resolved through consensus to ensure diagnostic consistency and accuracy.
Model Construction and Validation
Eight machine learning algorithms were developed to predict SSI in patients with open hand injuries, including Logistic Regression (LR), Decision Tree (DT), k-Nearest Neighbor (KNN), Naive Bayes (NBM), Random Forest (RF), Support Vector Machine (SVM), Extreme Gradient Boosting (XGB), and Light Gradient Boosting Machine (LGBM). Cases from the first hospital were randomly divided into training (70%) and testing (30%) subsets, ensuring comparable distributions of infection outcomes, while cases from the second hospital were used as an external validation cohort to evaluate model generalizability. Tenfold cross-validation was applied to the training subset for internal tuning of hyperparameters and to improve model stability and generalization.
Model performance was evaluated on the testing and validation subset across eight complementary metrics, including the area under the receiver operating characteristic curve (AUC), F1-score, recall, precision, negative predictive value, positive predictive value, specificity, and sensitivity. Furthermore, model calibration was assessed visually using calibration curves, and quantitatively by calculating the calibration intercept and slope to measure the agreement between predicted probabilities and observed outcomes. Pairwise differences between AUCs of models were statistically compared using the DeLong test, and a two-tailed p<0.05 was considered significant.
For an integrated assessment of model performance, each of the eight algorithms was ranked for every metric from best to worst, with points assigned in descending order (best=8 points, worst=1 point). The points were then summed across all eight metrics to calculate a cumulative ranking score, which represented the overall model performance balance.
To enhance model transparency and facilitate clinical interpretability, SHapley Additive exPlanations (SHAP) analysis was performed on the final RF model. The SHAP summary plot illustrated the global contribution of each variable to infection prediction, while the bee swarm plot displayed both feature impact direction and strength among individual patients. The bar plot of mean absolute SHAP values showed the overall importance ranking of predictors. Additionally, SHAP waterfall plots were used to visualize individual-level explanations, demonstrating how specific variable values influenced each patient’s predicted infection risk.
Statistical Analyses
All statistical analyses and data visualizations were performed using R (version 4.4.2) and JD_DCPM (V6.11, Jingding Medical Technology Co., Ltd.). Missing data were handled using complete case analysis, as patients with incomplete clinical records were excluded from the study. No imputation methods were applied. Hyperparameter tuning was performed using a grid search strategy with 10-fold cross-validation to optimize model performance. We systematically evaluated combinations of key parameters, specifically the number of trees (ntree) and the number of variables randomly sampled at each split (mtry). The final Random Forest model was established with ntree = 500 and mtry = 3, based on the optimal AUC value. Continuous variables were assessed for normality via the Shapiro–Wilk test. Normally distributed data are presented as mean ± standard deviation, with group comparisons conducted using Student’s t-tests. Non-normally distributed variables are expressed as median and interquartile range [M (Q1, Q3)] and analyzed via the Mann–Whitney U-test. Categorical variables are reported as frequencies (percentages) and evaluated using Chi-square tests or Fisher’s exact tests (for cell counts <5). Statistical significance was defined as a two-tailed p-value < 0.05. Finally, variable selection for the final models was based not only on statistical significance but also on clinical applicability and interpretability, ensuring the predictors were both robust and practically meaningful.
Result
Basic Characteristics of the Patients
A total of 800 patients with open hand injuries were included in this study, comprising 350 in the training cohort, 150 in the testing cohort, and 300 in the external validation cohort (Table 1). The baseline characteristics were comparable among the three cohorts (all p>0.05). The mean age was approximately 51.8±10.7years, and the majority of patients were male (approximately 75%). Most participants had a normal body mass index (BMI 18.5–24kg/m2) and were married. The proportions of smokers and patients with a history of alcohol consumption were around 35% and 44%, respectively.
Comorbidities were common, with 10.7% having diabetes mellitus, 21.6% hypertension, and 14.1% hypoalbuminemia. Finger amputation and incised wounds were the predominant injury types, and around 38% of patients had severe injuries (GradeIII–IV). The median visual analogue scale (VAS) score was 4.0, and the median time from injury to surgery was approximately 6hours.
Most operations were performed under brachial plexus block anesthesia (about 62%), with a duration of less than 3hours in over 70% of patients. Mild intraoperative blood loss (<300mL) was observed in most cases. Wound contamination occurred in about one-third of patients (36.7%), and 71% received prophylactic antibiotics. Negative pressure drainage was used in 23% of cases, and internal fixation or Kirschner wire fixation was applied in about 41%. The overall incidence of SSI was 17%, with no significant difference across cohorts.
Feature Selection
We first identified clinically relevant risk factors by integrating evidence from previous studies with insights from a multidisciplinary clinical panel comprising orthopedic surgeons, infection specialists, and biostatisticians. Candidate predictors were determined through a systematic literature review, clinical experience and expert consensus to ensure both clinical relevance and practical applicability. The rationale for this hybrid selection process was to prioritize clinical relevance in the initial screening to ensure biological plausibility, while employing statistical criteria in subsequent steps to objectively identify the most robust predictors and minimize model complexity.
Subsequently, univariate logistic regression analyses were conducted to explore the association between each potential variable and postoperative infection. The results indicated that age, smoking, diabetes mellitus, type of injury, degree of injury severity, time from injury to surgery, intraoperative blood loss, wound contamination, use of antibiotics, and negative pressure drainage were significantly associated with postoperative infection (p<0.05).
Variables that reached statistical significance in the univariate analyses were then incorporated into a multivariate logistic regression model to identify independent predictors. The multivariate analysis identified six key variables, age, smoking, diabetes mellitus, time from injury to surgery, wound contamination, and negative pressure drainage, as independent risk factors for postoperative infection (Table 2).
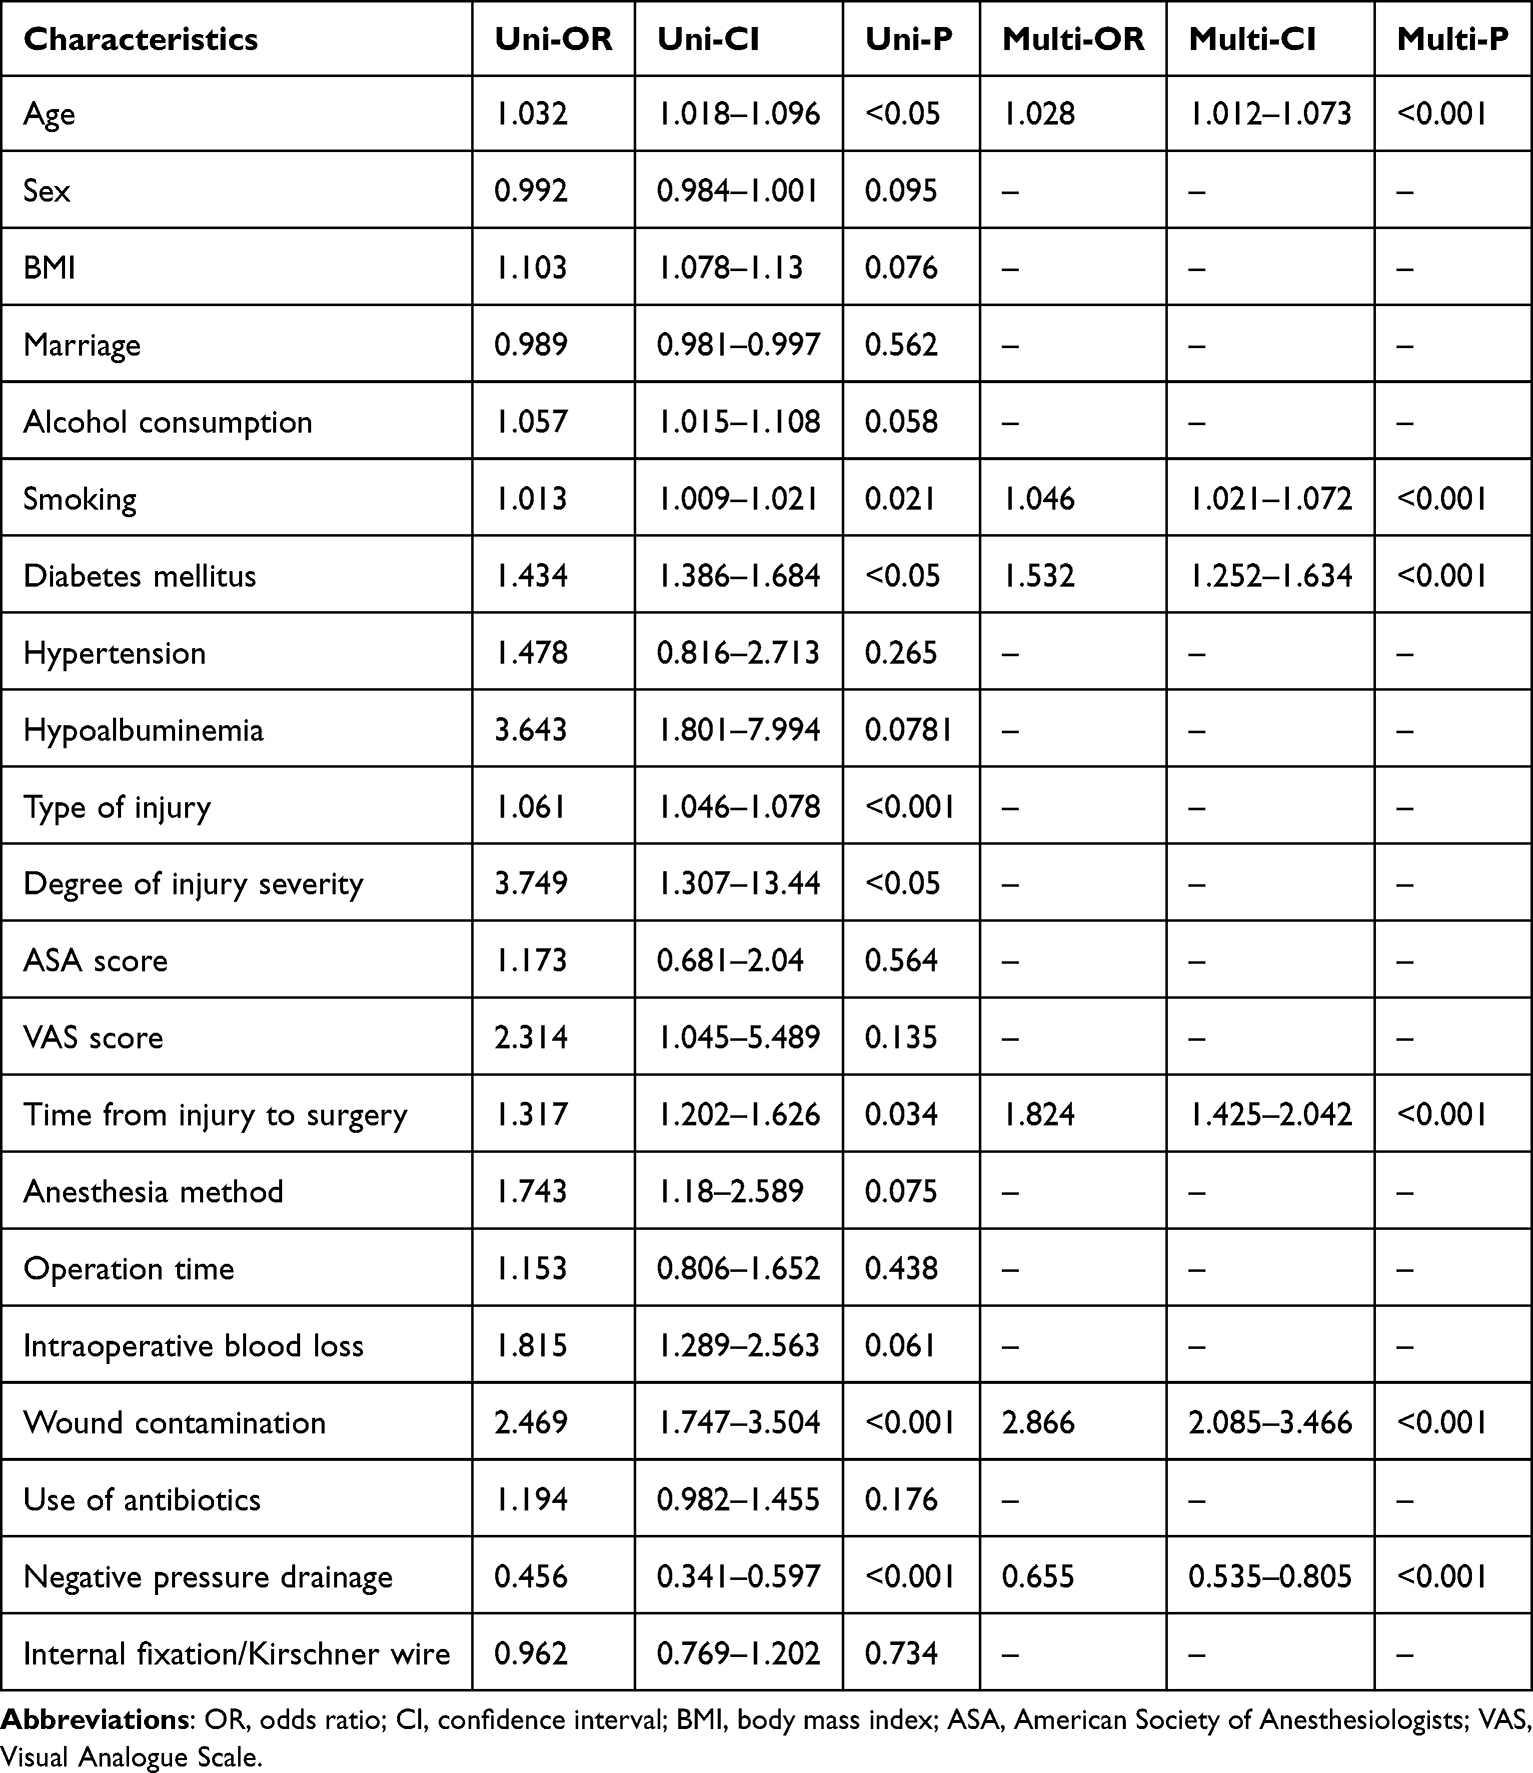 |
Table 2 Results of Univariate and Multivariate Logistic Regression Analysis |
Finally, the resulting predictors were critically reviewed by clinical experts to ensure plausibility, interpretability, and clinical actionability. These variables were subsequently included as input features for model development.
Model Development and Performance
Eight machine learning algorithms were developed and compared to predict postoperative infection following open hand injuries, including decision tree (DT), k-nearest neighbor (KNN), light gradient boosting machine (LGBM), logistic regression (LR), naive Bayes (NBM), random forest (RF), support vector machine (SVM), and extreme gradient boosting (XGB).
As shown in Figure 1A, the receiver operating characteristic (ROC) curves demonstrated that all models showed acceptable discriminatory performance, with area under the curve (AUC) values ranging from 0.585 to 0.903. Among them, the RF model achieved the highest AUC of 0.903(95%CI:0.863–0.943), followed by DT (AUC=0.799) and SVM (AUC=0.749), indicating that the RF algorithm had the strongest ability to distinguish between infection and non-infection cases.
 |
Figure 1 Performance comparison of machine learning models for predicting SSI in open hand injuries. (A) Receiver operating characteristic (ROC) curves for eight machine learning algorithms, including Decision Tree (DT), k-Nearest Neighbors (KNN), Light Gradient Boosting Machine (LGBM), Logistic Regression (LR), Naive Bayes (NB), Random Forest (RF), Support Vector Machine (SVM), and Extreme Gradient Boosting (XGB), with respective area under the curve (AUC) values and 95% confidence intervals. (B) Heatmap comparison of evaluation metrics (F1-score, recall, precision, negative predictive value, positive predictive value, specificity, and sensitivity) across models. (C) Pairwise statistical comparison of AUC values among different models, with color indicating P-values. (D) Ranking of model performance across metrics, where higher scores represent better relative ranking. The Random Forest model demonstrated the best overall performance with the highest AUC and balanced classification metrics. |
In Figure 1B, multiple performance metrics were evaluated to comprehensively compare model efficacy. The RF model demonstrated outstanding performance with the highest F1score(0.81), recall(0.76), precision(0.86), negative predictive value(0.86), positive predictive value(0.86), specificity(0.93), and sensitivity(0.76), outperforming all other algorithms across nearly all measures.
Figure 1C shows the pairwise statistical comparison of model performance. Significant differences were observed between most models (p<0.05), confirming that the RF model performed significantly better than the majority of other algorithms.
As illustrated in Figure 1D, overall ranking of models across all evaluation metrics revealed that the RF model achieved the highest total score of 64 points, ranking first among the eight algorithms. This consistent superiority across metrics highlights the strong stability and predictive capability of the RF model.
Together, these results demonstrate that the random forest algorithm achieved the best balance between discrimination, accuracy, and reliability, and was therefore selected as the optimal model for further interpretability and clinical validation analyses.
Model Performance on Both the Testing and External Validation Sets
The predictive ability and generalizability of the random forest (RF) model were further evaluated using both the independent testing set and the external validation set.
As shown in Figure 2A, the RF model demonstrated excellent discrimination in the testing cohort, with an AUC of 0.870(95%CI:0.822–0.918). The calibration curve (Figure 2B) revealed good agreement between the predicted probabilities and the actual outcomes, with a calibration intercept of 0.00(–0.32to0.32) and a slope of 1.00(0.74to1.26). Decision curve analysis (Figure 2C) showed that the RF model yielded a greater net clinical benefit across a wide range of threshold probabilities compared with the “treat-all” or “treat-none” strategies, suggesting practical value for guiding clinical decision-making. Additionally, five-fold cross-validation results (Figure 2D) demonstrated stable and high discrimination across folds, with mean AUC=0.811(95%CI:0.753–0.869), confirming the model’s robustness and internal consistency.
 |
Figure 2 Performance evaluation of the Random Forest model in the test set. (A) Receiver operating characteristic (ROC) curve of the RF model with an AUC of 0.870 (95% CI: 0.822–0.918). (B) Calibration curve showing good agreement between predicted and observed probabilities; the gray band indicates the 95% confidence interval. (C) Decision curve analysis demonstrating the clinical utility of the model across a range of threshold probabilities. (D) ROC curves of fivefold cross-validation showing consistent model performance across folds with a mean AUC of 0.811 (95% CI: 0.753–0.863). |
When applied to the external validation cohort (Figure 3), the RF model maintained strong predictive performance. The ROC curve (Figure 3A) showed an AUC of 0.849(95%CI:0.802–0.896), consistent with that observed in the testing cohort. The calibration plot (Figure 3B) revealed an intercept of 0.00(–0.32to0.32) and slope=1.00(0.58to1.42), indicating preserved calibration in an independent dataset. Decision curve analysis (Figure 3C) confirmed the sustained clinical utility of the RF model, showing a higher net benefit across relevant thresholds. The five-fold cross-validation results (Figure 3D) again demonstrated stability, with mean AUC=0.766(95%CI:0.703–0.829).
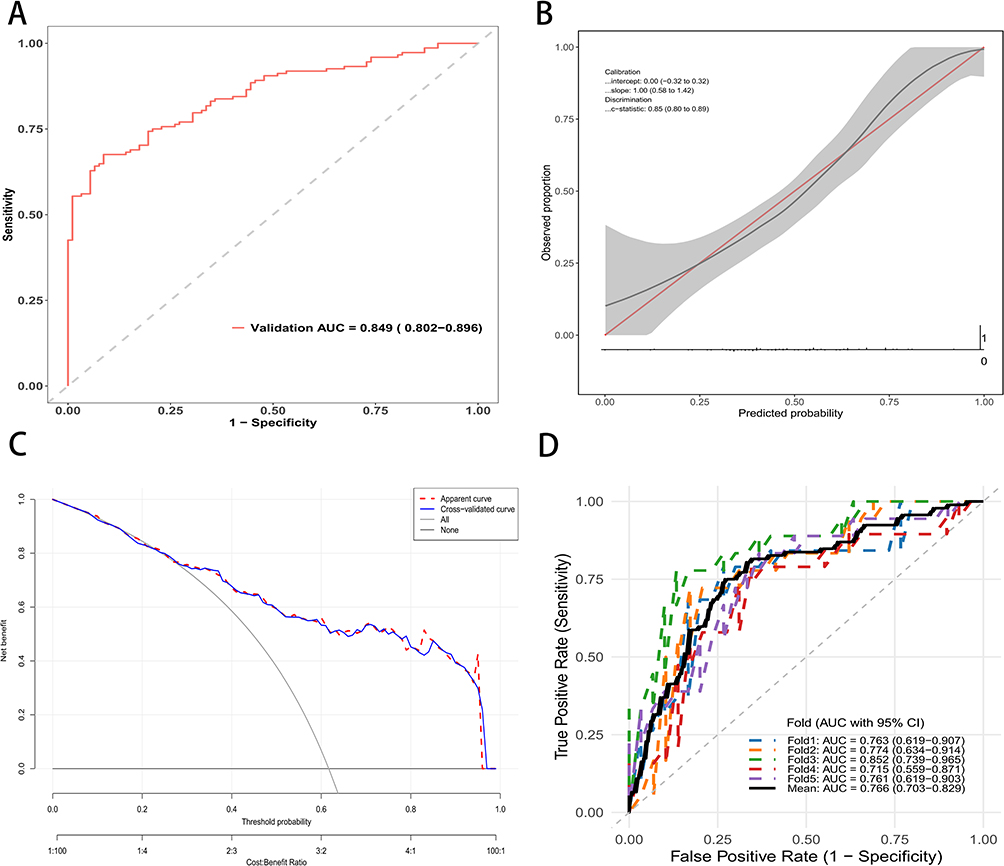 |
Figure 3 Performance evaluation of the Random Forest model in the validation set. (A) Receiver operating characteristic (ROC) curve of the RF model with an AUC of 0.849 (95% CI: 0.802–0.896). (B) Calibration curve demonstrating good agreement between predicted and observed probabilities; the gray band represents the 95% confidence interval. (C) Decision curve analysis indicating favorable clinical net benefit of the model across a wide range of threshold probabilities. (D) ROC curves from fivefold cross-validation showing stable discriminative performance with a mean AUC of 0.766 (95% CI: 0.703–0.829). |
Collectively, these findings demonstrate that the RF model achieved excellent discrimination, good calibration, and consistent clinical utility in both the testing and external validation sets, supporting its potential for practical application in predicting postoperative infection following open hand injuries.
Model Interpretation
To elucidate the internal decision process of the random forest (RF) model and to enhance clinical interpretability, SHapley Additive exPlanations (SHAP) analysis was performed.
As shown in Figure 4A, the SHAP summary plot visualized the contribution and direction of each predictor on the model output at the individual sample level. Each point represents a patient, and the color gradient indicates the relative feature value from low (purple) to high (yellow). Higher SHAP values indicate a stronger positive influence on the risk of postoperative infection. Wound contamination and longer time from injury to surgery were the most influential factors driving predictions toward higher infection risk, whereas the absence of negative pressure drainage, presence of diabetes mellitus, current smoking status, and older age also contributed positively but to a lesser extent.
 |
Figure 4 SHAP analysis of feature importance in the Random Forest model. (A) SHAP summary plot illustrating the contribution and direction of each feature to the model’s prediction of postoperative infection. Each point represents an individual sample, with color indicating the feature value. (B) Mean absolute SHAP values showing the overall importance of each variable in the model. |
The mean absolute SHAP values in Figure 4B highlighted the overall importance ranking of predictors. Wound contamination had the largest contribution to the model, followed by time from injury to surgery, negative pressure drainage, diabetes mellitus, smoking, and age, confirming that infection risk is strongly influenced by wound condition and surgical timing.
Individual-level explanations derived from SHAP force plots are presented in Figure 5. For an infected patient (Figure 5A), positive SHAP forces such as wound contamination = Yes, time from injury to surgery = 7.4hours, and absence of negative pressure drainage substantially increased the predicted probability of infection (f(x)=0.965). In contrast, for a non-infected patient (Figure 5B), factors such as wound contamination=No, shorter injury-to-surgery interval (4.8hours), and presence of negative pressure drainage collectively lowered the infection risk prediction (f(x)=–0.619).
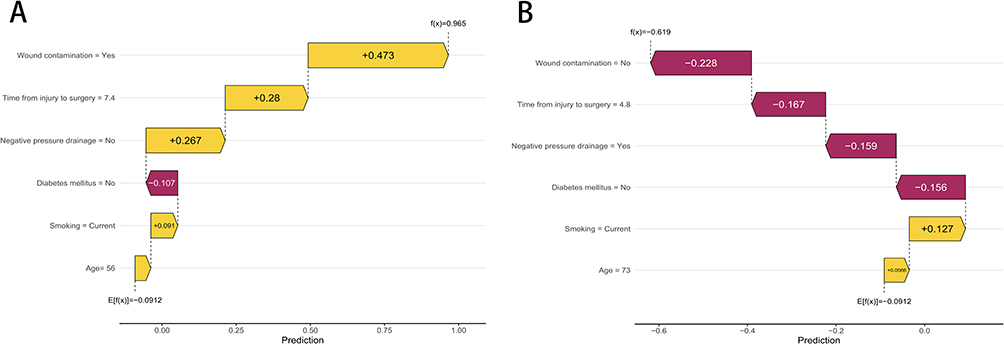 |
Figure 5 SHAP waterfall plots illustrating feature contributions to individual predictions of SSI. (A) Example of a positive case showing how each feature contributes to increasing the predicted risk of postoperative infection. (B) Example of a negative case showing how features contribute to decreasing the predicted risk. Yellow bars represent features with positive contributions (increasing predicted probability), while red bars represent features with negative contributions (decreasing predicted probability). |
These interpretability results confirm that the RF model aligns with established clinical understanding: delayed surgery and contaminated wounds markedly elevate infection risk, while effective drainage and early surgical management mitigate it. The SHAP-based visualization thus provides transparent, case-by-case interpretability, allowing clinicians to understand not only how the model predicts but also why a specific prediction is made.
Discussion
Postoperative infection remains a critical complication in open hand injuries, contributing to prolonged hospitalization, functional impairment, and increased healthcare costs. In this study, we developed and externally validated a machine learning-based predictive model for SSI using routinely available clinical data from 800 patients. The random forest (RF) algorithm demonstrated superior performance, achieving an area under the curve (AUC) of 0.903 in the training set, 0.870 in the internal testing set, and 0.849 in the external validation set. These results underscore the model’s robust discrimination, calibration, and clinical utility, as evidenced by decision curve analysis showing net benefits across a wide range of threshold probabilities. By integrating SHapley Additive exPlanations (SHAP) for interpretability, we identified six key predictors (age, smoking, diabetes mellitus, time from injury to surgery, wound contamination, and negative pressure drainage) aligning with established clinical risk factors and providing actionable insights for risk stratification.15,16
Our findings highlight the advantages of machine learning over traditional statistical methods in handling complex, nonlinear relationships among variables. The RF model’s outperformance (highest cumulative ranking score of 64 across eight metrics) compared to logistic regression and other algorithms is consistent with prior studies in SSI prediction.17 For instance, similar RF-based models have been applied in orthopedic surgery, such as total joint arthroplasty, where AUC values ranged from 0.75 to 0.85.18 However, our model achieved higher AUCs, likely due to the inclusion of hand-specific variables like wound contamination and surgical timing, which are particularly relevant in open injuries prone to environmental exposure.19 Univariate and multivariate logistic regression analyses corroborated these predictors, with wound contamination (odds ratio [OR] 2.866, p<0.001) and time from injury to surgery (OR 1.824, p<0.001) emerging as the strongest independent risk factors. This echoes literature on trauma surgery, where delays beyond 6–8 hours significantly elevate infection rates, as reported in a meta-analysis of open fractures (infection risk increasing by 20–30% per hour delay).20 Similarly, negative pressure drainage’s protective effect (OR 0.655, p<0.001) aligns with randomized trials demonstrating reduced infection in contaminated wounds by 15–25%.21 In terms of patient-related characteristics, our model identified age and smoking status as significant predictors. It is worth noting that while the individual effect sizes (odds ratios) for these variables may appear relatively small compared to wound contamination or surgical delays, their clinical significance should not be underestimated. These factors contribute to a cumulative risk profile; for instance, nicotine-induced microcirculatory impairment may compromise local immune defense. When combined with other comorbidities or severe injury characteristics, these factors can shift a patient from a low-risk to a high-risk category, justifying their inclusion in the predictive model.
The SHAP analysis enhances the model’s clinical applicability by offering transparent, individualized explanations. For example, in infected cases, positive SHAP contributions from contaminated wounds and prolonged injury-to-surgery intervals drove predictions toward higher risk, while the absence of negative pressure drainage amplified this effect. This interpretability addresses a common limitation of “black-box” machine learning models, as noted in guidelines from the American College of Surgeons, which emphasize the need for explainable AI in clinical decision-making.22 Compared to traditional nomograms, our SHAP-integrated approach provides dynamic visualizations, enabling surgeons to simulate “what-if” scenarios, such as expediting surgery or applying drainage, to mitigate risk.23 External validation in an independent cohort further strengthens generalizability, with sustained AUC (0.849) indicating applicability across different hospital settings, unlike single-center studies that often overestimate performance.
Existing scoring systems like the Hand Injury Severity Score and the Mangled Extremity Severity Score are widely used to assess injury severity and amputation risk but were not specifically designed to predict SSI. Similarly, general surgical risk indices such as the National Nosocomial Infections Surveillance index often lack the granularity required to account for the unique anatomical complexity and functional demands of the hand. In contrast, our proposed model offers incremental clinical value by focusing exclusively on open hand injuries. By integrating specific variables including distinct injury types and underlying comorbidities into a machine learning framework, our model captures non-linear interactions that traditional additive scores may overlook. This provides clinicians with a more precise and personalized risk stratification tool to guide early antibiotic stewardship and wound management strategies.
Despite these strengths, several limitations warrant discussion. First, the retrospective design may introduce selection bias, although we mitigated this through strict inclusion/exclusion criteria and consecutive patient enrollment. Second, the study was conducted in two Chinese hospitals, potentially limiting external validity to diverse populations or regions with varying surgical protocols. Third, while we evaluated a comprehensive set of 21 variables, unmeasured confounders such as microbial resistance patterns or surgeon experience were not included, which could influence infection outcomes. Additionally, the model’s reliance on categorical thresholds might oversimplify continuous risks, though RF’s ensemble nature handles this effectively. Finally, the infection incidence (17%) aligns with reported rates in open hand injuries (10–25%), but prospective validation is needed to assess real-time performance.
Clinically, this RF model could transform perioperative management by facilitating early identification of high-risk patients, enabling targeted interventions like prompt debridement, enhanced wound care, or prophylactic drainage. Integration into electronic health records could automate risk scoring, reducing subjective judgment and potentially decreasing infection rates by 10–20%, based on similar predictive tools in trauma care. Future research should focus on prospective multicenter trials to validate the model in real-world settings, incorporate additional features like genomic or imaging data, and develop user-friendly interfaces for bedside use. Moreover, cost-effectiveness analyses could quantify the model’s impact on healthcare resource allocation.
In summary, our study advances the field by providing a validated, interpretable machine learning tool for predicting postoperative infection in open hand injuries. By addressing key risk factors through evidence-based modeling, it offers a foundation for personalized, preventive strategies in hand surgery. To facilitate clinical application, future efforts should focus on integrating this predictive model into electronic medical record systems. This integration would enable automatic risk calculation based on standard admission data. Additionally, developing a web-based calculator or mobile application would allow surgeons to rapidly assess infection risk at the point of care. These implementation strategies aim to streamline decision making and ensure that high-risk patients receive timely and appropriate prophylactic interventions.
Conclusion
This study successfully developed and externally validated a random forest machine learning model for predicting SSI in patients with open hand injuries, achieving excellent discriminative performance (AUC 0.903 in training, 0.870 in testing, and 0.849 in external validation) and clinical utility. Key predictors, including wound contamination, delayed surgery, and absence of negative pressure drainage, were elucidated through SHAP analysis, providing transparent insights aligned with clinical evidence. The model outperforms traditional methods and demonstrates strong generalizability, supporting its potential integration into routine practice to enable early risk stratification and targeted interventions. Ultimately, this approach could reduce infection-related morbidity, improve functional outcomes, and optimize resource use in hand trauma care. Further prospective clinical validation is required to confirm the model’s generalizability and practical utility in diverse clinical environments before widespread implementation.
Data Sharing Statement
All original data can be available from the corresponding author upon request.
Ethical Approval and Consent to Participate
This study adhered to the principles of the Declaration of Helsinki and was approved by the Institutional Review Board of the Ethics Committee of the First Affiliated Hospital of Henan Medical University (Approval No. EC-2025-758). The informed consent is waived by the ethics committee because this is a retrospective design study. Patient confidentiality and data privacy were strictly safeguarded throughout the study.
Funding
The authors received no financial support for the research, authorship, and/or publication of this article.
Disclosure
The authors report no conflicts of interest in this work.
References
1. Sim WP, Ng HJH, Liang BZ, et al. Can open hand injuries wait for their surgery in a tertiary hospital? J Hand Microsurg. 2021;13:157–14. doi:10.1055/s-0041-1725220
2. Yun HC, Murray CK, Nelson KJ, et al. Infection after orthopaedic trauma: prevention and treatment. J Orthop Trauma. 2016;30:S21–S26. doi:10.1097/BOT.0000000000000667
3. Murphy GRF, Gardiner MD, Glass GE, et al. Meta-analysis of antibiotics for simple hand injuries requiring surgery. Br J Surg. 2016;103:487–492. doi:10.1002/bjs.10111
4. Davies J, Roberts T, Limb R, et al. Time to surgery for open hand injuries and the risk of surgical site infection: a prospective multicentre cohort study. J Hand Surg Eur Vol. 2020;45:622–628. doi:10.1177/1753193420905205
5. Dharap SB, Barbaniya P, Navgale S. Incidence and risk factors of postoperative complications in general surgery patients. Cureus. 2022. doi:10.7759/cureus.30975
6. Chang Y, Lai C-S, Liu S, et al. Safety of early postoperative showering in level-1 and level-2 surgical wounds: a retrospective study. J Comp Eff Res. 2025;14:e250089. doi:10.57264/cer-2025-0089
7. Kiwan O, Al-Kalbani M, Rafie A, et al. Artificial intelligence in plastic surgery, where do we stand? JPRAS Open. 2024;42:234–243. doi:10.1016/j.jpra.2024.09.003
8. Luțenco V, Beznea A, Mihailov R, et al. Literature review of prognostic factors in secondary generalized peritonitis. Life. 2025;15:880. doi:10.3390/life15060880
9. Shadid O, Seth I, Cuomo R, et al. Artificial intelligence in microsurgical planning: a five-year leap in clinical translation. JCM. 2025;14:4574. doi:10.3390/jcm14134574
10. Chen KA, Joisa CU, Stem JM, et al. Improved prediction of surgical-site infection after colorectal surgery using machine learning. Dis Colon Rectum. 2023;66:458–466. doi:10.1097/DCR.0000000000002559
11. Hassan AM, Biaggi-Ondina A, Asaad M, et al. Artificial intelligence modeling to predict periprosthetic infection and explantation following implant-based reconstruction. Plast Reconstr Surg. 2023;152:929–938. doi:10.1097/PRS.0000000000010345
12. Lu K, Zhang J, Cheng J, et al. Incidence and risk factors for surgical site infection after open reduction and internal fixation of intra‐articular fractures of distal femur: a multicentre study. Int Wound J. 2019;16:473–478. doi:10.1111/iwj.13056
13. Hernandez K, Ramos E, Seas C, et al. Incidence of and risk factors for surgical-site infections in a peruvian hospital. Infect Control Hosp Epidemiol. 2005;26:473–477. doi:10.1086/502570
14. Rajan K, Suganya P. Incidence and predictors of surgical site infections following open elective and emergency surgery: a prospective observational study. Cureus. 2025. doi:10.7759/cureus.86596
15. Chen X, Wu L, Lan G, et al. Construction and validation of a risk prediction model for postoperative lung infection in elderly patients with lung cancer. Medicine. 2024;103:e40337. doi:10.1097/MD.0000000000040337
16. Fernández‐Ugidos P, Barge‐Caballero E, Gómez‐López R, et al. In‐hospital postoperative infection after heart transplantation: risk factors and development of a novel predictive score. Transplant Infect Dis. 2019;21:e13104. doi:10.1111/tid.13104
17. Klemt C, Yeo I, Harvey M, et al. The use of artificial intelligence for the prediction of periprosthetic joint infection following aseptic revision total knee arthroplasty. J Knee Surg. 2024;37:158–166. doi:10.1055/s-0043-1761259
18. Chong YY, Chan PK, Chan VWK, et al. Application of machine learning in the prevention of periprosthetic joint infection following total knee arthroplasty: a systematic review. Arthroplasty. 2023;5:38. doi:10.1186/s42836-023-00195-2
19. Yeramosu T, Ahmad W, Satpathy J, et al. Prediction of suitable outpatient candidates following revision total knee arthroplasty using machine learning. Bone Jt Open. 2023;4:399–407. doi:10.1302/2633-1462.46.BJO-2023-0044.R1
20. Srour M, Inaba K, Okoye O, et al. Prospective evaluation of treatment of open fractures: effect of time to irrigation and debridement. JAMA Surg. 2015;150:332. doi:10.1001/jamasurg.2014.2022
21. O’Toole RV, Joshi M, Carlini AR, et al; The Major Extremity Trauma Research Consortium (METRC). Effect of intrawound vancomycin powder in operatively treated high-risk tibia fractures: a randomized clinical trial. JAMA Surg. 2021;156:e207259. doi:10.1001/jamasurg.2020.7259
22. Zhu D-L, Tulahong A, Liu C, et al. Identification of key factors and explainability analysis for surgical decision-making in hepatic alveolar echinococcosis assisted by machine learning. World J Gastroenterol. 2025;31:111038. doi:10.3748/wjg.v31.i37.111038
23. Huang C, Xu J, Qiu H, et al. Developing nurse‐accessible hypertension prediction tools for low‐income populations: a comparative analysis of machine learning algorithms with SHAP interpretation. Int J Nurs Pract. 2025;31:e70060. doi:10.1111/ijn.70060
 © 2026 The Author(s). This work is published and licensed by Dove Medical Press Limited. The
full terms of this license are available at https://www.dovepress.com/terms
and incorporate the Creative Commons Attribution
- Non Commercial (unported, 4.0) License.
By accessing the work you hereby accept the Terms. Non-commercial uses of the work are permitted
without any further permission from Dove Medical Press Limited, provided the work is properly
attributed. For permission for commercial use of this work, please see paragraphs 4.2 and 5 of our Terms.
© 2026 The Author(s). This work is published and licensed by Dove Medical Press Limited. The
full terms of this license are available at https://www.dovepress.com/terms
and incorporate the Creative Commons Attribution
- Non Commercial (unported, 4.0) License.
By accessing the work you hereby accept the Terms. Non-commercial uses of the work are permitted
without any further permission from Dove Medical Press Limited, provided the work is properly
attributed. For permission for commercial use of this work, please see paragraphs 4.2 and 5 of our Terms.
Recommended articles
Predicting Antibiotic Resistance in ICUs Patients by Applying Machine Learning in Vietnam
Tran Quoc V, Nguyen Thi Ngoc D, Nguyen Hoang T, Vu Thi H, Tong Duc M, Do Pham Nguyet T, Nguyen Van T, Ho Ngoc D, Vu Son G, Bui Duc T
Infection and Drug Resistance 2023, 16:5535-5546
Published Date: 22 August 2023
Prediction of Acute Kidney Injury in Intracerebral Hemorrhage Patients Using Machine Learning
She S, Shen Y, Luo K, Zhang X, Luo C
Neuropsychiatric Disease and Treatment 2023, 19:2765-2773
Published Date: 11 December 2023
Primary Care Asthma Attack Prediction Models for Adults: A Systematic Review of Reported Methodologies and Outcomes
Ma L, Tibble H
Journal of Asthma and Allergy 2024, 17:181-194
Published Date: 14 March 2024
Enhancing Prediction of Myocardial Recovery After Coronary Revascularization: Integrating Radiomics from Myocardial Contrast Echocardiography with Machine Learning
Huang D, Yang X, Ruan H, Zhuo Y, Yuan K, Ruan B, Li F
International Journal of General Medicine 2024, 17:2539-2555
Published Date: 31 May 2024
Early Warning of Axillary Lymph Node Metastasis in Breast Cancer Patients Using Multi-Omics Signature: A Machine Learning-Based Retrospective Study
Ke Z, Shen L, Shao J
International Journal of General Medicine 2024, 17:6101-6114
Published Date: 12 December 2024