
Back to Journals » International Journal of General Medicine » Volume 18
Development and Validation of a Non-Invasive Prediction Model for Glioma-Associated Epilepsy: A Comparative Analysis of Nomogram and Decision Tree
Authors Zhong Z, Yu HF, Tong Y, Li J
Received 17 December 2024
Accepted for publication 15 February 2025
Published 26 February 2025 Volume 2025:18 Pages 1111—1125
DOI https://doi.org/10.2147/IJGM.S512814
Checked for plagiarism Yes
Review by Single anonymous peer review
Peer reviewer comments 2
Editor who approved publication: Dr Ching-Hsien Chen
Zian Zhong,* Hong-Fei Yu,* Yanfei Tong, Jie Li
Department of Neurology, Xiangyang Central Hospital, Affiliated Hospital of Hubei University of Arts and Science, Xiangyang, Hubei, People’s Republic of China
*These authors contributed equally to this work
Correspondence: Jie Li, Email [email protected]; Yanfei Tong, Email [email protected]
Objective: Glioma-associated epilepsy (GAE) is a common neurological symptom in glioma patients, which can worsen the condition and increase the risk of death on the basis of primary injury. Given this, accurate prediction of GAE is crucial, and this study aims to develop and validate a GAE warning recognition prediction model.
Methods: We retrospectively collected MRI scan imaging data and urine samples from 566 glioma patients at the Xiangyang Central Hospital, Affiliated Hospital of Hubei University of Arts and Science from August 2016 to December 2023. Least Absolute Shrinkage and Selection Operator (LASSO) regression and multivariate logistic regression analysis are used to determine independent risk factors for GAE. The nomogram and decision tree GAE visualization prediction model were constructed based on independent risk factors. The discrimination, calibration, and clinical usefulness of GAE prediction models were evaluated through receiver operating characteristic (ROC) curve, calibration curve, and decision curve analysis (DCA), respectively.
Results: In the training and validation datasets, the incidence of GAE was 34.50% and 33.00%, respectively. Nomogram and decision tree were composed of five independent radiomic predictors and three differential protein molecules derived from urine. The discrimination rate of area under the curve (AUC) was 0.897 (95% CI: 0.840– 0.954), slightly decreased in the validation data set, reaching 0.874 (95% CI: 8.817– 0.931). The calibration curve showed a high degree of consistency between the predicted GAE probability and the actual probability. In addition, DCA analysis showed that in machine learning prediction models, decision trees have higher overall net returns within the threshold probability range.
Conclusion: We have introduced a machine learning prediction model for GAE detection in glioma patients based on multiomics data. This model can improve the prognosis of GAE by providing early warnings and actionable feedback and prevent or reduce pathological damage and neurobiochemical changes by implementing early interventions.
Keywords: glioma-associated epilepsy, multiomics, machine learning, prediction
Introduction
Glioma, as one of the most common primary brain tumors in clinical practice, is the leading cause of death in primary brain tumors.1,2 Specifically, glioma-associated epilepsy (GAE) is a common neurological symptom in glioma patients, which seriously affects their daily life.3 If not treated in a timely manner, some patients may experience epileptic states and multiple seizures, leading to coma.4,5 Therefore, early prediction of GAE that may occur in grade II–IV gliomas has significant clinical significance for subsequent diagnosis and treatment of patients, limiting the progression of the disease.
Magnetic Resonance Imaging (MRI) has become an important diagnostic tool for glioma patients due to its non-invasive nature and good tissue contrast.6,7 In essence, imaging omics converts images into quantitative features that can be used for modeling and is widely used in tumor-related research.7–9 The advantage of radiomics methods is that the models have strong interpretability and require relatively less sample size. Based on the results, they have important value in the medical imaging field where data resources, especially high-quality annotated data, are scarce. Imaging omics based on a single MRI sequence has been proven effective in diagnosing the occurrence and types of GAE.10,11 There have been studies on the diagnostic performance of GAE based on T2WI features.12 Additionally, in previous studies, the value of the rich information contained in multi-sequence MRI in epilepsy diagnosis has not been explored, and doctors need to manually delineate the area of interest, which increases their burden and affects the objectivity of the entire process. Attentively, the current revolution in proteomics has led to the discovery of several new protein biomarkers for various diseases, especially the development of urine proteomics and metabolomics, which have also shown initial success in primary brain tumors.13–15 For example, Richard et al developed two detection methods that can detect the presence of glioma (a type of brain tumor) in patients’ urine or plasma.16
In view of this, this study used preoperative scans of four sequences: T1 weighted, T2 weighted, T1Gd, and T2-FLAIR images and urine proteomics. A pre-trained deep learning model is used to automatically segment the ROI, and independent test sets are used to evaluate the model performance. The potential value of combining multi-omics with deep learning automatic segmentation in fully automated GAE diagnosis is demonstrated, thereby helping to guide clinical decision-making.
Materials and Methods
Study Population
This retrospective study was approved by the Medical Ethics Committee of the Xiangyang Central Hospital, Affiliated Hospital of Hubei University of Arts and Science and strictly adhered to the Helsinki Declaration, with all patients obtaining informed consent. We retrospectively collected 566 cases and imaging data of glioma patients from the Xiangyang Central Hospital, Affiliated Hospital of Hubei University of Arts and Science from August 2016 to December 2023. The entire queue was randomly divided into a training set and a validation set in a 7:3 ratio. The inclusion criteria are as follows: (1) Patients diagnosed with grade II–IV gliomas according to the World Health Organization’s pathological criteria;17,18 (2) Patients who underwent preoperative scanning of T1WI, T2WI, T1Gd, and T2-FLAIR sequences; (3) Patients who retained urine samples upon admission and passed urine routine tests. Exclusion criteria: (1) Patients who have undergone biopsy or anti-tumor therapy before MRI scanning; (2) Patients with seizures caused by other reasons, such as cerebral hemorrhage, stroke, etc; (3) Patients with combined liver and kidney dysfunction or neurological and psychiatric disorders. In addition, the preoperative diagnostic criteria for GAE are mainly based on a comprehensive evaluation of clinical manifestations, electroencephalography, and imaging results to confirm the diagnosis. The process of patient inclusion and prediction model construction was summarized in Figure 1.
 |
Figure 1 Flowchart for screening and constructing prediction models for the included population. |
Scanning and Processing of MRI Images
The images were scanned using a 3.0T Siemens MRI device, with TR/TE values of 2000–3800/9–120ms, 200–220/2–3ms, and 250/2.5ms for T2WI, T1WI, and T1Gd sequence scans, respectively. The T2-FLAIR scanning parameters are set to T1=2400–2500 ms, TE=81–135ms, TR=8000–8500ms. For the four sequences, the matrix is set to 256 × 256, the FOV is 240 × 240mm, and the layer thickness is 5mm. The contrast agent is injected through the elbow vein at a rate of 2.0mmol/s using a high-pressure injector, with a standard dosage of 0.1mmol/kg. After injection, the scan can be completed.
Image Preprocessing and Region of Interest (ROI) Segmentation
The T1WI, T2WI, and T1Gd images of each case were registered to the T2-FLAIR images using Elastix. Before feature extraction, all images are normalized to 0 or 1 and processed using a restricted contrast adaptive histogram equalization algorithm to reduce differences between images from different devices. Next, a doctor with 10 years of experience in neuroimaging used ITK-SNAP (version 3.6.0) to delineate the ROI layer by layer, including the tumor and peritumoral edema. Then, a doctor with 20 years of experience in neuroimaging used the same software for confirmation and modification. In order to perform ROI automatic segmentation, we also use HD-BET for brain extraction, and then use pre-trained nnU Net to automatically process images and segment ROIs.
Radiomic Feature Extraction
We used Pyradiomics 3.0 to automatically segment the ROI for feature extraction. For each case, we extracted a total of 300 features from the ROI. In addition to 14 shape features, we also extracted 18 first-order features and 75 texture features from each image in T1WI, T2WI, T1Gd, and T2-FLAIR. Texture features include histogram gray level co-occurrence matrix (HGLCM), gray level co-occurrence matrix (GLCM), neighborhood gray level difference matrix (NGLDM), gray level run length matrix (GLRLM), gray level region size matrix (GLRSM), and other features.
Differential Analysis, Screening, and Sequencing of Urine Proteomics
All patients’ urine samples (10 patients with GAE and 10 patients without GAE) were obtained after clinical urine routine testing, and the urine routine results were normal. The urine protein dry chemistry test was negative. After centrifugation at 3000 × g for 15 minutes, the supernatant was collected and frozen at −80 °C.
For the extraction of urine protein, we took urine samples from a −80 °C freezer and thawed them at 4 °C. Next, we centrifuged the urine sample at 4 °C 12,000 × g for 30 minutes and transferred the supernatant to a new centrifuge tube. Add 20 mmol/L dithiothreitol solution (prepared by Sigma, Germany, in 25 mmol/L NH 4HCO 3 solution) and mix. Heat the metal bath at 37 °C for 60 minutes, then cool to room temperature. Add 50 mmol/L iodoacetamide (Sigma, Germany, prepared in 25 mmol/L NH 4HCO 3 solution), mix and react at room temperature in the dark for 40 minutes. Add 3 times the volume of pre-cooled absolute ethanol, mix the sample evenly, and precipitate overnight at −20 °C. Centrifuge the mixture that has been precipitated overnight at 4 °C at 12000 × g for 30 minutes, discard the supernatant, evaporate ethanol, and dry. Subsequently, the protein was incubated with 20 mmol/L dithiothreitol at 95 °C for 10 minutes, alkylated in 55 mmol/L iodoacetamide for 45 minutes, loaded onto a membrane with a relative molecular weight of 30000, and washed with 20 mmol/L Tris solution. Then, digest the protein with trypsin. And use Oasis HLB filter cartridge (10 mg/mL, Waters Corporation, USA) for desalination.
For the processing of mass spectrometry data, we used a non-dependent collection method with the Spectronaut Pulsar 17.1 (Biognosys, Switzerland) for analysis using default settings. Set the retention time prediction type to dynamic index retention time. MS2 level interference correction has been enabled. The peptide intensity is calculated by summing the peak areas of the respective fragment ions of MS2, and the protein peak intensity is calculated by summing the intensities of the respective peptides. Enable cross run normalization to correct system differences in liquid chromatography-mass spectrometry performance and use a local normalization strategy. Protein inference is performed using the ID selector algorithm in Spectronaut. Filter all results using a Q cut-off value of 0.01 (corresponding to a false-positive detection rate of 1%). After a bioinformatics analysis, we finally obtained the three most significantly differentially expressed protein molecules from urine proteomics, namely MMP28, IGFBP2, and DDP4. The above three protein molecule ELISA kits were obtained from Abcam company and Shanghai Sig Biotechnology Co., Ltd. The item numbers are MMP28 (ab269401), IGFBP2 (ab207615), and DDP4 (XG-E990254).
Establishment and Evaluation of Predictive Models
The flowchart for establishing the predictive model was summarized in Figure 1. Due to the large number of extracted radiomic features, directly establishing a prediction model using all features may lead to overfitting of the prediction model, making it difficult to find the optimal prediction model.19 Therefore, we first used features from different sequences to establish sub-models. At the beginning of building the prediction model, we used Z-score to standardize all features and then planed the Pearson correlation coefficient (PCC) between any two features. If the PCC value was greater than 0.99, any radiomic feature will be removed. Second, to determine the optimal feature parameters to be retained in the prediction model, we attempted to use recursive feature elimination to establish the optimal prediction model. Finally, based on the optimal features mentioned above, a tumor imaging omics label score was established (ie, Rad score=constant+related features × feature coefficient).
The establishment process of the prediction model was carried out using ten-fold cross validation based on the training set. We selected sub-models and determined the number of features for the final model by calculating the area under the highest subject working characteristic curve on the cross-validation set. The final prediction model and clinical predictive performance were evaluated using an independent testing set, including decision curve analysis and calibration curve evaluation of the clinical usability of the prediction model; DeLong test was used to evaluate the difference in performance between two models.
Statistical Analysis
All data analysis and visualization were implemented using R software (version 4.2.2). Univariate analysis was used (including chi-square test, t-test, or Mann–Whitney U-test) for inter-group comparison of quantitative or enumeration data. Next, logistic regression was conducted using radiomics parameters in the training set to establish a prediction model, and the effectiveness of the prediction model was evaluated using the C-index and visualized in a nomogram. A p-value <0.05 for both tails was considered statistically significant.
Results
Clinical and Radiomic Features of Glioma Patients with or without Epilepsy
A total of 566 glioma patients were included in this study, with 65 (11.48%) and 34 (6.01%) patients with GAE in the training and validation sets, respectively. As shown in Table 1, there was no statistically significant difference (P>0.05) in all clinical features between the training and testing sets. In addition, by using the Dice value of automatic segmentation based on the training set, Table 1 showed the comparison between the segmentation results of features at different levels. There was statistically significant difference in a first order grayscale and second-order grayscale features between the GAE and non-GAE groups on the training and testing sets (P<0.05). The radiomics results demonstrated that the pre-trained model performs well in the task book of automatic ROI segmentation.
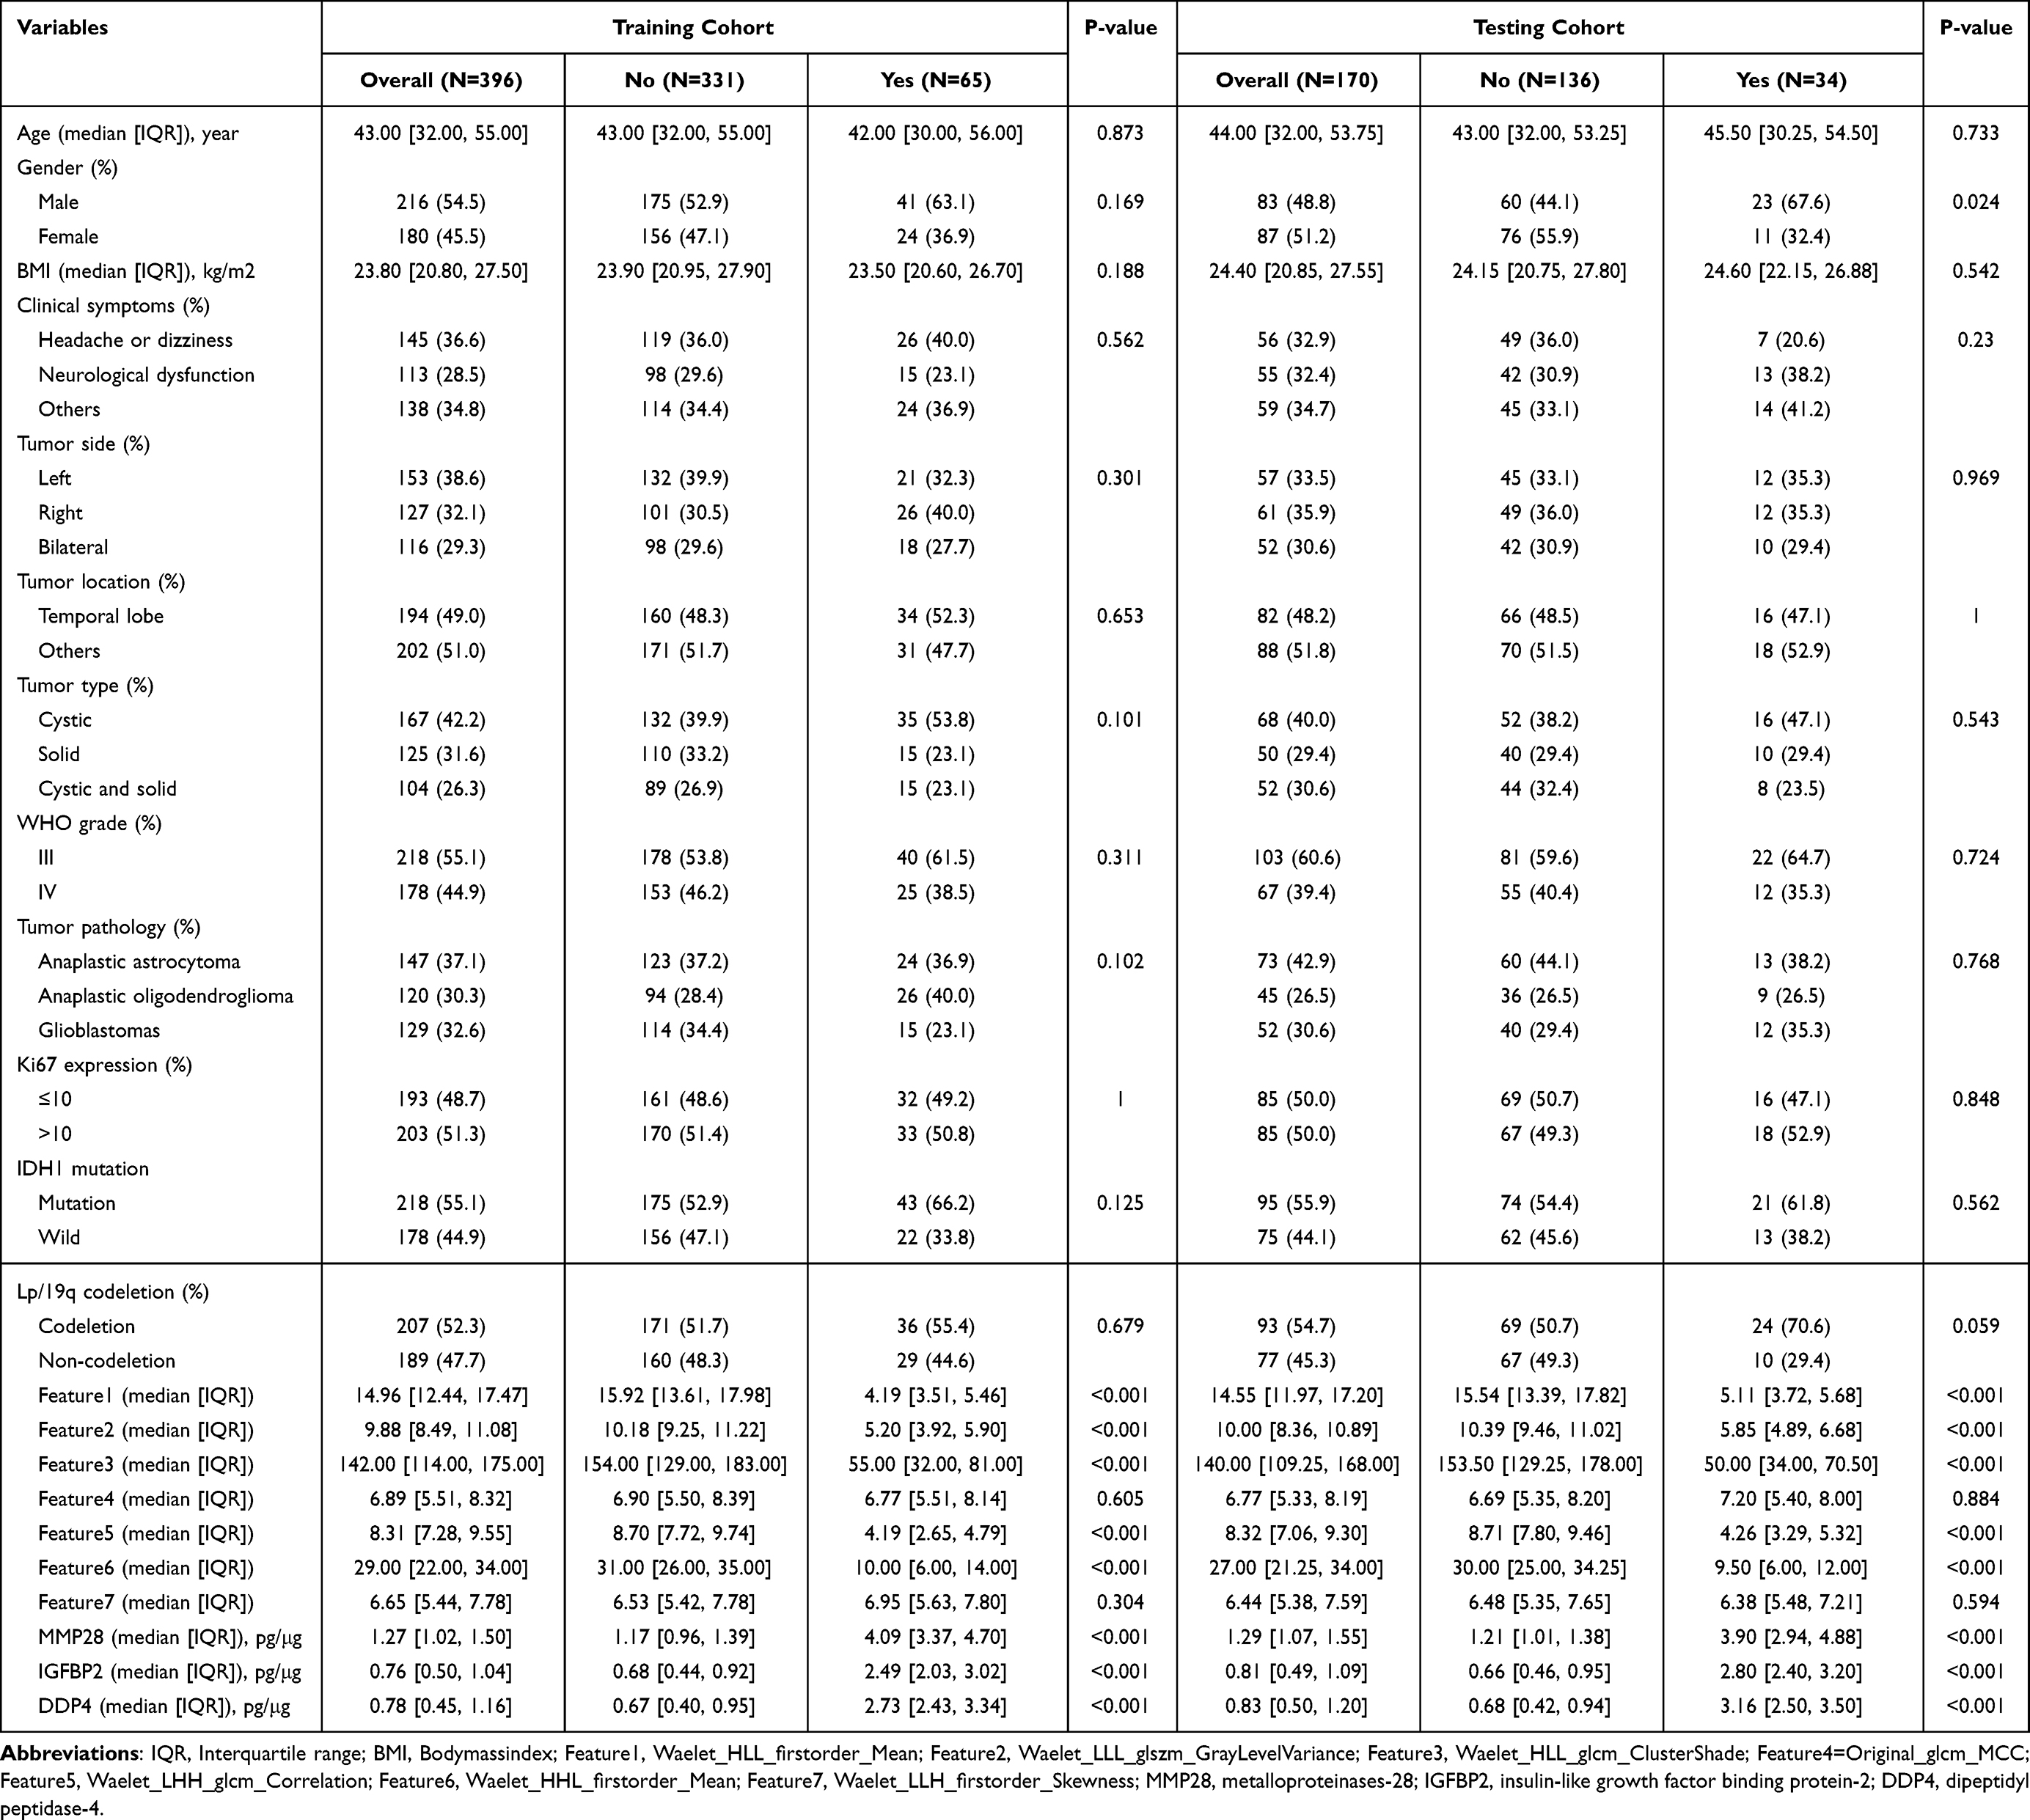 |
Table 1 Clinical Characteristics and Omics Parameters of Patients with or Without Glioma-Associated Epilepsy |
Screening and Assignment of Radiomics Predictor Variables
We extracted radiomics parameter features from each patient and standardized all features using Z-score. In the training set, we first performed the Mann–Whitney U-test on all features to select radiomic feature parameters with P-values less than 0.05. Then, we performed Spearman correlation analysis on the candidate feature parameters (Figure 2A) and finally obtained eight optimal candidate feature parameters. Logistic regression analysis further confirmed that these parameters can be independent risk factors for predicting GAE (Table 2). Next, we further screened the candidate features using LASSO with 10-fold cross validation and used the AUC value as the evaluation criterion for model performance after cross validation, as shown in Figure 2B. The lambda value (se=0.06) at which the AUC value was the highest was the optimal value (Figure 2C). The five radiomics parameter features and three urinary proteomics molecules selected were used as the final prediction model, and the feature names and coefficient values of the optimal features were summarized in Figure 2D and Supplementary Figure 1A and B.
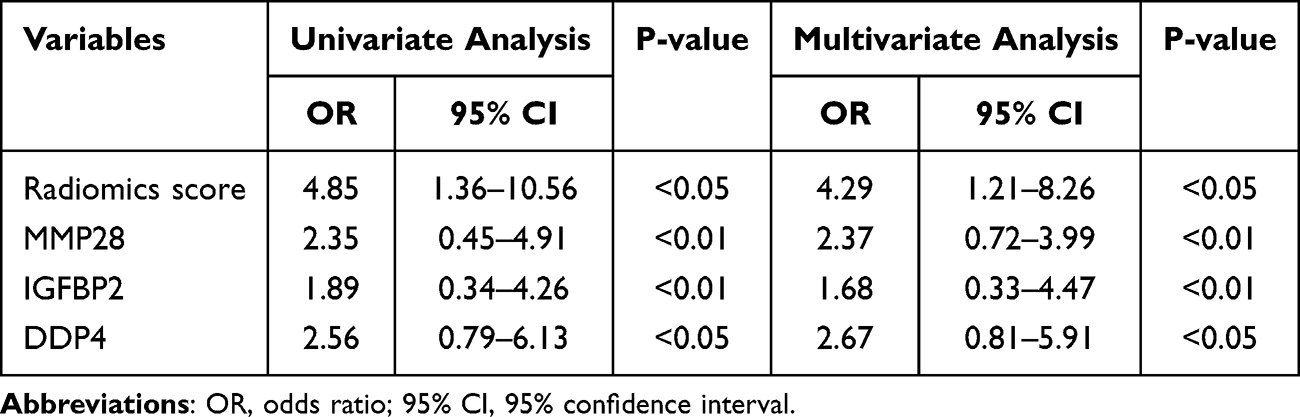 |
Table 2 Univariate and Multivariate Logistic Regression Analysis of Risk Factors for GAE |
 |
Figure 2 Selection of candidate variables for predictive models. (A) Pearson correlation coefficient analysis examines the correlation between candidate variables and outcome variables. (B) Recursive selection of optimal combination candidate predictor variables based on penalty coefficient. (C) Obtain candidate variable values for inclusion in the final prediction model based on the Lambda value. (D) Weight distribution of contribution values of candidate variables based on SHapley Additive exPlanations. |
Construction and Efficiency Evaluation of GAE Prediction Model
By establishing sub-models, differentially expressed radiomic features were screened from T1WI, T2WI, T1Gd, and T2-FLAIR, and these features were merged for modeling. The resulting image model includes radiomic features from 7 different sequences. As shown in Figure 3 and Table 3, the AUC values of the nomogram constructed based on radiomics on the training and testing sets reached 0.821 (95% CI: 0.764–0.878) and 0.809 (95% CI: 0.752–0.866), respectively. As shown in Figure 4, the AUC of the decision tree prediction model constructed based on the above predicted variables on the training set and validation set reached 0.897 (95% CI: 0.840–0.954) and 0.874 (95% CI: 0.817–0.931), respectively. At the same time, by analyzing the decision curves and comparing the predictive performance of two prediction models, it can be found that the decision tree can achieve the optimal net benefit when the threshold is between about 0.2 and 0.5, and the predictive performance is much better than nomogram (Figure 5). The DeLong test was performed on the predicted values output by two prediction models, and the results showed that the decision tree prediction model based on radiomics and urinary proteomics had significant statistical differences between the training set (P=0.021) and the test set (P=0.016).
 |
Table 3 Efficiency Evaluation Model Based on the Area Under the Receiver Operating Characteristic Curve |
 |
Figure 3 Developing a GAE prediction model based on nomogram visualization. (A) Nomogram. (B) Calibration curve. |
 |
Figure 4 Constructing an GAE prediction model based on decision tree visualization. (A) Decision tree model; (B) Calibration curve. |
 |
Figure 5 Net benefit capability of GAE prediction model based on decision curve analysis. (A) Training cohort; (B) Testing cohort. |
Discussion
Gliomas, as the most common primary intracranial tumor, have a complex mechanism of epilepsy and diverse pathological changes, so the formation mechanism is still inconclusive.20,21 Mounting extensive research evidence tends to be the result of multiple factors influencing each other, as well as mechanisms related to abnormal expression of tumor-related genes, tumor space compression, microenvironmental changes, and immune cytokines.21–23 In clinical practice, epilepsy may be the only and earliest clinical manifestation of glioma, with 20% to 80% of gliomas being associated with epilepsy, which is also a common complication after glioma surgery.24–26 Throughout history, electroencephalography (EEG) has been the most fundamental diagnostic tool for epilepsy.27 For instance, the long range video EEG can monitor episodic events that can last for minutes or hours, helping to classify epilepsy and determine its origin. However, low-grade gliomas often exhibit focal spikes and sharp waves in EEG, with a small portion being persistent localized slow waves.28 Some abnormal discharges can spread throughout the entire brain, especially when postoperative cortical electroencephalography shows an increase in epileptic discharges, indicating a high possibility of early epilepsy recurrence, but it has no predictive effect on long-term epilepsy prognosis.29,30 In this study, we pioneered the construction of a non-invasive GAE warning prediction model, which combines radiomics and urine proteomics, to construct a prediction model based on easily obtainable clinical test results. To our knowledge, this non-invasive prediction model has crucial guiding value in assisting in predicting the risk of GAE and early diagnosis and treatment.
MRI is more sensitive than CT in diagnosing GAE and can assist in locating and determining brain structural abnormalities, thus helping to classify epilepsy, especially in the diagnosis of etiology, such as gray matter ectopia, intracranial tumors, etc., which cannot be replaced by other diagnostic tools.31,32 Actually, epilepsy lesions refer to abnormal morphology or morphology of brain tissue, which can indirectly or directly cause epileptic seizures or discharges. As the pathological basis of epileptic seizures, CT or MRI can precisely display typical lesions of abnormal brain tissue. It is worth mentioning that hippocampal sclerosis and abnormal development of the cerebral cortex are structural abnormalities closely related to epilepsy.33,34 Hence, for those with epilepsy as the primary symptom, MRI shows supratentorial mass and circular or quasi circular abnormal signs at the top of the frontal and temporal regions. Tumor lesions, especially low-grade gliomas, should be given priority consideration. Additionally, relying on biopsy cannot fully reflect the heterogeneity of tumors, and may even lead to the loss of fine brain functions due to improper biopsy procedures. Previous studies have shown that using radiomic features can objectively and quantitatively extract texture features, reflect tumor heterogeneity, distinguish between glioblastoma and metastatic tumors, and predict molecular subtypes of glioblastoma and patient prognosis.35,36 So far, there have been few studies evaluating epilepsy related to glioblastoma patients based on radiomic features. This study creatively constructed an imaging omics scoring model to predict the risk of epilepsy in glioblastoma patients, confirm whether high-risk patients can be identified early, and improve patient prognosis.
Radiomics is a non-invasive method that quantitatively analyzes the potential heterogeneity of tumors by extracting a large number of quantitative features from medical imaging data and can avoid sampling errors in biopsies. Due to the fact that gliomas with concurrent epilepsy are mostly located on the tentorium, and frontal lobe gliomas have the highest probability of developing epilepsy, we speculate that the reason may be that the frontal lobe has the largest volume among all brain lobes and is closely connected to the basal ganglia, brainstem, hypothalamus, etc. Interestingly, neuronal discharges can be transmitted to these areas to trigger epileptic seizures. At the same time, the frontal lobe is closely related to functions such as language, mental activity, and voluntary movement, and the control of excitability is relatively unstable, so excitement is easy to spread after being stimulated. The radiomics prediction model has the advantages of non-invasive, simple, and practical prediction of epileptic seizures in glioma patients.36,37 Compared with radiomics models, the comprehensive clinical imaging features observed by the naked eye have non-discriminatory performance in predicting GAE. In view of this, this study successfully established a machine learning radiomics model based on the T2-FLAIR sequence, especially the Gaussian process radiomics model developed in this study, which is highly effective in predicting reinforcement patterns in the training queue, internal validation queue, and external validation queue. Of particular note is that the model has high negative predictive values in both queues.
Due to the fact that urine does not belong to the internal environment, compared to plasma, urine is more sensitive to changes in the body, making it an ideal sample for detecting disease biomarkers.38 In this study, we found that urinary proteomics differentially expressed molecules such as matrix metalloproteinases-28 (MMP-28), insulin-like growth factor binding protein-2 (IGFBP-2), and dipeptidyl peptidase-4 (DDP-4) were significantly differentially expressed in the GAE patient population (P<0.05). Previous studies have shown that MMP-28 protein is significantly upregulated in both malignant tumors and cancer cell lines, and it is also widely expressed in gliomas.39 At present, research has confirmed that MMP-28 in gliomas can induce the expression of transforming growth factor-β (TGF-β) and epithelial mesenchymal transition (EMT), leading to the invasion of gliomas and accelerating tumor progression.40 In addition, the expression of IGFBP-2 is closely related to the function of the phosphatase and tensin homolog (PTEN) gene, and PTEN can induce downregulation of IGFBP-2.41 When cancer occurs, high levels of IGFBP-2 expression are associated with PTEN loss. Therefore, elevated expression of IGFBP-2 may become a prognostic biomarker for cancer.41,42 In addition, in the field of glioma, Han et al analyzed 83 glioma cases using ELISA in 2014 and found that plasma IGFBP-2 levels after chemotherapy and radiotherapy were significantly correlated with overall survival (OS) of patients.43 Overall, IGFBP-2 has the potential to evaluate prognostic levels in the treatment of gliomas and is a potential prognostic biomarker for gliomas.
CD26/dipeptidyl peptidase-4 (DPP4) is a membrane-bound protein that exists in many cell types in the body and is soluble in body fluids.44 Previous studies have shown that the upregulation of CD26/DDP4 in gliomas promotes tumor progression, and one possible mechanism is DPP4 cleavage of the chemokine CXCL12, which induces upregulation of CXCL12 while stimulating glioma growth.45,46 Collectively, due to the presence of the blood–brain barrier and its invasive growth pattern, tissue biopsy of gliomas is difficult, so the development of biomarkers at the level of urine proteomics has better prospects in the future. Given this situation, our future diagnosis and treatment will increasingly rely on biomarkers to determine the progress of GAE, and then use molecular targeted therapy to specifically eliminate GAE, thereby establishing personalized and precise diagnosis and treatment plans to maximize the prevention and treatment effect of GAE.
This study inevitably has the following limitations. First, it is retrospective with a small sample size, and future multi-center validation is needed to improve the generalization of radiomics models. Second, the feature extraction in this study takes a long time, including manually delineating the region of interest, which limits its application in clinical practice. In the future, the use of automatic segmentation technology is expected to effectively solve this problem. Third, radiomic features are influenced by equipment from different manufacturers, which may lead to the failure of radiomics models in multi-center applications. In the future, standardization of radiomics data is needed.
Conclusion
In summary, early prediction, increased awareness, and appropriate treatment and care are crucial for protecting neurocognition, limiting progression, and improving patients’ quality of life. This study developed and validated a prediction model obtained from MRI and urinary proteomics that can effectively stratify the risk of GAE. Particularly, the multiomics-based prediction model can provide certain assistance for precise and personalized diagnosis and treatment of patients with GAE.
Disclosure
The authors report no conflicts of interest in this work.
References
1. Chen R, Smith-Cohn M, Cohen AL, Colman H. Glioma subclassifications and their clinical significance. Neurotherapeutics. 2017;14(2):284–297. doi:10.1007/s13311-017-0519-x
2. Davis ME. Epidemiology and overview of gliomas. Semin Oncol Nurs. 2018;34(5):420–429. doi:10.1016/j.soncn.2018.10.001
3. Slegers RJ, Blumcke I. Low-grade developmental and epilepsy associated brain tumors: a critical update 2020. Acta Neuropathol Commun. 2020;8(1):27. doi:10.1186/s40478-020-00904-x
4. Li L, Fang S, Li G, et al. Glioma-related epilepsy in patients with diffuse high-grade glioma after the 2016 WHO update: seizure characteristics, risk factors, and clinical outcomes. J Neurosurg. 2022;136(1):67–75. doi:10.3171/2020.12.JNS203351
5. Marku M, Rasmussen BK, Belmonte F, Andersen EAW, Johansen C, Bidstrup PE. Postoperative epilepsy and survival in glioma patients: a nationwide population-based cohort study from 2009 to 2018. J Neuro-Oncol. 2022;157(1):71–80. doi:10.1007/s11060-022-03948-2
6. Pope WB, Brandal G. Conventional and advanced magnetic resonance imaging in patients with high-grade glioma. Nucl Med mol Imaging. 2018;62(3):239–253. doi:10.23736/S1824-4785.18.03086-8
7. Stadlbauer A, Zimmermann M, Heinz G, et al. Magnetic resonance imaging biomarkers for clinical routine assessment of microvascular architecture in glioma. J Cereb Blood Flow Metab. 2017;37(2):632–643. doi:10.1177/0271678X16655549
8. Li G, Li L, Li Y, et al. An MRI radiomics approach to predict survival and tumour-infiltrating macrophages in gliomas. Brain. 2022;145(3):1151–1161. doi:10.1093/brain/awab340
9. Mo H, Liang W, Huang Z, et al. Machine learning-based multiparametric magnetic resonance imaging radiomics model for distinguishing central neurocytoma from glioma of lateral ventricle. Eur Radiol. 2023;33(6):4259–4269. doi:10.1007/s00330-022-09319-9
10. Volz LJ, Kocher M, Lohmann P, Shah NJ, Fink GR, Galldiks N. Functional magnetic resonance imaging in glioma patients: from clinical applications to future perspectives. Nucl Med mol Imaging. 2018;62(3):295–302. doi:10.23736/S1824-4785.18.03101-1
11. Guo P, Li L, Li C, et al. Multiparametric magnetic resonance imaging information fusion using graph convolutional network for glioma grading. J Healthc Eng. 2022;2022:7315665. doi:10.1155/2022/7315665
12. Du X, He Q, Zhang B, Li N, Zeng X, Li W. Diagnostic accuracy of diffusion-weighted imaging in differentiating glioma recurrence from posttreatment-related changes: a meta-analysis. Expert Rev Anticancer Ther. 2022;22(1):123–130. doi:10.1080/14737140.2022.2000396
13. Thomas S, Hao L, Ricke WA, Li L. Biomarker discovery in mass spectrometry-based urinary proteomics. Proteomics Clin Appl. 2016;10(4):358–370. doi:10.1002/prca.201500102
14. Du Y, Li R, Fu D, et al. Multi-omics technologies and molecular biomarkers in brain tumor-related epilepsy. CNS Neurosci Ther. 2024;30(4):e14717. doi:10.1111/cns.14717
15. Xu Y, Du Y, Zheng Q, et al. Identification of ferroptosis-related prognostic signature and subtypes related to the immune microenvironment for breast cancer patients receiving neoadjuvant chemotherapy. Front Immunol. 2022;13:895110. doi:10.3389/fimmu.2022.895110
16. Mouliere F, Smith CG, Heider K, et al. Fragmentation patterns and personalized sequencing of cell-free DNA in urine and plasma of glioma patients. EMBO Mol Med. 2021;13(8):e12881. doi:10.15252/emmm.202012881
17. Gianno F, Giovannoni I, Cafferata B, et al. Paediatric-type diffuse high-grade gliomas in the 5th CNS WHO classification. Pathologica. 2022;114(6):422–435. doi:10.32074/1591-951X-830
18. Reuss DE. Updates on the WHO diagnosis of IDH-mutant glioma. J Neuro-Oncol. 2023;162(3):461–469. doi:10.1007/s11060-023-04250-5
19. Minardi M, Bianconi A, Mesin L, Salvati LF, Griva F, Narducci A. Proposal of a machine learning based prognostic score for ruptured microsurgically treated anterior communicating artery aneurysms. J Clin Med. 2025;14(2):578. doi:10.3390/jcm14020578
20. Nicholson JG, Fine HA. Diffuse glioma heterogeneity and its therapeutic implications. Cancer Discovery. 2021;11(3):575–590. doi:10.1158/2159-8290.CD-20-1474
21. Hajj GNM, Nunes PBC, Roffe M. Genome-wide translation patterns in gliomas: an integrative view. Cell Signalling. 2021;79:109883. doi:10.1016/j.cellsig.2020.109883
22. Waitkus MS, Erman EN, Reitman ZJ, Ashley DM. Mechanisms of telomere maintenance and associated therapeutic vulnerabilities in malignant gliomas. Neuro Oncology. 2024;26(6):1012–1024. doi:10.1093/neuonc/noae016
23. Bansal K, Liang ML, Rutka JT. Molecular biology of human gliomas. Technol Cancer Res Treat. 2006;5(3):185–194. doi:10.1177/153303460600500302
24. Rudà R, Bruno F, Pellerino A. Epilepsy in gliomas: recent insights into risk factors and molecular pathways. Curr Opin Neurol. 2023;36(6):557–563. doi:10.1097/WCO.0000000000001214
25. Ehara T, Ohka F, Motomura K, Saito R. Epilepsy in patients with gliomas. Neurol Med Chir. 2024;64(7):253–260. doi:10.2176/jns-nmc.2023-0299
26. Bianconi A, Koumantakis E, Gatto A, et al. Effects of levetiracetam and lacosamide on survival and seizure control in IDH-wild type glioblastoma during temozolomide plus radiation adjuvant therapy. Brain. 2024;4:102732. doi:10.1016/j.bas.2023.102732
27. Benbadis SR, Beniczky S, Bertram E, MacIver S, Moshé SL. The role of EEG in patients with suspected epilepsy. Epileptic Disord. 2020;22(2):143–155. doi:10.1684/epd.2020.1151
28. Tigaran S, Rasmussen V, Dam M, Pedersen S, Høgenhaven H, Friberg B. ECG changes in epilepsy patients. Acta Neurol Scand. 1997;96(2):72–75. doi:10.1111/j.1600-0404.1997.tb00242.x
29. Suna N, Suna I, Gutmane E, et al. Electrocardiographic abnormalities and mortality in epilepsy patients. Medicina. 2021;57(5):504. doi:10.3390/medicina57050504
30. Hayashi K, Kohno R, Akamatsu N, Benditt DG, Abe H. Abnormal repolarization: a common electrocardiographic finding in patients with epilepsy. J Cardiovasc Electrophysiol. 2019;30(1):109–115. doi:10.1111/jce.13746
31. Duncan JS, de Tisi J. MRI in the diagnosis and management of epileptomas. Epilepsia. 2013;Suppl 9:40–43. doi:10.1111/epi.12442
32. Ormson MJ, Kispert DB, Sharbrough FW, et al. Cryptic structural lesions in refractory partial epilepsy: MR imaging and CT studies. Radiology. 1986;160(1):215–219. doi:10.1148/radiology.160.1.3086931
33. Thom M. Review: hippocampal sclerosis in epilepsy: a neuropathology review. Neuropathol Appl Neurobiol. 2014;40(5):520–543. doi:10.1111/nan.12150
34. Li Y, Liu P, Lin Q, Zhou D, An D. Postoperative seizure and memory outcome of temporal lobe epilepsy with hippocampal sclerosis: a systematic review. Epilepsia. 2023;64(11):2845–2860. doi:10.1111/epi.17757
35. Kwiatkowska-Miernik A, Mruk B, Sklinda K, Zaczyński A, Walecki J. Radiomics in the diagnosis of glioblastoma. Pol J Radiol. 2023;88:e461–e6. doi:10.5114/pjr.2023.132168
36. Kocher M, Ruge MI, Galldiks N, Lohmann P. Applications of radiomics and machine learning for radiotherapy of malignant brain tumors. Strahlenther Onkol. 2020;196(10):856–867. doi:10.1007/s00066-020-01626-8
37. Chen C, Zheng A, Ou X, Wang J, Ma X. Comparison of radiomics-based machine-learning classifiers in diagnosis of glioblastoma from primary central nervous system lymphoma. Front Oncol. 2020;10:1151. doi:10.3389/fonc.2020.01151
38. Paul P, Antonydhason V, Gopal J, Haga SW, Hasan N, Oh JW. Bioinformatics for renal and urinary proteomics: call for aggrandization. Int J mol Sci. 2020;21(3):961. doi:10.3390/ijms21030961
39. Bister VO, Salmela MT, Karjalainen-Lindsberg ML, et al. Differential expression of three matrix metalloproteinases, MMP-19, MMP-26, and MMP-28, in normal and inflamed intestine and colon cancer. Dig Dis Sci. 2004;49(4):653–661. doi:10.1023/B:DDAS.0000026314.12474.17
40. Piek E, Westermark U, Kastemar M, et al. Expression of transforming-growth-factor (TGF)-beta receptors and Smad proteins in glioblastoma cell lines with distinct responses to TGF-beta1. Int J Cancer. 1999;80(5):756–763. doi:10.1002/(SICI)1097-0215(19990301)80:5<756::AID-IJC21>3.0.CO;2-N
41. Russo VC, Azar WJ, Yau SW, Sabin MA, Werther GA. IGFBP-2: the dark horse in metabolism and cancer. Cytokine Growth Factor Rev. 2015;26(3):329–346. doi:10.1016/j.cytogfr.2014.12.001
42. Cohen P, Peehl DM, Stamey TA, Wilson KF, Clemmons DR, Rosenfeld RG. Elevated levels of insulin-like growth factor-binding protein-2 in the serum of prostate cancer patients. J Clin Endocrinol Metab. 1993;76(4):1031–1035. doi:10.1210/jcem.76.4.7682560
43. Han S, Meng L, Han S, Wang Y, Wu A. Plasma IGFBP-2 levels after postoperative combined radiotherapy and chemotherapy predict prognosis in elderly glioblastoma patients. PLoS One. 2014;9(4):e93791. doi:10.1371/journal.pone.0093791
44. Enz N, Vliegen G, De Meester I, Jungraithmayr W. CD26/DPP4 - a potential biomarker and target for cancer therapy. Pharmacol Ther. 2019;198:135–159.
45. Stremenova J, Krepela E, Mares V, et al. Expression and enzymatic activity of dipeptidyl peptidase-IV in human astrocytic tumours are associated with tumour grade. Int j Oncol. 2007;31(4):785–792.
46. Han Y, Sun Y, Zhang Y, Xia Q. High DPP4 expression predicts poor prognosis in patients with low-grade glioma. Mol Biol Rep. 2020;47(3):2189–2196. doi:10.1007/s11033-020-05321-w
 © 2025 The Author(s). This work is published and licensed by Dove Medical Press Limited. The
full terms of this license are available at https://www.dovepress.com/terms
and incorporate the Creative Commons Attribution
- Non Commercial (unported, 3.0) License.
By accessing the work you hereby accept the Terms. Non-commercial uses of the work are permitted
without any further permission from Dove Medical Press Limited, provided the work is properly
attributed. For permission for commercial use of this work, please see paragraphs 4.2 and 5 of our Terms.
© 2025 The Author(s). This work is published and licensed by Dove Medical Press Limited. The
full terms of this license are available at https://www.dovepress.com/terms
and incorporate the Creative Commons Attribution
- Non Commercial (unported, 3.0) License.
By accessing the work you hereby accept the Terms. Non-commercial uses of the work are permitted
without any further permission from Dove Medical Press Limited, provided the work is properly
attributed. For permission for commercial use of this work, please see paragraphs 4.2 and 5 of our Terms.
Recommended articles

Classification and Regression Tree Predictive Model for Acute Kidney Injury in Traumatic Brain Injury Patients
Wang R, Zhang J, He M, Xu J
Therapeutics and Clinical Risk Management 2024, 20:139-149
Published Date: 22 February 2024
Machine Learning-Based Predictive Modeling of Diabetic Nephropathy in Type 2 Diabetes Using Integrated Biomarkers: A Single-Center Retrospective Study
Zhu Y, Zhang Y, Yang M, Tang N, Liu L, Wu J, Yang Y
Diabetes, Metabolic Syndrome and Obesity 2024, 17:1987-1997
Published Date: 10 May 2024
Development and Validation of Upper Limb Lymphedema in Patients After Breast Cancer Surgery Using a Practicable Machine Learning Model: A Retrospective Cohort Study
Peng X, Lu Z
International Journal of General Medicine 2024, 17:3799-3812
Published Date: 2 September 2024
Machine Learning-Based Prediction Model for Multidrug-Resistant Organisms Infections: Performance Evaluation and Interpretability Analysis
Zhao W, Sun P, Li W, Shang L
Infection and Drug Resistance 2025, 18:2255-2269
Published Date: 6 May 2025
Prevalence and Factors Associated with Insomnia Among Chronic Disease Patients in Bangladesh: A Machine Learning Study
Das P, Arif M, Hasan ME, ALmerab MM, Habib AA, Al Mamun F, Mamun MA, Gozal D
Nature and Science of Sleep 2025, 17:2541-2567
Published Date: 7 October 2025