Back to Journals » Nature and Science of Sleep » Volume 18

Development and Validation of a Nomogram Incorporating Platelet Distribution Width and the Triglyceride-Glucose Index for Predicting Obstructive Sleep Apnea
Authors Shi L ![]() , Lin L, Liu T, Wang X
, Lin L, Liu T, Wang X ![]() , Cheng J, Chen M, Chen Q
, Cheng J, Chen M, Chen Q ![]() , Zhong F, Chen L, Chen X
, Zhong F, Chen L, Chen X ![]()
Received 7 March 2026
Accepted for publication 4 June 2026
Published 11 June 2026 Volume 2026:18 607552
DOI https://doi.org/10.2147/NSS.S607552
Checked for plagiarism Yes
Review by Single anonymous peer review
Peer reviewer comments 2
Editor who approved publication: Dr Sarah L Appleton
Liyong Shi,1,* Lianshun Lin,1,* Tanwei Liu,1,* Xiali Wang,2 Jing Cheng,3 Miaoxiang Chen,1 Qidong Chen,1 Fanbin Zhong,1 Linlin Chen,4 Xiaoyang Chen1,5,6
1Department of Pulmonary and Critical Care Medicine, The Second Affiliated Hospital of Fujian Medical University, The Second Clinical College of Fujian Medical University, Quanzhou, Fujian, 362000, People’s Republic of China; 2Science and Technology Center, Quanzhou Medical College, Quanzhou, Fujian, 362000, People’s Republic of China; 3School of Clinical Medicine, Quanzhou Medical College, Quanzhou, Fujian, 362000, People’s Republic of China; 4School of Pharmacy, Key Laboratory of Marine Natural Medicine and Biopharmaceuticals, Quanzhou Medical College, Quanzhou, Fujian, 362000, People’s Republic of China; 5Key Laboratory of Sleep Medicine (The Second Affiliated Hospital, Fujian Medical University), Fujian Province University, Quanzhou, Fujian, 362000, People’s Republic of China; 6NHC Key Laboratory of Etiological Epidemiology of Chronic Diseases with High Incidence in Fujian-Taiwan Area (Co-Construction), Fujian Medical University, Fuzhou, Fujian, 350122, People’s Republic of China
*These authors contributed equally to this work
Correspondence: Linlin Chen, Science and Technology Center, Quanzhou Medical College, Quanzhou, Fujian, 362000, People’s Republic of China, Email [email protected] Xiaoyang Chen, Department of Pulmonary and Critical Care Medicine, The Second Affiliated Hospital of Fujian Medical University, The Second Clinical College of Fujian Medical University, Quanzhou, Fujian, 362000, People’s Republic of China, Email [email protected]
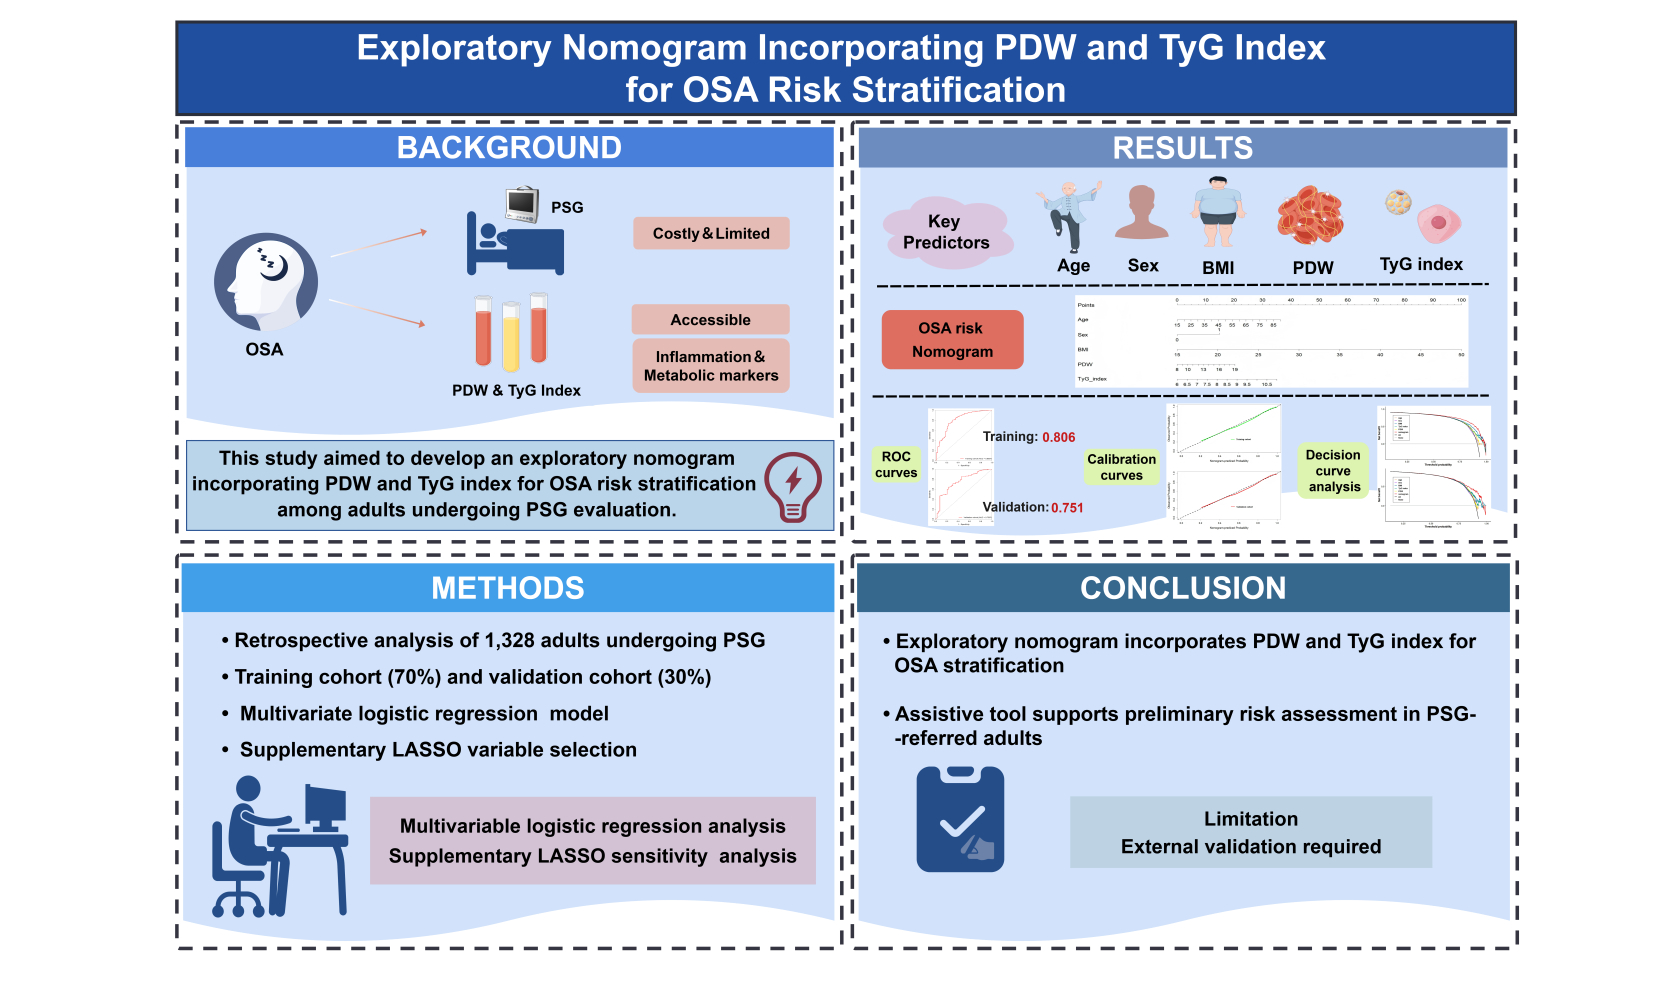
Purpose: Obstructive sleep apnea (OSA) is a prevalent systemic disorder linked to cardiovascular and metabolic consequences. However, polysomnography (PSG), the diagnostic gold standard, is resource-intensive and not always readily accessible. This study aimed to develop an exploratory nomogram incorporating platelet distribution width (PDW) and the triglyceride-glucose (TyG) index for individualized OSA risk stratification among adults referred for PSG evaluation.
Patients and Methods: A retrospective analysis of 1328 consecutive adults who underwent PSG, with participants randomly divided into a training cohort (70%) for model development and a validation cohort (30%) for internal validation. Candidate predictors were evaluated using multivariable logistic regression, and LASSO logistic regression was additionally performed as a sensitivity analysis for variable selection. A predictive nomogram was constructed based on clinically relevant and statistically supported predictors, and its performance was evaluated using the area under the curve (AUC), calibration, and decision curve analysis.
Results: Univariate logistic regression showed that age, sex, BMI, hypertension, PDW, and TyG index were associated with OSA. In multivariable analysis, older age (OR = 1.035, 95% CI: 1.016– 1.054, P < 0.001), male sex (OR = 2.990, 95% CI: 1.723– 5.189, P < 0.001), higher BMI (OR = 1.240, 95% CI: 1.149– 1.339, P < 0.001), elevated PDW (OR = 1.152, 95% CI: 1.025– 1.294, P = 0.017), and higher TyG index (OR = 1.710, 95% CI: 1.107– 2.642, P = 0.016) were included as predictors in the final nomogram. LASSO logistic regression supported the relevance of PDW and the TyG index, as both were retained under the lambda.min and lambda.1se criteria. The nomogram incorporating age, sex, BMI, PDW, and TyG index achieved an AUC of 0.806 in the training cohort and 0.751 in the validation cohort. Calibration curves showed consistency between predicted and observed OSA probabilities, and decision curve analysis indicated a higher net benefit than the treat-all and treat-none strategies across the evaluated threshold probability range.
Conclusion: This exploratory nomogram, incorporating readily available clinical variables together with PDW and the TyG index, may help stratify OSA risk among adults referred for PSG evaluation. Further external validation is required before its use can be recommended in broader screening settings.
Keywords: obstructive sleep apnea, platelet distribution width, triglyceride-glucose index, nomogram, risk prediction
Graphical Abstract:
Introduction
Obstructive sleep apnea (OSA) is a highly prevalent sleep-related breathing disorder characterized by recurrent upper airway collapse during sleep, resulting in intermittent hypoxia, hypercapnia, and sleep fragmentation.1–3 Global prevalence of OSA estimates range from 9% to 38% and continue to rise in parallel with the escalating burden of obesity and metabolic syndrome.4,5 OSA has been recognized as an independent risk factor for hypertension, cardiovascular disease, type 2 diabetes mellitus, cognitive dysfunction, and all-cause mortality.6 Despite its substantial clinical and public health implications, the majority of individuals with OSA remain undiagnosed.7 This diagnostic gap is largely attributable to limited accessibility, high cost, and the labor-intensive nature of polysomnography (PSG), the current gold standard for OSA diagnosis.8 Consequently, simple and readily available tools may be helpful for preliminary risk stratification among individuals referred for sleep evaluation, although such tools cannot replace PSG.9
Emerging evidence implicates platelet-mediated inflammatory and prothrombotic pathways in the pathogenesis of OSA.10,11 Intermittent hypoxia and oxidative stress provoke platelet activation, which in turn contributes to endothelial dysfunction and systemic inflammation.12,13 Platelet distribution width (PDW), a marker of platelet volume heterogeneity, reflects the degree of platelet activation and reactivity.14,15 Elevated PDW levels have been reported in patients with OSA, correlate positively with disease severity, suggesting a link between platelet activation and intermittent hypoxia-induced inflammation. The triglyceride-glucose (TyG) index, derived from fasting triglyceride and glucose concentrations, has emerged as a robust and reproducible surrogate marker of insulin resistance.16 Given the central role of metabolic dysfunction and insulin resistance in OSA development and progression, the TyG index may serve as an accessible biomarker for identifying high-risk individuals.17,18
While both PDW and the TyG index have individually been linked to OSA, their combined diagnostic utility remains unexplored. Given that platelet activation and insulin resistance represent distinct yet interrelated pathophysiological axes in OSA, integrating these two biomarkers may offer complementary information and enhance predictive performance beyond that achieved by either marker alone. To date, however, no established risk model has incorporated both PDW and TyG index for OSA prediction. To address this gap, the present study aimed to develop and internally validate an exploratory nomogram integrating PDW and the TyG index, together with readily available clinical variables, for individualized OSA risk estimation. Because the cohort consisted of adults referred for PSG evaluation, the intended use of the model is risk stratification within a high-risk clinical population rather than screening in the general population.
Materials and Methods
Study Population
This retrospective cohort study consecutively enrolled patients who underwent diagnostic overnight PSG at the Sleep Medicine Center of the Second Affiliated Hospital of Fujian Medical University between January 2020 and May 2025. All participants were referred for evaluation of symptoms suggestive of sleep-disordered breathing, including habitual snoring, witnessed apneas, and excessive daytime sleepiness. A total of 1328 consecutive subjects with complete clinical and laboratory data were included in the final analysis. The inclusion criteria were: (a) age ≥18 years; (b) completion of full-night diagnostic PSG with available apnea-hypopnea index (AHI) measurements; (c) comprehensive baseline clinical and biochemical data, including fasting glucose and lipid profiles; and (d) no prior treatment of OSA, including continuous positive airway pressure therapy or upper airway surgery. The exclusion criteria comprised: (a) acute infection or inflammatory disease within three months preceding enrollment; (b) documented hematologic, hepatic, renal, or thyroid disorders; (c) active malignancy; and (d) missing data essential for calculation of PDW or the TyG index. The final cohort comprised 1328 patients, and the study protocol was approved by the Institutional Ethics Committee of the Second Affiliated Hospital of Fujian Medical University, and written informed consent was obtained from all participants in accordance with the Declaration of Helsinki.
PSG and Diagnostic Criteria
All participants underwent standard overnight full-night attended PSG (Alice 5, Philips Respironics, USA). The monitored parameters encompassed neurophysiological signals (electroencephalogram, electrooculogram, and electromyogram), cardiorespiratory variables (electrocardiogram, nasal-oral airflow, thoracic and abdominal respiratory effort), and peripheral oxygen saturation (SpO2). Apnea was defined as a ≥90% reduction in airflow lasting ≥10 seconds (s), while hypopnea was defined as a ≥30% reduction in airflow lasting ≥10 s accompanied by either ≥3% oxygen desaturation or an electroencephalographic arousal. The AHI was calculated as the total number of apneic and hypopneic events per hour of sleep. OSA was diagnosed in accordance with the American Academy of Sleep Medicine (AASM) criteria, specifically as AHI ≥5 events/h in the presence of typical clinical symptoms (eg, excessive daytime sleepiness, habitual snoring, or witnessed apneas) or associated comorbidities. Based on these criteria, participants were dichotomized into an OSA group (AHI ≥5 events/h) and a non-OSA control group (AHI <5 events/h). The participant selection process is displayed in Figure 1.
 |
Figure 1 Flow diagram of participants selection. |
Data Collection
Demographic characteristics, including age, sex, body mass index (BMI), were systematically recorded alongside lifestyle factors such as smoking status and alcohol consumption. Fasting venous blood samples were collected from all participants within one week preceding the PSG examination. Routine hematologic parameters, including PDW, platelet count, white blood cell (WBC) count, and hemoglobin concentration, were measured using an automated hematology analyzer (Sysmex Corporation, Kobe, Japan). Fasting plasma glucose and triglyceride levels were determined via standard enzymatic methods employing an automated biochemical analyzer (Hitachi, Tokyo, Japan). The TyG index, a surrogate marker of insulin resistance, was calculated as in the following.

Nomogram Development and Validation
All study participants were randomly assigned to a training cohort (70%) and an internal validation cohort (30%) using a computer-generated randomization sequence. Internal validation was further performed using 1000 bootstrap resamples to obtain bias-corrected performance estimates. In the training set, clinically available candidate variables were first evaluated using univariable logistic regression. Variables with potential predictive relevance were then entered into multivariable logistic regression to construct a parsimonious prediction model. To assess the robustness of predictor selection and reduce concerns regarding model instability, least absolute shrinkage and selection operator (LASSO) logistic regression was additionally performed using the “glmnet” package in R. Ten-fold cross-validation was used to determine the optimal penalty parameter, and variables with non-zero coefficients under lambda.min and lambda.1se were summarized as a supplementary variable-selection analysis. The final nomogram was constructed using predictors that were clinically relevant and supported by the multivariable model, with LASSO results presented as a sensitivity analysis rather than as a replacement of the primary model. Discriminative performance was assessed by calculating the area under the receiver operating characteristic curve. Calibration was evaluated graphically through calibration plots comparing predicted probabilities against observed outcomes, supplemented by the Hosmer-Lemeshow goodness-of-fit test.
Statistical Analysis
Continuous variables were presented as mean ± standard deviation (SD) or median (interquartile range), comparisons between groups were conducted using the Student’s t-test or Mann–Whitney U-test, based on data distribution. Categorical variables were presented as frequencies (%) and analyzed using the chi-square or Fisher’s exact test, as appropriate. To identify predictors for the OSA prediction model, univariable and multivariable logistic regression analyses were performed. LASSO logistic regression with ten-fold cross-validation was additionally conducted as a sensitivity analysis for variable selection. The discriminatory ability of individual predictors and the integrated nomogram was evaluated using receiver operating characteristic (ROC) curve analysis. The area under the curve (AUC) was calculated for each model, and pairwise comparisons of AUCs were performed using the DeLong test. A two-tailed P<0.05 was considered statistically significant. All statistical analyses were conducted using R software (version 4.3.2) and SPSS version 25.0 (SPSS Inc., Chicago, IL, USA). The reporting of this study was guided by the TRIPOD statement to improve transparency and completeness.
Results
Baseline Characteristics
A total of 1328 participants were enrolled in the study, with a mean age of 49.2 ± 14.4 years, and the cohort was predominantly male (79.8%). Based on PSG findings, 1210 patients (91.1%) were diagnosed with OSA, defined by an AHI of ≥5 events per hour, while the remaining 118 participants (8.9%) served as the non-OSA control group (AHI <5 events/h). In the training cohort, significant differences were observed between the OSA and non-OSA groups. Patients with OSA were older, had a higher BMI, and demonstrated a higher prevalence of male sex and hypertension (all P<0.05). Laboratory analyses revealed that the OSA group exhibited significantly elevated levels of fasting glucose, triglycerides, WBC count, hemoglobin, PDW, and the TyG index in the training cohort (all P < 0.05). Additional laboratory and inflammation-related indicators, including lymphocyte (LYM), neutrophil (NEU), alanine aminotransferase (ALT), albumin, prognostic nutritional index (PNI), systemic immune-inflammation index (SII), and neutrophil-to-lymphocyte ratio (NLR), are summarized in Supplementary Table S2. The lowest SpO2 during sleep was significantly lower in the OSA group (P<0.001), corroborating the severity of nocturnal hypoxemia associated with the condition. No significant differences were found between the two groups regarding other demographic or clinical characteristics (Table 1). Furthermore, baseline characteristics were well-balanced between the training and validation cohorts, confirming the appropriateness of the dataset split for subsequent model development and internal validation.
 |
Table 1 Baseline Characteristics of Study Participants Stratified by OSA Status |
Variable Selection and Predictors Included in the Nomogram
Univariable logistic regression was initially performed to evaluate candidate variables for OSA prediction. Age, sex, BMI, hypertension, PDW, and the TyG index showed potential predictive relevance and were further considered in multivariable modeling (Table 2). To further examine the robustness of variable selection, LASSO logistic regression was performed as a supplementary analysis. Under the lambda.min criterion, age, sex, BMI, hypertension, WBC, platelet count, PDW, ALT, TyG index, and NLR were retained. Under the more stringent lambda.1se criterion, age, sex, BMI, WBC, PDW, and the TyG index remained selected. Notably, PDW and the TyG index were retained under both criteria, supporting their relevance in the prediction model (Supplementary Table S1 and Supplementary Figure S1).
 |
Table 2 Univariable Logistic Regression Analysis of Candidate Predictors for OSA |
In the multivariable logistic regression model, older age (OR = 1.035, 95% CI: 1.016–1.054, P < 0.001), male sex (OR = 2.990, 95% CI: 1.723–5.189, P < 0.001), higher BMI (OR = 1.240, 95% CI: 1.149–1.339, P < 0.001), elevated PDW (OR = 1.152, 95% CI: 1.025–1.294, P = 0.017), and a higher TyG index (OR = 1.710, 95% CI: 1.107–2.642, P =0.016) were included as predictors in the final nomogram. These findings should be interpreted as exploratory and predictive rather than causal, and they suggest that platelet-related and metabolic markers may provide complementary information for OSA risk stratification. The comprehensive results of both the univariate and multivariate regression analyses are detailed in Table 3.
 |
Table 3 Multivariable Logistic Regression Model for OSA Prediction |
Nomogram Construction and Performance
A diagnostic nomogram incorporating the five predictors including age, sex, BMI, PDW, and the TyG index was developed, as illustrated in Figure 2. Recent evidence has highlighted the TyG index as a reliable surrogate marker of insulin resistance with significant predictive ability for OSA risk and severity, particularly in non-obese populations.17,19 Similarly, PDW has been reported to be associated with OSA and may reflect platelet activation secondary to intermittent hypoxia.20 Each variable in the nomogram was assigned a weighted point value proportional to its regression coefficient, and the cumulative points correspond to an individual’s predicted probability of OSA. The model showed acceptable discriminatory ability in the training cohort, with an AUC of 0.806 (95% CI: 0.750–0.862) (Figure 3A), and its performance was maintained in the internal validation cohort (AUC = 0.751, 95% CI: 0.668–0.834) (Figure 3B). Calibration assessed graphically showed reasonable agreement between predicted probabilities and observed OSA outcomes (Figure 4A and B), further supported by a non-significant Hosmer-Lemeshow goodness-of-fit test (P>0.05), indicating acceptable model calibration.
 |
Figure 2 Obstructive sleep apnea (OSA) risk nomogram. A nomogram incorporating age, sex, body mass index (BMI), platelet distribution width (PDW), and the triglyceride-glucose (TyG) index for estimating OSA risk among adults referred for polysomnography (PSG) evaluation. |
 |
Figure 3 Receiver operating characteristic (ROC) curves for OSA prediction nomogram. The nomogram showed acceptable discriminatory ability in both the (A) training and (B) validation cohorts. |
 |
Figure 4 Calibration curves of the nomogram for OSA probability. The curves illustrate reasonable agreement between the nomogram’s predictions and actual observations in the (A) training and (B) validation cohorts. The 45-degree dashed line represents perfect calibration. |
When evaluated individually, PDW and the TyG index exhibited moderate diagnostic accuracy for OSA, with AUCs of 0.615 and 0.688, respectively. The integrated nomogram showed better discrimination than each individual predictor in this dataset, with an AUC of 0.806 in the training cohort. Pairwise DeLong tests showed statistically significant differences between the nomogram and age (P = 0.0005), sex (P = 0.0002), BMI (P < 0.0001), PDW (P = 0.0317), and the TyG index (P = 0.0031). These findings suggest that combining routine clinical variables with PDW and the TyG index may improve risk stratification within this PSG-referred cohort. Decision curve analysis (DCA) suggested that the nomogram may provide a higher net benefit than PDW or the TyG index alone across selected threshold probabilities in both cohorts (Figure 5A and B). In the validation cohort, the model showed an AUC of 0.751 and generally well-calibrated risk estimates, comparable to those observed in the training cohort. The relatively consistent performance between the training and internal validation cohorts supports the internal stability of the nomogram; however, external validation is still required to determine its generalizability.
 |
Figure 5 Decision curve analysis (DCA) for the OSA prediction nomogram. The nomogram showed a higher net benefit than PDW or the TyG index alone across a range of threshold probabilities in both the (A) training and (B) validation cohorts. |
Discussion
In this single-center retrospective study, we developed and internally validated an exploratory nomogram incorporating conventional clinical variables, PDW, and the TyG index for OSA risk stratification among adults referred for PSG evaluation. The model showed acceptable discrimination and calibration in internal validation. Importantly, this model was not designed to replace PSG or established clinical assessment tools, but rather to provide a preliminary risk-stratification approach in a high-risk referral population. The additional LASSO analysis supported the relevance of PDW and the TyG index, as both markers were retained under the lambda.min and lambda.1se criteria. Given the retrospective and exploratory nature of the study design, these findings should be interpreted as hypothesis-generating, and external validation is required before broader clinical application.
The observed association of PDW and the TyG index with OSA are likely related to overlapping pathophysiological pathways encompassing chronic inflammation, oxidative stress, and metabolic dysregulation.21 Intermittent hypoxia, a hallmark of OSA, may promote platelet activation and endothelial dysfunction through enhanced oxidative stress and sympathetic activation, thereby contributing to higher PDW levels.22–24 Increased PDW reflects greater heterogeneity in platelet volume, a phenomenon associated with prothrombotic and proinflammatory states. Concurrently, insulin resistance, quantified by an elevated TyG index, is exacerbated by hypoxia-reoxygenation cycles that impair glucose metabolism and upregulate proinflammatory cytokines such as tumor necrosis factor-α and interleukin-6.25 The coexistence of platelet activation and metabolic dysfunction may partly explain the complementary predictive information provided by PDW and the TyG index in OSA risk stratification. However, the present retrospective prediction model cannot establish causal or directional relationships among these pathways.
Our findings are consistent with previous investigations reporting associations between platelet indices, metabolic markers, and OSA. Several studies have reported that PDW is higher in patients with OSA relative to healthy controls and correlates positively with AHI severity.26,27 In parallel, elevated TyG index levels have been reported in individuals with OSA independent of obesity, and have been associated with increased cardiometabolic risk.28 Moreover, recent epidemiological evidence from the National Health and Nutrition Examination Survey (NHANES) has reported associations between TyG-related indices and OSA, with TyG-waist circumference demonstrating particular predictive utility.29 However, to the best of our knowledge, no prior study has integrated PDW and the TyG index into a unified prediction model for OSA risk stratification. The present study adds preliminary evidence that combining platelet-related and metabolic markers may improve OSA risk stratification in a PSG-referred population.
A potential advantage of the nomogram is that it uses routinely available clinical and laboratory parameters, including complete blood count, fasting glucose, and lipid profiles. In the current study population, this approach may assist clinicians in stratifying OSA risk among patients already referred for PSG evaluation. However, because the cohort was derived from a tertiary sleep center with a high OSA prevalence, the model should not yet be considered applicable to primary care or general population screening. The incremental value of this nomogram relative to established screening questionnaires, such as STOP-BANG (Snoring, Tiredness, Observed apnea, high blood Pressure, Body mass index, Age, Neck circumference, Gender), NoSAS or Berlin questionnaires, remains to be evaluated in future studies.30 Combined screening strategies integrating multiple questionnaires have been proposed to improve specificity and positive predictive value. Whether the proposed nomogram can achieve comparable or superior performance to these established tools requires direct head-to-head comparison in prospective cohorts.
Nevertheless, several limitations should be considered when interpreting these findings. First, the retrospective single-center design and the high OSA prevalence (91.1%) reflect the intended PSG-referred population but may restrict generalizability to primary care or community settings. External validation in prospective multicenter cohorts is therefore needed. Second, while LASSO regression supported the robustness of variable selection, the exploratory nomogram does not establish causal relationships. Future prospective or mechanistic studies would be better suited to address causal pathways and its predictive performance requires confirmation in independent samples. Third, several clinically relevant variables, including neck circumference, detailed symptom profiles, and Epworth Sleepiness Scale, were unavailable. These gaps represent directions for future studies and evaluation across distinct AHI strata.
Conclusion
In this exploratory retrospective study, we developed and internally validated a nomogram incorporating age, sex, BMI, PDW, and the TyG index for OSA risk stratification among adults referred for PSG evaluation. The supplementary LASSO analysis further supported the inclusion of PDW and the TyG index as candidate predictors. The model showed acceptable internal performance, but it should be regarded as a preliminary risk-stratification tool rather than a replacement for PSG or established screening questionnaires. External validation in multicenter prospective cohorts, ideally with comparison against tools such as STOP-BANG, is required before broader clinical implementation.
Abbreviations
OSA, obstructive sleep apnea; PSG, polysomnography; PDW, platelet distribution width; TyG, triglyceride-glucose; AUC, area under the curve; SpO2, peripheral oxygen saturation; AASM, American Academy of Sleep Medicine; BMI, body mass index; WBC; white blood cell; SD; standard deviation; ROC, receiver operating characteristic; NHANES, National Health and Nutrition Examination Survey; LYM, lymphocyte; NEU, neutrophil; ALT, alanine aminotransferase; albumin; PNI, prognostic nutritional index; SII, systemic immune-inflammation index; NLR, neutrophil-to-lymphocyte ratio; STOP-BANG (Snoring, Tiredness, Observed apnea, high blood Pressure, Body mass index, Age, Neck circumference, Gender).
Data Sharing Statement
The data that support the findings of this study are available from the corresponding author, Xiaoyang Chen, upon reasonable request. Email: [email protected]
Author Contributions
Liyong Shi: Conceptualization, Formal analysis, Funding acquisition, Investigation, Methodology, Visualization, Writing-original draft, Writing-review and editing; Lianshun Lin: Data curation, Funding acquisition, Formal analysis, Visualization, Writing-original draft, Writing-review and editing; Tanwei Liu: Data curation, Formal analysis, Visualization, Writing-original draft, Writing-review and editing; Xiali Wang: Data curation, Formal analysis, Investigation, Writing-review and editing; Jing Cheng: Data curation, Investigation, Writing-review and editing; Miaoxiang Chen: Data curation, Investigation, Writing-review and editing; Qidong Chen: Data curation, Formal analysis, Writing-review and editing; Fanbin Zhong: Data curation, Formal analysis, Writing-review and editing; Linlin Chen: Conceptualization, Methodology, Supervision, Writing-review and editing; Xiaoyang Chen: Conceptualization, Methodology, Funding acquisition, Project administration, Supervision, Writing-review and editing. All authors have read and approved the final article. All authors took part in drafting, revising or critically reviewing the article; gave final approval of the version to be published; have agreed on the journal to which the article has been submitted; and agree to be accountable for all aspects of the work.
Funding
This work was supported by Joint Funds for the Innovation of Science and Technology, Fujian Province (No. 2023Y9262 and 2025Y9421); Quanzhou City Science & Technology Program of China (No. 2025QZNY080); Youth Research Project of Fujian Provincial Health Commission (No. 2025GGB023); Doctoral Supervisor Research Foundation Project of the Second Affiliated Hospital of Fujian Medical University (No. 2026GCC07); Startup Fund for Scientific Research, Fujian Medical University (No. 2023QH1135).
Disclosure
The authors report no conflicts of interest in this work.
References
1. Li L, Long T, Liu Y, et al. Abnormal dynamic functional connectivity and topological properties of cerebellar network in male obstructive sleep apnea. CNS Neurosci Ther. 2024;30(6):e14786. doi:10.1111/cns.14786
2. Jia S, Fu Y, Wu Y, et al. Association between visceral fat area and heart rate variability in high altitude migrants with OSA: the mediating effect of insulin resistance. Lipids Health Dis. 2025;24(1):253. doi:10.1186/s12944-025-02626-2
3. Zhou B, Wang Y, Wang Y, Zhang J, Zhang Q, Hu K. Sex-specific associations between obstructive sleep apnea and thyroid hormone sensitivity in euthyroid adults. Biol Sex Differ. 2026;17(1):23. doi:10.1186/s13293-025-00821-5
4. Benjafield AV, Ayas NT, Eastwood PR, et al. Estimation of the global prevalence and burden of obstructive sleep apnoea: a literature-based analysis. Lancet Respir Med. 2019;7(8):687–12. doi:10.1016/S2213-2600(19)30198-5
5. Lu D, Xu S, Dai P, Wu L, Zhang H, Zhou B. Gut microbiota in hypertensive patients with versus without obstructive sleep apnea. J Clin Hypertens. 2022;24(12):1598–1605. doi:10.1111/jch.14598
6. Feng X, Zhang Y, Shi Y, et al. Clinical characteristics of obstructive sleep apnoea patients with residual sleepiness. ERJ Open Res. 2025;11(2):00682–2024. doi:10.1183/23120541.00682-2024
7. Jafari M, Samieirad S, Goharian RK, Grillo R. Evaluation of the incidence of obstructive sleep apnea in mandibular fracture patients before and after treatment with the STOP-BANG questionnaire. Med Oral Patol Oral Cir Bucal. 2025;30(5):e642–e648. doi:10.4317/medoral.27047
8. Wang J, Xu J, Ma J, et al. Wearable sensors for monitoring abnormalities in sleep-related breathing. ACS Appl Mater Interfaces. 2026;18(2):3425–3453. doi:10.1021/acsami.5c22504
9. Jameie M, Bayat M, Akbarpour S, et al. The no-apnea score for early obstructive sleep apnea detection in a sleep clinic: a study of diagnostic accuracy and comparative performance of three screening instruments. Sci Rep. 2025;15(1):41729. doi:10.1038/s41598-025-16694-y
10. Gölen MK, Işık ŞM, Arıkan V. Is there a relationship between the severity of obstructive sleep apnea syndrome and the systemic immune inflammation index. Eur Arch Otorhinolaryngol. 2024;281(9):5007–5013. doi:10.1007/s00405-024-08729-3
11. Kovbasyuk Z, Ramos-Cejudo J, Parekh A, et al. Obstructive sleep apnea, platelet aggregation, and cardiovascular risk. J Am Heart Assoc. 2024;13(15):e034079. doi:10.1161/JAHA.123.034079
12. Suša R, Ratinac M, Ćupurdija V, et al. Implementation of the baveno classification in obstructive sleep apnea and its correlation with symptoms of anxiety and depression. Medicina. 2023;59(11):1938. doi:10.3390/medicina59111938
13. Meng RT, Chen QW, Ko CY. Evaluating cystatin-C and monocyte-to-high-density lipoprotein cholesterol ratio as indicators of obstructive sleep apnea severity in male patients. Front Cardiovasc Med. 2025;12:1545100. doi:10.3389/fcvm.2025.1545100
14. Zhong ZH, Liang L, Fu TW, et al. Prognostic value of platelet distribution width to lymphocyte ratio in patients with hepatocellular carcinoma following hepatectomy. BMC Cancer. 2023;23(1):1116. doi:10.1186/s12885-023-11621-8
15. Su Y, Xu X, Luo Z, et al. Association between perioperative platelet distribution width changes and postoperative acute kidney injury in patients with renal insufficiency: a retrospective study. BMC Nephrol. 2024;25(1):393. doi:10.1186/s12882-024-03802-9
16. Sun C, Niu XL, Zeng LX. The association between triglyceride glucose-body mass index and mortality in critically ill patients with respiratory failure: insights from ICU data. Sci Rep. 2025;15(1):16153. doi:10.1038/s41598-025-00254-5
17. Tae H, Kim TS. Elevated triglyceride-glucose index, a surrogate marker of insulin resistance, is associated with a high risk of obstructive sleep apnea. Sci Rep. 2025;15(1):22222. doi:10.1038/s41598-025-05268-7
18. Wang C, Shi M, Lin C, Wang J, Xie L, Li Y. Association between the triglyceride glucose index and obstructive sleep apnea and its symptoms: results from the NHANES. Lipids Health Dis. 2024;23(1):133. doi:10.1186/s12944-024-02125-w
19. Liu Q, Zhang Y, Chen S, et al. Association of the triglyceride-glucose index with all-cause and cardiovascular mortality in patients with cardiometabolic syndrome: a national cohort study. Cardiovasc Diabetol. 2024;23(1):80. doi:10.1186/s12933-024-02152-y
20. Di Lorenzo B, Scala C, Mangoni AA, et al. A systematic review and meta-analysis of mean platelet volume and platelet distribution width in patients with obstructive sleep apnoea syndrome. Biomedicines. 2024;12(2):270. doi:10.3390/biomedicines12020270
21. Zhang H, Lei S, Zhuo H, Xu Y, Ye Y, Luo Y. TRIM24 up-regulates ORM2 to alleviate abnormal lipid metabolism, inflammation, and oxidative stress in mice with obstructive sleep apnea syndrome and metabolic dysfunction-associated steatotic liver disease. Am J Pathol. 2024;194(11):2091–2105. doi:10.1016/j.ajpath.2024.07.020
22. Qayyum NT, Cole AT, Khayat RN, Grosberg A. Improving the cardiovascular outcomes of obstructive sleep apnea: towards more precise hypoxia-based models of disease severity. Curr Sleep Med Rep. 2025;11(1):
23. Song R, Baker TL, Watters JJ, Kumar S. Obstructive sleep apnea-associated intermittent hypoxia-induced immune responses in males, pregnancies, and offspring. Int J Mol Sci. 2024;25(3). doi:10.3390/ijms25031852
24. Davidson BL, Schryver N. Pulmonary embolism prophylaxis and treatment: what’s right, what’s wrong, and the future. Chin Med J Pulm Crit Care Med. 2025;3(1):1–5. doi:10.1016/j.pccm.2025.02.003
25. Fan Y, Ye D, Zhou K, Cai L, Yu L. The novel triglyceride‒glucose-weighted adjusted waist index as a supplementary diagnostic tool for heart failure: evidence of improved reclassification beyond traditional TyG-related indices from a cross-sectional study. Cardiovasc Diabetol. 2025;24(1):329. doi:10.1186/s12933-025-02896-1
26. Akyol Gurses A, Akyildiz UO. Predictive value of red cell distribution width for overlap syndrome in obstructive sleep apnea. Front Neurol. 2024;15:1415410. doi:10.3389/fneur.2024.1415410
27. Nena E, Papanas N, Steiropoulos P, et al. Mean platelet volume and platelet distribution width in non-diabetic subjects with obstructive sleep apnoea syndrome: new indices of severity. Platelets. 2012;23(6):447–454. doi:10.3109/09537104.2011.632031
28. Wang L, Dai L, Wang X, Guo J, Huang R, Xiao Y. The association between triglyceride glucose index and the risk of cardiovascular disease in obstructive sleep apnea. Sleep Breath. 2024;29(1):31. doi:10.1007/s11325-024-03220-z
29. Zhou Y, Xue F. Exploring the association between triglyceride-glucose indices and their derivatives with obstructive sleep apnea: insights from the national health and nutrition examination survey. Nat Sci Sleep. 2025;17:143–155. doi:10.2147/NSS.S487596
30. Bailer M, Stein EM, Sprügel MI, et al. Portable polygraphic device (Somnocheck micro CARDIO(®)) provides accurate diagnostic information in psychiatric patients at risk for obstructive sleep apnoea: an observational cohort study. BMC Psychiatry. 2024;24(1):607. doi:10.1186/s12888-024-06049-8
 © 2026 The Author(s). This work is published and licensed by Dove Medical Press Limited. The
full terms of this license are available at https://www.dovepress.com/terms
and incorporate the Creative Commons Attribution
- Non Commercial (unported, 4.0) License.
By accessing the work you hereby accept the Terms. Non-commercial uses of the work are permitted
without any further permission from Dove Medical Press Limited, provided the work is properly
attributed. For permission for commercial use of this work, please see paragraphs 4.2 and 5 of our Terms.
© 2026 The Author(s). This work is published and licensed by Dove Medical Press Limited. The
full terms of this license are available at https://www.dovepress.com/terms
and incorporate the Creative Commons Attribution
- Non Commercial (unported, 4.0) License.
By accessing the work you hereby accept the Terms. Non-commercial uses of the work are permitted
without any further permission from Dove Medical Press Limited, provided the work is properly
attributed. For permission for commercial use of this work, please see paragraphs 4.2 and 5 of our Terms.
Recommended articles
Development and Validation of a Nomogram for Predicting Risk of Emergency Department Revisits in Chinese Older Patients
Fan L, Xue H, Wang Q, Yan Y, Du W
Risk Management and Healthcare Policy 2022, 15:2283-2295
Published Date: 6 December 2022
Increased Platelet Distribution Width Predicts 3-Year Recurrence in Patients with Hepatocellular Carcinoma After Surgical Resection
Li H, Liu J, Yan S, Rao C, Wang L
Cancer Management and Research 2023, 15:501-509
Published Date: 14 June 2023
Exploring the Association Between Triglyceride-Glucose Indices and Their Derivatives With Obstructive Sleep Apnea: Insights From the National Health and Nutrition Examination Survey
Zhou Y, Xue F
Nature and Science of Sleep 2025, 17:143-155
Published Date: 23 January 2025
Construction and Validation of a Nomogram Model for Predicting Pulmonary Hypertension in Patients with Obstructive Sleep Apnea
Zhang R, Liu Z, Li R, Ai L, Li Y
Nature and Science of Sleep 2025, 17:1049-1066
Published Date: 24 May 2025
Development of a Risk Prediction Model for Preoperative Pre-Frailty in Elderly Patients with Gastric Cancer
Yin C, Yin M, Zhen J, Xue C, Zhu Z
Clinical Interventions in Aging 2025, 20:2763-2772
Published Date: 28 December 2025