Back to Journals » International Journal of Women's Health » Volume 18
Development and Validation of a Multi-Omics Model Integrating US-Derived and WSI-Based Features to Predict Lymph Node Metastasis in Ovarian Cancer: A Multi-Center Retrospective Study
Authors Yan G ![]() , Wu X, Zhao P, Zhou F, Xu S, Yao M, Ji Y, Li J, Feng Q, Zhao L
, Wu X, Zhao P, Zhou F, Xu S, Yao M, Ji Y, Li J, Feng Q, Zhao L ![]() , Du H
, Du H
Received 10 March 2026
Accepted for publication 8 June 2026
Published 16 June 2026 Volume 2026:18 608124
DOI https://doi.org/10.2147/IJWH.S608124
Checked for plagiarism Yes
Review by Single anonymous peer review
Peer reviewer comments 2
Editor who approved publication: Professor Wangshu Li
Ge Yan,1,* Xiujuan Wu,2,* Peiting Zhao,3 Feng Zhou,1 Shaoze Xu,1 Mengqian Yao,3 Yiyang Ji,3 Jiahui Li,3 Qiong Feng,1 Lin Zhao,1 Hua Du4,5
1State Key Laboratory of Radiation Medicine and Protection, School of Radiation Medicine and Protection, Collaborative Innovation Center of Radiological Medicine of Jiangsu Higher Education Institutions, Soochow University, Suzhou, 215000, People’s Republic of China; 2Department of Ultrasound Diagnosis, Affiliated Hospital of Inner Mongolia Medical University, Hohhot, 010000, People’s Republic of China; 3School of Clinical Medicine, Soochow University, Suzhou, 215000, People’s Republic of China; 4Department of Pathology, Basic Medical College, Inner Mongolia Medical University, Hohhot, 010000, People’s Republic of China; 5Department of Pathology, Affiliated Hospital of Inner Mongolia Medical University, Hohhot, 010000, People’s Republic of China
*These authors contributed equally to this work
Correspondence: Lin Zhao, State Key Laboratory of Radiation Medicine and Protection, School of Radiation Medicine and Protection, Collaborative Innovation Center of Radiological Medicine of Jiangsu Higher Education Institutions, Soochow University, Suzhou, 215000, People’s Republic of China, Email [email protected] Hua Du, Department of Pathology, Basic Medical College, Inner Mongolia Medical University, Hohhot, 010000, People’s Republic of China, Email [email protected]
Objective: The study aims to develop and validate a multi-omics model based on preoperative ultrasound (US) imaging results, intraoperative H&E- stained slides, and clinical features to predict lymph node metastasis (LNM) before lymph node dissection (LND) in ovarian cancer (OC) patients.
Methods: We analyzed 157 OC patients undergoing LND with definitive pathological confirmation of LNM status, comprising 91 patients in the training cohort, 38 in the internal validation cohort, and 28 in the external test cohort. US images were processed with PyRadiomics to extract radiomics features, while pathological WSIs were processed with deep learning (DL) algorithms and multi-instance learning(MIL) algorithms to extract pathomics features. Then, radiomics and pathomics models were developed using support vector machines (SVMs), logistic regression (LR), and extreme gradient boosting (XGBoost) after dimensionality reduction and feature selection. To create a powerful multi-omics model, clinical features were incorporated into the optimal radiomics and pathomics features. Performance of models was assessed by accuracy, AUC, 95% CI, sensitivity, specificity, PPV and NPV.
Results: A total of 11 features were used to build radiomics models out of a selection of 1561 radiomics features. The SVM_rad model demonstrated superior predictive performance (AUC: training=0.816, validation=0.760, test=0.775). In parallel, pathomics models were built using a refined set of 3 features selected from the original 206 pathomics features. Among these, the SVM_path model showed the highest predictive efficiency (AUC: training=0.983, validation=0.817, test=0.813). The multi-omics model showed the greatest discriminative power (AUC: training=0.988; validation=0.923; test cohort=0.862). The quality of the prediction model was demonstrated by the DeLong test, calibration curves, and decision curve analysis, which verified its high discrimination, calibration, and clinical usefulness.
Conclusion: The study’s findings indicate that the multi-omics model integrating the tumor-level radiological data, cellular-level pathological information, and patient-level clinical features can predict LNM before LND in OC and support rational treatment plans.
Keywords: ovarian cancer, lymph node metastasis, multi-omics, radiomics, pathomics, deep learning
Introduction
Ovarian cancer (OC) is the cancer with the greatest mortality of all the gynecological malignancies.1 It became the eighth most common diagnosis in the world in 2020, with about 314,000 incidences annually, and the eighth leading cause of mortality, with more than 207,000 deaths attributed to the disease that year.2 Despite advances in the management of diseases, especially in their surgical treatment and maintenance therapy, OC patients still have a 5-year survival rate below 50% in most countries.3 Besides, ovarian cancer patients experience considerable psychological distress due to uncertainties about treatment as well as fears of metastasis and recurrence.4
In gynecological cancer, a significant route of metastasis is the gynecological lymphatic system, and the most common lymph nodes (other than the vulvar cancer lymph nodes) involved are the parietal (retroperitoneal) and visceral abdominopelvic lymph nodes.5 The National Comprehensive Cancer Network guideline recommends placing special emphasis on resecting enlarged or suspicious lymph nodes identified on preoperative imaging or intraoperatively.6 However, it has been extensively debated whether lymph node dissection (LND) should be used on patients with OC. Viveros-Carreño et al have reported that the LNM in patients with low-grade stage I–II OC was observed in 12.6%.7 A number of studies have shown that systematic LND is not beneficial, with no difference in the progression or overall survival and increased rates of complications.8,9 Moreover, the use of a traditional radical LND can not be supported in OC patients who have a low LNM risk and a favorable prognosis. From these, it is clear that LNM is a critical prognostic factor and significantly influences treatment planning. Consequently, clinicians should review the patient’s conditions and surgical indications to accurately determine whether a patient has LNM and whether the LND is needed. Yet, this is difficult because the disease is heterogeneous, and traditional models fail to handle high-dimensional, imbalanced data.10
At present, the sensitivity of CT (43–50%) and MRI (55–60%) for detecting LNM in gynecological cancer is not much higher.11 At the same time, MRI is restricted by the large equipment and high cost, and CT is restricted by radiation exposure. Ultrasonography is a cheap and non-invasive process, which does not expose patients to any risk of radiation, and is comparatively simple to carry out. While conventional ultrasound has limitation in the direct visualization of nodal morphology, transvaginal sonography (TVS) has a good diagnostic performance for the detection of pelvic LNM in patients with gynecological cancer, specifically in cases of cervical, ovarian, and endometrial malignancy.12 And with the utilization of radiomics, the diagnostic value extends beyond mere nodal morphology to encompass the phenotypic heterogeneity of the primary ovarian tumor. Recent studies has demonstrated that incorporating radiomic features extracted from primary tumor ultrasound images could significantly improve the prediction of lymph node status in OC,13,14 compensating for the shortcomings of conventional ultrasound in direct nodal imaging. However, while ultrasound radiomics has been widely applied in liver, thyroid, and breast cancers,15–17 its application in OC remains limited. Most existing studies focus on differential diagnosis and preoperative staging,18,19 with only a few addressing LNM prediction.13,14
Frozen-section diagnosis accuracy in the intraoperative assessment of ovarian masses is critical for the surgeon’s choice of operative procedures.20 At present, visual observation remains the primary means of obtaining information from pathological sections. As high-throughput processing technology for medical images is developed and the high-dimensional data generated is widely explored and analyzed, the term pathomics is gaining increasing interest. Pathomics quantifies characteristics of data obtained from digital pathology images, providing information on the tumor microenvironment.21 Recent studies have dealt with cancer risk gradation, prognostication, and prediction of adjuvant chemotherapy effect.22 Although pathomics has been applied to LNM in cancers such as gastric, colorectal, and thyroid,23–25 its research in OC remains confined to the exploration of prognostic biomarkers.26 Therefore, it is of great clinical and translational importance to conduct systematic pathomics studies focused on LNM in OC.
Deep learning, which can quantify phenotypes in high dimensions undetectable to the human eye and construct specialized predictive models for different clinical cases, is a non-invasive system for prognostic assessment,27 disease diagnostics,28 and treatment decision-making.29 This approach has also been extended to integrate multimodal data—including radiomics, pathomics, and clinical or genomic features—to build more accurate prognostic and predictive models.30 Despite these advances, there is a notable lack of robust evidence demonstrating the feasibility and clinical utility of deep learning models for the prediction of LNM in OC.
Given this critical need for accurate prediction of LNM before LND in OC, this study aims to develop and validate a multi-omics model that integrates clinical data, preoperative US imaging data, and intraoperative pathological data acquired before LND to predict LNM status precisely before the dissection commences. Beyond conventional machine learning, we employed DL and MIL techniques to extract and aggregate discriminative pathomics features from WSIs, which were subsequently integrated with radiomics features within a multi-omics framework to improve LNM prediction. By capturing complementary information at both microscopic and macroscopic levels in vivo, we anticipate that this multi-omics model will offer a scientifically robust basis to assist clinicians in personalizing surgical planning and therapeutic strategies, ultimately improving patient outcomes and quality of life.
Materials and Methods
Patient Population
This study consecutively enrolled 206 patients with OC who had operative procedures between January 2020 and August 2025 in two hospitals (the Affiliated Hospital of Inner Mongolia Medical University and Inner Mongolia People’s Hospital). The inclusion criteria were as follows: (1) Patients who have pathological confirmation of ovarian cancer based on intraoperative tumor specimens; (2) Patients whose pathological H&E-stained tissue slides are stored as whole slide images (WSIs); (3) Patients who underwent transvaginal or transrectal sonography scan examination and serum tumour biomarker examination prior to operation; (4) Patients who underwent LND with definitive histopathological results confirming the presence or absence of LNM. The exclusion criteria included the following: (1) Adnexal or pelvic mass that may not be of ovarian origin; (2) Low-quality ultrasound pictures or pathological pictures that were not suitable for further analysis; (3) Incomplete clinical baseline data or treatment response records; (4) Lack of LND specimens or definitive nodal pathological confirmation. The ultimate study population involved 157 eligible patients.
In this study, we randomly selected a cohort of 129 patients from the Affiliated Hospital of Inner Mongolia Medical University and separated them into a training (n=91) and internal validation (n=38) cohort at a ratio of 7:3. All hyperparameters were optimized solely within the training cohort using a 5-fold cross-validation grid search. The optimal parameter configurations were then fixed and applied to the training cohort for model development. Given the use of multiple machine learning algorithms, model selection was guided by performance on the validation cohort. The cohort from the Inner Mongolia People’s Hospital (n=28) was used as an independent test cohort to evaluate generalizability and to ensure a robust assessment of model performance. Figure 1 presents the flowchart for selecting patients for the study.
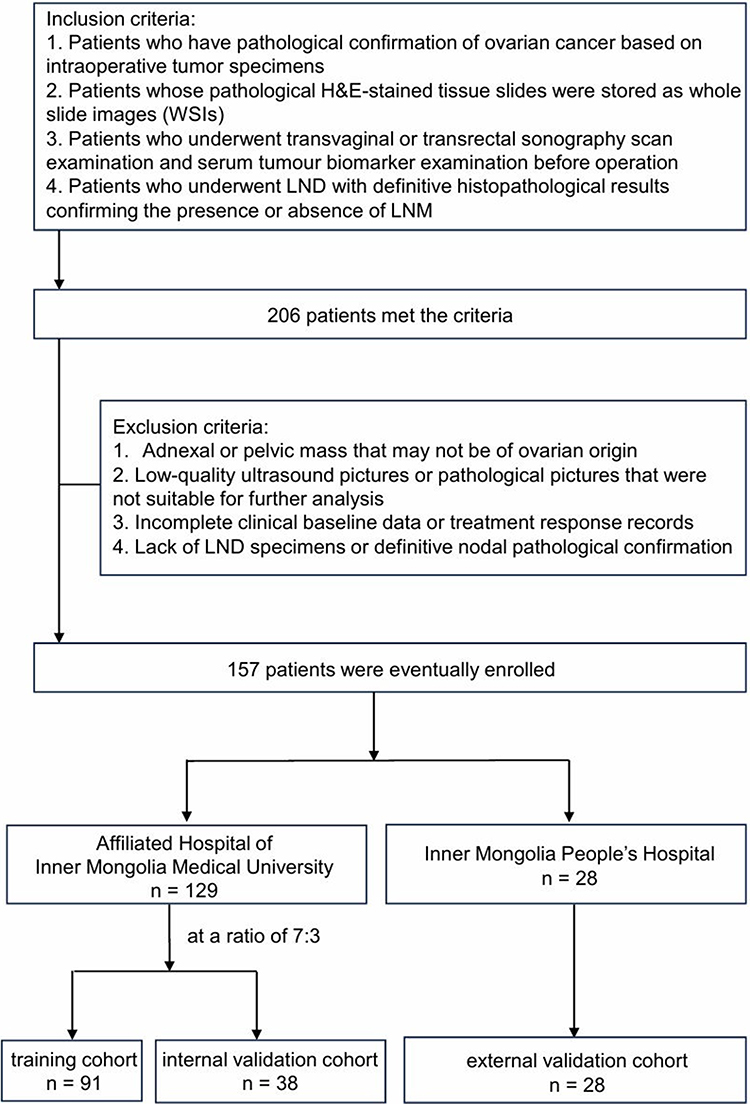 |
Figure 1 Flowchart for selecting the study patients. A total of 206 patients with ovarian cancer (OC) were initially screened between January 2020 and August 2025 from two institutions (Affiliated Hospital of Inner Mongolia Medical University and Inner Mongolia People’s Hospital). Patients were excluded if they had non‑ovarian adnexal masses, low‑quality imaging or pathological slides, or incomplete clinical data. Ultimately, 157 patients with confirmed lymph node dissection (LND) and pathological lymph node metastasis (LNM) status were included and randomly split into a training cohort (n = 91) and an internal validation cohort (n = 38) at a 7:3 ratio. An independent external test cohort (n = 28) from a second institution was used to evaluate model generalizability. |
Clinic Model Construction
The clinical information of OC patients involved: general information, hospital records (the age of patients, menopausal stage), diagnosis details (pelvic fluid, lateral, peritoneal thickening, pelvic wall nodules, maximum diameter of the masses), surgical and histopathological findings (whether LND was performed and whether LNM is present), and immunohistochemical staining. Clinically relevant variables were identified through univariate and multivariate analyses, with features achieving p<0.05 retained for the clinical model.
Image Acquisition
The US analyses of adnexal masses in the ovary were conducted using Mindray Resona 8 (China), Philips EPIQ 5 (Netherlands), GE Voluson E8 (USA), and GE Voluson E10 (USA) in our study. Transvaginal sonography (TVS) was a choice, with trans-abdominal ultrasonography being applied in the case of no sexual history in the patient, as well as in the case of a huge mass. In a multiple-mass situation, the most complex mass was analysed. All the pictures were retrieved from Picture Archiving and Communication Systems and were in JPEG format.
Pathological data were extracted from H&E-stained WSIs. Crucially, to support an applicable approach before the availability of LND results, the source slides were derived exclusively from intraoperative tumor resection specimens obtained prior to LND. Formalin-fixed paraffin embedding was performed subsequently, but the tissue source itself predated the knowledge of nodal status. WSIs were collected using panoramic digital image-scanning technology (KF-PRO-005-EX, Ningbo Konfoong Bioinformation Tech Co., Ltd.) at 20x magnification to produce 0.25-pixel resolution digital pathological images for the extraction of pathological features.
Image Segmentation
The ultrasound images were converted to NII format to facilitate subsequent ROIs delineation. Regions of interest (ROIs) were defined to encompass the entire target lesion while strictly avoiding adjacent normal tissues and acoustic shadowing artifacts. Two independent investigators, blinded to the classification outcomes, manually delineated the ROIs using ITK-SNAP (Version 3.8.0, USA).
The obtained digital pathology images were in KFB format and had to be transduced to TIF or SVS format to continue with further standardization of QuPath.31 To ensure the accuracy of feature extraction, regions of interest (ROIs) were meticulously annotated on WSIs. The ROIs were defined to encompass the entire viable tumor area, excluding normal ovarian stroma, necrotic tissues, hemorrhage, and artifacts. Only regions with tumor cellularity ≥60% were included to ensure representativeness. Morphological and texture features extracted from these ROIs were subsequently used for pathomics model development and interpretation. The annotation process was conducted by two independent observers (with 5 and 3 years of experience in gynecological pathology, respectively), who reviewed the entire digital WSI at ×40 magnification and were blinded to the patients’ clinical outcomes and LNM status. During preprocessing, color normalization was applied via the Onekey AI platform to standardize staining intensities across slides from different batches, thereby minimizing technical variations.
In cases of disagreement regarding the tumor boundary, a consensus was reached through adjudication by a senior radiologist or pathologist with over 20 years of clinical experience, ensuring high accuracy in ROI definition. Furthermore, to monitor the robustness and stability of the radiomics and pathomics pipeline, intra- and inter-observer reproducibility was evaluated using the intraclass correlation coefficient (ICC), which was calculated based on repeated annotations of 30 randomly selected WSIs with a 2-week interval. Only features with an ICC > 0.75 were retained for subsequent analysis, ensuring high consistency between annotators.
Radiomics Feature Extraction and Selection
Radiomic features were systematically derived from the intratumoral region, including geometric, intensity-based, and texture-related features. Geometric features quantified tumor morphology, intensity features captured voxel-wise signal characteristics, and texture features were derived using established matrices, including gray-level size-zone matrix (GLSZM), gray-level run-length matrix (GLRLM), gray-level co-occurrence matrix (GLCM), and neighboring gray-tone difference matrix (NGTDM). Feature extraction was performed for the entire volume of interest (VOI) as well as for each predefined subregion. All features were generated using PyRadiomics (version 3.0.1) in accordance with Imaging Biomarker Standardization Initiative (IBSI) guidelines.
A multi-stage feature selection strategy was applied to enhance robustness and reduce redundancy. Initially, features significantly associated with the outcome were identified using statistical testing with a threshold of p < 0.05. To address multicollinearity, Pearson correlation analysis was conducted, and one feature from each highly correlated pair (|r| > 0.9) was removed. Subsequently, the minimum redundancy maximum relevance (mRMR) algorithm was employed to balance feature relevance and redundancy, retaining the top 16 most informative features. Further refinement of the feature set was performed using the least absolute shrinkage and selection operator (LASSO) regression. The best regularization parameter (λ) was identified through 10-fold cross-validation, resulting in a small and very predictive subset of features to be used later in modeling.
Radiomics Model Construction
Machine learning models were developed using the LASSO-selected features to generate radiomics-based predictive signatures. Hyperparameters were optimized using grid search with five-fold cross-validation. Logistic regression (LR) and support vector machine (SVM) were employed to model linear decision boundaries, while eXtreme gradient boosting (XGBoost) classifiers were used to capture complex nonlinear feature interactions, together forming the radiomics signature.
Pathomics Feature Extraction and Selection
A hierarchical framework combining patch-level inference with MIL was adopted to obtain WSI-level representations. During this supervised training, each patch inherited the corresponding patient-level label.
For patch-level prediction, to overcome the disadvantages of the large image size, we first divided each WSI into non-overlapping 512×512 pixel patches at 20× magnification while preserving critical histopathological information. Patches containing predominantly background regions were excluded, retaining only diagnostically relevant tissue. All preprocessing steps were implemented on the Onekey AI platform, including WSI tiling (OKT-crop_WSI2patch), background filtering (OKT-patch2predict), and color normalization (OKT-patch_normalize), ensuring standardized processing across samples. Then, feature extraction was performed using Inception_v3, DenseNet121, and ResNet18 architectures, leveraging their complementary representational capacities. Detailed network configurations are provided in Supplementary Note 1.
Following patch-level prediction, probability scores were generated for each patch. These probabilities were subsequently aggregated using MIL classifiers, including Patch Likelihood Histogram (PLH) and Bag of Words (BoW) pipelines for WSI-level prediction. Specifically, the PLH method employed a histogram to depict the spread of patch likelihoods over the entire WSI, which can address issues of polysemy and synonymy and achieve more accurate classification.32 While the BoW technique characterized the WSI by converting each patch into a Term Frequency-Inverse Document Frequency (TF-IDF) score and subsequently generating a composite TF-IDF feature vector.33 Additional methodological details are provided in Supplementary Note 2.
Pathomics Model Construction
The pathology signature was constructed using a strategy analogous to that of radiomics. Patch-level predictions, probability histograms, and TF-IDF–weighted representations were integrated into a unified feature set for training WSI-level machine-learning models (LR, SVM, and XGBoost). To ensure cross-modality consistency, the same MIL-based fusion strategy was applied for both pathology and imaging signatures, facilitating coherent multimodal integration.
Multi-Omics Integration and Comparison
To establish the integrated multi-omics model, clinical features selected via univariate and stepwise multivariate analyses (p<0.05) were combined with radiomics and pathomics MIL-derived signatures. This comprehensive fusion strategy enabled synergistic integration of imaging, pathological, and clinical information, thereby enhancing the discriminative capability and robustness of the final combined model.
Receiver operating characteristic (ROC) curve analysis with area under the curve (AUC) was used to evaluate model performance. The DeLong test was used to assess discrimination performance. Calibration curves were produced to provide comparisons of predicted probabilities and actual findings, and model reliability was also evaluated through the Hosmer-Lemeshow test. To assess clinical utility, decision curve analysis (DCA) was performed to quantify net benefit across a range of probability thresholds, which demonstrates the potential clinical usefulness of the proposed models.
The comprehensive workflow of the radiomics, pathomics, and multi-omics models in this study is presented in Figure 2, which illustrates their significant potential to improve predictive accuracy in medical imaging.
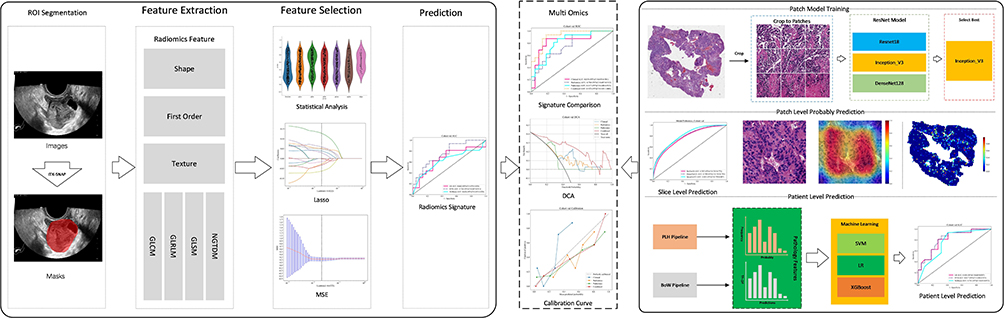 |
Figure 2 Comprehensive workflow of this study. Preoperative US and intraoperative H&E-stained WSIs of OC patients were retrospectively collected. Radiomics models based on LR, SVM, and XGBoost were constructed after feature extraction and selection. Pathomics machine-learning models at the patient level are obtained by integrating predictions from all image patches generated by deep learning algorithms. The multi-omics model combining features from the best-performing radiomics and pathomics models, along with clinical information, was constructed. The performance of unimodal and multi-omics models in predicting LNM before LND in OC was validated and compared. |
Rationale for Model Training
The predictive task of this study is based on the biological premise that the phenotypic heterogeneity of the primary ovarian tumor encodes its metastatic potential. We utilized these LNM labels (positive vs. negative) not to train a model to recognize lymph nodes, but to learn the intrinsic differences in texture, vascularity, and cellular architecture between tumors that have metastasized and those that have not. The models establish the predictive relationship between the primary tumor phenotype and its biological behavior. Model performance metrics including accuracy, AUC, 95% CI, sensitivity, specificity, positive predictive value (PPV) and negative predictive value (NPV) were calculated based on the confusion matrix by comparing predicted probabilities against this LND-derived pathological ground truth.
Handling of Missing Data
Among the 157 patients included, baseline demographic and imaging data were completely recorded. For serum tumor markers (AFP, CA125, HE4, CA199, and CEA), missing rates were below 2%. These missing values were imputed using the median value of the respective training, validation, or test cohort to ensure dataset completeness for multivariable analysis.
Determination of Optimal Threshold
To transform continuous predicted probabilities into binary classifications (LNM positive vs. negative), the optimal cut-off value was determined using Youden’s J statistic (Sensitivity + Specificity – 1). This maximizes the balance between true positive and true negative rates. Additionally, to evaluate the clinical safety of the model, we also calculated the sensitivity at a fixed high specificity (≥ 0.95).
Overfitting Mitigation Strategies
To mitigate the risk of overfitting inherent in high‑dimensional radiomics and pathomics analyses relative to the sample size, we implemented a rigorous multi‑stage prevention strategy. Initially, feature dimensionality was reduced through LASSO regression coupled with 10‑fold cross‑validation, which shrank redundant coefficients to zero. Hyperparameter optimization for all machine learning models, including SVM, LR, and XGBoost, was conducted exclusively within the training cohort using a nested 5‑fold cross‑validation grid search; the resulting optimal parameters were fixed prior to any evaluation of the validation or test cohorts. In the pathomics pipeline, deep learning feature extraction was integrated with MIL aggregation algorithms, which inherently regularize the model by focusing on distributional patterns rather than memorizing individual patch characteristics. Finally, the model’s ability to generalize was stringently assessed using an independent temporal external test cohort from a different hospital, serving as the ultimate guard against overfitting to the specific data distribution of the training set.
Statistical Analysis
Normality of continuous variables was assessed using the Shapiro–Wilk test. Continuous variables were compared under Student’s t-test or Mann–Whitney U-test, depending on data distribution, whereas categorical variables were compared under chi-square (χ2) tests. A P < 0.05 was considered a significant statistical difference.
All the analyses were performed on the OnekeyAI platform (version 3.5.12) using Python 3.7.12. The statistical calculations were done using Statsmodels (version 0.13.2), radiomics feature extraction was done with PyRadiomics (version 3.0.1), and machine-learning modeling, including support vector machines using Scikit-learn (version 1.0.2).
Results
Baseline Characteristics of the Study Cohorts
To ensure the reliability of statistical analysis, we explicitly reported the number of LNM-positive cases across all cohorts. In the training cohort (n=91), 37 patients (40.7%) were confirmed to have LNM. In the internal validation cohort (n=38), 16 patients (42.1%) were LNM-positive. In the external test cohort (n=28), 8 patients (28.6%) were LNM-positive. Although the test cohort exhibited a lower prevalence of LNM compared to the training set, this distribution reflects the real-world clinical spectrum and was accounted for during model evaluation.
Clinical Features
A comprehensive univariate and multivariate analysis was performed for all clinical variables, and odds ratios (ORs) with corresponding p-values were calculated for each feature. Comparison of the three cohorts revealed no significant differences in age, menopausal status, maximum tumor diameter, pelvic fluid, laterality, or peritoneal thickening. Variables demonstrating statistical significance (p < 0.05), including CA-125 and pelvic wall nodules, were retained and incorporated into multivariate analyses as key clinical covariates for subsequent modeling. The univariable and multivariable analyses of clinical features are summarized in Table 1. The baseline clinical characteristics across all cohorts (Supplementary Table S1), along with the performance and ROC curves of different clinical machine learning models (Supplementary Table S2 and Supplementary Figure S1) provide more details on the clinical features.
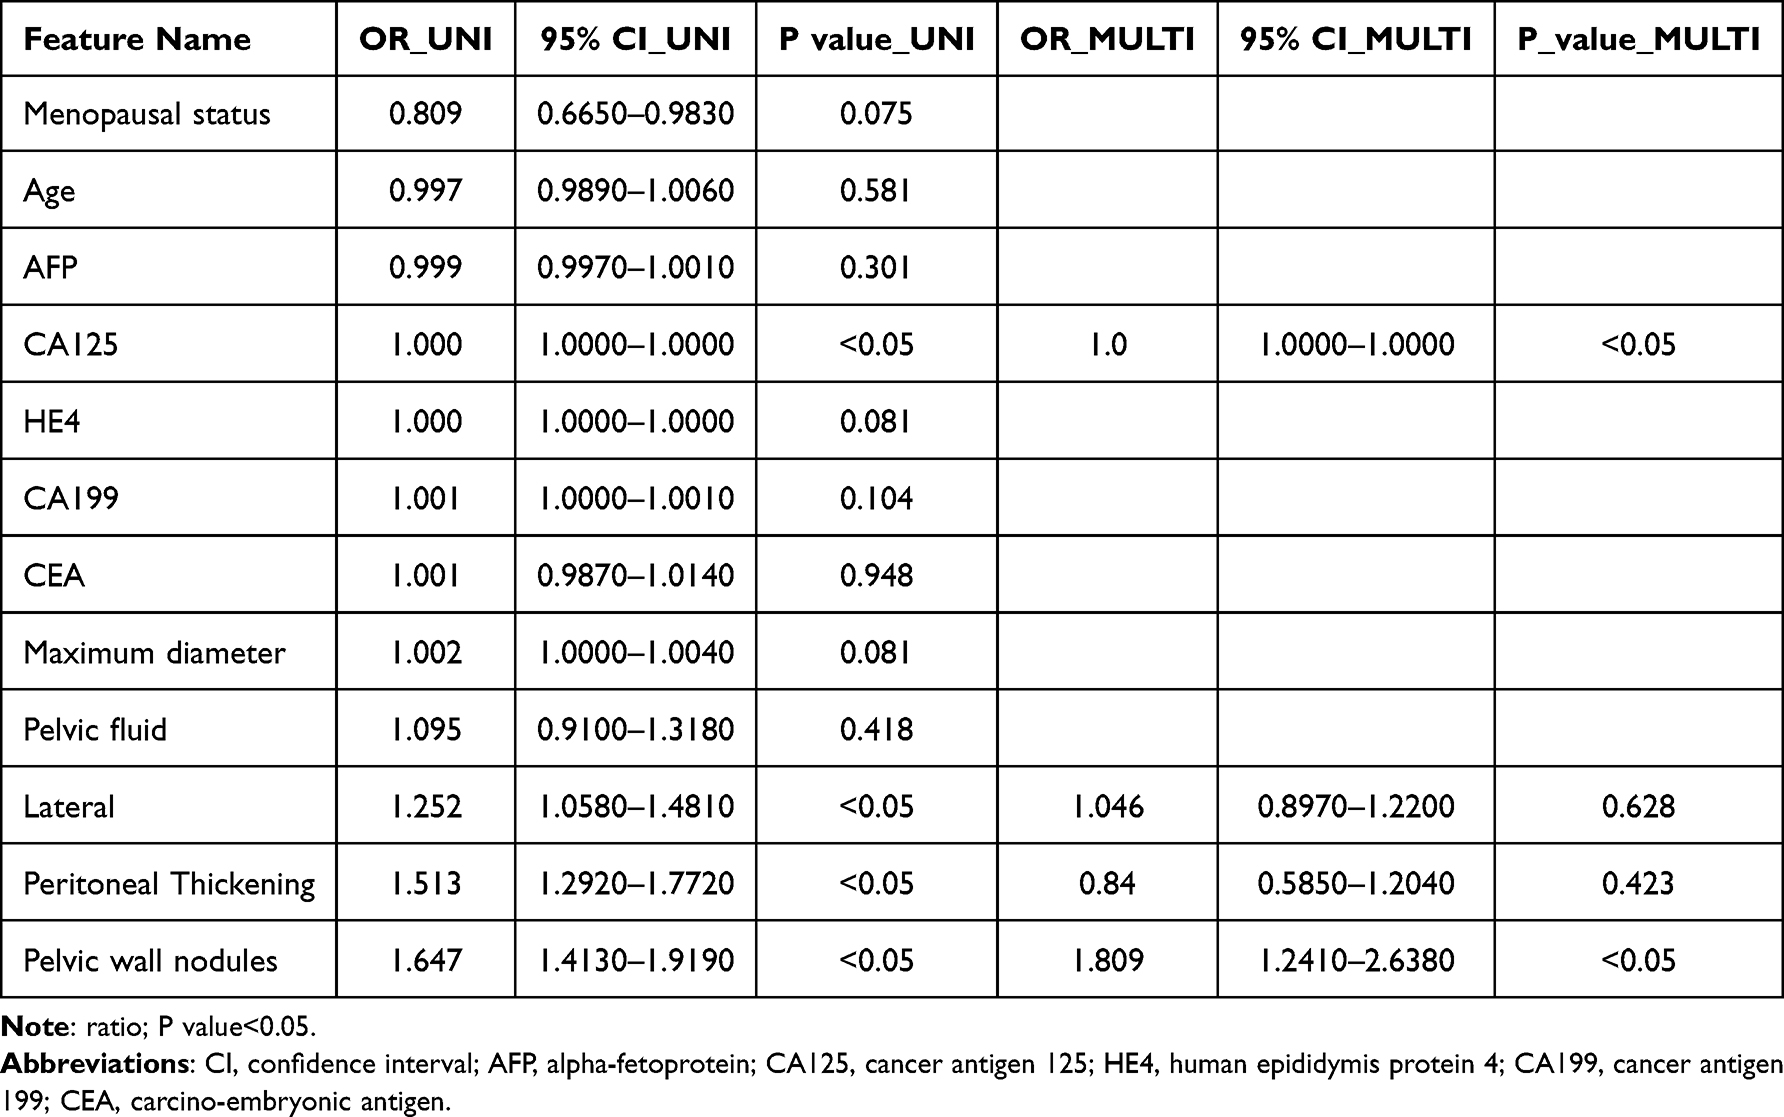 |
Table 1 Univariable and Multivariable Analysis of Clinical Features |
Radiomics Feature Selection and Model Construction
In this study, 1,561 radiomic features were obtained and divided into shape-, first-order-, and texture-based radiomic features. 14 shape features and 306 first-order intensity features were identified, complemented by a comprehensive set of texture features capturing spatial heterogeneity patterns. All feature extraction procedures were implemented using a custom-developed pipeline built upon the PyRadiomics framework. Detailed methodological specifications are available in the PyRadiomics documentation. The proportional distribution of different feature categories (Supplementary Figure S2) is illustrated in a dedicated figure, providing an intuitive overview of feature composition across the dataset.
Then we used the Least Absolute Shrinkage and Selection Operator (LASSO) feature-selection technique with a LASSO logistic regression model to select nonzero coefficients for the Rad-score. Figure 3 visualizes these coefficients, alongside the Mean Standard Error (MSE) obtained from a 10-fold cross-validation procedure.
 |
Figure 3 Least Absolute Shrinkage and Selection Operator (LASSO) logistic regression for radiomics feature selection in the training cohort. (a) LASSO coefficient profiles of the 1,561 radiomic features. Features with non-zero coefficients at the optimal λ (indicated by the vertical dashed line) were retained for model construction. (b) Ten-fold cross-validation for tuning the regularization parameter (λ). The optimal λ value (arrows) was selected to minimize the deviance while maintaining model simplicity. (c) Bar chart illustrating the relative importance weights of the 11 finalized radiomic features selected by LASSO. Features are ordered by absolute coefficient magnitude. Shape-based features are represented in blue, first-order intensity features in Orange, and texture-based features in grey. |
We used the 11 non-zero-coefficient radiomic features to create three radiological models: LR_rad, SVM_rad, and XGBoost_rad. To evaluate the model’s performance, Table 2 presents metrics for the training, validation, and test cohorts, and Figure 4 shows the ROC curves. In the training cohort, the AUC of the SVM_rad model is 0.816, and the accuracy is 0.758, indicating strong baseline discrimination performance. In the validation cohort, SVM_rad achieved the highest AUC (0.760) and the highest sensitivity (0.937) compared to LR_rad (0.662) and XGBoost_rad (0.626), although its specificity was reduced (0.500). In the independent test cohort, the AUC of SVM-rad is 0.775, and the sensitivity and specificity are both 0.750, indicating stable generalisation. In contrast, the AUC of LR_rad decreased significantly from training (0.842) to validation (0.662) and testing (0.619), while XGBoost_rad showed strong training performance (AUC=0.845), but weaker performance in validation (0.626) and testing (0.731). These results show variability across models and cohorts.
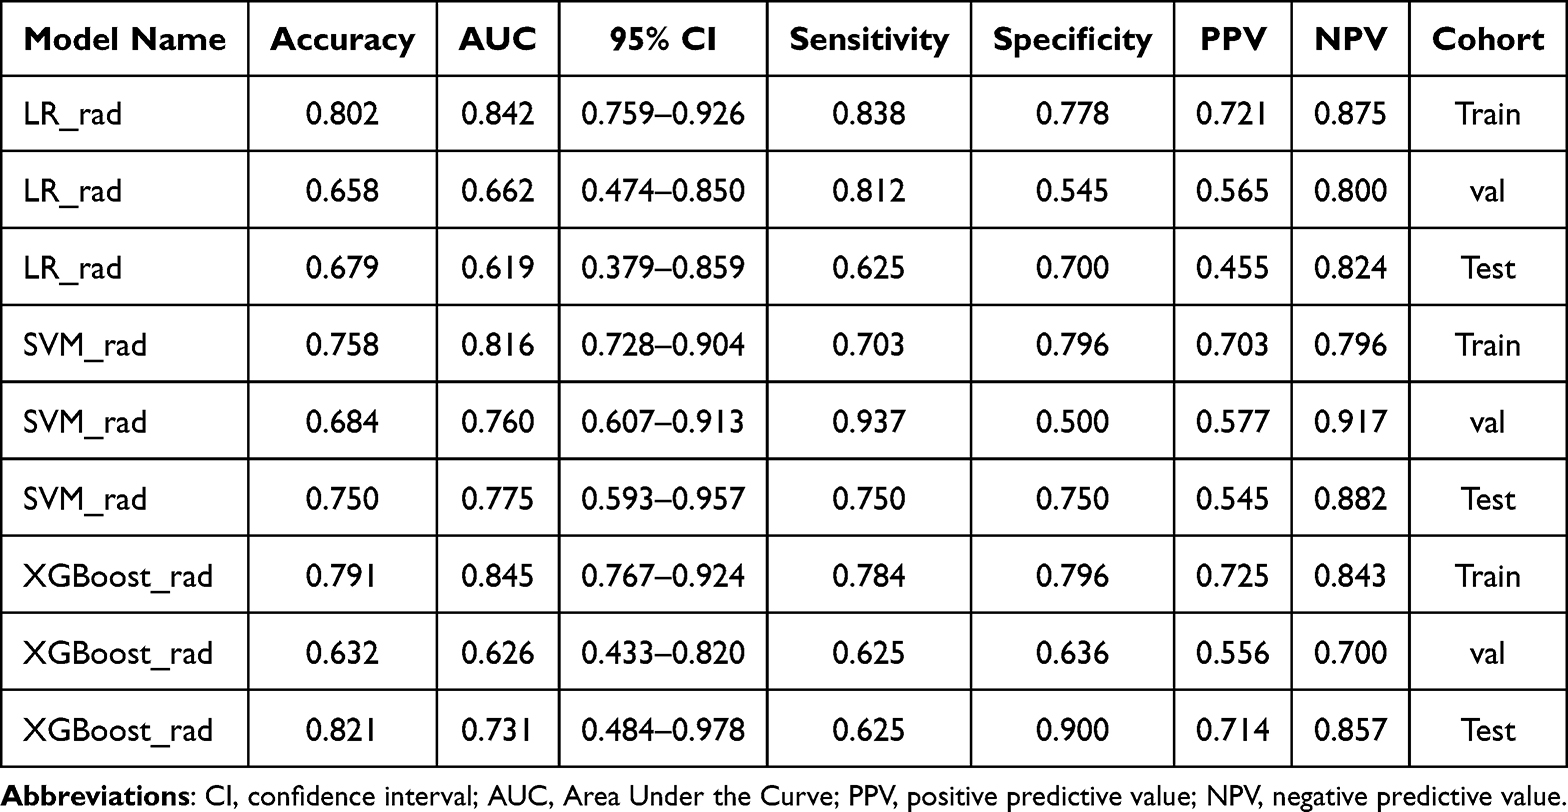 |
Table 2 Performance of Different Radiomics Machine Learning Models in Each Cohort |
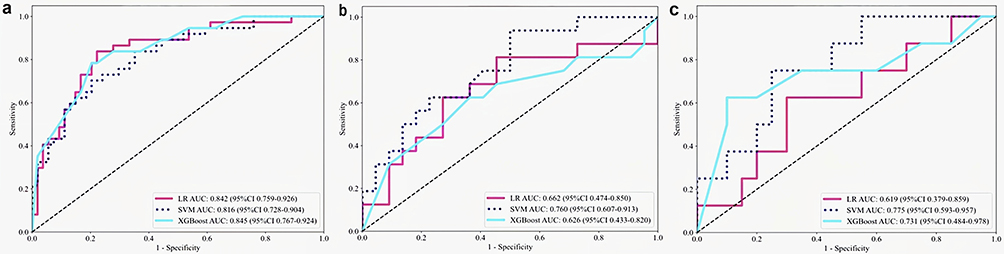 |
Figure 4 ROC curves of radiomics models across cohorts. Receiver operating characteristic (ROC) curves comparing logistic regression (LR_rad), support vector machine (SVM_rad), and XGBoost (XGBoost_rad) models in (a) training, (b) internal validation, and (c) external test cohorts. AUC values are presented with 95% confidence intervals (CIs). The SVM_rad model achieved the most stable performance across all cohorts, with AUCs of 0.816 (training), 0.760 (validation), and 0.775 (test). |
Overall, the SVM_rad model demonstrated the most consistent and robust performance across all cohorts, with superior generalizability and balanced discrimination. These findings suggest that SVM_rad is better suited to capturing the complex feature patterns inherent in ultrasound radiomic data than linear or tree-based approaches, supporting its selection as the optimal model for subsequent analyses.
Pathomics Feature Selection and Model Construction
The performance of ResNet-18, DenseNet-121, and Inception-v3 models for patch-level prediction is presented in Table 3 and Figure 5. In the training cohort, Inception v3 achieved the highest accuracy (0.922) and AUC (0.979; 95% CI: 0.9788–0.9800), together with well-balanced sensitivity (0.927) and specificity (0.918). In the validation cohort, it maintained a superior AUC of 0.803 compared with ResNet18 (0.767) and DenseNet121 (0.789), while showing a favorable balance between sensitivity (0.779) and specificity (0.644). Notably, in the independent test cohort, Inception v3 yielded the highest AUC (0.809; 95% CI: 0.7986–0.8201) among all models, accompanied by markedly high sensitivity (0.912) and the largest Youden index (0.501), indicating improved overall discriminative ability. In contrast, ResNet18 and DenseNet121 exhibited more pronounced performance degradation from training to validation and test cohorts, with lower AUCs and reduced balance between sensitivity and specificity.
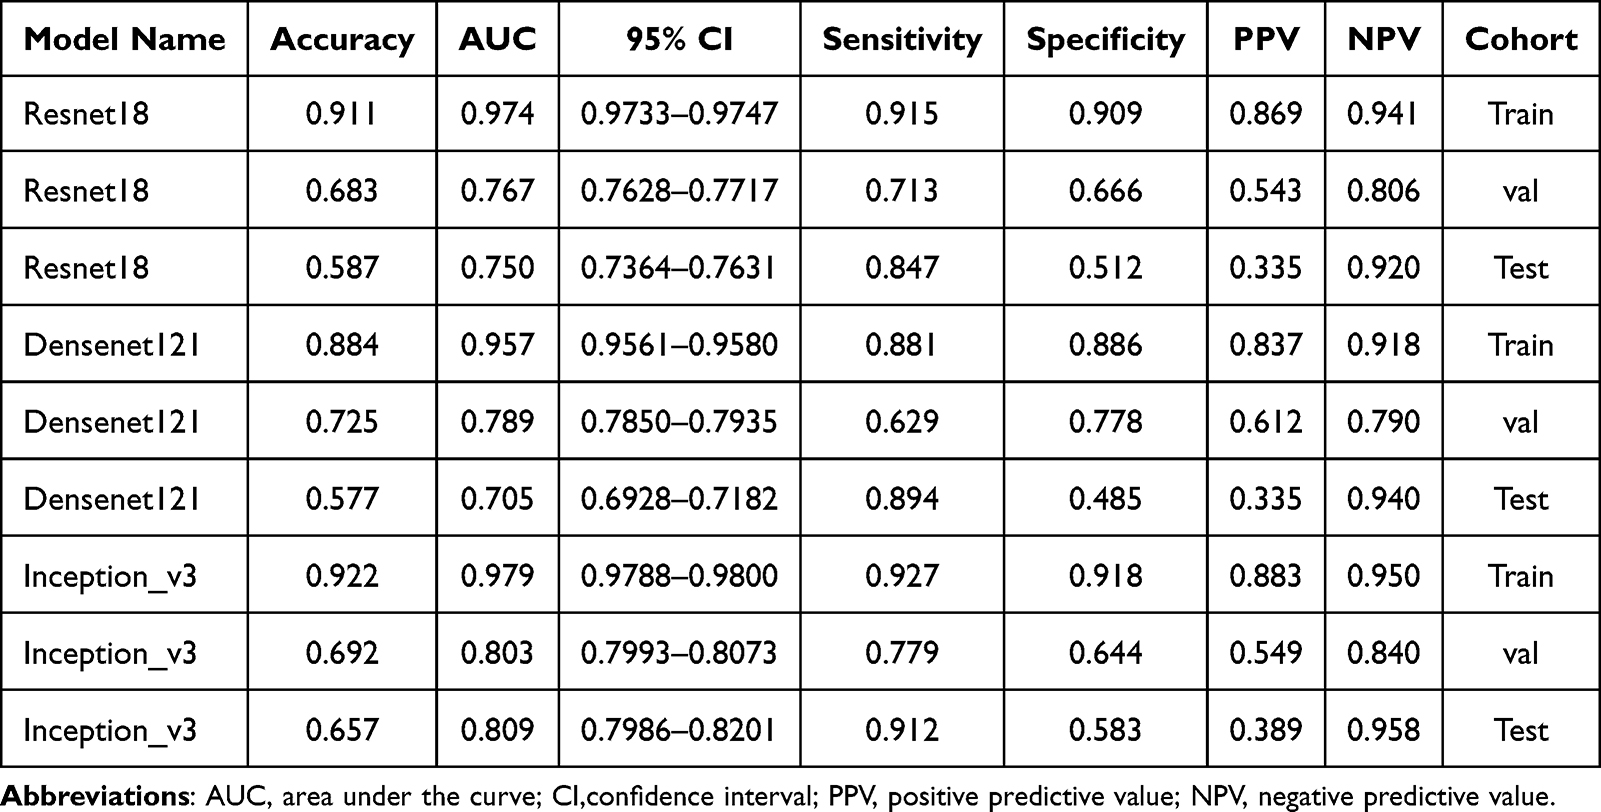 |
Table 3 Metrics of Different DL Models in Perdition Patch Level Results |
 |
Figure 5 ROC in patch-level prediction of different CNN models Bar plots summarizing accuracy, AUC, sensitivity, and specificity for ResNet‑18, DenseNet‑121, and Inception‑v3 models evaluated on patch‑level predictions within the (a) training, (b) internal validation, and (c) external test cohorts. Inception‑v3 demonstrated the highest and most balanced performance, particularly in the external test cohort (AUC = 0.809, sensitivity = 0.912), and was therefore selected as the backbone for downstream WSI‑level aggregation. |
Overall, Inception v3 demonstrated the most robust and generalizable patch-level performance for pathology data, consistently outperforming ResNet18 and DenseNet121 across cohorts. Inception V3 is the most representative CNN in the Inception Family, which contains fewer parameters than other classical CNNs, but greatly accelerates computational speed, reduces the risk of overfitting, and further improves network recognition accuracy.34 In our study, the superior AUC, higher sensitivity, and more favorable Youden index in the test cohort indicate its stronger ability to capture discriminative histopathological patterns. Consequently, Inception v3 was selected as the backbone model for downstream pathology analysis and subsequent MIL based aggregation.
Gradient-Weighted Class Activation Mapping (Grad-CAM) is a model-specific method of visualization and interpretation of DL models.35 In this experiment, Grad-CAM uses the gradient of the final convolutional layer to generate a category-positioning map, effectively visualising the spatial information of a specific category without modifying or retraining the network, as shown in Figure 6. Using gradients of the target class score with reference to the final convolutional layer, Grad-CAM can determine important neurons that affect predictions. This visual interpretation ability is critical for identifying areas of interest and for building confidence in subsequent decision-making.36
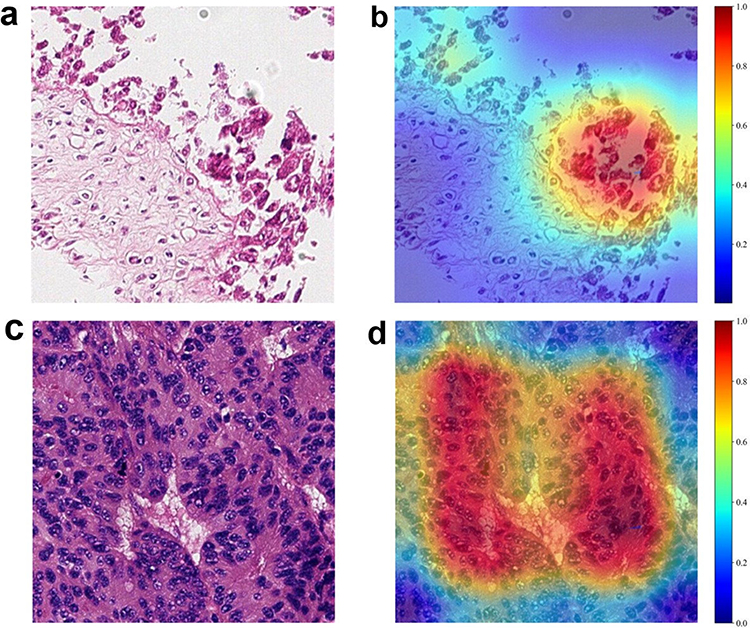 |
Figure 6 Representative Grad‑CAM visualizations for WSI patches. (a–c) Original H&E‑stained WSI patches from representative patients. (b, d) Corresponding Grad‑CAM heatmaps overlaid on original patches, indicating regions with the highest contribution to model prediction. Red–yellow hues denote higher activation (greater influence on prediction), whereas blue–green hues indicate minimal contribution. The model consistently highlighted tumor‑rich areas with high cellularity and architectural complexity. |
Then, patch-level prediction probability scores were subsequently aggregated through the MIL classifier, which included PLH and BoW to produce WSI-level predictions. Finally, we extract 206 features, with the BoW and PLH methods contributing 103 features each. After the same framework as the radiomics model for feature selection, hyperparameter optimization, and classifier selection, the t-Distributed Stochastic Neighbor Embedding (t-SNE) algorithm was applied to visualize pathomic features, revealing a clear distinction among the distributions (Figure 7).
 |
Figure 7 Pathological features visualized by t-SNE. Two‑dimensional t‑distributed stochastic neighbor embedding (t‑SNE) projection of 206 pathomics features derived from PLH and BoW pipelines, color‑coded by LNM status (blue = LNM negative; red = LNM positive). Clear separation between classes indicates effective dimensionality reduction and feature discrimination at the WSI level. |
For WSI-level prediction, Table 4 and Figure 8 show the performance of three pathomics machine learning models across cohorts. In the training cohort, LR_path and XGBoost_path achieved balanced accuracy, sensitivity, specificity, and respective AUC of 0.988 and 0.982. The SVM_path model demonstrated excellent discrimination, yielding an AUC of 0.983 and specificity of 1.000. In the validation cohort, SVM_path maintained a competitive AUC of 0.817, higher than XGBoost_path (0.761) and comparable to LR_path (0.808), and again exhibited complete specificity with no false-positive predictions. In the independent test cohort, SVM_path achieved the highest AUC (0.813; 95% CI: 0.623–1.000) among all cohorts, outperforming LR_path (0.725) and XGBoost_path (0.638), and maintaining a consistent specificity of 1.000. However, when applying the default probability threshold of 0.5, or the Youden-index-optimized threshold, the classification behavior of SVM_path across three cohorts was characterized by zero sensitivity. This suggests that while the model is highly confident in ruling in high-risk cases, it fails to identify a substantial portion of patients with LNM at this threshold. This limitation must be considered when interpreting its clinical utility.
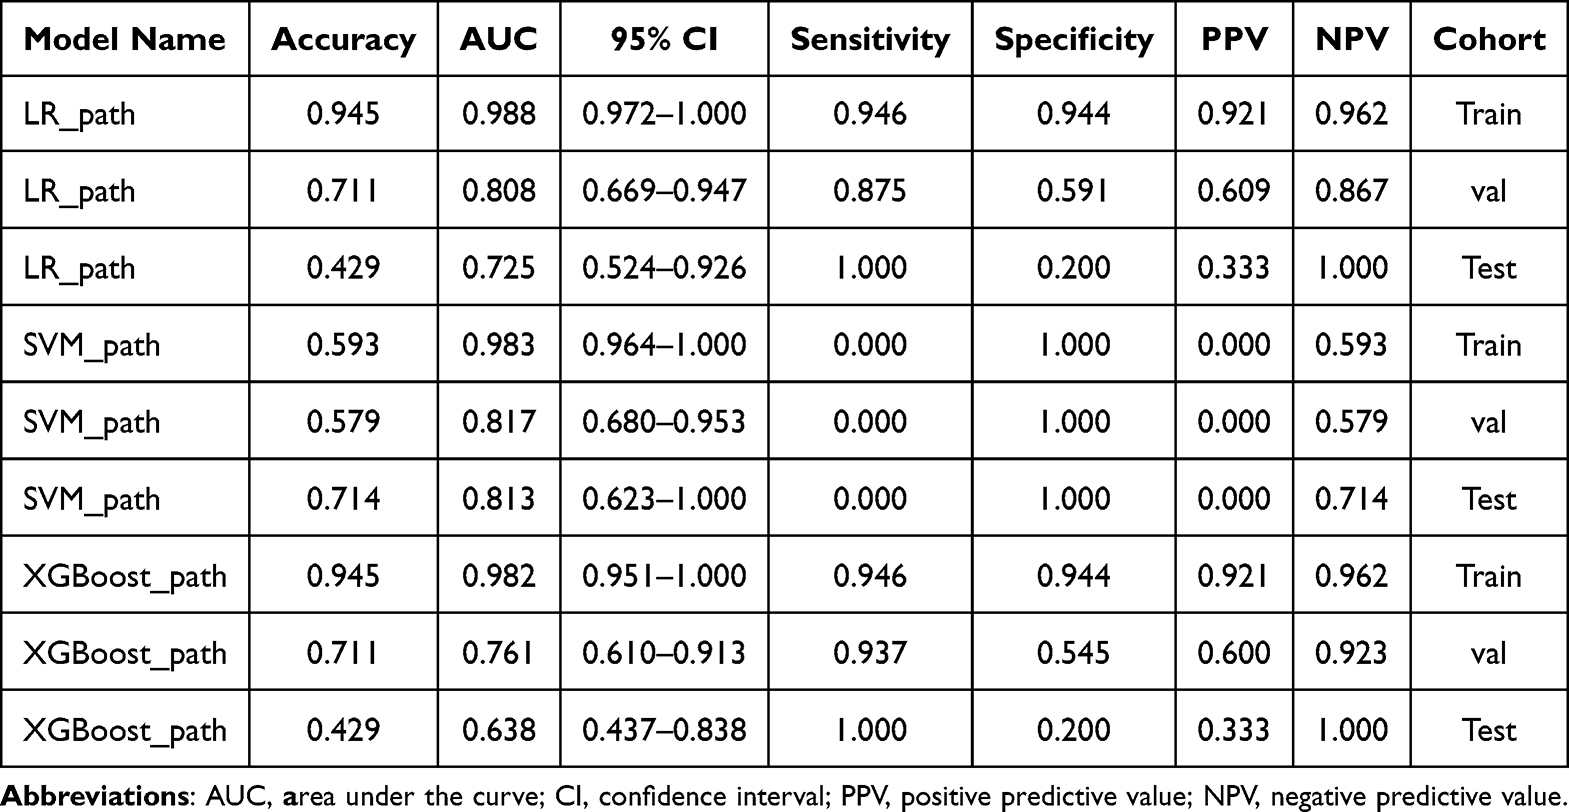 |
Table 4 Performance of Pathomics Machine Learning Models |
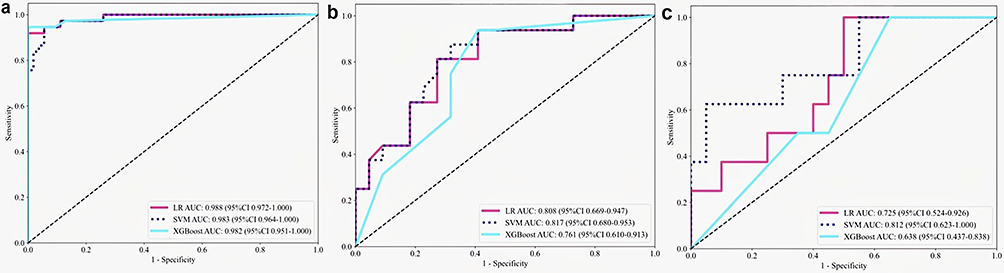 |
Figure 8 ROC in WSI-level prediction of different pathomics models. ROC curves comparing LR_path, SVM_path, and XGBoost_path models in (a) training, (b) internal validation, and (c) external test cohorts. AUC values with 95% CIs are shown. SVM_path achieved the most robust discriminative performance, with AUCs of 0.983 (training), 0.817 (validation), and 0.813 (test), albeit with reduced sensitivity at the selected probability threshold. |
Overall, despite lower sensitivity at the chosen decision threshold, the SVM_path model demonstrated the most robust and generalizable discriminative ability at the WSI-level, as reflected by its consistently high AUC across validation and test cohorts. These findings reflected the theoretical capacity of SVM_path to exclude low-risk individuals if the threshold is appropriately adjusted, indicated its superior ranking performance in pathology-based WSI-level prediction, and supported its selection as the optimal model for downstream analyses.
Figure 9 shows representative visualisation prediction results for two patients, highlighting the model’s ability to accurately identify and classify patches across the entire WSI. The effectiveness and spatial consistency enhance the interpretability and clinical utility of the model’s predictions. This demonstrates that the integration of DL for patch-level feature extraction with MIL for WSI-level aggregation provides a robust computational framework, significantly advancing pathomics beyond handcrafted features.
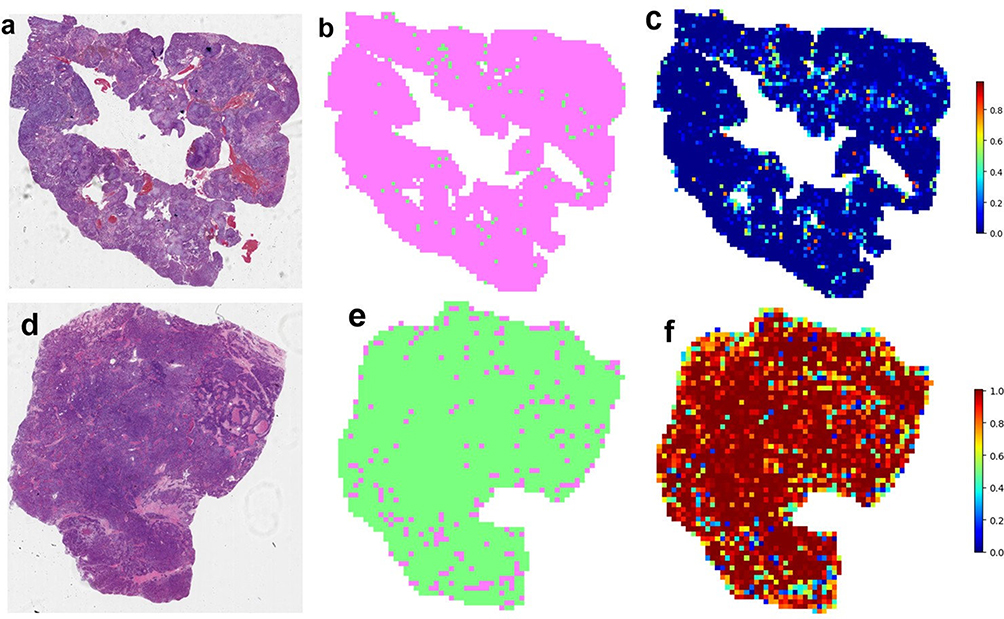 |
Figure 9 Patch-level prediction results for two representative sample categories. Whole-slide images from two representative patients are shown with overlaid patch-level prediction probabilities. The model spatially localized high-risk regions concordant with histopathological tumor distribution, demonstrating consistency between patch-level inference and WSI-level aggregation. (a–d) Hematoxylin and eosin (H&E) stained whole-slide images (WSIs) from two representative patient samples. (b, e) Spatial segmentation maps corresponding to the tissue regions in (a) and (d), respectively. (c, f) Heatmaps overlaid on the segmentation maps showing patch-level prediction probabilities for LNM, where warmer colors indicate a higher predicted probability. |
Multi-Omics Integration and Comparison
A combination of radiomics, pathomics, clinical, and MIL-derived features was used to create the multi-omics nomogram (Figure 10). The prediction performance of different models is shown in Table 5 and Figure 11. In the training cohort, the pathomics model demonstrated substantially superior performance compared with both the radiomics and clinical models, achieving an accuracy of 0.945 and an AUC of 0.983 (95% CI: 0.9637–1.0000), whereas the radiomics model yielded an AUC of 0.816 and the clinical model an AUC of 0.853. The multi-omics model further improved predictive performance, reaching the highest accuracy (0.956) and AUC (0.988; 95% CI: 0.9734–1.0000), with balanced sensitivity (0.973) and specificity (0.944). In the validation cohort, the pathomics model continued to outperform the radiomics model (AUC: 0.817 vs. 0.760), indicating a clear advantage of pathology-based features over imaging features alone. Notably, the multi-omics model achieved the best overall performance in the validation cohort, with an AUC of 0.923 and an accuracy of 0.868, alongside improved sensitivity (0.937) and specificity (0.818). In the independent test cohort, the pathomics model (AUC: 0.813) again demonstrated higher discrimination than the radiomics model (AUC: 0.775), while the multi-omics model yielded the highest AUC (0.862) and perfect sensitivity (1.000), indicating enhanced generalization.
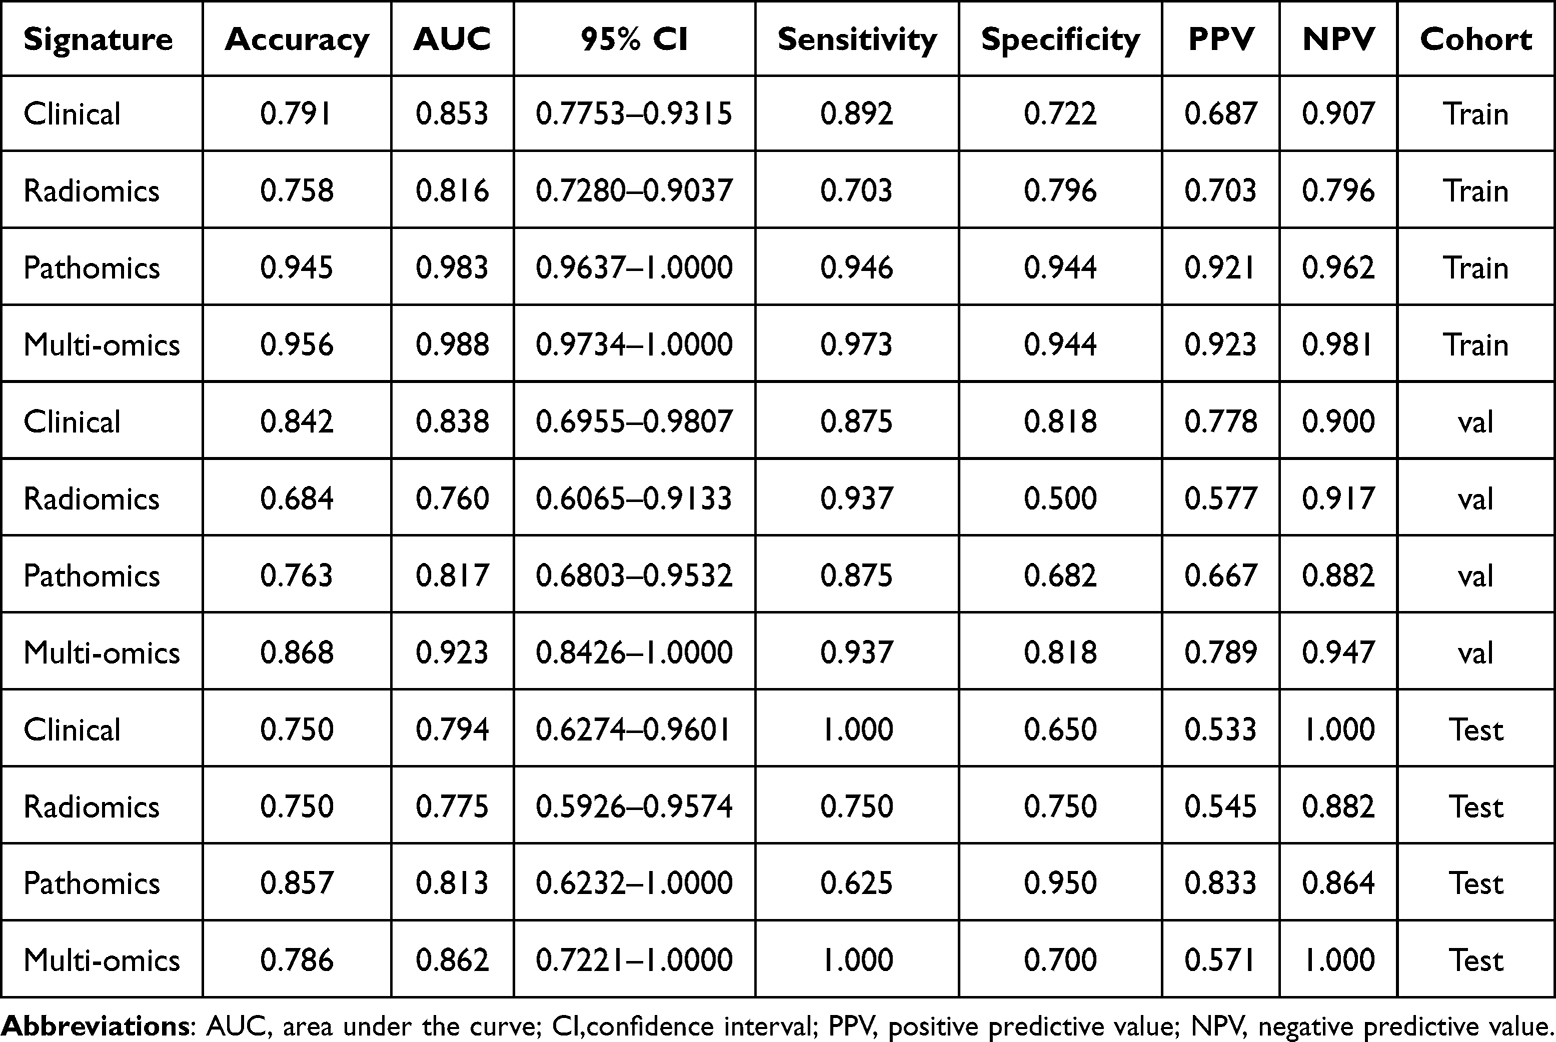 |
Table 5 Prediction Performance of Different Models |
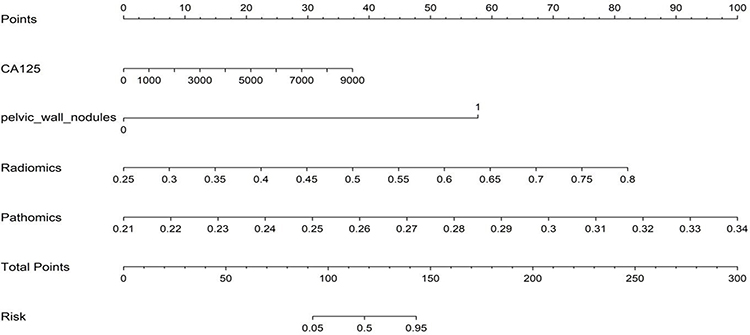 |
Figure 10 The multi-omics nomogram for clinical use. Nomogram integrating clinical (SVM_clin), radiomics (SVM_rad), and pathomics (SVM_path) scores to estimate individualized probability of LNM prior to LND. Each predictor corresponds to a point scale; total points are summed and mapped to predicted probability. Higher total scores correspond to greater LNM risk. |
 |
Figure 11 ROC curves comparing multi‑omics and unimodal models. ROC curves for clinical, radiomics, pathomics, and multi‑omics models across (a) training, (b) internal validation, and (c) external test cohorts. Multi‑omics integration yielded the highest AUCs (training = 0.988; validation = 0.923; test = 0.862) and significantly outperformed unimodal approaches (DeLong test, all P < 0.05). |
Overall, these results show that pathology-based modelling methods have significant advantages over image-based radiological analysis in terms of discrimination performance. More importantly, integrating pathological, US imaging, and clinical information into the joint model consistently yields the best predictive performance across all cohorts. This highlights the complementary characteristics of multimodal data and emphasises the value of multi-group fusion in improving the model’s robustness and clinical applicability.
The results of the pair-by-pair comparison of AUC values using the DeLong test are shown in Figure 12. In most cases, the P value for the comparison between the multi-omics and unimodal models is less than 0.05, indicating that the comprehensive model shows significant statistical advantages across cohorts compared with clinical, radiomics, and pathomics models. In addition, this difference is significantly more reflected in the training cohort than in the validation and test cohorts.
 |
Figure 12 DeLong test results comparing the discriminative performance of different models. Heatmap displaying pairwise statistical comparisons of AUCs between models in (a) training, (b) validation, and (c) test cohorts. Red boxes indicate statistically significant differences (P < 0.05), whereas white boxes indicate non‑significant differences. Multi‑omics model AUC was significantly higher than all unimodal models in the training and validation cohorts. |
The Hosmer-Lemeshow (HL) test (Figure 13) is used to assess model calibration. The specific method is to evaluate the degree of agreement between the predicted probability and the observed results. In this test, a lower HL value indicates better model calibration. The chart shows excellent calibration results. The HL value is 0.668 in the training cohort, 0.259 in the validation cohort, and 0.529 in the test cohort, both higher than the significance threshold of 0.05. These results show a high degree of consistency between predictions and observations, supporting the model’s reliability and stability across different datasets.
 |
Figure 13 Calibration curves of different models. Calibration plots comparing predicted LNM probabilities against observed outcomes in (a) training, (b) validation, and (c) test cohorts. The diagonal line represents ideal calibration. The dashed line represents the fitted calibration curve of the multi‑omics model. |
The results of the Decision Curve Analysis (DCA) are shown in Figure 14, with data from the training, validation, and test cohorts. The results show that, compared with other combinations of characteristics, the comprehensive model systematically maximises net benefit across a wider range of probabilities, thereby demonstrating the best performance in clinical practicality and potential decision-making benefits.
 |
Figure 14 Decision curve analysis (DCA) for clinical utility. Net benefit curves for clinical, radiomics, pathomics, and multi‑omics models across threshold probabilities in (a) training, (b) validation, and (c) test cohorts. The multi‑omics model achieved the highest net benefit over a broad range of threshold probabilities, indicating superior clinical utility compared with unimodal approaches and the “treat all” or “treat none” strategies. |
Discussion
Accurate prediction of lymph node metastasis (LNM) before lymph node dissection (LND) is essential for identifying optimal surgical candidates. Ovarian cancer (OC) patients with LNM typically exhibit inferior prognoses and may benefit from radical tumor-reductive surgery. Conversely, performing unnecessary LND in early-stage OC patients without LNM may increase the risk of complications. Therefore, precise assessment of LNM status is critical for determining the extent of LND and guiding adjuvant treatment strategies in OC. Due to the heterogeneity of tumors, limitations of biopsies, and the high cost of gene testing, there is an urgent demand to develop an effective, simple, cheap, and reproducible predictor of LNM before LND in OC. In our study, the LR, SVM, and XGBoost machine learning techniques were used to construct clinical, radiomics, and pathomics models with clinical information, US images, and WSIs of OC patients. Then the radiomics, pathomics, MIL-derived, and clinical features obtained from these procedures were combined to create a multi-omics nomogram that yielded the most promising results, with high predictive efficiency and robustness. The multi-omics model was optimal in terms of clinical effectiveness as shown in the DCA analysis.
Serum tumor marker levels in patients with OC are measured based on clinical data. The clinical predictors of survival and treatment response in OC mainly include serum CA-125 and HE4. A preoperative serum CA-125 level exceeding 535 U/mL was identified by Kim et al as a risk factor for LNM in patients with epithelial ovarian cancer (EOC).37 Consistent with these findings, our analysis suggests that elevated CA-125 levels may help predict LNM in OC. In terms of HE4, although in vitro studies have shown that high levels promote ovarian cancer cell invasion and metastasis via specific signaling pathways,38 we could not confirm a similar predictive value, indicating a need for further investigation. Besides, past researchers have concluded that positive peritoneal cytology can predict LNM in OC patients,39 which conforms with our finding that the presence of pelvic wall nodules on US imaging is associated with LNM.
Morphomics may be a perfect concept that encompasses morphological descriptors of any size: ultrastructural (nm - m), microscopic (mm - cm), or macroscopic (mm - m).40 Thus, it is possible to imagine that pathomics and radiomics are components of a broader morphomics framework that explains OC from multiple perspectives. However, there are currently very few multi-omics studies in OC that combine radiological and pathological data, and current research on predicting LNM in OC is limited to single radiomics, such as CT.41 By leveraging these two methodologies, this study presents unproven methods, delves deeper into the field of LNM prediction in OC, and is of value to future clinical interventions and disease control.
Studies have suggested that radiomics can quantitatively capture tissue and lesion characteristics, particularly shape and heterogeneity, which are of special interest in oncology. Then, radiomics provides useful data for diagnosing, predicting, and tailoring therapy by extracting phenotypic information from tumor heterogeneity.42,43 We developed our radiomics models using feature selection based on US images. We discovered that overall tumor radiomics heterogeneity can vary with tumor blood supply, tumor growth pattern, tumor density, and tumor cell metabolism in LNM in OC. Besides, studies have indicated that radiomic analysis of primary lesions holds promise for identifying LNM in cervical cancer.44,45 Ultrasound is a preliminary non-invasive diagnostic method, which can quickly detect multifocal tumours and suspected metastatic foci in the pelvic and abdominal areas.14 The above research shows that predicting LNM based on the imaging characteristics of primary tumours is still a field under exploration. The radiomics models developed in our study provide clinicians with a valuable research result, which is conducive to the discovery of LNM in OC and plays a role in promoting this field. If the patient has multiple tumour foci, this model can be used to select the most suspicious foci for operation. The prediction tool has the characteristics of convenience and repeatability. It can carry out treatment interventions in a timely manner and support informed clinical decision-making and treatment planning.
Microscopic histopathological examination is the primary method for diagnosing and researching morphological changes in disease. Still, it requires manual qualitative or semi-qualitative investigations by a pathologist, and is not easily reproducible, precise, scalable, or throughput. Metastases to lymph nodes are complex and time-intensive, and whether LND is needed in the operation is always a critical source of subjectivity in the pathologic evaluation. The fast progress in computer-based digital pathology in recent years has been central to contemporary clinical practice. WSI has greatly overcome the limitations of conventional microscope slides and human cognition due to its improved network compatibility, ease of storage, and sharability, thereby marking a major milestone in the clinical use of digital pathology and leading to continuous enhancements in knowledge use and integration.46 Moreover, large-scale pretrained pathomics models have markedly improved pathomics models’ ability to automatically extract high-dimensional, quantitative features from WSIs in a scalable, reproducible manner. In our study, the pathomics model accurately predicts LNM and can be integrated into routine clinical workflows to provide risk scores, guide the extent of LND, and help avoid unnecessary surgery or overtreatment, thereby improving diagnostic efficiency, enhancing patients’ quality of life, and reducing healthcare costs.
In particular, deep learning (DL) enables automatic, high-dimensional feature extraction from whole-slide images in a data-driven manner, capturing subtle morphological patterns that are difficult or impossible to describe manually, such as molecular modifications or responses to treatment.47 This method is a complementary microscopic morphology polyomics technology that offers several functions for numerous cases. Our established pathomic model used DL for automatic feature extraction and multi-instance learning (MIL) to achieve intelligent feature aggregation, representing an important breakthrough in ovarian cancer pathology analysis. In histology, instances refer to structural units with analytical value. Take the ovary as an example; these examples can be a specific part, such as follicles, the interstitial tissue, the follicular membrane, blood vessels, or a cell. This model can not only reduce dependence on labour-intensive manual labelling but also improve the high repeatability and generalisation of histopathological analysis across different patient groups and imaging platforms.
As machine learning is increasingly mainstream in the medical field, and model features are becoming increasingly complex, the majority of model features are typically nonlinearly associated with outcome variables. Although LR has advantages due to its simplicity and interpretability, it can only be applied to linearly separable problems rather than nonlinear data.48 This may be the reason why LR showed limited learning ability compared with SVM and XGBoost in our study, which was especially obvious when dealing with overly complex patterns. SVM and XGBoost can better cope with complex nonlinear classification tasks.49 Previous studies have also confirmed this technical trend: for example, in the diagnosis of coronary heart disease, the performance of the SVM has been proven to be better than that of LR,50 another study shows that XGBoost can achieve excellent classification performance within a reasonable calculation time and maintain high accuracy, sensitivity, and specificity in the diagnosis of Parkinson’s disease.51
Furthermore, in our study, the SVM models (SVM_rad and SVM_path) performed better than the LR and XGBoost models in predicting LNM in OC, and achieved a high and stable area under the ROC curve (AUC) in both internal validation and external test cohorts, reflecting its theoretical capacity to exclude low-risk individuals if the threshold is appropriately adjusted. This advantage may come from its core principle of minimising structural risks,52 which aims to determine the optimal hyperplane by maximising the classification “interval” rather than accurately fitting each data point, thus improving the generalization ability of the model in high-dimensional and small-sample biomedical data. However, this character also leads to its instability. For example, the specificity in the radiomics validation cohort is reduced to 0.500, and the sensitivity in the pathomics training cohort is 0. These may be related to the easy over-fitting character on small or noisy data sets, which may limit their ability to discover new morphological structures or adapt to new data distribution. This phenomenon reflects the current challenges of artificial intelligence, machine learning models, and deep learning models, and at the same time highlights an important direction for future research in this field.53–55 Future work should focus on threshold optimization strategies—such as lowering the cut-off to prioritize sensitivity or employing cost-sensitive learning algorithms to penalize false negatives. This adjustment is crucial to ensure that the model serves as a safe clinical decision-support tool.
Based on the good performance of SVM_rad and SVM_path models in independent prediction, the multi-omics model integrating pathology, imaging, and clinical information achieved the best comprehensive performance across all cohorts: in the training cohort, its AUC increased to 0.988; in the validation cohort, it significantly increased to 0.923; in the independent test cohort, it also showed excellent generalization ability compared to unimodal models (AUC: 0.862). Moreover, the multi-omics model achieved a good balance between sensitivity (0.937) and specificity (0.818) in the validation cohort, and the independent test cohort further verified its clinical potential, with the sensitivity reaching 1.000. These excellent improvements may come from the effective complementarity between multi-modal information.56 Radiology provides a macromorphological perspective, and pathology reveals microbiological characteristics. The combination of the two can more comprehensively portray tumour phenotypes. The introduction of clinical variables helps correct potential misjudgements and align predictions more closely with the actual clinical decision-making logic, thereby improving specificity and reducing false positives. By integrating multi-source data, the model can leverage its respective advantages and make more stable, generalised predictions, highlighting the important value of multi-modal data fusion in building a highly clinically applicable prediction model.
At present, there are still certain limitations in the study of LNM in OC: the existing prediction model is mostly limited to specific groups, such as patients with advanced serous cancer, which limits its promotion to a wider range of patient groups covering different subtypes and stages. In addition, traditional imaging and clinical evaluation methods lack accurate risk stratification ability, resulting in some patients receiving unnecessary LND, and other patients with micrometastasis may miss the opportunity of individualised assisted treatment. The multi-omics model proposed in this study helps to address the above shortcomings. Unlike traditional predictive models that rely on postoperative pathology, our model is designed to provide decision support specifically before the commencement of LND. By integrating high-dimensional quantitative features derived from intraoperative tumor resection specimens, our model has overcome the limitations of a single modality and bridges the gap between tumor resection and nodal evaluation. Specifically, it helps identify patients most likely to benefit from comprehensive LND. At the same time, it screens out low-risk patients so that they can reduce the risk of complications and receive auxiliary treatment faster through more limited surgery, thus laying the foundation for promoting the development of ovarian cancer surgery to a more accurate and individualised strategy, which is expected to improve patient outcomes and long-term quality of life.
Looking ahead, integrating multiple data sources is an important direction. Driven by artificial intelligence technologies such as deep learning (DL), the field of LNM prediction in OC is expected to achieve a breakthrough. By combining genome, proteome, and other multi-omics information, a multi-omics prediction framework can be built, thereby enabling more comprehensive analysis of the mechanisms of OC tumour occurrence, development, and drug resistance, helping to discover new biomarkers and therapeutic targets, and providing support for individualised treatment.57 In conclusion, such a comprehensive artificial intelligence prediction model will become a powerful tool for accurate oncology, act as an intelligent clinical assistant to help doctors understand the condition, assist in the formulation of optimal treatment plans, and promote the joint decision-making of doctors and patients.58,59
This study has several limitations that warrant consideration. Since OC tumors can manifest differently over time, an integrated temporal dataset of imaging data may enhance the model’s efficiency. In addition, model stability may be compromised by inaccuracies in imaging and WSI annotations. Lastly, the sample size, particularly in the external test cohort (n=28), is relatively small compared to the high dimensionality of deep learning and radiomics features. Although we implemented rigorous overfitting controls, including LASSO feature selection, cross-validated hyperparameter tuning, and MIL aggregation, the risk of overfitting inherent in small-sample, high-dimensional studies cannot be entirely eliminated. Despite the encouraging AUC values in the external test cohort, the clinical heterogeneity of ovarian cancer subtypes may limit generalizability. The seemingly exceptional performance in the training set should be interpreted with caution, as it may partly reflect model optimism despite our regularization efforts. With these limitations, we are aware of the possible effects they may have on the conclusions of this study and the model’s reliability. Future studies involving larger, multi-center prospective cohorts are essential to validate these findings and confirm the robustness of the proposed multi-omics signature and make the model more dependable.
Conclusions
In summary, this study successfully developed and validated a novel multi-omics model using preoperative US images, intraoperative histopathological slides, and clinical information to examine the feasibility of predicting LNM before LND in OC. A highlight was the application of DL algorithms for automated pathomics feature extraction, and MIL techniques like PLH and BoW to aggregate patch-level predictions into robust WSI-level representations. The results demonstrated the superior predictive performance of the multi-omics model. By accurately identifying OC patients who would benefit from LND while sparing those at low risk from unnecessary surgery and its associated complications, this reproducible model paves the way for personalized and precise surgical planning in OC. Future research should focus on multi-center validations with larger, more diverse populations to enhance robustness. Efforts to improve model interpretability and ensure rigorous quality control in data annotation are the essential next steps to translate this promising multi-omics model into reliable clinical practice.
Abbreviations
OC, ovarian cancer; US, ultrasound; LNM, lymph node metastasis; LND, lymph node dissection; WSI, whole slide images; ROI, region of interest; H&E, hematoxylin and eosin; SVM, support vector machine; LR, logistic regression; XGBoost, extreme gradient boosting; ROC, receiver operating characteristic; AUC, area under the curve; PPV, positive predictive value; NPV, negative predictive value; MIL, multi-instance learning; DL, deep learning; PLH, patch likelihood histogram; BoW, bag-of-words; DCA, decision curve analysis; OR, odds ratio; CI, confidence interval; AFP, alpha-fetoprotein; CA125, cancer antigen 125; HE4, human epididymis protein 4; CA199, cancer antigen 199; CEA, carcino-embryonic antigen; Grad-CAM, gradient-weighted class activation mapping; t-SNE, t-distributed stochastic neighbor embedding.
Ethical Approval
This retrospective study was approved by the Ethics Committee of the Affiliated Hospital of Inner Mongolia Medical University (No. KY2026022) and patients’ written informed consents were waived based on the following reasons: all data were sourced from de-identified historical medical records with no personally identifiable information retained throughout collection, processing, and analysis, posing no privacy risk to patients; the study did not involve any additional invasive examinations, interventions to original treatment plans, or follow-up of participants, and did not cause any physical or psychological harm to patients.
All research procedures complied with the ethical principles of the Declaration of Helsinki. Strict confidentiality measures were implemented throughout the study: data access was restricted to authorized research personnel only; paper materials containing case information were kept in locked cabinets; no individual patient data will be disclosed in any form of publication or public dissemination.
Author Contributions
All authors made a significant contribution to the work reported, whether that is in the conception, study design, execution, acquisition of data, analysis and interpretation, or in all these areas; took part in drafting, revising or critically reviewing the article; gave final approval of the version to be published; have agreed on the journal to which the article has been submitted; and agree to be accountable for all aspects of the work.
Funding
This study was supported by the National Natural Science Foundation of China Regional Project (82560297); Natural Science Foundation of Inner Mongolia Autonomous Region (2025MS08117); Zhiyuan Talent Program of Inner Mongolia Medical University (ZY20242107); Doctoral Start-up Foundation Project of Inner Mongolia Medical University (YKD2024 BSQD026); Project of the Inner Mongolia Autonomous Region Educational Science Research “14th Five-Year Plan” (NGJGH2025307), and a project funded by the Priority Academic Program Development of Jiangsu Higher Education Institutions (PAPD).
Disclosure
The authors declare no conflicts of interest in this work.
References
1. Webb PM, Jordan SJ. Epidemiology of epithelial ovarian cancer. Best Pract Res Clin Obstet Gynaecol. 2017;41:3–23. doi:10.1016/j.bpobgyn.2016.08.006
2. Cabasag CJ, Fagan PJ, Ferlay J, et al. Ovarian cancer today and tomorrow: a global assessment by world region and HUMAN development index using GLOBOCAN 2020. Int J Cancer. 2022;151(9):1535–1541. doi:10.1002/ijc.34002
3. Nag S, Aggarwal S, Rauthan A, Warrier N. Maintenance therapy for newly diagnosed epithelial ovarian cancer– a review. Jovarian Res. 2022;15(1):88. doi:10.1186/s13048-022-01020-1
4. Liu X, Liang R, Ruan T, Yuan Y, Li Y, Lu J. The relationship between symptom burden and death anxiety in ovarian cancer patients: the mediating effect of alexithymia. J Multidisciplin Healthcare. 2026;19:1–13. doi:10.2147/JMDH.S564641
5. Guo QY, Wang JJ, Chen R, Hu LP, You WQ. A machine learning model for predicting lymph node positivity in ovarian cancer: development, validation, and clinical application. Front Oncol. 2025;151527674. doi:10.3389/fonc.2025.1527674
6. Daly MB, Pilarski R, Berry M, et al. NCCN guidelines insights: genetic/familial high-risk assessment: breast and ovarian, version 2.2017. J National Compr Cancer Network. 2017;15(1):9–19. doi:10.6004/jnccn.2017.0003
7. Viveros-Carreño D, Rodriguez J, Pareja R. Incidence of lymph node metastasis in early-stage low-grade serous ovarian cancer: a systematic review. Int J Gynecological Cancer. 2022;32(10):1283–1288. doi:10.1136/ijgc-2022-003618
8. du Bois A, Reuss A, Harter P, Pujade-Lauraine E, Ray-Coquard I, Pfisterer J. Potential role of lymphadenectomy in advanced ovarian cancer: a combined exploratory analysis of three prospectively randomized Phase III multicenter trials. J clin oncol. 2010;28(10):1733–1739. doi:10.1200/jco.2009.25.3617
9. Bao RR, Olivier M, Xiang JM, Ye PP, Yan XJ. The significance of lymph node dissection in patients with early epithelial ovarian cancer. Annali Italiani Di Chirurgia. 2024;95(4):628–635. doi:10.62713/aic.3353
10. Harter P, Sehouli J, Lorusso D, et al. A randomized trial of lymphadenectomy in patients with advanced ovarian neoplasms. N Engl J Med. 2019;380(9):822–832. doi:10.1056/NEJMoa1808424
11. Yuan Y, Gu Z-X, Tao X-F, Liu S-Y. Computer tomography, magnetic resonance imaging, and positron emission tomography or positron emission tomography/computer tomography for detection of metastatic lymph nodes in patients with ovarian cancer: a meta-analysis. Eur J Radiol. 2012;81(5):1002–1006. doi:10.1016/j.ejrad.2011.01.112
12. Borges AC, Veloso H, Galindo P, et al. Role of ultrasound in detection of lymph-node metastasis in gynecological cancer: systematic review and meta-analysis. Ultrasound Obstet Gynecol. 2024;64(2):155–163. doi:10.1002/uog.27633
13. Yang YQ, Ye XW, Zhou BQ, et al. Nomogram for predicting lymph node metastasis in patients with ovarian cancer using ultrasonography: a multicenter retrospective study. BMC Cancer. 2023;23(1):1121. doi:10.1186/s12885-023-11624-5
14. Qi Y, Liu JC, Wang XY, et al. Development and validation of an ultrasound‑based radiomics nomogram to predict lymph node status in patients with high-grade serous ovarian cancer: a retrospective analysis. Jovarian Res. 2024;17(1):48. doi:10.1186/s13048-024-01375-7
15. Hu H-T, Wang Z, Huang X-W, et al. Ultrasound-based radiomics score: a potential biomarker for the prediction of microvascular invasion in hepatocellular carcinoma. Eur Radiol. 2019;29(6):2890–2901. doi:10.1007/s00330-018-5797-0
16. Liu D, Yang K, Zhang CQ, Xiao DD, Zhao Y. Fully-automatic detection and diagnosis system for thyroid nodules based on ultrasound video sequences by artificial intelligence. J Multidisciplin Healthcare. 2024;17:1641–1651. doi:10.2147/jmdh.S439629
17. DiCenzo D, Quiaoit K, Fatima K, et al. Quantitative ultrasound radiomics in predicting response to neoadjuvant chemotherapy in patients with locally advanced breast cancer: results from multi-institutional study. Cancer Med. 2020;9(16):5798–5806. doi:10.1002/cam4.3255
18. Rundo L, Beer L, Sanchez LE, et al. Clinically interpretable radiomics-based prediction of histopathologic response to neoadjuvant chemotherapy in high-grade serous ovarian carcinoma. Front Oncol. 2022:12868265. doi:10.3389/fonc.2022.868265
19. Li JJ, Li XB, Ma JW, Wang F, Cui SJ, Ye ZX. Computed tomography–based radiomics machine learning classifiers to differentiate type I and type II epithelial ovarian cancers. Eur Radiol. 2022;33(7):5193–5204. doi:10.1007/s00330-022-09318-w
20. Suprasert P, Khunamornpong S, Phusong A, Settakorn J, Siriaungkul S. Accuracy of intra-operative frozen sections in the diagnosis of ovarian masses. Asian Pac J Cancer Prev. 2008;9(4):737–740.
21. Banerji S, Mitra S. Deep learning in histopathology: a review. WIREs Data Mining Knowledge Discovery. 2022;12(1):e1439. doi:10.1002/widm.1439
22. Ke ZR, Shen LH, Shao J. Early warning of axillary lymph node metastasis in breast cancer patients using multi-omics signature: a machine learning-based retrospective study. CDATA Int General Med. 2024;17:6101–6114. doi:10.2147/ijgm.S499238
23. Li W, Ji X, Zhao Y, Yang Z. 1441P clinical application of a machine learning-based pathomics signature for predicting lymph node metastasis in early gastric cancer. Ann Oncol. 2024;35:S896–S897. doi:10.1016/j.annonc.2024.08.1507
24. Chen Y, Ye L, Ding C, Xu J. 546P an artificial intelligence system integrating deep learning-proteomics, pathomics and clinicopathological features to determine risk of T1 colorectal cancer metastasis to lymph node. Ann Oncol. 2024;35:S454–S455. doi:10.1016/j.annonc.2024.08.615
25. Xiao WH, Zhou W, Yuan HM, et al. A radiopathomics model for predicting large-number cervical lymph node metastasis in clinical N0 papillary thyroid carcinoma. Eur Radiol. 2025;35(8):4587–4598. doi:10.1007/s00330-025-11377-8
26. Zhang YY, Fang MQ, Wang XY, et al. Development of a PANoptosis -related pathomics prognostic model in ovarian cancer: a multi-omics study. J Cell & Mol Med. 2025;29(22):e70958. doi:10.1111/jcmm.70958
27. Song JD, Shi JY, Dong D, et al. A new approach to predict progression-free survival in stage IV EGFR-mutant NSCLC patients with EGFR-TKI therapy. Clin Cancer Res. 2018;24(15):3583–3592. doi:10.1158/1078-0432.Ccr-17-2507
28. Dong D, Fang M-J, Tang L, et al. Deep learning radiomic nomogram can predict the number of lymph node metastasis in locally advanced gastric cancer: an international multicenter study. Ann Oncol. 2020;31(7):912–920. doi:10.1016/j.annonc.2020.04.003
29. Jiang YM, Zhang ZC, Yuan QY, et al. Predicting peritoneal recurrence and disease-free survival from CT images in gastric cancer with multitask deep learning: a retrospective study. The Lancet Digital Health. 2022;4(5):E340–E350. doi:10.1016/s2589-7500(22)00040-1
30. Schneider L, Laiouar-Pedari S, Kuntz S, et al. Integration of deep learning-based image analysis and genomic data in cancer pathology: a systematic review. Eur J Cancer. 2022;160:80–91. doi:10.1016/j.ejca.2021.10.007
31. Bankhead P, Loughrey MB, Fernández JA, et al. QuPath: open source software for digital pathology image analysis. Sci Rep. 2017:716878. doi:10.1038/s41598-017-17204-5
32. Schmidt A, Morales-Alvarez P, Molina R. Probabilistic attention based on gaussian processes for deep multiple instance learning. IEEE Trans Neural Net Learn Syst. 2024;35(8):10909–10922. doi:10.1109/tnnls.2023.3245329
33. Quintero-Domínguez LA, Morell C, Ventura S. A propositionalization method of multi-relational data based on grammar-guided genetic programming. Expert Syst Appl. 2021;168114263. doi:10.1016/j.eswa.2020.114263
34. Fan Y, Li J, Bhatti UA, et al. A Multi-Watermarking Algorithm for Medical Images Using Inception V3燼nd燚CT. Comput Mater Continua. 2023;74(1):1279–1302. doi:10.32604/cmc.2023.031445
35. Selvaraju RR, Cogswell M, Das A, Vedantam R, Parikh D, Batra D. Grad-CAM: visual explanations from deep networks via gradient-based localization. Int J Comput Vis. 2020;128(2):336–359. doi:10.1007/s11263-019-01228-7
36. Fayyaz AM, Abdulkadir SJ, Talpur N, Al-Selwi SM, Hassan SU, Sumiea EH. Grad-CAM (gradient-weighted class activation mapping): a systematic literature review. Comput Biol Med. 2025;198:111200. doi:10.1016/j.compbiomed.2025.111200
37. Kim HS, Park NH, Chung HH, Kim JW, Song YS, Kang SB. Significance of preoperative serum CA-125 levels in the prediction of lymph node metastasis in epithelial ovarian cancer. Acta Obstetricia Et Gynecologica Scandinavica. 2008;87(11):1136–1142. doi:10.1080/00016340802478158
38. Zhou J, Sun J-Y, Wu S-G, et al. Risk factors for lymph node metastasis in ovarian cancer: implications for systematic lymphadenectomy. Int J Surg. 2016;29:123–127. doi:10.1016/j.ijsu.2016.03.039
39. Bogani G, Tagliabue E, Ditto A, et al. Assessing the risk of pelvic and para-aortic nodal involvement in apparent early-stage ovarian cancer: a predictors- and nomogram-based analyses. Gynecologic Oncol. 2017;147(1):61–65. doi:10.1016/j.ygyno.2017.07.139
40. Bülow RD, Hölscher DL, Costa IG, Boor P. Extending the landscape of omics technologies by pathomics. Npj Syst Biol Appl. 2023;9(1):38. doi:10.1038/s41540-023-00301-9
41. Zhang J, Li QY, Liang HY, et al. Preoperative prediction of lymph node metastasis in patients with ovarian cancer using contrast-enhanced computed tomography-based intratumoral and peritumoral radiomics features. Front Oncol. 2025:151543873. doi:10.3389/fonc.2025.1543873
42. Mayerhoefer ME, Materka A, Langs G, et al. Introduction to radiomics. J Nucl Med. 2020;61(4):488–495. doi:10.2967/jnumed.118.222893
43. Moon SH, Kim J, Joung J-G, et al. Correlations between metabolic texture features, genetic heterogeneity, and mutation burden in patients with lung cancer. Euro J Nuclear Med Mole Imaging. 2019;46(2):446–454. doi:10.1007/s00259-018-4138-5
44. Jin XC, Ai Y, Zhang J, et al. Noninvasive prediction of lymph node status for patients with early-stage cervical cancer based on radiomics features from ultrasound images. Eur Radiol. 2020;30(7):4117–4124. doi:10.1007/s00330-020-06692-1
45. Toffaha K, Simsekler MCE, Sleptchenko A, Kortt MA, Bukasa LL. A machine learning and Bayesian belief network approach to predicting cervical cancer risk: implications for risk management. J Multidisciplin Healthcare. 2025;18:5199–5211. doi:10.2147/jmdh.S524132
46. Jariyapan P, Pora W, Kasamsumran N, Lekawanvijit S. Digital pathology and artificial intelligence in diagnostic pathology. Malaysian J Pathol. 2025;47(1):3–11.
47. Kather JN, Heij LR, Grabsch HI, et al. Pan-cancer image-based detection of clinically actionable genetic alterations. Nat Cancer. 2020;1(8):789–+. doi:10.1038/s43018-020-0087-6
48. Bulso N, Marsili M, Roudi Y. On the complexity of logistic regression models. Neural Comput. 2019;31(8):1592–1623. doi:10.1162/neco_a_01207
49. Ester M, Kriegel HP, Xu X. XGBoost: a scalable tree boosting system. In Proceedings of the 22Nd ACM SIGKDD International Conference on Knowledge Discovery and Data Mining (vol, pg 785, 2016). Geographic Analys. 2022. doi:10.1111/gean.12315.
50. Garavand A, Salehnasab C, Behmanesh A, Aslani N, Zadeh AH, Ghaderzadeh M. Efficient model for coronary artery disease diagnosis: a comparative study of several machine learning algorithms. J Healthcare Engine. 2022;20225359540. doi:10.1155/2022/5359540
51. Nguyen T-N-Q, Vo H-T-T, Huynh TV. Enhanced diagnosis of Parkinson’s disease using XGBoost†. IEEJ Trans ElectrElectron Eng. 2025;20(11):1862–1867. doi:10.1002/tee.70094
52. Zhou XY, Li XY, Zhang ZJ, et al. Support vector machine deep mining of electronic medical records to predict the prognosis of severe acute myocardial infarction. Front Physiol. 2022:13991990. doi:10.3389/fphys.2022.991990
53. Arrieta AB, Díaz-Rodríguez N, Del Ser J, et al. Explainable Artificial Intelligence (XAI): concepts, taxonomies, opportunities and challenges toward responsible AI. Information Fusion. 2020;58:82–115. doi:10.1016/j.inffus.2019.12.012
54. Zhang Y, Tino P, Leonardis A, Tang K. A survey on neural network interpretability. IEEE Trans Emerging Top Comput Intell. 2021;5(5):726–742. doi:10.1109/tetci.2021.3100641
55. Sriraman H, Badarudeen S, Vats S, Balasubramanian P. A systematic review of real-time deep learning methods for image-based cancer diagnostics. J Multidisciplin Healthcare. 2024;17:4411–4425. doi:10.2147/jmdh.S446745
56. Boehm KM, Aherne EA, Ellenson L, et al. Multimodal data integration using machine learning improves risk stratification of high-grade serous ovarian cancer. Nat Cancer. 2022;3(6):723–+. doi:10.1038/s43018-022-00388-9
57. Hsu C-Y, Askar S, Alshkarchy SS, et al. AI-driven multi-omics integration in precision oncology: bridging the data deluge to clinical decisions. Clin Exp Med. 2025;26(1):29. doi:10.1007/s10238-025-01965-9
58. Zhang B, Shi HP, Wang HT. Machine learning and AI in cancer prognosis, prediction, and treatment selection: a critical approach. J Multidisciplin Healthcare. 2023;16:1779–1791. doi:10.2147/jmdh.S410301
59. Wei LS, Niraula D, Gates EDH, et al. AI in imaging and therapy: innovations, ethics, and impact: review article Artificial Intelligence (AI) and machine learning (ML) in precision oncology: a review on enhancing discoverability through multiomics integration. British J Radiol. 2023;96(1150):20230211. doi:10.1259/bjr.20230211
 © 2026 The Author(s). This work is published and licensed by Dove Medical Press Limited. The
full terms of this license are available at https://www.dovepress.com/terms
and incorporate the Creative Commons Attribution
- Non Commercial (unported, 4.0) License.
By accessing the work you hereby accept the Terms. Non-commercial uses of the work are permitted
without any further permission from Dove Medical Press Limited, provided the work is properly
attributed. For permission for commercial use of this work, please see paragraphs 4.2 and 5 of our Terms.
© 2026 The Author(s). This work is published and licensed by Dove Medical Press Limited. The
full terms of this license are available at https://www.dovepress.com/terms
and incorporate the Creative Commons Attribution
- Non Commercial (unported, 4.0) License.
By accessing the work you hereby accept the Terms. Non-commercial uses of the work are permitted
without any further permission from Dove Medical Press Limited, provided the work is properly
attributed. For permission for commercial use of this work, please see paragraphs 4.2 and 5 of our Terms.
Recommended articles
Development of a Clinical-Radiomics Nomogram That Used Contrast-Enhanced Ultrasound Images to Anticipate the Occurrence of Preoperative Cervical Lymph Node Metastasis in Papillary Thyroid Carcinoma Patients
Wei T, Wei W, Ma Q, Shen Z, Lu K, Zhu X
International Journal of General Medicine 2023, 16:3921-3932
Published Date: 29 August 2023
Nomogram Based on Super-Resolution Ultrasound Images Outperforms in Predicting Benign and Malignant Breast Lesions
Yang L, Ma Z
Breast Cancer: Targets and Therapy 2023, 15:867-878
Published Date: 2 December 2023
Fully-Automatic Detection and Diagnosis System for Thyroid Nodules Based on Ultrasound Video Sequences by Artificial Intelligence
Liu D, Yang K, Zhang C, Xiao D, Zhao Y
Journal of Multidisciplinary Healthcare 2024, 17:1641-1651
Published Date: 15 April 2024
Deep-Learning-Based Radiomics to Predict Surgical Risk Factors for Lumbar Disc Herniation in Young Patients: A Multicenter Study
Fan Z, Wu T, Wang Y, Jin Z, Wang T, Liu D
Journal of Multidisciplinary Healthcare 2024, 17:5831-5851
Published Date: 7 December 2024
Radiomics and Deep Learning as Important Techniques of Artificial Intelligence — Diagnosing Perspectives in Cytokeratin 19 Positive Hepatocellular Carcinoma
Wang F, Yan C, Huang X, He J, Yang M, Xian D
Journal of Hepatocellular Carcinoma 2025, 12:1129-1140
Published Date: 5 June 2025