Back to Journals » Patient Related Outcome Measures » Volume 15
Cross-Sectional Quantitative Evaluation of a Novel Patient-Reported Outcome Measure in Familial Chylomicronemia Syndrome
Authors Brown TM, Vera-Llonch M, Kanu C, Sikora Kessler A, Yarlas A ![]() , Fehnel SE
, Fehnel SE ![]()
Received 23 September 2023
Accepted for publication 11 January 2024
Published 15 February 2024 Volume 2024:15 Pages 45—59
DOI https://doi.org/10.2147/PROM.S441583
Checked for plagiarism Yes
Review by Single anonymous peer review
Peer reviewer comments 2
Editor who approved publication: Dr Robert Howland
T Michelle Brown,1 Montserrat Vera-Llonch,2 Chisom Kanu,1 Asia Sikora Kessler,2 Aaron Yarlas,2 Sheri E Fehnel1
1Patient-Centered Outcomes Assessment, RTI Health Solutions, Research Triangle Park, NC, USA; 2Health Economics & Outcomes Research, Ionis Pharmaceuticals, Carlsbad, CA, USA
Correspondence: Asia Sikora Kessler, Ionis Pharmaceuticals, Carlsbad, CA, USA, Email [email protected]
Background: Familial chylomicronemia syndrome (FCS) is a rare metabolic disorder that impacts physical, emotional, social, and cognitive functioning. The FCS-Symptom and Impact Scale (FCS-SIS) patient-reported outcome (PRO) measure assesses common symptoms and impacts of FCS. This study was conducted to evaluate cross-sectional psychometric properties of the FCS-SIS and its scoring method.
Methods: This multisite, cross-sectional, observational study of individuals with FCS was conducted in the United States and Canada. Participants completed a survey composed of 7 PRO measures, including the FCS-SIS, and questions about clinical characteristics and demographics. The structure of the FCS-SIS was evaluated using inter-item and item-scale correlations and internal consistency reliability. Construct, known-groups, and criterion validity were evaluated by examining associations between FCS-SIS item and composite scores and other measures included within the survey.
Results: Most of the 33 participants were female (63.6%) and White (78.1%). On average, participants reported first noticing FCS symptoms at ~16 years, with abdominal pain the most frequently reported initial symptom (n=20). Participants reported 2.5 acute pancreatitis attacks on average over the past year. Average FCS-SIS symptom item scores ranged from 1.8 to 3.9 (on a 0-to-10 scale [none-to-worst-possible]) within the 24-hour recall period, with an average Symptom composite score of 2.7. The average impact item scores on the FCS-SIS ranged from 1.6 to 3.0 (on a 0-to-4 scale), with an average Impact composite score of 2.1. Inter-item correlations between the FCS-SIS Symptom items ranged from 0.32 to 0.78. Corrected item-total correlations were highly satisfactory for Impact items, ranging from 0.62 to 0.85. All a priori validity hypotheses were supported by observed correlations and score differences between known groups.
Conclusion: The results of this study support the structure, reliability, and validity of the FCS-SIS, laying the psychometric groundwork for longitudinal evaluation of its utility in assessing treatment benefit in FCS clinical studies.
Keywords: psychometric evaluation, FCS, validity, reliability, rare disease, patient reported outcome measure
Background
Familial chylomicronemia syndrome (FCS) is a rare metabolic disorder caused by inherited mutations in the lipoprotein lipase or genes that affect lipoprotein lipase function.1 The wide variance in the estimated FCS prevalence rate of 1–13 per 1,000,000 individuals may be due to varying degrees of rigor in estimation methodology, vague symptom presentation,1,2 as well as availability of and access to genetic testing. Symptoms of FCS include repeated attacks of pancreatitis, abdominal pain, physical and mental fatigue, back pain, brain fog and other cognitive symptoms,3 numbness in the feet or legs, vomiting, and diarrhea.4,5 Many patients with FCS adhere to a strict diet of <20g fat/day to limit triglycerides in an attempt to manage FCS symptoms. However, even with strict adherence to a specialized diet, they can experience breakthrough symptoms and acute pancreatitis attacks. The manifestations of FCS impact the physical, emotional, social, and cognitive health outcomes of people with FCS. The impacts of FCS on patients’ quality of life can go so far as to limit their employment and social interactions.6
It is important to capture and assess the symptoms and impacts of FCS in clinical studies to facilitate the evaluation of new treatments in development for these patients. However, no FCS-specific patient-reported outcome (PRO) measure, which could be used for this purpose, existed prior to the very recent development of the FCS-Symptom and Impact Scale (FCS-SIS).7 As previously described,7 development of the FCS-SIS relied heavily on input from patients with FCS, in accordance with United States Food and Drug Administration (FDA) guidance.8,9 This measure assesses the most common symptoms and impacts of FCS identified as most important and relevant to patients. Findings from qualitative concept elicitation and cognitive debriefing interviews with 10 patients resulted in a final selection of 17 items: 4 items assessing FCS symptoms and 13 items assessing impacts. Participants considered the FCS-SIS to be relevant and to contain important content with clear and appropriate response options. Despite the rigorous development process supporting the content validity of the FCS-SIS, further research is required to evaluate the instrument’s psychometric properties.
The primary objectives of the current quantitative study of patients with FCS were to (1) evaluate key cross-sectional psychometric properties of the FCS-SIS and (2) examine whether the approach for the scoring of this measure that emerged from qualitative research was supported as appropriate. In support of these objectives, the internal reliability and construct validity (including construct, known-groups/discriminant, and criterion validity) of 2 composite scores and 4 symptom-specific item scores were evaluated. In addition, descriptive analysis of cross-sectional survey data was conducted to provide information about the prevalence of FCS symptoms and the impact of FCS on study participants’ lives.
Methods
Study Design
This multisite, cross-sectional, observational study of individuals with FCS was conducted in the United States and Canada. Potential study participants were identified and screened for eligibility by staff at clinical sites and the FCS Focus patient advocacy group. Adults (at least 18 years of age) were eligible for the study if they reported having a diagnosis of FCS (from genetic confirmation, current or past qualification for an FCS clinical trial, or current or past use of volanesorsen) and were able to complete a survey in English or French. The survey content was initially developed in English and then translated into French, including existing official translations of the PROMIS measures and GSRS. The French translation of the FCS-SIS was developed for Canadian French speakers according to best practices.10 Potential participants then contacted medical recruiters at a collaborating research firm, who verified eligibility, reviewed the informed consent form, and invited participants to complete a mailed survey about their experiences with FCS. The study materials were reviewed by the Advarra Institutional Review Board (IRB) and subsequently received an exempt determination. Sites requiring a local or academic IRB were responsible for their own IRB submission based on the study materials.
Survey Materials
The survey comprised 7 PRO measures, including the FCS-SIS, and additional questions about clinical characteristics and demographics, for a total of 93 items (Table 1). As shown in Figure 1, the 4 symptom items of the FCS-SIS address Abdominal Pain, Physical Fatigue, Difficulty Thinking, and Diarrhea. The 13 impact items address Emotions, Social Activity and Planning, Dietary Restrictions, Physical Activity, Financial Worries, and Productivity.7 The symptom items are rated on a numeric rating scale from 0 (none) to 10 (worst possible), with a 24-hour recall period. The impact items use a verbal rating scale with 5 ordered response options that reference the patient’s current status (ie, 0 = “Never”, 1 = “Rarely”, 2 = “Sometimes”, 3 = “Often”, 4 = “Always”). The Symptom and Impact composite scores are calculated as the average of scores across the 4 symptom and 13 impact items, respectively. Each of the individual symptom item scores can also be interpreted independently. Variants of the 4 symptom items were also administered using a 7-day recall period to provide additional information about symptom prevalence and to estimate values corresponding to weekly (7-day) averages of the FCS-SIS symptom items that can be computed within the context of clinical trials.
 |
Table 1 Survey Content |
 |
Figure 1 Conceptual Framework for the FCS-SIS. aThe 4 FCS symptom items can be interpreted individually. |
Three measures from the Patient-Reported Outcomes Measurement Information System (PROMIS) were included in the survey to measure generic health status/health-related quality of life.11 Each PROMIS item uses an ordered, verbal response scale, and each measure can be scored using either a summed raw score or the T-score metric (preferred), with higher scores indicating more of the concept being measured. The PROMIS-29 v 2.0 consists of 29 items that cover Physical Function, Anxiety, Depression, Fatigue, Sleep Disturbance, Ability to Participate in Social Roles and Activities, Pain Interference, and Pain Intensity. Most of the PROMIS-29 v 2.0 items have a 7-day recall period except for the items measuring Physical Fatigue and the Ability to Participate in Social Activities, which have a current recall period. The PROMIS Cognitive Function measure (v 2.0) includes 4 items that cover mental acuity, concentration, and memory using a 7-day recall period. The PROMIS Global Health measure provides an overall evaluation of an individual’s physical and mental health using 10 items. Some PROMIS Global Health items use a 7-day recall period, and others use a current recall period.
The Gastrointestinal Symptom Rating Scale (GSRS) is a 15-item measure used to assess the severity of common symptoms of gastrointestinal disorders, including abdominal pain, constipation, diarrhea, indigestion, and reflux.12 The GSRS has good reliability and validity and is responsive to changes in symptoms.13 Each item has a 7-day recall period and is rated on a 7-point scale where 1 represents no discomfort and 7 represents very severe discomfort. The sum of the scores for all 15 items is regarded as the GSRS total score, with higher scores representing more severe symptoms.12 Finally, a global item, the Patient Global Impression of Severity (PGIS), was included in the survey to measure patients’ overall impression of their FCS symptom severity. The PGIS includes 5 verbal options ranging from “No symptoms” to “Very severe symptoms”.
Statistical Analysis
All inferential statistical tests were 2-tailed, with a type I error rate pre-specified at 5% (ie, alpha = 0.05) applied to each individual hypothesis test. Missing survey responses were recorded and tallied, but not imputed. The PROMIS measures11 and GSRS12 were scored according to their user guidelines (including missing data rules). Descriptive statistics were tabulated for all survey items and all composite, domain, and total scores. For continuous values, we calculated n, mean, standard deviation, median, minimum, maximum, and number missing. For categorical variables, which included responses to FCS-SIS items, the sample size and percentage for each response option are presented, including missing responses. The percentages of participants with the lowest (floor) and highest (ceiling) response categories were included in the descriptive statistics for each item. Problematic floor or ceiling effects were defined as 2 times the expected probability of a response under the uniform distribution (eg, 18.2% and 40.0% of participants for the 11- and 5-point scales, respectively).
FCS-SIS Structure
The structure of the FCS-SIS, particularly the Symptom and Impact composite scores conceptualized during instrument development, was evaluated using inter-item and item-scale correlations and internal consistency reliability. Pearson correlations were computed between symptom items, and polychoric correlations were computed between impact items. Polyserial correlations were computed between symptom and impact items. Items assessing similar (or the same) constructs were expected to yield moderate correlations or higher (r ≥ 0.30).14 However, inter-item correlations more than 0.80 were considered potentially indicative of item redundancy. Corrected item-total correlations were also computed to examine the relationship between each item and its composite score. Given that the FCS-SIS items address different symptoms and impacts that may be experienced independently, correlations > 0.2 were considered satisfactory.15 To support internal consistency of the proposed composite scores, Cronbach’s coefficient alpha16 was computed (separately) for the 4 symptom items and the 13 impact items. Coefficients between 0.70 and 0.90 indicate a set of items that are strongly related and capable of supporting a unidimensional scoring structure but are not redundant.17
Construct Validity
Construct, discriminant, and criterion validity of the FCS-SIS were evaluated by examining the associations between scores on this measure and others included within the survey.
Construct validity was examined through Pearson correlations between the FCS-SIS scores (item- and composite-level) and the scores of other instruments, including the PROMIS scales, and the GSRS (total and subscale). Polyserial correlations were used between the FCS-SIS scores and the PGIS. The magnitude and direction of the resulting correlation coefficients were compared with specific a priori hypotheses (Box S-1 and Supplementary Material) and to Cohen’s guideline14 for interpreting correlation coefficients as follows: absolute values of correlations of 0.50 or greater were considered strong, correlations that fell between 0.30 and 0.49 were considered moderate, and those that fell between 0.10 and 0.29 were considered small.
Known-groups analyses were conducted to provide support for the discriminating ability of the FCS-SIS. Specifically, analysis of variance (ANOVA) was used to examine mean differences in the FCS-SIS scores (4 symptom item scores and both composite scores) among patients classified into subgroups based on their PGIS responses (No/Mild symptoms versus Moderate/Severe/Very Severe symptoms). Cohen’s d (standardized mean difference) was also computed to assess the magnitude of differences between subgroups for each score. Values of 0.2, 0.5, and 0.8 were interpreted as small, moderate, and large effect sizes, respectively.18 We hypothesized the FCS-SIS scores would be higher for participants with Moderate/Severe/Very Severe symptoms than those with No/Mild symptoms.
Finally, criterion validity was examined using correlations between scores on the FCS-SIS and 2 patient-reported clinical characteristics: triglyceride levels (using Pearson correlations) and the frequency of acute pancreatitis attacks over the previous 12 months (using Spearman correlations, given the nonnormal frequency distribution of acute pancreatitis attacks). Responses to each of the symptom items (24-hour and 7-day recall), as well as the Symptom composite scores (24-hour and 7-day recall) and Impact composite scores, were compared with the number of acute pancreatitis attacks and with patients’ most recent fasting triglyceride levels experienced in the past year.
Results
Participant Characteristics
Key demographics and clinical characteristics for the 33 study participants are presented in Table 2. Twenty-two participants (66.7%) completed the English version of the FCS-SIS, and 11 (33.3%) completed the French version. The mean age of participants was 49.8 years. The majority of participants were female (63.6%), White (78.1%), and employed (59%). Participants reported first noticing FCS symptoms at 16.7 years of age, on average, with abdominal pain being the most common first symptom experienced (n = 20, 61%). Participants reported being diagnosed with FCS at a mean 24.8 years of age. The mean of the most recent fasting triglyceride level reported by study participants was 1037 mg/dL, with the majority (n = 31, 93.9%) experiencing 1 or more FCS symptoms in the 30 days prior to participating in the study, most commonly physical fatigue (81.8%) and difficulty thinking (78.8%), followed by diarrhea (72.7%) and abdominal pain (51.5%). Participants reported experiencing an average of 2.5 acute pancreatitis attacks in the 12 months prior to study enrollment; however, this frequency was variable, with a standard deviation of 6.8.
 |
Table 2 Participant Characteristics |
Descriptive Analysis for PRO Measures
Descriptive statistics for the FCS-SIS items as well as supporting PRO measures are presented in Table 3. The average FCS-SIS symptom item scores ranged from 1.8 (Abdominal Pain) to 3.9 (Physical Fatigue), with an average Symptom composite score of 2.7, suggesting mild symptoms overall. Slightly higher values were obtained for the FCS symptom items with a 7-day recall period; these average scores ranged from 2.5 (Diarrhea) to 4.7 (Physical Fatigue), with an average weekly Symptom composite score of 3.4. The average impact item scores on the FCS-SIS ranged from 1.6 (Feeling Sad or Depressed, Feeling Judged by Others, Worry About Finances) to 3.0 (Worry About Future Health), with an average Impact composite score of 2.1; this is consistent with the generally infrequent, episodic nature of the condition.
 |
Table 3 Descriptive Statistics of Patient-Reported Outcome Scores |
The scores across the PROMIS 29 v 2.0 domains—Anxiety (mean = 57.0), Fatigue (mean = 54.2), and Pain Interference (mean = 54.0)—were slightly higher (worse) than the average T-score of 50.0 for the general population. The average scores for the PROMIS Cognitive Function, Global Physical Health, and Global Mental Health domains ranged from 44.7 to 46.3, which are slightly lower (worse) than the average for the general population. Finally, PGIS ratings showed that most study participants (66.7%) reported None/Mild symptoms, and the average GSRS total score was 2.5.
Floor effects ranging from 18.2% to 57.6% were seen for the FCS symptom items in the FCS-SIS (Table S-1 and Supplementary Material). These results suggest floor effects occurring for 3 of the 4 symptom items, as the percentage of patients selecting the lowest response option (0 = no symptom) was greater than 18.2% for all items except that measuring Physical Fatigue, which was exactly 18.2%. There were no ceiling effects observed for any symptom item. The relatively low symptom burden demonstrated by this cross-sectional sample was expected due to the episodic nature of FCS symptoms. While no floor effect was observed for the impact items (< 40% of patients selected the lowest response category [0 = None] for all items), there was a ceiling effect for the impact item measuring Worry About Being a Burden, for which 42.4% of respondents selected the highest response option (4 = Always). Similar findings were seen in the descriptive statistics results for the FCS symptom items with a 7-day recall period (Table S-2 and Supplementary Material), for which all items except Physical Fatigue showed floor effects, and no ceiling effects were observed. Although floor effects were still observed with the 7-day symptom recall items, the degree of magnitude (ie, the proportion of people choosing 0) was smaller than with the 24-hour recall.
FCS Structure and Reliability
Inter-item correlations between the FCS-SIS Symptom items ranged from 0.32 (Difficulty Thinking and Diarrhea) to 0.78 (Physical Fatigue and Difficulty Thinking), providing evidence that some symptoms, particularly physical fatigue and difficulty thinking, may co-occur with similar levels of severity (Table 4). Several symptom items were more strongly related to the impact items than the other symptom items. For example, Abdominal Pain was more strongly related to Worry About Pancreatitis Attack (r = 0.84) than the other symptom items. Corrected item-total correlations, which examined the relations between each symptom item and the symptom composite (with the target item removed), were satisfactory for all items, ranging from 0.45 (Diarrhea) to 0.82 (Physical Fatigue).
 |
Table 4 Familial Chylomicronemia Syndrome Symptom and Impact Scale Item Correlations (N = 32 to 33) |
Among the impact items, the strongest correlations were observed between Worry About Finances and Less Productive (r = 0.92) and between Worry About Being a Burden and Feeling Anxious in Social Situations Involving Food (r = 0.92). Several were greater than 0.80; however, the strong correlations generally observed among the impact items reflect the floor/ceiling effects previously described, rather than redundancy in the item content. Corrected item-total correlations, which examined the relations between each impact item and the impact composite (with the target item removed), were highly satisfactory for all items, ranging from 0.62 (Less Physically Attractive) to 0.85 (Feel Anxious in Social Situations Involving Food). The large Cronbach’s alpha coefficients for the FCS-SIS Symptom composite (0.84) and Impact composite (0.95) scores provided further evidence to support the internal consistency reliability of these composite scores.
Validity
Construct Validity
All a priori hypotheses regarding construct validity were supported by observed correlations (Box S-1 and Supplementary Material). Correlations between the FCS-SIS (symptom item and composite scores) and other PRO measures are presented in Table 5. Correlations between the 7-day recall FCS symptom items and other PRO measures are presented in Table 6.
 |
Table 5 Correlation Coefficients for Construct Validity for the Familial Chylomicronemia Syndrome Symptom and Impact Scale |
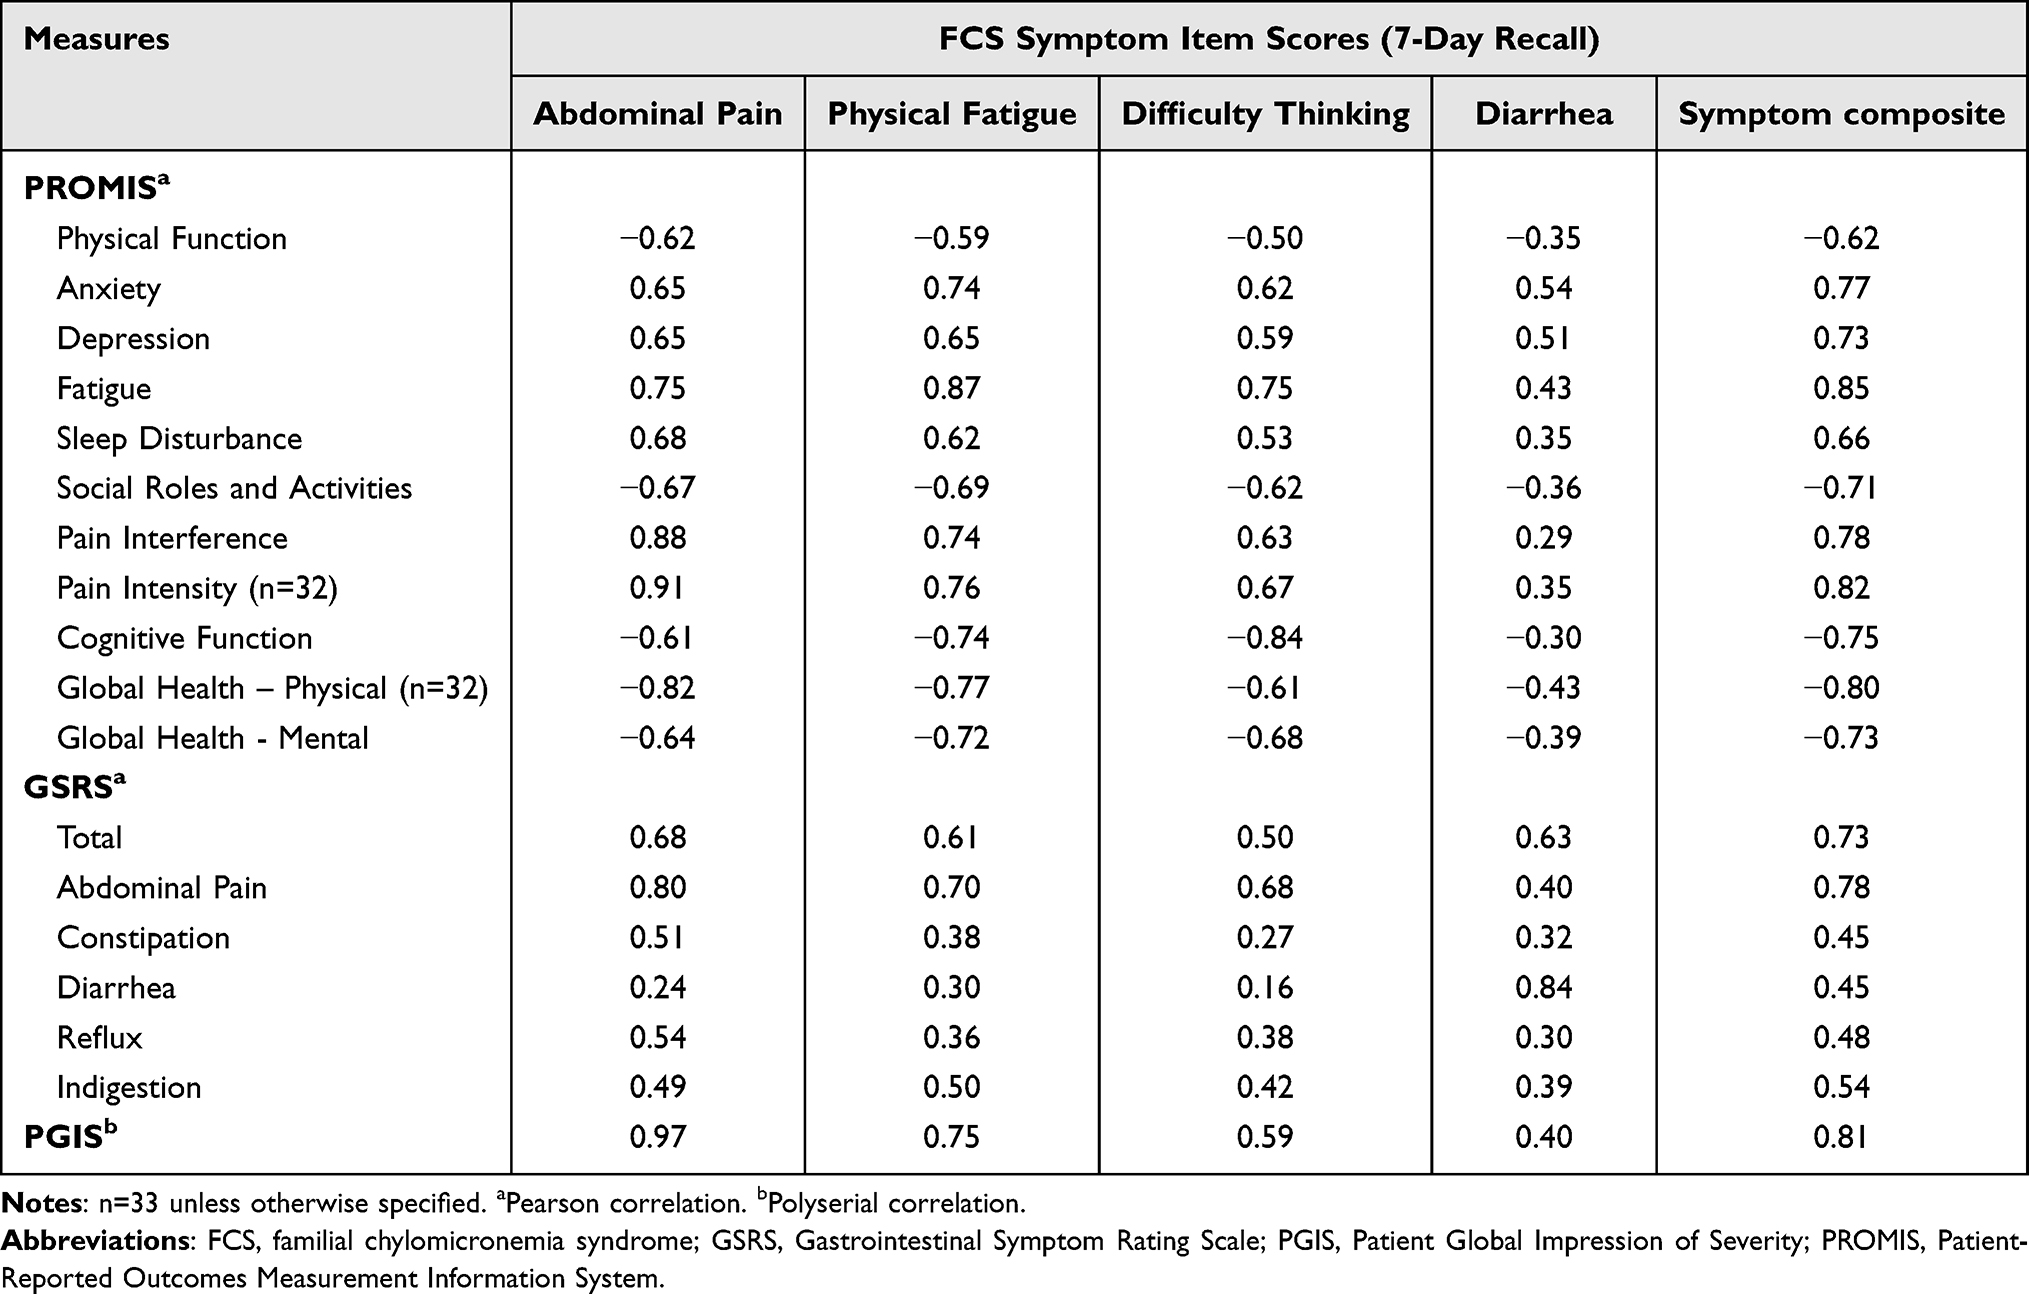 |
Table 6 Correlation Coefficients for Construct Validity Results for the 7-Day Recall Familial Chylomicronemia Syndrome Symptom Scores |
The FCS-SIS symptom items were highly correlated with the 7-day recall symptom items measuring the same constructs, with correlations ranging from 0.87 to 0.93 (Table 5). Strong positive correlations were observed between the FCS-SIS Abdominal Pain item and the GSRS Abdominal Pain subscale score (0.60), and between the FCS-SIS Diarrhea item and the GSRS Diarrhea subscale score (0.85) (Table 5). Weak-to-moderate correlations (ranging from 0.25 to 0.39) were seen between the FCS-SIS Abdominal Pain and Diarrhea item scores and the GSRS Constipation, Indigestion, and Reflux subscale scores (Table 5). A similar trend was seen with the 7-day recall FCS Symptom items for Abdominal Pain and Diarrhea (Table 6), and the magnitude of the correlations was generally higher than that of the 24-hour recall items as expected due to the match of recall period with other measures.
Strong negative correlations were seen between the Difficulty Thinking items and the PROMIS Cognitive Function score, with a correlation of −0.84 observed for the 7-day recall item and a correlation of −0.72 observed for the FCS-SIS (24-hour recall) item. Correlations of slightly smaller magnitudes (range of absolute values: 0.68 to 0.75) were seen between the Difficulty Thinking item scores (FCS-SIS and 7-day recall) and other PROMIS and GSRS scores compared with that between the Difficulty Thinking item scores and the PROMIS Cognitive Function score. As expected, strong positive correlations were observed between the Physical Fatigue items and the PROMIS-29 Fatigue score, with a correlation of 0.87 observed with the 7-day recall item and a correlation of 0.82 observed with the FCS-SIS item. Smaller correlations (range of absolute values: 0.76 to 0.77) were seen between the Physical Fatigue item scores (7-day recall and FCS-SIS) and other PROMIS and GSRS scores than between the Physical Fatigue item scores and the PROMIS-29 Fatigue score.
Strong positive correlations were seen between the FCS symptom composite scores and the PGIS score, with a correlation of 0.81 observed with the composite based on the 7-day recall items and a correlation of 0.72 observed with the FCS-SIS Symptom composite. The FCS-SIS Symptom composite score (24-hour recall) was also strongly correlated with other PROMIS scores, including Global Physical Health (−0.73), Pain Interference (0.74), Pain Intensity (0.77), Fatigue (0.77), and Anxiety (0.78). Similar strong correlations were seen between the symptom composite score based on the 7-day recall items and these PROMIS scores. Finally, there were strong negative correlations between the FCS-SIS Impact composite score and the PROMIS Global Physical Health score (−0.67) and Global Mental Health Score (−0.83). Similar strong correlations in expected directions were seen between the FCS-SIS Impact composite score and the PROMIS 29 Anxiety (0.82), Depression (0.70), and Social Roles and Activities scores (−0.91).
Known Groups Validity
The known-groups validity results for the FCS-SIS and the 7-day recall versions of the FCS symptom items are presented in Table 7. As hypothesized, the symptom composite scores (FCS-SIS and 7-day recall) were significantly higher (P < 0.0001) among participants who reported Moderate/Severe/Very Severe symptoms on the PGIS than they were for those who reported No/Mild symptoms. Very large effect sizes (Cohen’s ds of 1.76 and 2.14 for the FCS-SIS and 7-day recall versions, respectively) supported the discriminating ability of the symptom composite scores. Also, as hypothesized, the Impact composite score was significantly higher (P = 0.0083) among participants who reported Moderate/Severe/Very Severe symptoms on the PGIS than it was among those who reported No/Mild symptoms. A Cohen’s d of 1.12 also demonstrated that the magnitude of differences between the 2 groups was large for the Impact composite score.
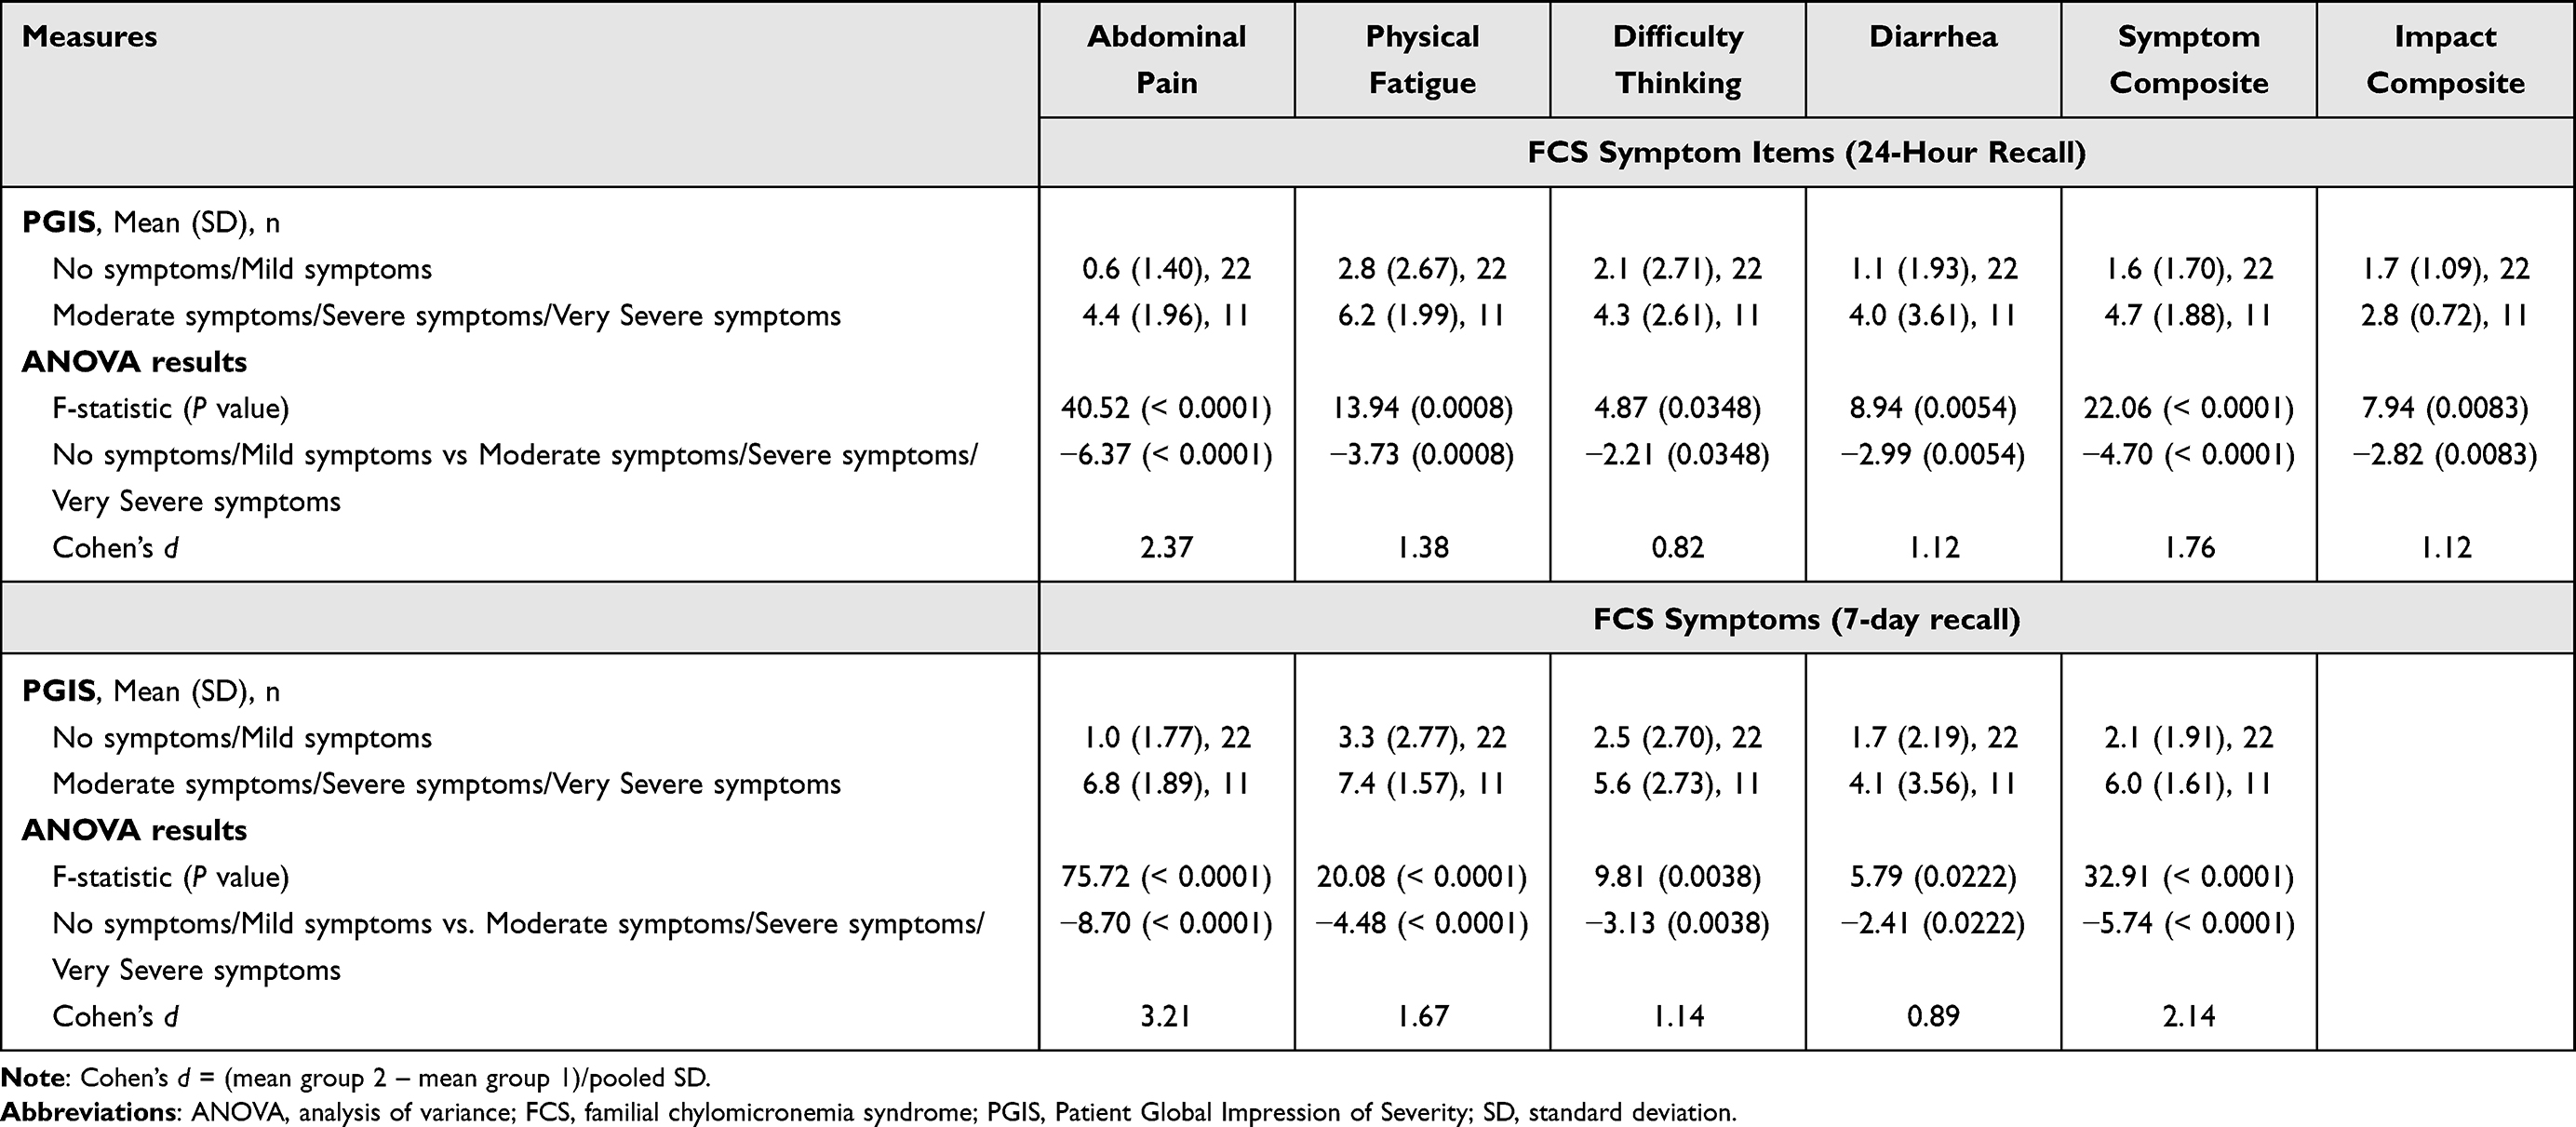 |
Table 7 Known Groups Results for the Familial Chylomicronemia Syndrome Symptom and Impact Scale |
Criterion Validity
Correlations between retrospective clinical markers of FCS severity and both FCS-SIS and 7-day recall symptom item scores are presented in Table 8. The number of participant-reported pancreatitis attacks in the past year was most strongly correlated (ρ = 0.77) with the 7-day recall item addressing the severity of abdominal pain. Additionally, the most recent participant-reported triglyceride level was more strongly correlated with the FCS-SIS Impact composite score (0.65) than with the FCS-SIS Symptom composite score (0.36).
 |
Table 8 Correlations Between Familial Chylomicronemia Syndrome Symptom and Impact Composite Scores and Clinical Characteristics |
Discussion
To facilitate its use in FCS clinical studies, the FCS-SIS7 was developed in accordance with FDA guidance for the use of PRO measures to support product approval and labeling claims.8,9 To our knowledge, the FCS-SIS is the first FCS-specific PRO measure designed based on patient input as recommended for best practice. The findings presented here provide support for the scoring, reliability, and validity of the FCS-SIS in capturing the severity and impacts of FCS symptoms.
The computation of both the Symptom and Impact composite scores is supported not only by the measure’s conceptual framework (Figure 1) but also by the results of internal consistency analyses. The correlational analyses of the FCS-SIS with other PRO measures for FCS provided solid support for the construct validity of both the item and composite FCS-SIS scores. Composite scores based on both the FCS-SIS 24-hour recall and 7-day recall variants of the symptom items (estimates of FCS-SIS weekly average scores) were significantly and substantially higher among participants who reported Moderate/Severe/Very Severe symptoms on the PGIS compared with those who reported No/Mild symptoms. The findings from the known-groups validity analyses supported the discriminating ability of the item and composite scores, while the correlations between FCS-SIS items and clinical events or outcomes (pancreatitis attacks and triglyceride level) provided initial support for the criterion validity of these scores.
Although the study sample was not large enough to produce generalizable results regarding symptom prevalence, the results are consistent with those of prior research. While in Fox et al,3 the mean age of participants was younger (44.2 versus our 49.8 years), T-scores for PROMIS measures were relatively similar, with no differences in scores exceeding 3 points. Participants in both Fox et al3 and in our study presented with multiple symptoms that showed increased fatigue and abdominal pain and detriments in cognitive function in patients with FCS compared with the general population. The small sample size is also a limitation of the psychometric evaluation; however, the use of multiple PRO measures allowed the testing of numerous hypotheses through the collection of multiple data points per participant. Future research would support additional validation properties, such as factor analysis to further test the structure of the measure.
While most item-level descriptive statistics revealed no concerns and frequency distributions supported the appropriateness of the response categories, several symptom items displayed floor effects that could potentially compromise their responsiveness to detect deterioration in FCS symptoms. Although the symptoms experienced were mild, these symptoms were experienced on a daily basis, with 93.9% of patients reporting at least 1 symptom in the past 30 days and 84.9% reporting at least 2 symptoms in the past 30 days. Additionally, 75.8% of patients said they had at least 2 symptoms in the last 24 hours regardless of severity. Furthermore, the FCS-SIS is intended for use in clinical studies likely to involve patients with FCS symptoms at study initiation, and these items were initially developed based on input from patients who described these symptoms as important. As such, item reduction based solely on the results of this cross-sectional evaluation would not be prudent.
To further support use of this measure in regulatory decision making, an additional psychometric evaluation using longitudinal data should be conducted to confirm and extend the evidence presented here regarding the measurement properties of the FCS-SIS. Various approaches for using the FCS-SIS item- and composite-level scores could be explored and their responsiveness compared. Such an evaluation could also include the estimation of thresholds for meaningful within-patient change (responder thresholds) to facilitate the interpretation of changes in individual symptom and composite-level scores. There may also be value in examining the impact of a new treatment on individual symptoms of FCS.
Conclusion
This study provides evidence to support the reliability and validity of both item- and composite-level scores derived from the FCS-SIS. Coupled with the existing qualitative data and rigorous development process,7 the quantitative evidence generated in this study provides preliminary support for use of the FCS-SIS to evaluate disease impact and the efficacy of new treatments for FCS. A longitudinal psychometric evaluation, intended to confirm the measure’s responsiveness and identify thresholds for meaningful within-patient change using clinical trial data, would be beneficial to support use of the FCS-SIS in drug development and real-world evidence generation.
Data Sharing Statement
Data may be available from Ionis Pharmaceuticals upon reasonable request. Inquires may be sent to Ionis Pharmaceuticals ([email protected]).
Ethics Approval and Consent to Participate
The study materials were reviewed by the Advarra Institutional Review Board (IRB) and subsequently received an exempt determination. Sites requiring a local or academic IRB were responsible for their own IRB submission based on the study materials. Study participants provided consent to participate. Research was conducted in line with the Belmont Report and the Declaration of Helsinki.
Acknowledgments
The authors thank Brian Samsell, PhD, and Sara Musetti Jenkins, PhD, of RTI Health Solutions, for medical writing assistance. We also thank Nikki Williams, BS, and Emily Bratlee-Whitaker, PhD, RN, of RTI Health Solutions, for analytic support. We gratefully acknowledge the patients who participated in this research.
Author Contributions
All authors declare that they have made a significant contribution to the work reported, whether that is in the conception, study design, execution, acquisition of data, analysis and interpretation, or in all these areas; have drafted or written, or substantially revised or critically reviewed the article; have agreed on the journal to which the article will be submitted; have reviewed and agreed on all versions of the article before submission, during revision, the final version accepted for publication, and any significant changes introduced at the proofing stage; and agree to take responsibility and be accountable for the contents of the article.
Funding
Ionis Pharmaceuticals provided the financial support for the study. RTI Health Solutions, an independent nonprofit research organization, received funding under a research contract with Ionis Pharmaceuticals to conduct this study and provide publication support in the form of manuscript writing, styling, and submission.
Disclosure
TMB and SF are full-time employees of RTI Health Solutions, an independent nonprofit research organization, which was retained by Ionis Pharmaceuticals to conduct the research which is the subject of this manuscript. Their compensation is unconnected to the studies on which they work. CK was an employee of RTI Health Solutions at the time the research was conducted. MVL, ASK, and AY are employees of Ionis Pharmaceuticals and hold shares and/or stock options in the company. The authors report no other conflicts of interest in this work.
References
1. Regmi M, Rehman A. Familial Hyperchylomicronemia. Syndrome: StatPearls; 2022.
2. Pallazola VA, Sajja A, Derenbecker R, et al. Prevalence of familial chylomicronemia syndrome in a quaternary care center. Eur J Prev Cardiol. 2020;27(19):2276–2278. doi:10.1177/2047487319888054
3. Fox RS, Peipert JD, Vera-Llonch M, et al. PROMIS® and Neuro-QoL TM measures are valid measures of health-related quality of life among patients with familial chylomicronemia syndrome. Expert Rev Cardiovasc Ther. 2020;18(4):231–238. doi:10.1080/14779072.2020.1748011
4. Brahm AJ, Hegele RA. Chylomicronaemia--current diagnosis and future therapies. Nat Rev Endocrinol. 2015;11(6):352–362. doi:10.1038/nrendo.2015.26
5. Davidson M, Stevenson M, Hsieh A, et al. The burden of familial chylomicronemia syndrome: interim results from the IN-FOCUS study. Expert Rev Cardiovasc Ther. 2017;15(5):415–423. 20170404. doi:10.1080/14779072.2017.1311786
6. Davidson M, Stevenson M, Hsieh A, et al. The burden of familial chylomicronemia syndrome: results from the global IN-FOCUS study. J Clin Lipidol. 2018;12(4):898–907 e892. 20180426. doi:10.1016/j.jacl.2018.04.009
7. Davidson D, Slota C, Vera-Llonch M, et al. Development of a novel PRO instrument for use in familial chylomicronemia syndrome. J Patient Rep Outcomes. 2021;5(1):
8. Food and Drug Administration (FDA). Guidance for industry patient-reported outcome measures: use in medical product development to support labeling claims; 2009. Available from: http://www.fda.gov/downloads/Drugs/GuidanceCompliance.RegulatoryInformation/Guidances/UCM193282.pdf.
9. Food and Drug Administration (FDA). Patient-focused drug development (PFDD) guidance: methods to identify what is important to patients & select, develop or modify fit-for-purpose clinical outcomes assessments. Attachment to guidance 3 discussion document–appendices; 2018. Available from: https://www.fda.gov/media/116277/download.
10. Wild D, Grove A, Martin M, et al. Principles of good practice for the translation and cultural adaptation process for patient-reported outcomes (PRO) Measures: report of the ISPOR task force for translation and cultural adaptation. Value Health. 2005;8(2):94–104. doi:10.1111/j.1524-4733.2005.04054.x
11. Cella D, Yount S, Rothrock N, et al. The patient-reported outcomes measurement information system (PROMIS): progress of an NIH roadmap cooperative group during its first two years. Med Care. 2007;45(5 Suppl 1):S3–S11. doi:10.1097/01.mlr.0000258615.42478.55
12. Svedlund J, Sjodin I, Dotevall G. GSRS--A clinical rating scale for gastrointestinal symptoms in patients with irritable bowel syndrome and peptic ulcer disease. Dig Dis Sci. 1988;33(2):129–134. doi:10.1007/BF01535722
13. Revicki DA, Wood M, Wiklund I, et al. Reliability and validity of the gastrointestinal symptom rating scale in patients with gastroesophageal reflux disease. Qual Life Res. 1998;7(1):75–83. doi:10.1023/a:1008841022998
14. Cohen J. A power primer. Psychol Bull. 1992;112(1):155–159. doi:10.1037//0033-2909.112.1.155
15. Kline P. A Handbook of Test Construction: Introduction to Psychometric Design. New York: Methuen & Co; 1986.
16. Cronbach LJ. Coefficient alpha and the internal structure of tests. Psychometrika. 1951;16(3):297–334. doi:10.1007/bf02310555
17. Streiner DL, Norman GR. Health Measurement Scales: A Practical Guide to Their Development and Use.
18. Cohen J. Statistical Power Analysis for the Behavioral Sciences.
 © 2024 The Author(s). This work is published and licensed by Dove Medical Press Limited. The
full terms of this license are available at https://www.dovepress.com/terms
and incorporate the Creative Commons Attribution
- Non Commercial (unported, 3.0) License.
By accessing the work you hereby accept the Terms. Non-commercial uses of the work are permitted
without any further permission from Dove Medical Press Limited, provided the work is properly
attributed. For permission for commercial use of this work, please see paragraphs 4.2 and 5 of our Terms.
© 2024 The Author(s). This work is published and licensed by Dove Medical Press Limited. The
full terms of this license are available at https://www.dovepress.com/terms
and incorporate the Creative Commons Attribution
- Non Commercial (unported, 3.0) License.
By accessing the work you hereby accept the Terms. Non-commercial uses of the work are permitted
without any further permission from Dove Medical Press Limited, provided the work is properly
attributed. For permission for commercial use of this work, please see paragraphs 4.2 and 5 of our Terms.