Back to Journals » Diabetes, Metabolic Syndrome and Obesity » Volume 16
Cross-Sectional Association Between Body Fat Composition and Biomarkers of Inflammation and Endothelial Dysfunction in Children with Overweight/Obesity
Authors Yasin J ![]() , Sharma C, Hashim MJ
, Sharma C, Hashim MJ ![]() , Al Hamed S, AlKaabi J
, Al Hamed S, AlKaabi J ![]() , Aburawi EH
, Aburawi EH ![]()
Received 16 September 2022
Accepted for publication 27 January 2023
Published 17 February 2023 Volume 2023:16 Pages 483—493
DOI https://doi.org/10.2147/DMSO.S390071
Checked for plagiarism Yes
Review by Single anonymous peer review
Peer reviewer comments 2
Editor who approved publication: Professor Gian Paolo Fadini
Javed Yasin,1,* Charu Sharma,1,* Muhammad Jawad Hashim,2 Sania Al Hamed,3 Juma AlKaabi,1 Elhadi H Aburawi3
1Department of Internal Medicine, College of Medicine and Health Sciences, United Arab Emirates University, Al Ain, 15551, United Arab Emirates; 2Departments of Family Medicine, College of Medicine and Health Sciences, United Arab Emirates University, Al Ain, 15551, United Arab Emirates; 3Department of Pediatrics, College of Medicine and Health Sciences, United Arab Emirates University, Al Ain, 15551, United Arab Emirates
*These authors contributed equally to this work
Correspondence: Elhadi H Aburawi; Juma AlKaabi, Email [email protected]; [email protected]
Background: Childhood obesity is most prevalent nutritional disorder worldwide. Studies on clinical correlations between body fat (BF) composition, lipid profile, inflammatory biomarkers, and endothelial dysfunction (ED) parameters in children from United Arab Emirates (UAE) are limited. Therefore, we aimed to study obesity pattern in children and determine clinical correlations with biomarkers.
Methods: Children (6– 13 years) from different schools were divided into obese, overweight, and normal groups based upon Centers for Disease Control and Prevention weight-for-age centiles study (n=166). Anthropometric, BF composition, lipid profile, inflammatory, and ED biomarkers were determined and analyzed using SPSS software.
Results: The mean age and weight ± SD of participants were 10.6 ± 2.6 years and 48.2 ± 19.5 kg with 65% as overweight or obese. In normal, overweight, and obese group male were 40 (70.2%), 35 (67.3%), and 40 (70.2%) and female were 17 (29.8%), 17 (32.7%) and 17 (29.8%). There was significant difference in age (p< 0.01), height (p< 0.01), weight (p< 0.01) among groups. Obesity markers (MCP-1, leptin, adiponectin) showed positive correlation with age, height, weight, WC, BF%, body fat mass (BFM), body muscle mass (BMM). A significant correlation (all p< 0.01) of BMM with SBP (r=0.412), DBP (r=0.255), MCP-1 (r=0.558), adiponectin (r=0.635), hs-CRP (r=0.263), IL-6 (r=0.348), TNF-alpha (r=0.370), ICAM-1 (r=0.237), and VCAM-1 (r=0.343). The inflammatory markers (ICAM-1, VCAM-1) showed significant correlations with age, height, weight, WC, BF%, BFM, BMM. Leptin significantly (all p< 0.01) correlated with age (r=0.470), height (r=0.423), weight (r=0.677), WC (r=0.606), BF (r=0.700), BFM (r=0.752), and BMM (r=0.524) and negatively correlated with TBW (r=− 0.701). Adiponectin also showed a significant (all p< 0.01) positive correlation with age, height, weight, WC, BF, BFM, and BMM.
Conclusion: A strong association between BF composition, lipid profile, and inflammatory and ED biomarkers was observed in the study. Thus, immediate measures should be implemented to reduce risk of obesity and associated diseases.
Keywords: body fat, inflammation, endothelial dysfunction, obesity, children
Introduction
Obesity is the extreme accumulation of fat in the body, which negatively affects health and leads to multiple complications.1 The Centers for Disease Control and Prevention (CDC) defined overweight status in children as body mass index (BMI) > 85th and < 95th percentile and obesity as a BMI of >95th percentile.2 In United Arab Emirates (UAE), prevalence of overweight and obese populations is seen in both sexes among those aged 9–18 years.3 Another population-based study showed an alarming steady linear upsurge in obesity with age, especially among boys.4
There are various contributors to the childhood obesity epidemic; therefore, awareness of different relevant factors helps in prevention. Among the various factors, socioeconomic and psychological factors are the main contributors to childhood obesity. Children consuming a high-calorie diet with inadequate physical activity are prone to childhood obesity.5 In addition, due to economic development, there is an increased demand for a fat-rich diet, which leads to high energy intake, childhood obesity, and other diseases. Children with obesity are at high risk of developing cardiovascular (CV) diseases, type 2 diabetes (T2D), and cancer.6 Several studies have reported that childhood obesity is an issue of public concern and requires continuous surveillance.7,8 Thus, it is necessary to be more vigilant about childhood obesity, as it has many consequences on children’s well-being.9
Studies have shown that obesity, a feature of metabolic syndrome (MS), is associated with chronic inflammation in individuals with obesity. In addition, adipose tissue-derived proinflammatory cytokines lead to the progression of various CV disorders independent of BMI through the production of chronic low-grade inflammation.10 Adipose tissue is implicated in the production and release of various cytokines and hormone-like proteins, such as tumor necrosis factor-alpha (TNF-α), interleukin-6 (IL-6), and monocyte chemoattractant protein-1 (MCP-1). Most of these mediators are involved in the activation of inflammatory pathways.6 Obesity is often associated with metabolic disorders such as dyslipidemia, hypertension (HT), insulin resistance, and an increased risk of CV diseases.11 Cardiometabolic risk factors, such as triglycerides (TG), total cholesterol (TC), and blood glucose (BG), are high in school-aged children with obesity. Furthermore, this metabolic derangement is probably due to a family history of obesity, an unhealthy diet, and an inactive lifestyle.12
A study among adolescent school athletes in Georgia and Alabama aged 18 years or older showed that correct body composition data are more valuable than BMI for providing proper diet, activity guidelines, and prevention of psychological challenges related to obesity.13 The study reported that there is an increase in BF% with lower BMI compared to Caucasians, and body fat (BF) increased over two decades.14 Compared to the white European population, Asian populations with high BF% with the same age, sex, and BMI have a higher prevalence of T2D and increased CV risk at lower BMI values.15
However, studies on clinical correlations between BF composition, lipid profile, inflammatory biomarkers, and endothelial dysfunction (ED) parameters in children from United Arab Emirates (UAE) are limited. Therefore, we aimed to determine association between body fat composition with inflammatory and endothelial dysfunction biomarkersin children with overweight/obesity.
Methods
Study Population
This study was conducted among the different schools between 2017 and 2018 in Al Ain, Abu Dhabi Emirate of UAE, with 166 male and female participants. This study was approved by the Al Ain Medical District Human Research Ethics Committee (approval number #ERH-2017-3236 15–112). After, receiving approval from the Abu Dhabi Education Council and the Al Ain Medical District Human Research Ethics Committee, we approached different schools according to the target age of participants. The schools which showed interest to participate in study after the approval were coded for participant selection. The participants were selected only their enthusiasm to contribute in study and their age, weight and BMI matching. Informed consent was obtained from the parents of all recruited participants involved in this study. The study was carried out according to the principles of the “Declaration of Helsinki”.16
A minimum sample size of 100 children was calculated based on an estimated prevalence of 60% (0.6) overweight status or obesity, with a total width of 0.2 of the 95% confidence intervals. The total study sample was extended to allow exploratory subgroup analyses. Trained research team members were involved in anthropometric measurements and structured interviews with the participants. We determined their height and weight using a digital scale stadiometer. Participants were asked to stand straight with their heads, backs, and buttocks vertically aligned to the height gauge; their heights were then taken and rounded to the nearest 0.5 cm. Waist circumference (WC) was measured with upstretched tapes, midpoint between the bottom of the rib cage and the tip of the iliac crest, BMI was calculated.17 Blood pressure (BP) was measured using a calibrated Omron M6 IntelliSense (Healthcare, Kyoto, Japan) automatic BP monitor, and the sleeves were suitable for each arm size. The measurements were also performed after the children had rested for five minutes in an air-conditioned environment, and three BP measurements were taken on the right arm with a five-minute interval between them. The average of these three measurements was registered.12 The body fat composition, and electrical impedance or BF% using the Tanita Body composition analyzer TBF-300. Tanita was used to determine body composition, including BF, body fat mass (BFM) (kg), fat-free mass (FFM), body muscle mass (BMM), and total body water (TBW). Gender-specific BMI growth charts (US Centers for Disease Control and Prevention, CDC) were used to identify overweight (BMI ≥85th centile and <95th centile), obese (BMI ≥95th centile and <99th percentile) and extremely obese (BMI≥99th percentile) participants.18 These were compared to standardized percentiles. BMI was also determined according to the International Obesity Task Force (IOTF) and World Health Organization (WHO) criteria: Thin <5th centiles; normal 5th to <85th centiles; overweight 85th to <95th centiles; obese 95th to <98th centiles; and extremely-obese ≥98th centiles.2
Whole blood levels of hemoglobin A1c (HbA1c), blood glucose (BG), lipid profile, high-sensitivity C-reactive protein (hs-CRP), and gamma-glutamyl transferase (GGT) were measured using an automated analyzer Integra 400 Plus (Roche Diagnostics, Germany). Enzyme-linked immunosorbent assays from R & D were used to measure the obesity markers leptin: DLP00, monocyte chemoattractant Protein-1 (MCP-1: DCP00), adiponectin: DRP300, inflammatory markers: endothelin 1 (ET-1: DET100), interleukin 6 (IL-6: D6050), tumor necrosis factor-alpha (TNF-α: DTA00D), soluble intercellular adhesion molecule-1 (sICAM-1: DCD540), and vascular cell adhesion molecule 1 (VCAM-1: DVC00) following the manufacturer’s protocols.
Statistical Analysis
Study data were analyzed using the current version of the SPSS software (IBM SPSS release 28, IBM Inc., Armonk, NY). The initial approach to the analysis included descriptive measures, bivariate correlations, and data visualization. Subsequent analyses included one-way ANOVA to compare the study groups, bivariate correlation coefficients, and multiple linear regression. The missing data was not imputed. An alpha level of 0.05 was pre-specified as the cut-off for statistical significance.
Results
A total of 166 children were enrolled in this study. The mean age was 10.6 years (standard deviation [SD], 2.6), ranging from 6 to 15.9 years, and 115 (69.3%) were male. In normal, overweight, and obese groups, males were 40 (70.2%), 35 (67.3%), and 40 (70.2%) and female were 17 (29.8%), 17 (32.7%) and 17 (29.8%). Parental consanguinity was present in 59 children (35.5%). None of the participants reported smoking cigarettes. The mean SBP and DBP were within the normal range, whereas HbA1C values were mostly within normal levels. The baseline characteristics of the study participants are presented in Table 1.
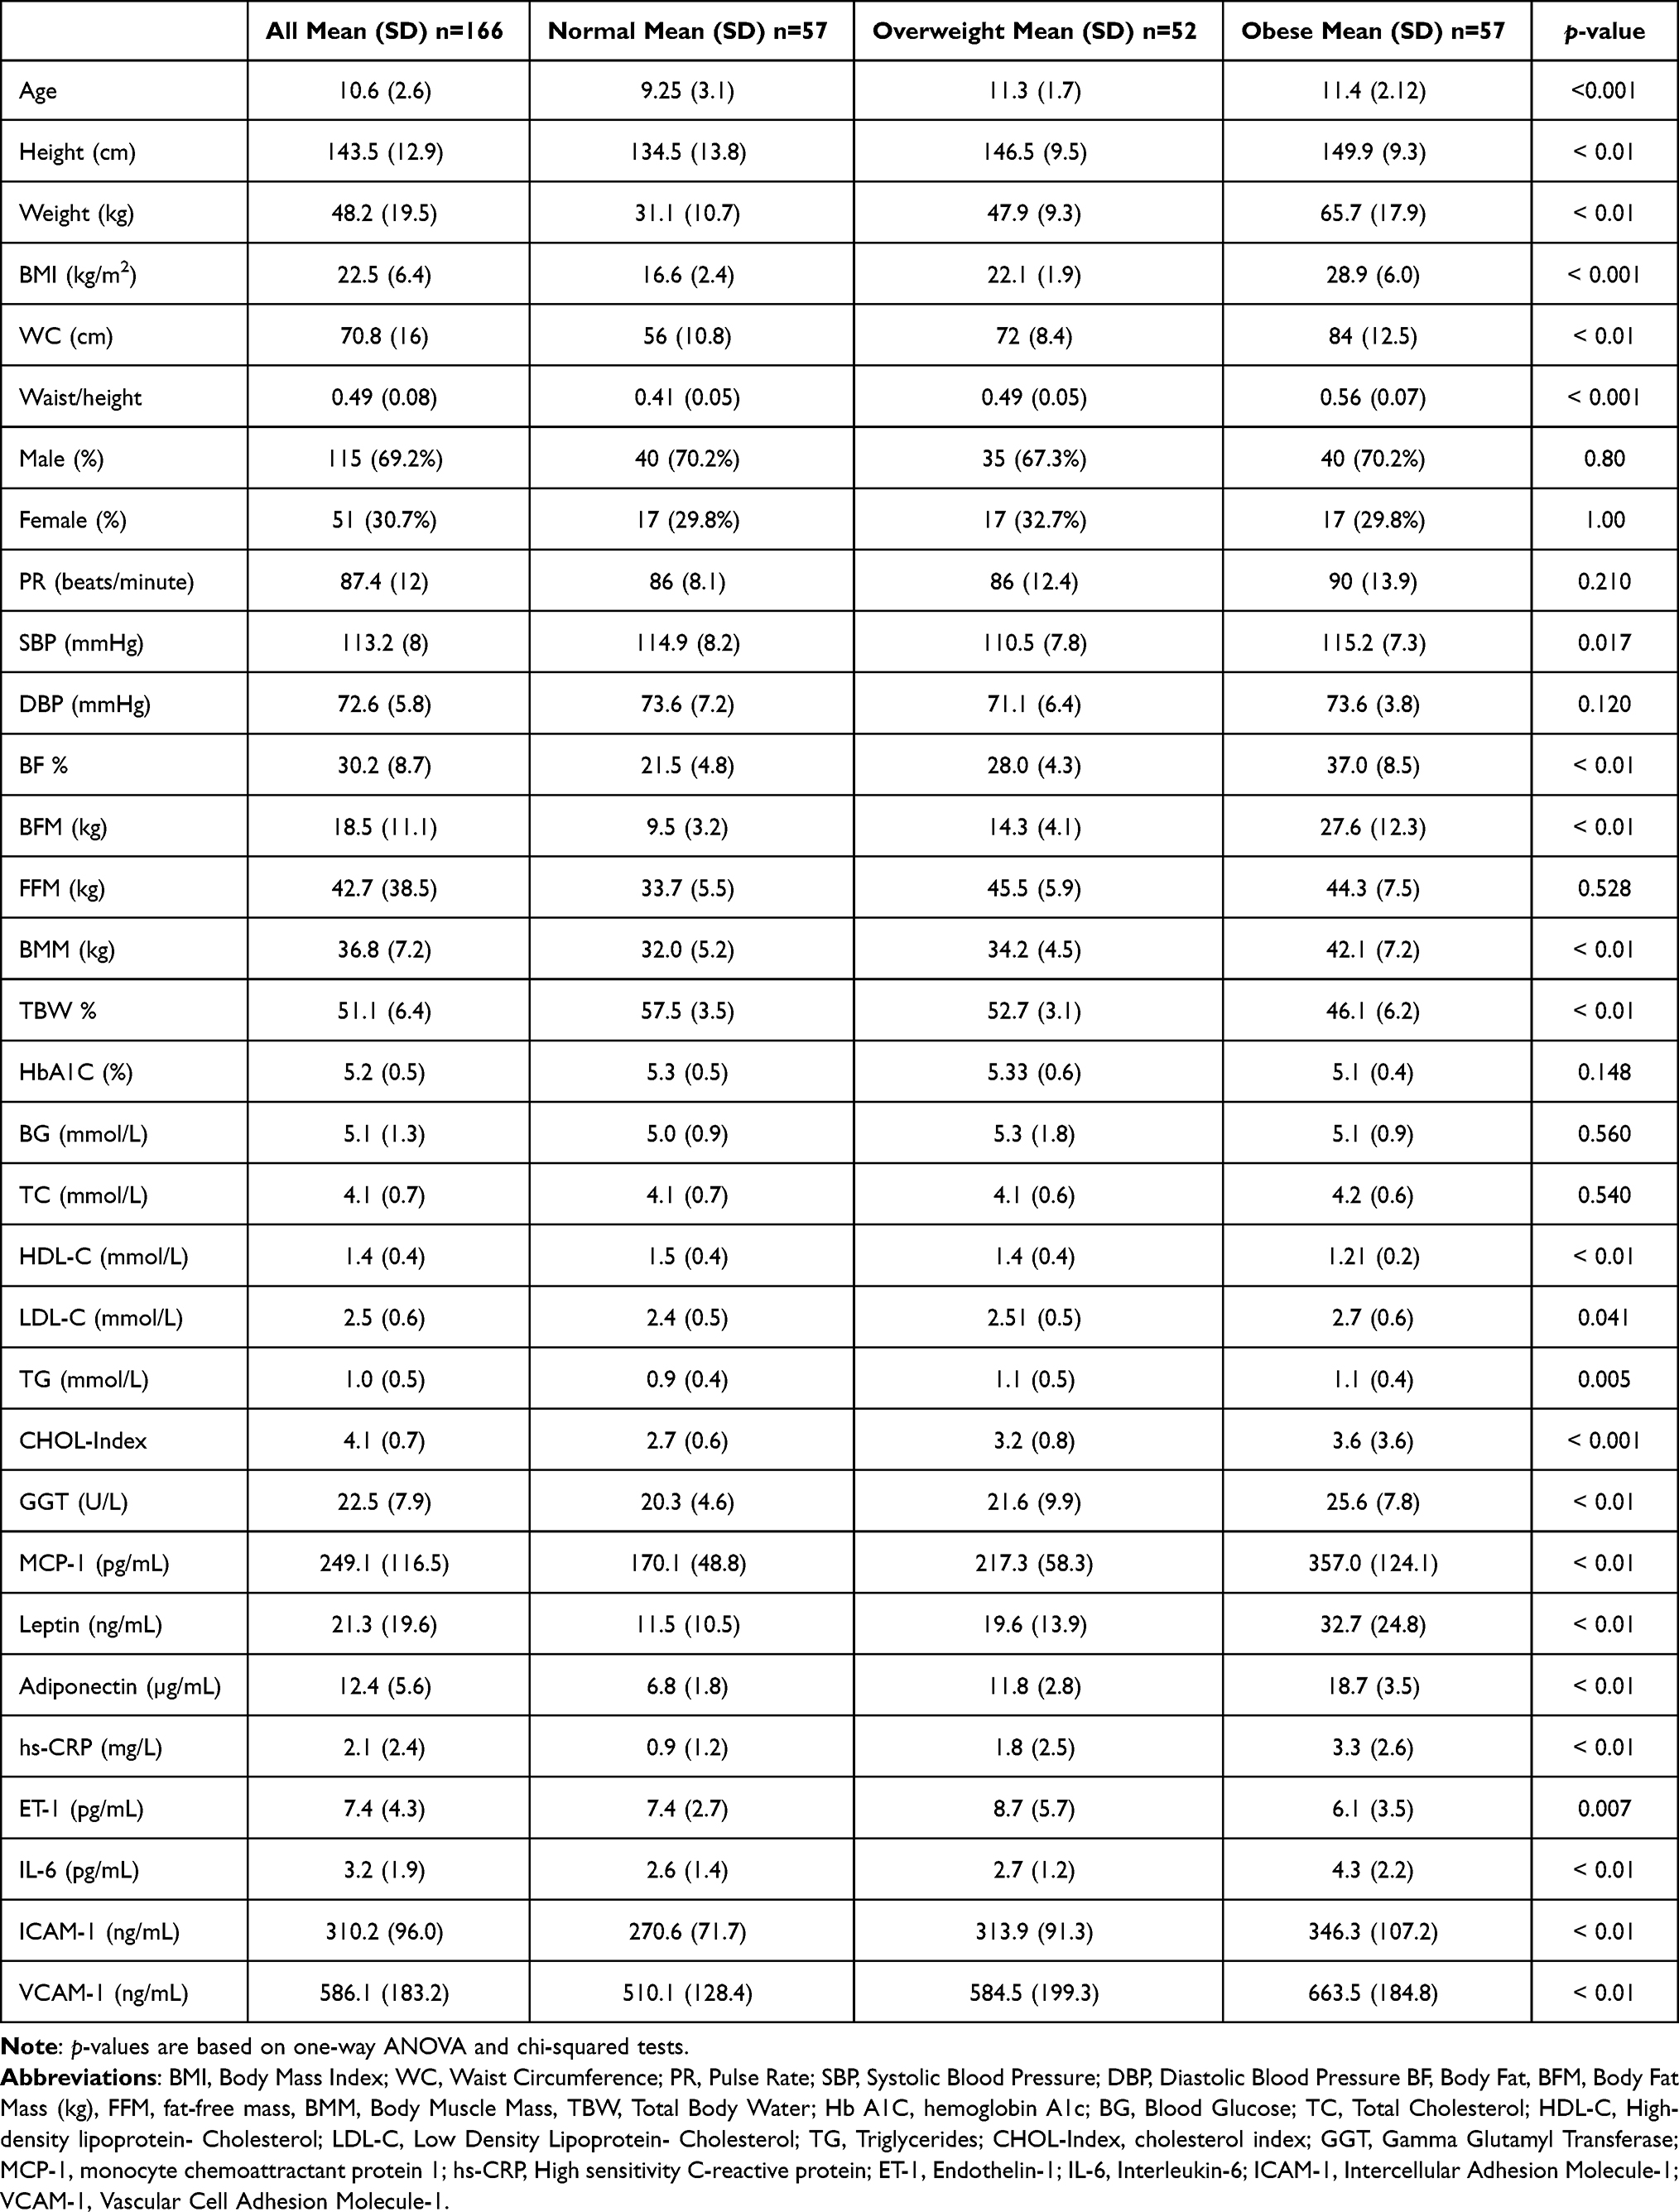 |
Table 1 Clinical, Metabolic, and Biochemical Parameters Across the Study Groups (n = 166) |
Obesity Classification
The study participants were divided into three groups (normal, overweight, and obese) based on the CDC weight-for-age centile classification (Table 1). The mean ages of the normal, obese, and overweight children were 9.2 ±3.1 years, 11.3 ±1.7 years, and 11.4 ±2.1 years, respectively. The CDC classification used in the study showed that approximately one-third (34.3%) of the children were of normal weight, while the rest were overweight or obese. The proportion of normal-weight children was also 34.3% according to the IOTF scheme,19 while it was 31.9% based on the WHO classification system.
There was a significant difference in age (p < 0.01), height (p < 0.01), weight (p < 0.01), and WC (p < 0.01) in the groups as compared to normal participants. SBP (p = 0.017) showed a significant difference, whereas no difference was observed in DBP (p = 0.120) and PR (p = 0.210) between the groups. Regarding body fat composition among the groups, we observed a significant increase in BF (p < 0.01), BFM (p < 0.01), BMM (p < 0.01), TBW (kg) (p < 0.01), and TBW (%) (p < 0.01) in the groups compared with the normal group. The HbA1C and BG levels were comparable among the three groups.
The TC (p=0.540) was comparable, high-density lipoprotein cholesterol (HDL-C) (p < 0.01), low-density lipoprotein cholesterol (LDL-C) (p = 0.041), and TG (p = 0.005) showed significant difference among groups. The liver enzyme (GGT) showed a significant difference (p < 0.01), and the obesity markers MCP-1, leptin, and adiponectin also showed significant differences compared with normal participants. MCP-1 levels were significantly elevated in the obese group (p < 0.01). The leptin (p < 0.01) and adiponectin (p<0.01) levels were also significantly higher in the obese group. Inflammatory biomarkers (hs-CRP, ET-1, IL-6, TNF-α, ICAM-1, and VCAM-1) also showed significant differences among the groups. The hs-CRP levels were significantly (p < 0.01) elevated in the obese group compared to those in the normal group. ET-1 level was also significantly elevated (p = 0.007) in the overweight group compared to that in the normal group. IL-6, TNF-, ICAM-1, and VCAM-1 levels were significantly higher (p < 0.01, p < 0.01, p < 0.01, p < 0.01) in the obese and overweight groups than in the normal group (Table 1). The correlations of leptin and adiponectin between the different groups with gender were determined and tabulated in Table 2.
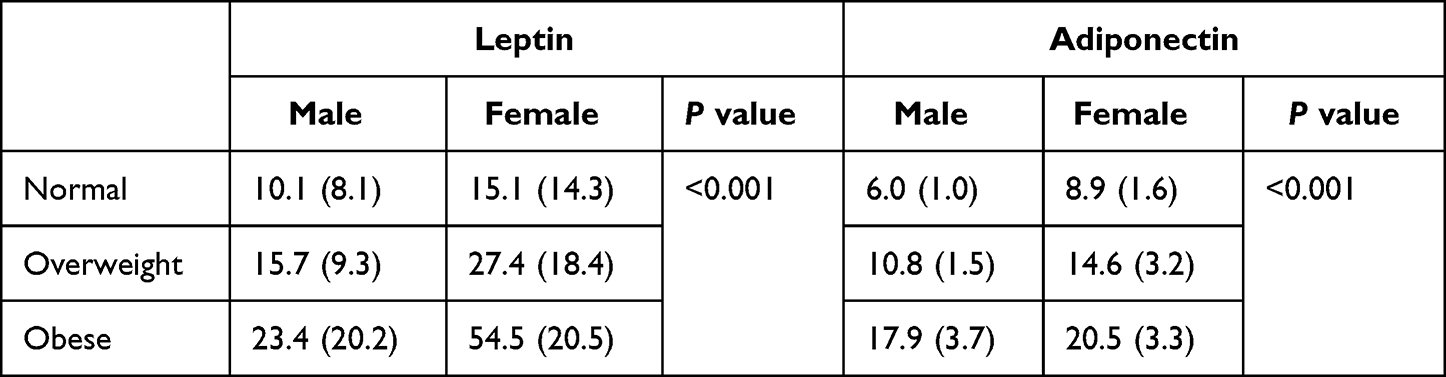 |
Table 2 Correlations of Leptin and Adiponectin Between the Different Groups with Gender |
Biomarker Associations
Adiponectin was the only biomarker that correlated with CDC weight-for-age percentiles (r = 0.69, p < 0.001). No other biomarkers showed a direct correlation with CDC weight-for-age percentiles. BF% significantly correlated with leptin (r = 0.70), MCP-1 (r = 0.728, p<0.01), and adiponectin (r = 0.813; all p < 0.001). The obesity biomarkers MCP-1, leptin, and adiponectin showed significant Pearson correlations with age, height, weight, WC, BF, BFM, BMM, and TBW (%). MCP-1 was significant positive correlation with age (r = 0.362, p<0.01), height (r = 0.382, p<0.01), weight (r = 0.739, p<0.01), WC (r = 0.643, p<0.01), BF (r = 0.728, p<0.01), BFM (r = 0.785, p<0.01), and BMM (r = 0.558, p<0.01), and a negative correlation with TBW (r = −0.729, p<0.01). Leptin was significantly positively correlated with age (r = 0.470, p<0.01), height (r = 0.423, p<0.01), weight (r = 0.677, p<0.01), WC (r = 0.606, p<0.01), BF (r = 0.700, p<0.01), BFM (r = 0.752, p<0.01), and BMM (r = 0.524) and negatively correlated with TBW (r = −0.701, p<0.01). Adiponectin also showed a significant positive correlation with age (r = 0.514), height (r = 0.572, p<0.01), weight (r = 0.856, p<0.01), WC (r = 0.803, p<0.01), BF (r = 0.813, p<0.01), BFM (r = 0.829, p<0.01), and BMM (r = 0.635, p<0.01) and a negative correlation with TBW (r = −0.813, p<0.01).
The lipid profile marker HDL-C showed a significant negative correlation with weight (r = −0.305), WC (r = −0.434, p<0.01), BF (r = −0.260, p<0.01), BFM (r = −0.262, p<0.01), and BMM (r = −0.296, p<0.01), and a positive correlation with TBW (r = 0.263, p<0.01). In TC did not show any significant with age (0.060, p=0.926), height (0.000, p=0.999), weight (−0.010, p=0.899), WC (−0.052, p=0.509), BF% (−0.034, p=0.745), BFM (−0.072, p=0.488), FFM (−0.050, p<0.001), BMM (−0.039, p=0.633), TBW% (0.037, p=0.719) except for. The LDL-C also did not show any significant correlation with age (0.071, p=0.366), height (0.092, p=0.238), weight (0.109, p=0.160), WC (0.108, p=0.164), BF% (0.046, p=0.656), BFM (0.000, p=0.998), FFM (−0.081, p=0.437), BMM (0.026, p=0.804), and TBW% (−0.043, p=0.679). TG showed a significant positive correlation with WC (r = 0.217, p<0.01) and BF (r = 0.208, p<0.01), and a significant negative correlation with TBW % (r = −0.208, p<0.01).
Among the inflammatory markers, hs-CRP, ICAM-1, and VCAM-1 significantly correlated with age, height, weight, WC, BF, BFM, BMM, and TBW (%). ET-1 did not show any correlation with body composition. IL-6 and TNF-α showed significant positive correlations with weight, BF, BFM, and BMM and a negative correlation with TBW (%). IL-6 showed a significant positive association with WC (r = 0.250, p<0.01), whereas TNF-α showed no association with WC (r = 0.132, p<0.01) (Table 3). All the biochemical assays performed were within the limits of variation <7.8% both inter and intra assay.
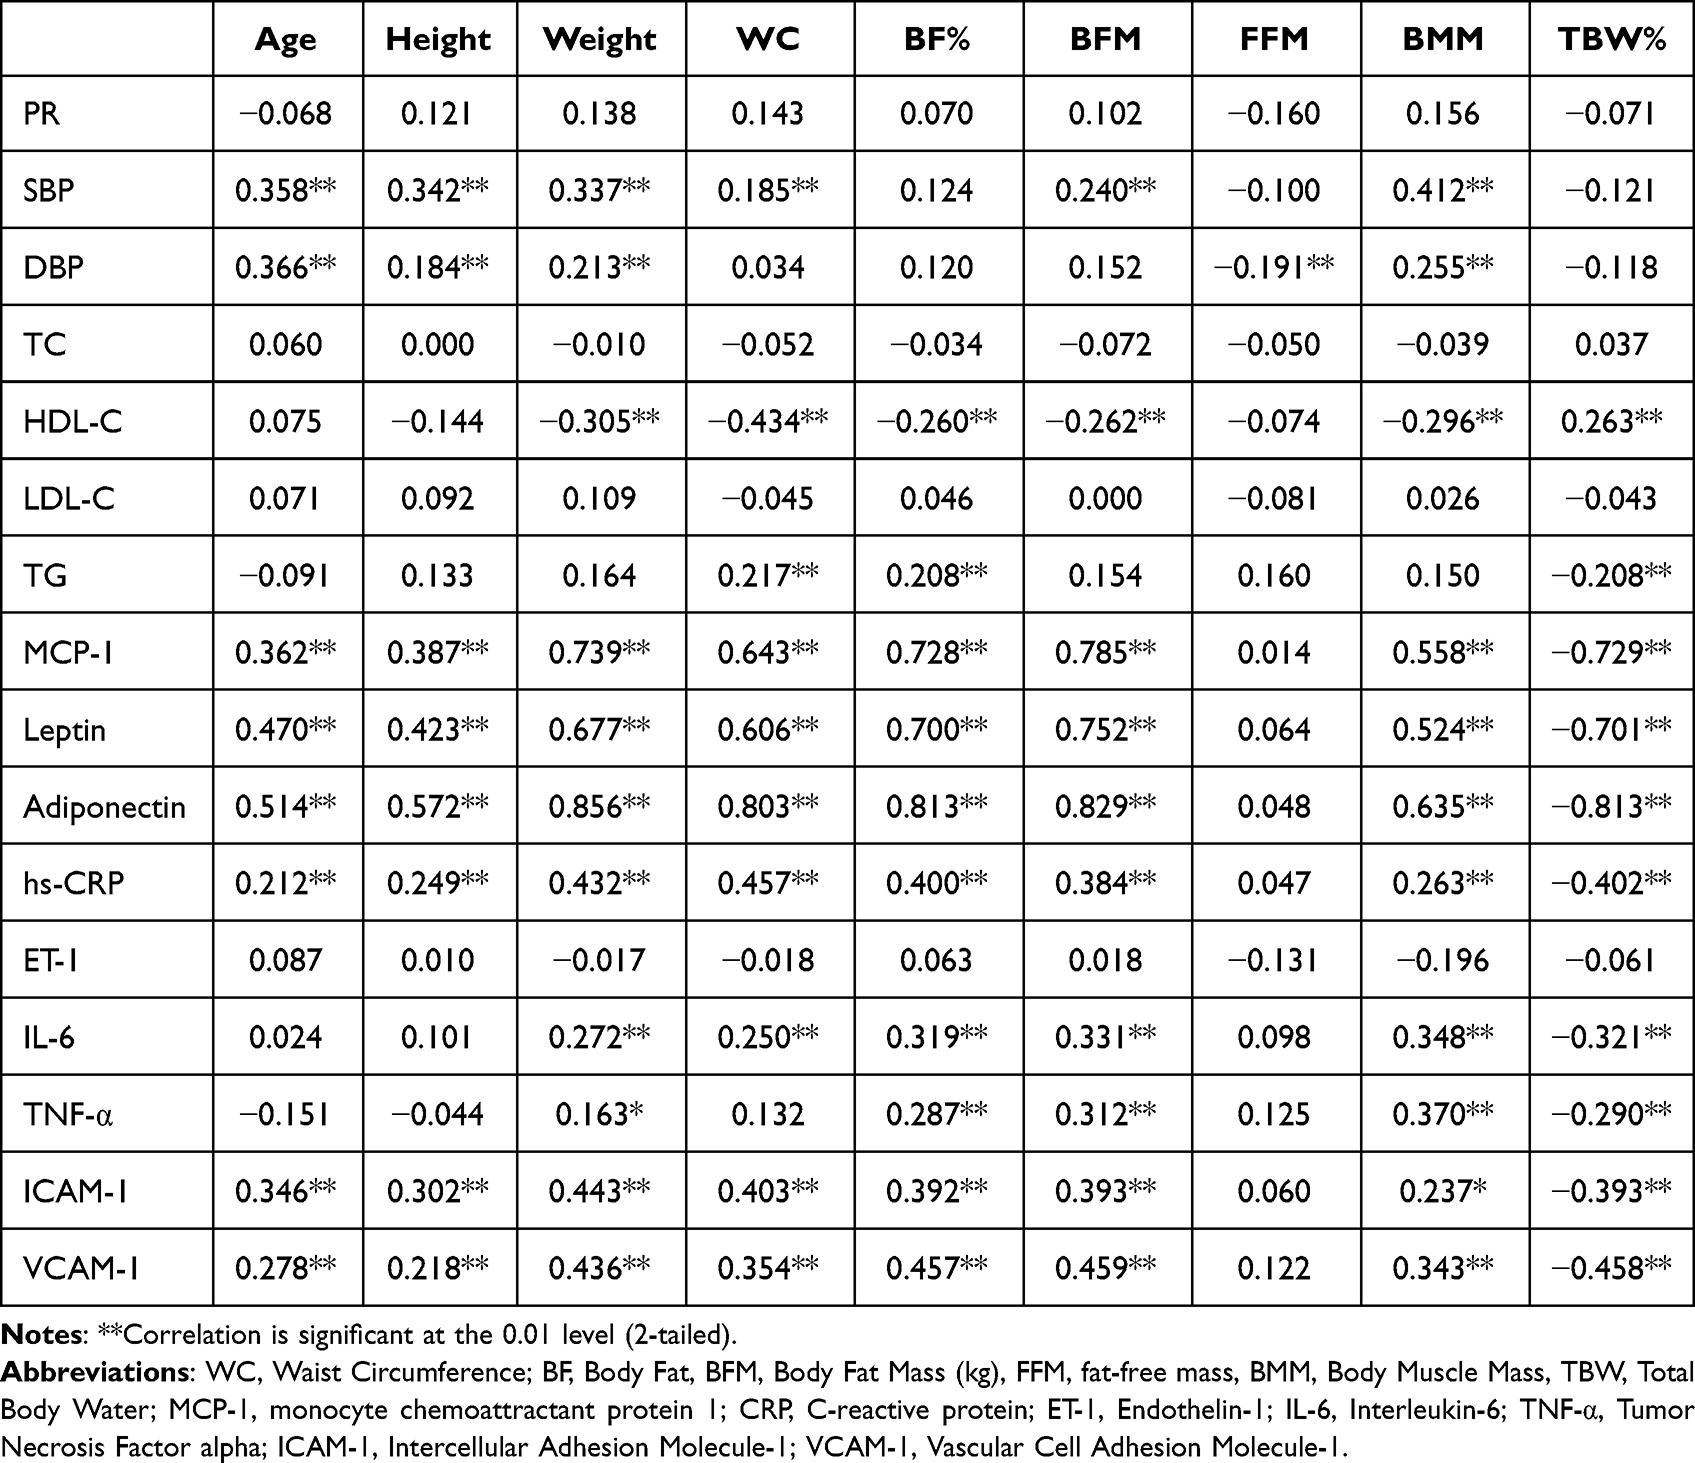 |
Table 3 Correlation of Various Clinical and Metabolic Markers with Body Composition Parameters |
MCP-1 showed a significant positive association with the obesity biomarkers leptin (r = 0.588, p < 0.01) and adiponectin (r=0.763, p<0.01). MCP-1 was also strongly associated (p < 0.01) with the inflammatory markers hs-CRP (r = 0.480, p<0.01), IL-6 (r = 0.350, p<0.01), TNF-α (r = 0.302, p<0.01), ICAM-1 (r = 0.447, p<0.01), and VCAM-1 (r = 0.458, p<0.01). Figure 1 showed the pattern of different biomarkers in all three groups.
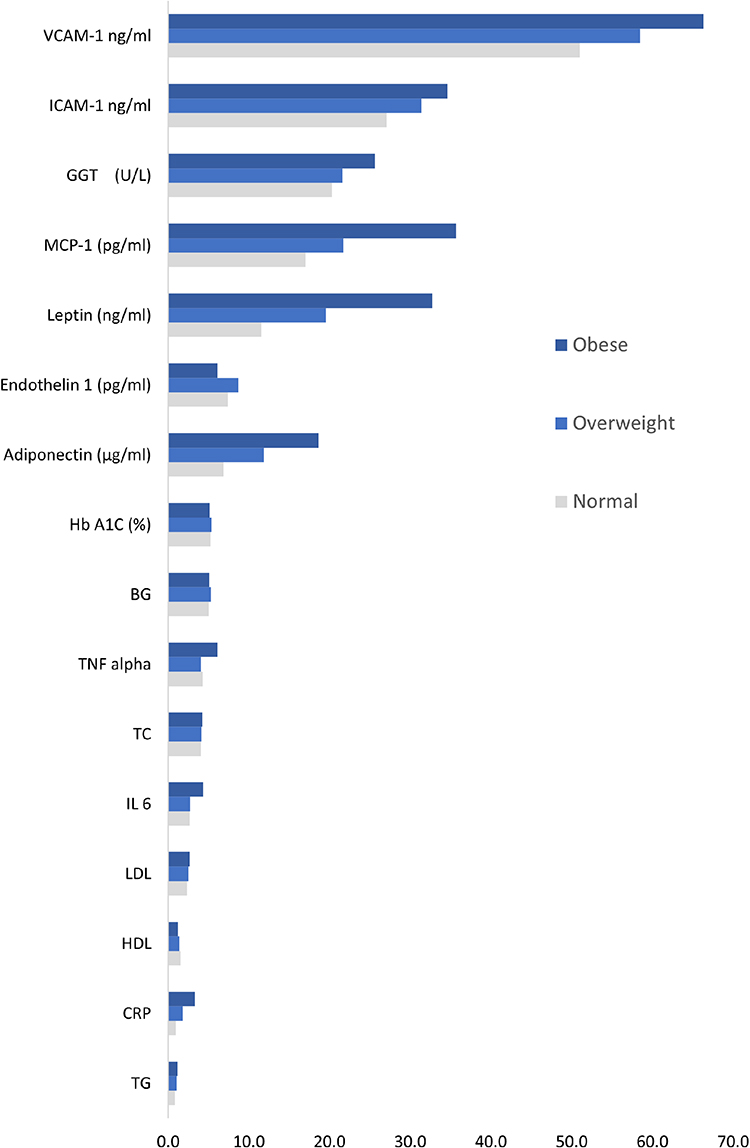 |
Figure 1 Levels of different biomarkers in the three groups of children. |
Multivariate Analysis
On multiple linear regression using CDC weight-for-age centile as the outcome, the following variables were statistically significant predictors with a positive association: male sex, BF percent, TBW in kg, and ET-1 (adjusted R squared = 0.85). The remaining variables, including weight, WC, HbA1C, BG, GGT, CRP, leptin, TC, LDL-C, HDL-C, TG, TNF alpha, ICAM-1, VCAM-1, and adiponectin, were not statistically significant. Figure 2 shows the correlation of different biomarkers with CDC weight-for-age centile.
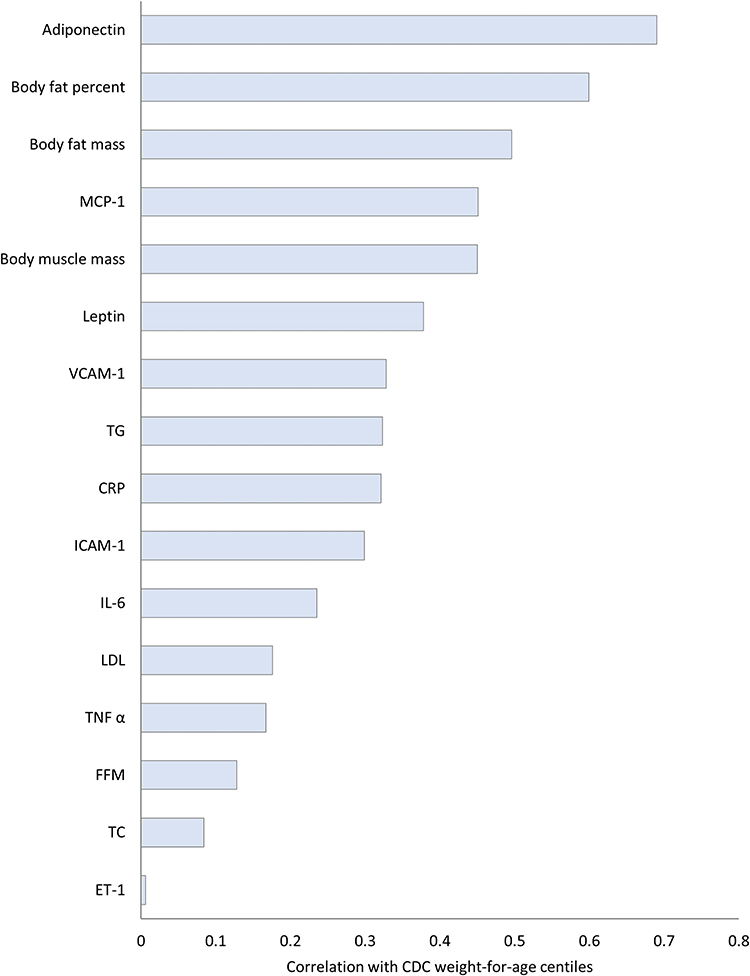 |
Figure 2 Correlation of different biomarkers with CDC weight-for-age centile. |
Discussion
In the present study, we observed a significant association between body fat composition and biochemical, inflammatory, and ED markers in UAE national primary school children with obesity.
Several cross-sectional studies have reported the prevalence of overweight and obesity among the multiethnic UAE population.4,20,21 One study reported prevalence of overweight and obesity among Emirati and expatriate school children as 14.7% and 18.9%, respectively. Another study among children of 3–6 and 15–18 years showed the prevalence of overweight was 11.5% and 41.2%, and obesity was 5.2% and 19.3%, respectively.4 The severity of overweight and obesity levels may be due to lack of physical activity potentially due to climatic conditions and cultural limitations, sedentary lifestyle, high intake of unhealthy food, and genetic or familial history.22 Therefore, immediate attention and measures are needed to reduce the prevalence of obesity and associated diseases.23
Childhood obesity often translates to an increased prevalence of CV risk factors and, consequently, cardiac events in adulthood.24,25 Four large studies among children who followed the participants into adulthood showed a positive correlation between high childhood BMI and various CV risk factors. Adults with obesity who were overweight/obese as children had an increased risk of T2D, HT, dyslipidemia, and atherosclerosis.5 The presence of ED in children with obesity might also be an surrogate marker for early cardiovascular disease.26
Obesity feature of MS is associated with chronic inflammation27 and among children confers a premature atherogenicity status linked to conventional adult CV risk factors.28 The sustained inflammation is considered a strong risk factor for developing many diseases including CVDs, MS, diabetes, and cancer. Among such disorders, diabetes is a serious health concern, with T2D prevalence of 11.3% and hypertension as 13.3% among UAE population.1,29
Obesity also predisposes to pro-inflammatory state via increased inflammatory mediators IL-6 and TNF-α, and reduced levels of adiponectin, which has totally anti-inflammatory function. The overexpressed pro-inflammatory cytokines in obesity are considered the link between obesity and inflammation.30 In the present study, we also observed a significant difference in CRP, ET-1, IL-6, TNF-α, ICAM-1, and VCAM-1 levels among the groups.
IL-6 is a key cytokine in the acute-phase inflammatory response that stimulates CRP and fibrinogen production in the liver, release of white blood cells and platelets from bone marrow, and activation of endothelium and hemostasis.31 The increased levels of IL-6 and TNF-α that are secreted from adipocytes are responsible for inhibiting and reducing synthesis and secretion of adiponectin.32 and endothelial well-being and suppressing the cardioprotective effect.33 This study also showed that IL-6 is one of the important inflammatory markers in obesity. The decreased levels of IL-6 are one of indicators of weight loss.34 Studies have shown that IL-6 is linked with abdominal obesity with metabolic abnormalities via the inflammatory process.35
The accumulation of free fatty acids in obesity activates pro-inflammatory serine kinase cascades, such as Ik B kinase and c-Jun N-terminal kinase, which in turn promotes adipose tissue to release IL-6 that triggers hepatocytes to synthesize and secrete CRP.34 Adipokines are also important factors in MS, inflammation, and ED associated with obesity.36 The hs-CRP is a sensitive marker for low-grade inflammation, and increased levels of CV complications show metabolic syndrome development in early life.37 In the present study, we observed a significant difference in hs-CRP levels, which were significantly correlated with various body fat compositions.
In the present study we also observed differences in leptin and adiponectin levels in male and female among all groups. This gender-related differences in levels of leptin and adiponectin may suggest that sex hormones might influence body adipose tissue composition and affect certain metabolic parameters. The variation could be a result of sex hormone–induced changes of the mechanisms of adipokine synthesis and consequent changes of adipokine activity as signaling factors.38,39 The associations between adiponectin levels and MS have also been studied previously in Japanese, Caucasian American, Japanese American, Thai, Korean, and Chinese population.40 It is well established that MS increases the risk of heart disease in both genders, although it seems to elicit a greater impact on women. Studies have also reported gender differences in relationship between adiponectin concentration and body fat in some population.41 Also, adiponectin level are significantly reduced in obese subjects compared with normal weight post-menopause women leading to metabolic abnormalities.42
The dyslipidemia pattern associated with childhood obesity consists of a combination of elevated TG, decreased HDL-C, and high-normal to mildly elevated LDL-C levels. The PEP Family Heart Study that included 3038 adolescents demonstrated that central obesity, defined as elevated waist circumference and/or waist-to-hip ratio, is an independent predictor of HT, fasting BG, elevated TG, LDL-C, non-HDL-C, TG/HDL-C ratio, low HDL-C, and risk factor clustering.43
Similarly, the lipid profile showed dyslipidemia in both groups compared to the control, showing a mild metabolic disturbance. Similar to other studies suggesting only mild CV disturbances.44 Among the lipid profiles, in present study TC, LDL-C, and TG levels showed no difference among the groups. Compared to the other groups, the obese group had the lowest HDL-C.
In general, overweight and obesity are considered as low-grade inflammatory states. This study in young children has shown that the interaction between inflammatory markers, biochemical markers and body fat content are measurable targets for any future intervention in young obese and overweight children. By managing obesity, the risks of CV diseases and unfavorable outcome via inhibiting inflammatory mechanisms can be managed. In obese subjects, who achieved at least a 10% weight loss, there is a consistent improvement in anti-inflammatory biomarkers; namely, the decrease in CRP, TNF-a, IL-6 and leptin and increase in adiponectin biomarkers. The valuable effects of weight loss in overweight and obesity are in terms of decreasing the risk of co-morbidities. However, it is likely that occasionally improvements observed are mainly due to a negative energy balance in the short term, rather than reducing adiposity.45
Conclusion
We found a significant association between body fat composition and biochemical, inflammatory, and endothelial dysfunction biomarkers among UAE national primary school children with obesity compared with controls. There was also an associated of obesity with serum inflammatory and endothelial dysfunction markers, which are risk factors for the development of cardiovascular disease. Thus, urgent attention and action is needed to reduce obesity among the UAE population, which could improve their health.
Disclosure
The authors report no conflicts of interest in this work.
References
1. Sulaiman N, Elbadawi S, Hussein A, et al. Prevalence of overweight and obesity in United Arab Emirates expatriates: the UAE national diabetes and lifestyle study. Diabetol Metab Syndr. 2017;9(1):88. doi:10.1186/s13098-017-0287-0
2. de Onis M. Development of a WHO growth reference for school-aged children and adolescents. Bull World Health Organ. 2007;85(9):660–667. doi:10.2471/blt.07.043497
3. Al-Haddad FH, Little BB, Abdul Ghafoor AGM. Childhood obesity in United Arab Emirates schoolchildren: a national study. Ann Hum Biol. 2005;32(1):72–79. doi:10.1080/03014460400027425
4. AlBlooshi A, Shaban S, AlTunaiji M, et al. Increasing obesity rates in school children in United Arab Emirates. Obes Sci Pract. 2016;2(2):196–202. doi:10.1002/osp4.37
5. Juonala M, Magnussen CG, Berenson GS, et al. Childhood adiposity, adult adiposity, and cardiovascular risk factors. N Engl J Med. 2011;365(20):1876–1885. doi:10.1056/NEJMoa1010112
6. Deshmane SL, Kremlev S, Amini S, Sawaya BE. Monocyte chemoattractant protein-1 (MCP-1): an overview. J Interferon Cytokine Res. 2009;29(6):313–326. doi:10.1089/jir.2008.0027
7. Baker JL, Olsen LW, Sørensen TIA. Childhood body-mass index and the risk of coronary heart disease in adulthood. N Engl J Med. 2007;357(23):2329–2337. doi:10.1056/NEJMoa072515
8. Twig G, Yaniv G, Levine H, et al. Body-mass index in 2.3 million adolescents and cardiovascular death in adulthood. N Engl J Med. 2016;374(25):2430–2440. doi:10.1056/NEJMoa1503840
9. Sahoo K, Sahoo B, Choudhury AK, Sofi NY, Kumar R, Bhadoria AS. Childhood obesity: causes and consequences. J Family Med Prim Care. 2015;4(2):187–192. doi:10.4103/2249-4863.154628
10. Vahdat K, Azizi F, Zandi K, Assadi M, Nabipour I. Chronic inflammation is correlated with percentage of body fat independent of the burden of infection. Inflammation. 2012;35(4):1322–1329. doi:10.1007/s10753-012-9445-6
11. Ginsberg HN. Insulin resistance and cardiovascular disease. J Clin Invest. 2000;106(4):453–458. doi:10.1172/JCI10762
12. Bhagavathula AS, Al-Hamad S, Yasin J, Aburawi EH. Distribution of cardiometabolic risk factors in school-aged children with excess body weight in the Al Ain City, United Arab Emirates: a cross-sectional study. Children. 2021;8(10):10. doi:10.3390/children8100884
13. Etchison WC, Bloodgood EA, Minton CP, et al. Body mass index and percentage of body fat as indicators for obesity in an adolescent athletic population. Sports Health. 2011;3(3):249–252. doi:10.1177/1941738111404655
14. Chen KK, Wee S-L, Pang BWJ, et al. Relationship between BMI with percentage body fat and obesity in Singaporean adults – the Yishun study. BMC Public Health. 2021;21(1):1030. doi:10.1186/s12889-021-11070-7
15. Consultation WE. Appropriate body-mass index for Asian populations and its implications for policy and intervention strategies. Lancet. 2004;363(9403):157–163. doi:10.1016/S0140-6736(03)15268-3
16. World Medical Association. World Medical Association Declaration of Helsinki: ethical principles for medical research involving human subjects. JAMA. 2013;310(20):2191–2194. doi:10.1001/jama.2013.281053
17. Aburawi EH, AlKaabi J, Zoubeidi T, et al. Subclinical inflammation and endothelial dysfunction in young patients with diabetes: a study from United Arab Emirates. PLoS One. 2016;11(7):e0159808. doi:10.1371/journal.pone.0159808
18. Kuczmarski RJ, Ogden CL, Guo SS, et al. 2000 CDC growth charts for the United States: methods and development. Vital Health Stat. 2002;11(246):1–190.
19. Lobstein T, Baur L, Uauy R. Obesity in children and young people: a crisis in public health. Obes Rev. 2004;5(Suppl s1):4–104. PMID: 12043359. doi:10.1111/j.1467-789X.2004.00133.x
20. Malik M, Bakir A, Saab BA, Roglic G, King H. Glucose intolerance and associated factors in the multi-ethnic population of the United Arab Emirates: results of a national survey. Diabetes Res Clin Pract. 2005;69(2):188–195. doi:10.1016/j.diabres.2004.12.005
21. Al Junaibi A, Abdulle A, Sabri S, Hag-Ali M, Nagelkerke N. The prevalence and potential determinants of obesity among school children and adolescents in Abu Dhabi, United Arab Emirates. Int J Obes. 2013;37(1):68–74. doi:10.1038/ijo.2012.131
22. Mabry RM, Reeves MM, Eakin EG, Owen N. Evidence of physical activity participation among men and women in the countries of the Gulf cooperation council: a review. Obes Rev. 2009;11(6):457–464. doi:10.1111/j.1467-789X.2009.00655.x
23. Abduelkarem AR, Sharif SI, Bankessli FG, Kamal SA, Kulhasan NM, Hamrouni AM. Obesity and its associated risk factors among school-aged children in Sharjah, UAE. PLoS One. 2020;15(6):e0234244. doi:10.1371/journal.pone.0234244
24. Drozdz D, Alvarez-Pitti J, Wójcik M, et al. Obesity and cardiometabolic risk factors: from childhood to adulthood. Nutrients. 2021;13(11):11. doi:10.3390/nu13114176
25. Delvecchio M, Pastore C, Valente F, Giordano P. Cardiovascular implications in idiopathic and syndromic obesity in childhood: an update. Front Endocrinol. 2020;11:330. doi:10.3389/fendo.2020.00330
26. Bruyndonckx L, Hoymans VY, Lemmens K, Ramet J, Vrints CJ. Childhood obesity–related endothelial dysfunction: an update on pathophysiological mechanisms and diagnostic advancements. Pediatr Res. 2016;79(6):831–837. doi:10.1038/pr.2016.22
27. Stępień M, Stępień A, Wlazeł RN, Paradowski M, Banach M, Rysz J. Obesity indices and inflammatory markers in obese non-diabetic normo- and hypertensive patients: a comparative pilot study. Lipids Health Dis. 2014;13(1):29. doi:10.1186/1476-511X-13-29
28. Aggoun Y. Obesity, metabolic syndrome, and cardiovascular disease. Pediatr Res. 2007;61(6):653–659. doi:10.1203/pdr.0b013e31805d8a8c
29. Ng SW, Zaghloul S, Ali HI, Harrison G, Popkin BM. The prevalence and trends of overweight, obesity and nutrition-related non-communicable diseases in the Arabian Gulf States. Obes Rev. 2011;12(1):1–13. doi:10.1111/j.1467-789X.2010.00750.x
30. Hotamisligil GS. Inflammation and metabolic disorders. Nature. 2006;444(7121):860–867. doi:10.1038/nature05485
31. Hansson GK. Inflammation, atherosclerosis, and coronary artery disease. N Engl J Med. 2005;352(16):1685–1695. doi:10.1056/NEJMra043430
32. Matsuzawa Y. The metabolic syndrome and adipocytokines. FEBS Lett. 2006;580(12):2917–2921. doi:10.1016/j.febslet.2006.04.028
33. Duggal A, Rubenfeld G. Morbid obesity: peri-operative management. In: Crit Care. Vol. 14. Copyright ©2010 BioMed Central Ltd.; 2010:322.
34. Ellulu MS, Patimah I, Khaza’ai H, Rahmat A, Abed Y. Obesity and inflammation: the linking mechanism and the complications. Arch Med Sci. 2017;13(4):851–863. doi:10.5114/aoms.2016.58928
35. Ellulu MS, Khaza’ai H, Abed Y, Rahmat A, Ismail P, Ranneh Y. Role of fish oil in human health and possible mechanism to reduce the inflammation. Inflammopharmacology. 2015;23(2–3):79–89. doi:10.1007/s10787-015-0228-1
36. Cao H. Adipocytokines in obesity and metabolic disease. J Endocrinol. 2014;220(2):T47–59. doi:10.1530/JOE-13-0339
37. Siegrist M, Hanssen H, Lammel C, Haller B, Halle M. A cluster randomised school-based lifestyle intervention programme for the prevention of childhood obesity and related early cardiovascular disease (JuvenTUM 3). BMC Public Health. 2011;11:258. doi:10.1186/1471-2458-11-258
38. Selthofer-Relatić K, Radić R, Stupin A, et al. Leptin/adiponectin ratio in overweight patients - gender differences. Diab Vasc Dis Res. 2018;15(3):260–262. doi:10.1177/1479164117752491
39. Ayina CNA, Noubiap JJN, Etoundi Ngoa LS, et al. Association of serum leptin and adiponectin with anthropomorphic indices of obesity, blood lipids and insulin resistance in a Sub-Saharan African population. Lipids Health Dis. 2016;15(1):96. doi:10.1186/s12944-016-0264-x
40. Eglit T, Lember M, Ringmets I, Rajasalu T. Gender differences in serum high-molecular-weight adiponectin levels in metabolic syndrome. Eur J Endocrinol. 2013;168(3):385–391. doi:10.1530/EJE-12-0688
41. Song HJ, Oh S, Quan S, et al. Gender differences in adiponectin levels and body composition in older adults: hallym aging study. BMC Geriatr. 2014;14:8. doi:10.1186/1471-2318-14-8
42. Jaleel F, Jaleel A, Rahman MA, Alam E. Comparison of adiponectin, leptin and blood lipid levels in normal and obese postmenopausal women. J Pak Med Assoc. 2006;56(9):391–394.
43. Schwandt P, Bertsch T, Haas G-M. Anthropometric screening for silent cardiovascular risk factors in adolescents: the PEP family heart study. Atherosclerosis. 2010;211(2):667–671. doi:10.1016/j.atherosclerosis.2010.03.032
44. Dalla Valle M, Laatikainen T, Kalliokoski T, Nykänen P, Jääskeläinen J. Childhood obesity in specialist care – searching for a healthy obese child. Ann Med. 2015;47(8):639–654. doi:10.3109/07853890.2015.1083118
45. Forsythe LK, Wallace JMW, Livingstone MBE. Obesity and inflammation: the effects of weight loss. Nutr Res Rev. 2008;21(2):117–133. doi:10.1017/S0954422408138732
 © 2023 The Author(s). This work is published and licensed by Dove Medical Press Limited. The
full terms of this license are available at https://www.dovepress.com/terms
and incorporate the Creative Commons Attribution
- Non Commercial (unported, 3.0) License.
By accessing the work you hereby accept the Terms. Non-commercial uses of the work are permitted
without any further permission from Dove Medical Press Limited, provided the work is properly
attributed. For permission for commercial use of this work, please see paragraphs 4.2 and 5 of our Terms.
© 2023 The Author(s). This work is published and licensed by Dove Medical Press Limited. The
full terms of this license are available at https://www.dovepress.com/terms
and incorporate the Creative Commons Attribution
- Non Commercial (unported, 3.0) License.
By accessing the work you hereby accept the Terms. Non-commercial uses of the work are permitted
without any further permission from Dove Medical Press Limited, provided the work is properly
attributed. For permission for commercial use of this work, please see paragraphs 4.2 and 5 of our Terms.
Recommended articles
Elevated CTSL Gene Expression Correlated with Proinflammatory Cytokines in Omental Adipose Tissue of Patients with Obesity
Zhou Q, Zhu Y, Li C, Li Z, Tang Z, Yuan B, Wang X, Zhang S, Wu X
Diabetes, Metabolic Syndrome and Obesity 2022, 15:2277-2285
Published Date: 30 July 2022
Effects of Semaglutide on Cardiac Protein Expression and Cardiac Function of Obese Mice
Pan X, Yue L, Ban J, Ren L, Chen S
Journal of Inflammation Research 2022, 15:6409-6425
Published Date: 24 November 2022
Bariatric Surgery and Gut-Brain-Axis Driven Alterations in Cognition and Inflammation
Custers E, Franco A, Kiliaan AJ
Journal of Inflammation Research 2023, 16:5495-5514
Published Date: 22 November 2023
Obesity and COVID-19 Pandemics: Epidemiology, Mechanisms, and Management
Yang Y, Song Y, Hou D
Diabetes, Metabolic Syndrome and Obesity 2023, 16:4147-4156
Published Date: 20 December 2023
The New Challenge of Obesity - Obesity-Associated Nephropathy
Hao M, Lv Y, Liu S, Guo W
Diabetes, Metabolic Syndrome and Obesity 2024, 17:1957-1971
Published Date: 6 May 2024