")
Back to Journals » Journal of Inflammation Research » Volume 15
Effects of Semaglutide on Cardiac Protein Expression and Cardiac Function of Obese Mice
Authors Pan X, Yue L, Ban J, Ren L, Chen S
Received 30 September 2022
Accepted for publication 17 November 2022
Published 24 November 2022 Volume 2022:15 Pages 6409—6425
DOI https://doi.org/10.2147/JIR.S391859
Checked for plagiarism Yes
Review by Single anonymous peer review
Peer reviewer comments 3
Editor who approved publication: Dr Adam D Bachstetter
Xiaoyu Pan,1,2 Lin Yue,1,2 Jiangli Ban,2 Lin Ren,2 Shuchun Chen1,2
1Department of Internal Medicine, Hebei Medical University, Shijiazhuang, People’s Republic of China; 2Department of Endocrinology, Hebei General Hospital, Shijiazhuang, People’s Republic of China
Correspondence: Shuchun Chen, Department of Endocrinology, Hebei General Hospital, Shijiazhuang, People’s Republic of China, Tel +86 31185988406, Fax +86 31185988406, Email [email protected]
Purpose: Using proteomics to study the effect of semaglutide on cardiac protein expression in obese mice. Assessment of the effect of semaglutide on cardiac function in obese mice.
Materials and Methods: The mice were randomly divided into three groups: the control group (WC), the high-fat group (WF), and the high-fat diet with semaglutide intervention group (WS). Serum samples were collected, and lipids, blood glucose, inflammatory and oxidative stress markers, and cardiac ultrasound, were examined. The cardiac weight of each group of mice was measured, and pathological alterations were examined. Inflammation and oxidative stress levels in heart tissue were evaluated. The labeling coupled with liquid chromatography-tandem mass spectrometry (LC-MS/MS) platform was used to find differentially expressed proteins (DEPs) and screen for related pathways and key proteins in a proteomics study.
Results: Semaglutide greatly alleviated obesity-induced lipid metabolism abnormalities, improved cardiac ventricular wall thickening, and significantly reduced myocardial collagen content in obese mice. Semaglutide significantly reduces obesity-induced inflammation and oxidative stress. There were 64 DEPs in the WF/WC group, with 39 upregulated proteins and 25 downregulated proteins. The WS/WC group, on the other hand, had 83 DEPs, including 57 upregulated and 26 downregulated proteins. Following functional analysis, DEPs were shown to be largely associated with lipid metabolism and peroxisomes. Apolipoprotein A-II, catalase, diazepam-binding inhibitor, paraoxonase-1, and hydroxysteroid 17-dehydrogenase-4 were all upregulated in the WF group but significantly downregulated in the WS group. A high-fat diet increases the expression of lipid synthesis and transport proteins while increasing inflammation and oxidative stress damage.
Conclusion: Semaglutide decreases lipid synthesis alleviates inflammation and oxidative stress and prevents lipid peroxidation and cardiac impairment.
Keywords: semaglutide, lipid metabolism, DEPs, obesity, inflammation, oxidative stress
Introduction
Cardiovascular disease (CVD) is currently the leading cause of harm to people’s health. Unless appropriate interventions are implemented, the prevalence and mortality from cardiovascular diseases would increase further.1,2 In recent years, the occurrence of CVD has been markedly younger, and the incidence and mortality of aging cardiovascular disease have also increased significantly.3 Therefore, controlling cardiovascular disease-related risk factors is of major clinical significance and social value for the effective prevention and treatment of CVD.4,5 High blood pressure, high blood sugar, and smoking have all been identified as substantial risk factors.6 Some possible risk factors, such as metabolic syndrome, have yet to be well investigated.7
Metabolic syndrome (MetS) is a pathological situation in which the body’s protein, lipid, and carbohydrate metabolism are disrupted. This group of complex metabolic diseases is dominated by obesity.8 Obesity is becoming more common as the global economy develops, yet existing obesity treatment is inadequate. Obesity, particularly central obesity, is a critical component of MetS. Obese individuals’ metabolic abnormalities create excessive lipid accumulation, which, along with increased levels of inflammation and oxidative stress, causes damage to a variety of target organs.9 In the heart, MetS not only disrupts the metabolism of cardiac tissues affecting cardiac function, but also increases the cardiac load and thus causes morphological changes in the heart. Studies have shown that as patients lose weight, the likelihood of developing cardiovascular disease will decrease. For patients with existing cardiac impairment, weight loss is linked to improved cardiac function and a significant reduction in the incidence of cardiovascular events in the future.10,11 Over the past decade, weight loss drugs and bariatric surgery have temporarily reduced weight,12 but they have not fundamentally improved metabolic disorders in obese patients. As a result, more novel drug development is required.
A variety of newly marketed antidiabetic medications have been reported to reduce fat and weight in obese people, primarily through treating metabolic abnormalities. A glucagon-like peptide 1 (GLP-1) receptor agonist is one of the most significant drugs. Semaglutide, a new long-acting GLP-1 receptor agonist approved for the treatment of obese patients with or without type 2 diabetes, is beneficial in lowering body weight and treating metabolic abnormalities in obese patients in addition to its hypoglycemic effects.13,14 The mechanism, however, remains unknown.
Proteomics is a term that combines the words “protein” and “genome.” It entails the investigation of all proteins produced by a cell or even an organism. In contrast to genomics, proteomics attempts to identify all proteins expressed in a cell.15 Due to the strong development of proteomics in recent years, proteomics is critical for the diagnosis and mechanism of several metabolic illnesses, such as MetS, diabetes, and obesity.16,17 It also has a significant impact on medication development.18 This study employed proteomics techniques to investigate the effects of a high-fat diet and semaglutide intervention on mouse cardiac protein expression in an obese mice model. Bioinformatics analysis was provided to further investigate the mechanisms associated with semaglutide’s cardioprotective effects in obese mice, resulting in potential mechanisms and new perspectives for the prevention and treatment of obesity-induced cardiac injury.
Materials and Methods
Reagents and Materials
Six-week-old male C57BL/6 mice were purchased from the Hebei Yiweiwo Biotechnology Co. Ltd. (Shijiazhuang, China). Co60 breeding chow (14.5% fat) and high-fat chow (60% fat) were obtained from Beijing Huafukang Biotechnology Co. Ltd. (Beijing, China). Semaglutide was provided by Novo Nordisk, Denmark, and small animal ultrasound was used with the vevo2100 from Visual Sonics. Other testing tools and reagents included lipid test kits, interleukin-6 (IL-6), tumor necrosis factor-α (TNF-α), reactive oxygen species (ROS), and malondialdehyde (MDA) kits (Nanjing Jiancheng Bioengineering Research Institute Co., Ltd., China), High pH Reversed-Phase Peptide Fractionation Kit (Thermo Scientific), blood glucose meter (Accu-CHEK, American), Isobaric Tags for Relative and Absolute Quantification (iTRAQ) reagent (Applied Biosystems), and Tandem Mass Tag (TMT) reagent (Thermo Scientific).
Animal Treatment and Study Design
All mice were housed in an animal house in a suitable environment (22 ±2°C, 12-h day/night cycle), regular bedding changes, and free access to food and water. After 1 week of acclimatization, the mice were assigned to two groups: the control group (WC group) and the high-fat group (WF group), who were provided with normal and high-fat diets respectively. After 12 weeks, 8 mice from the WF group were randomly selected to receive semaglutide 30 nmol/kg/day intraperitoneally (WS group). The WC and WF groups were administered a normal diet and a high-fat diet, respectively, and they were given the same amount of saline daily (n = 8). The intervention was expected to continue for 12 weeks. All experiments and procedures were conducted in accordance with the Regulations on the Management of Laboratory Animals issued by the National Science and Technology Commission and were approved by the Animal Ethics Association of the Hebei General Hospital (no. 202065). The ARRIVE criteria were adopted in all animal trials.
Normal diet (total energy of 3.48 kcal/g, components: protein 27.38%, fat 14.5%, carbohydrate 58.12%). High-fat diet (total energy of 5.24 kcal/g, components: protein 20%, carbohydrate 20%, fat 60%).
Echocardiograph
The mice were depilated with a hair removal cream from their chest a day before the cardiac ultrasound examination. The mice were anesthetized with isofluane (100%, oxygen flow 1.75%), and, when the heart rate stabilized at approximately 400 beats per minute, the anesthetized mice were placed in the supine position on a thermostatic table for ultrasound examination, while the anesthesia was maintained with isofluane. Non-invasive transthoracic cardiac ultrasound was performed on each group of mice using the Visual Sonics Vevo 2100 Echocardiograph. The left ventricular internal dimension in systole (LVIDs), left ventricular internal dimension in diastole (LVIDd), left ventricular posterior wall thickness in systole (LVPWs), left ventricular posterior wall thickness in diastole (LVPWd), left ventricular anterior wall thickness in systole (LVAWs), left ventricular anterior wall thickness in diastole (LVAWd), left ventricular ejection fraction (LVEF), and left ventricular fraction shortening (LVFS) were measured in the short-axis view of the left ventricle. These indices provide an accurate assessment of ventricular wall thickness and cardiac systolic function. For each group of 3 mice, measurements were taken to ensure 4 cardiac cycles and the final average was considered for subsequent analyses. All experimental and data analyses followed a blinding method, in order to reduce bias.
Serological Index Testing
Blood samples were collected from the tail tip to determine the fasting blood glucose levels after an 8 h of fasting. All mice were fasted for 24 h before the blood sampling, and the mice were anesthetized intraperitoneally with 1% sodium pentobarbital solution. After complete anesthesia, blood was removed from the inner canthus vein of the mice and left to stand for 30 min at 4°C, followed by centrifugation at 3500 rpm for 10 min, and the supernatant was collected and stored in a refrigerator at −80°C. The serum samples were transferred to anticoagulation tubes and the serum total cholesterol (TC), triglycerides (TG), low-density lipoprotein cholesterol (LDL-C), and high-density lipoprotein cholesterol (HDL-C) concentrations were measured using a fully automated biochemical analyzer. ELISA was used to detect the levels of serum IL-6, TNF-α, and MDA.19
Histopathological Examination
The mice that had been fully anesthetized, and their blood were collected and placed in the freezer, followed by an opening of the chest cavity, and the heart tissue was removed in the intact form. For each group, the blood arteries were removed from the bottom of the heart, the heart was cleaned with saline, and the surplus blood was gently squeezed out with a filter paper before weighing and recording. Next, some of the heart tissues were fixed in 4% paraformaldehyde, while the remaining were stored at −80°C.
Heart tissue soaked in paraformaldehyde was taken out, embedded in paraffin and sectioned (5–6μm thick). The tissue sections were stained with Hematoxylin-Eosin (HE) and Masson’s trichrome. These sections were imaged at 400× in the target area of the tissue selected for Eclipse Ci-L Photomicroscopy. Masson’s trichrome staining was performed primarily to assess the collagen content of the myocardial tissues and the percentage of collagen area (%) was calculated using the following formula: percentage of collagen area (%) = collagen pixel area/tissue pixel area × 100%.20
Cardiac Tissue TNF-α, IL-6, MDA, and ROS Assays
The hearts were removed, digested with collagenase, and the protein levels were measured. Finally, the levels of TNF-α, IL-6, and MDA in the heart tissue were measured by enzyme-linked immunosorbent assay (ELISA). The detection of cardiac tissue ROS content using rapid freeze sectioning with antibody incubation. All operations were performed in strict accordance with the manufacturer’s instructions.
Protein Sample Preparation
The heart tissues were removed from the refrigerator, and 200 μg of the tissues from each sample were ground and dissolved in30μL of the SDT buffer (4% SDS, 100 mM DTT, 150 mM Tris-HCl, pH 8.0). Next, the tissues were washed in the UA buffer (8 M urea, 150 mM Tris-HCl, pH 8.0), 100 μL iodoacetamide (100 mM IAA in the UA buffer), and 100 μL 25-mM NH4HCO3 buffer. Finally, the protein suspension was digested with 4-μg trypsin overnight at 37°C. The obtained sample peptides were desalted on a C18 column (Empore™ SPE Column C18, bed size 7 mm, volume 3 mL; Sigma), concentrated by vacuum centrifugation, and reconstituted in 40 μL of 0.1% (v/v) formic acid. Then, 100 μg of the peptide mixtures of each sample were labeled with the iTRAQ reagent and the TMT reagent according to the manufacturer’s instructions. The labeled peptides were then fractionated using a high pH-reversed phase peptide fractionation kit and concentrated by vacuum centrifugation.
LC-MS/MS Analysis
LC-MS/MS analysis was performed on the Q Exactive Mass Spectrometer (Thermo Scientific). The obtained peptides were loaded into a reversed-phase trap column and connected to a C18 reversed-phase analytical column in 0.1% formic acid, with a linear gradient of 84% acetonitrile and 0.1% formic acid at 300 nL/min. The mass spectrometer was operated in the positive ion mode. The mass spectral data were acquired using a data-dependent top 10 method to dynamically select the most-abundant precursor ions for HCD fragmentation from survey scans (300–1800 m/z). The automatic gain control (AGC) target was set to 3e6, with a maximum injection time of 10 ms. The survey scan was acquired at a resolution of 70,000 at m/z 200, and the resolution of the HCD spectrum was set to 17,500 at m/z 200 with an isolation width of 2 m/z. The normalized collision energy was 30eV, while the underfill rate was defined at 0.1%. The instrument was run with the peptide identification mode enabled. The proteomics data processing procedure was followed as per a previous method.21
Differentially Expressed Proteins Screening
The obtained raw data were analyzed in-depth using the MASCOT Engine of Proteome Discoverer 1.4 software (Matrix Science, London, UK; version 2.2). Peptide Mass Tolerance: ±20 ppm; Fragment Mass Tolerance: 0.1Da; Peptide false positive rate (FDR) ≤0.01. Bioinformatics methods were performed in reference to past literature.22
GO and KEGG Analyses
The protein sequences of the identified differentially expressed proteins (DEPs) were searched using the NCBI BLAST+ client software (ncbi-blast-2.2.28+-win32.exe), followed by the enrichment analysis of gene ontology (GO) terms and annotation of functions using Blast2GO (https://www.blast2go.com/) software. Finally, the R software was used to map the GO annotation results. The Kyoto Encyclopedia of Genes and Genomes (KEGG) database (https://www.kegg.jp/) was used for pathway annotation analysis of DEPs. The enrichment analysis was based on Fisher’s exact test and the Benjamini–Hochberg method was applied to correct P-values and the screening criteria for DEPs were set to P < 0.05.
PPI Network Construction
One of the important ways whereby proteins perform their functions is by interacting with other proteins; hence, the importance of protein–protein interaction (PPI). In the PPI networks, highly clustered proteins may often have the same or similar functions and perform biological functions through synergistic interactions. The String (http://www.string-db.org) tool was applied to construct the PPI networks of DEPs and to identify protein–protein interactions.
Statistical Analysis
All data were presented as the mean±standard deviation. Comparisons between the two groups were performed by t-test, and all data were processed using the GraphPad Prism 8.0 software. One-way ANOVA and Bonferroni test were performed to analyze the differences between multiple comparison groups. Differences between the groups were considered to be statistically significant at P < 0.05.
Results
Semaglutide Significantly Reduces Body Weight in Obese Mice
The body weight of mice in the WF group was significantly higher than that of mice in the WC group (P < 0.01) after 12 weeks of high-fat intervention, suggesting that the obesity model was successfully constructed. Subsequently, the mice in the WS group were given semaglutide, and after 12 weeks, the body weight of the mice in the WS group decreased significantly compared with that of the WF group (P < 0.01). At the end of the trial, there were no significant differences in body weight between the WS and WC groups of mice (P > 0.05). Figure 1 depicts the changes in body weight of mice in each group after high-fat and semaglutide interventions, and the morphological comparison of mice in each group at the end of the experiment.
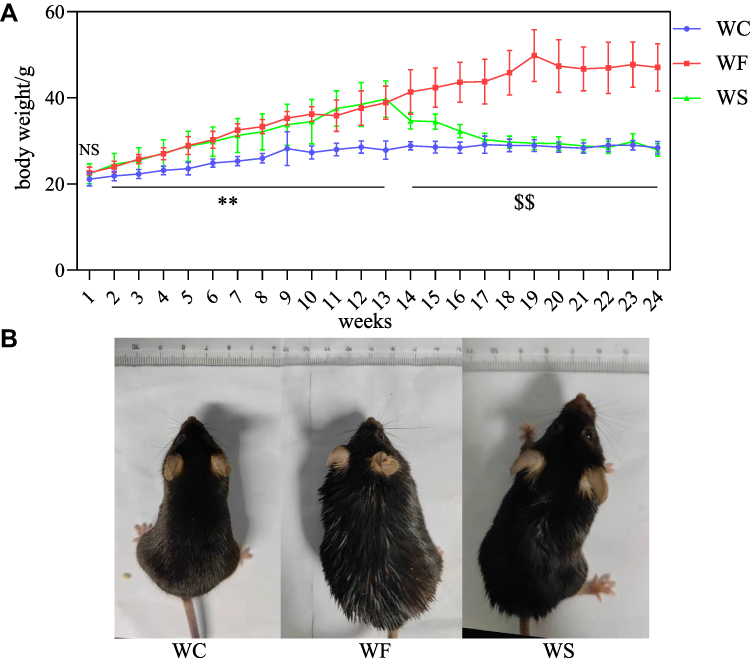 |
Figure 1 Effect of high-fat diet and semaglutide on body weight in mice. (A) Trends in body weight of mice in WC, WF and WS groups during 24 weeks of intervention with high-fat diet and semaglutide. (B) Images of normal mice, obese mouse models and semaglutide treated mice. NS indicates no significant difference between the three groups. **P < 0.01 for WC vs WF and WS. $$ P < 0.01 for WC and WS vs WF. All values are expressed as mean±SD (n=8). Abbreviations: WC, control group; WF, high-fat diet; WS, high-fat diet+semaglutide. |
Semaglutide Improves Dyslipidemia, Inflammation, and Oxidative Stress in Obese Mice
We evaluated the TC, TG, LDL-C, HDL-C, and fasting glucose to assess the changes in lipids and glucose in obesity and the effect of semaglutide on them (Figure 2A-D). The WF group had significantly higher serum TC, TG, LDL-C, HDL-C, and fasting glucose levels than the WC group (P < 0.05) (Figure 2E). Except for HDL-C, the above lipid parameters decreased significantly in the WS group after semaglutide intervention (P < 0.01). After semaglutide treatment, fasting glucose did not decrease significantly in the WS group compared to the WF group (P > 0.05). Serum TNF-α, IL-6, and MDA levels were substantially elevated by a high-fat diet, while semaglutide reduced inflammation and oxidative stress (P < 0.05) (Figure 2F-H).
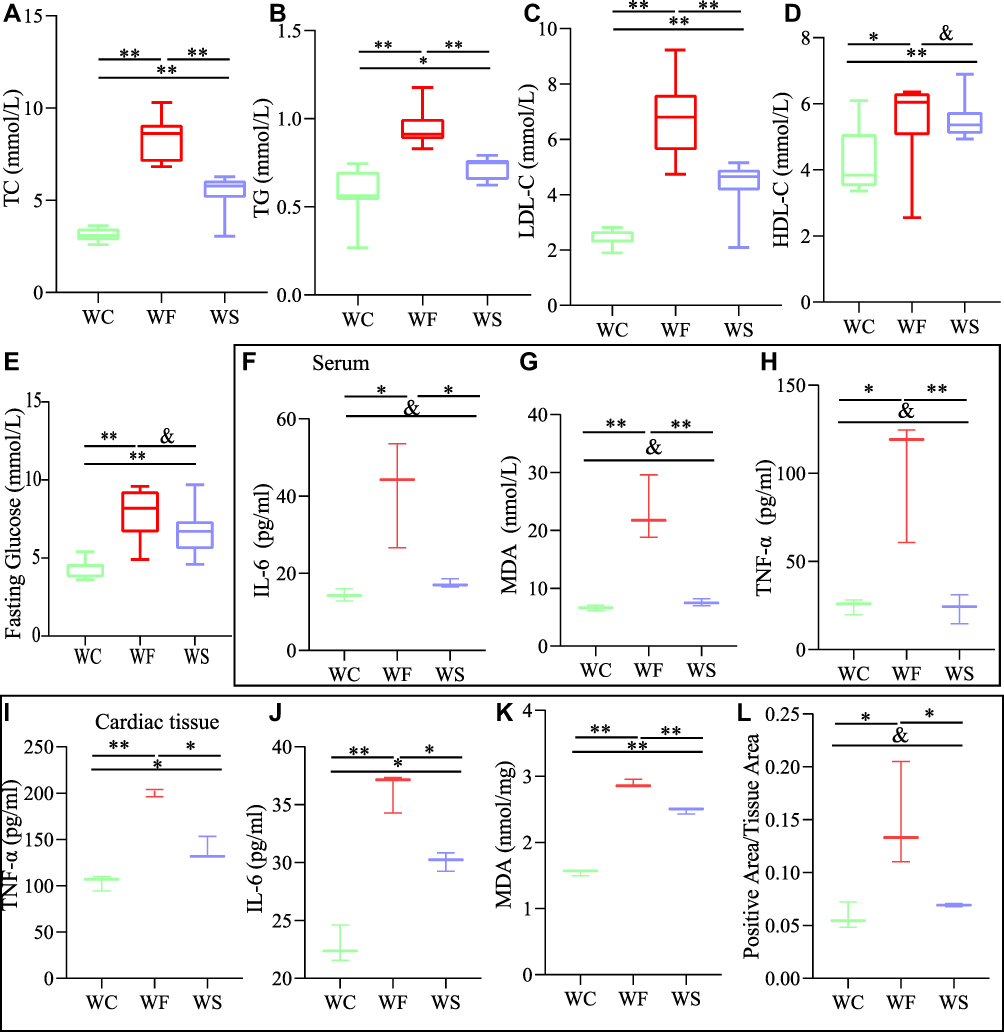 |
Figure 2 Comparison of the changes in TC, TG, LDL-C and HDL-C in the WC, WF and WS groups. (A) TC (total cholesterol). (B) TG (total cholesterol). (C) LDL-C (low-density lipoprotein cholesterol). (D) HDL-C (high-density lipoprotein cholesterol). (E) Fasting blood glucose. Data are expressed as mean±standard deviation (n=8). TNF-α (tumor necrosis factor-α), IL-6 (interleukin-6), and MDA (malonic dialdehyde) levels in serum (F–H). TNF-α, IL-6, MDA and ROS (reactive oxygen species) levels in cardiac tissue (I-L). Data are expressed as mean±standard deviation (n=3). **P < 0.01, *P < 0.05, andP > 0.05. Abbreviations: WC, control group; WF, high-fat diet; WS, high-fat diet+semaglutide. |
Semaglutide Improves Cardiac Function and Alleviates Inflammation and Oxidative Stress Levels in Obese Mice
TNF-α, IL-6, MDA, and ROS levels in the hearts of obese mice were significantly higher (P < 0.05), indicating enhanced inflammation and oxidative stress. Semaglutide reduced TNF-α, IL-6, MDA, and ROS levels in cardiac tissue while improving inflammation and oxidative stress (P < 0.05) (Figure 2I-L). To examine cardiac pathology and function, HE staining, Masson staining, and cardiac ultrasound were employed. Compared to the WC group, myocardial cells in the WF group were enlarged, and slightly disorganized, with increased cellular matrix, inconsistent nuclei size, and varied staining shades, but in the WS group, all indicators improved (Figure 3A). The main method for assessing myocardial collagen content was Masson staining, and the collagen area was significantly increased in the WF group compared to the WC and WS groups (P < 0.01) (Figure 3B and E). Furthermore, heart weight was significantly higher in the WF group compared to the WC group (P < 0.01), but significantly lower following the semaglutide intervention (P < 0.01), with no significant difference between the WC and WS groups (P > 0.05) (Figure 3C and D).
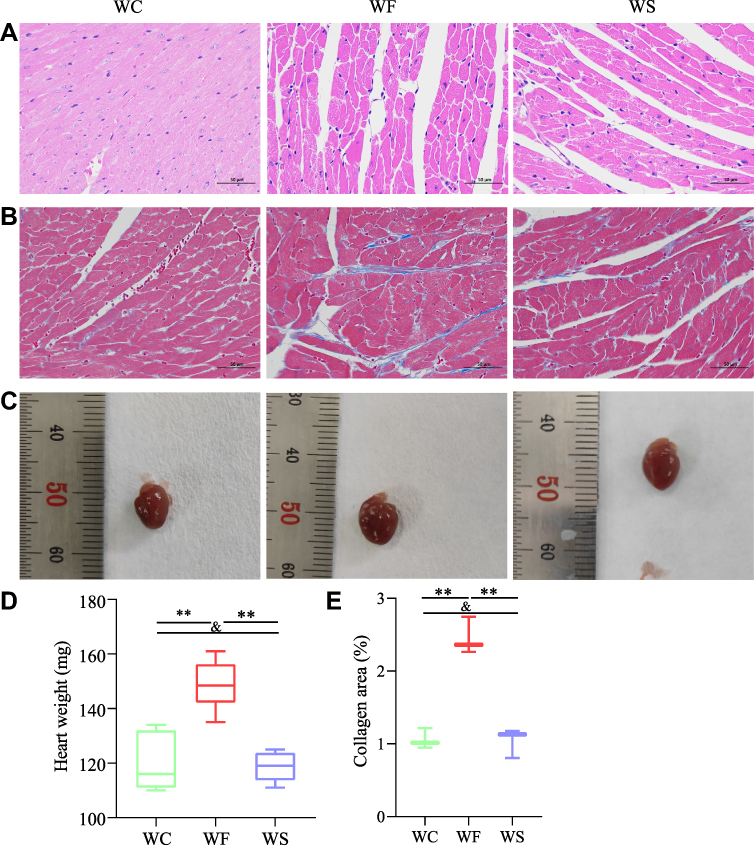 |
Figure 3 Effect of semaglutide on histopathological changes in high-fat diet-induced obese hearts stained with HE and Masson. (A) HE staining of cardiac tissue. (B) Masson staining of cardiac tissue. (C) Representative images of mouse heart tissue. (D) Comparison of heart weights between the three groups (n=8). (E) Comparison of cardiac collagen area between the three groups (n=3). Values for each group are shown as mean±standard deviation. Data were compared between the three groups using a one-way ANOVA test. **P < 0.01, andP > 0.05. Abbreviations: WC, control group; WF, high-fat diet; WS, high-fat diet+semaglutide. |
To assess cardiac function, several LV indices were employed. Obesity increased LVAWs, LVAWd, LVPWs, LVPWd, LVEF, FS, and LV mass while decreasing LVIDs (P < 0.05). These results suggest that the obese heart undergoes compensatory changes and centripetal hypertrophy and that these indices improve after semaglutide intervention (Figure 4).
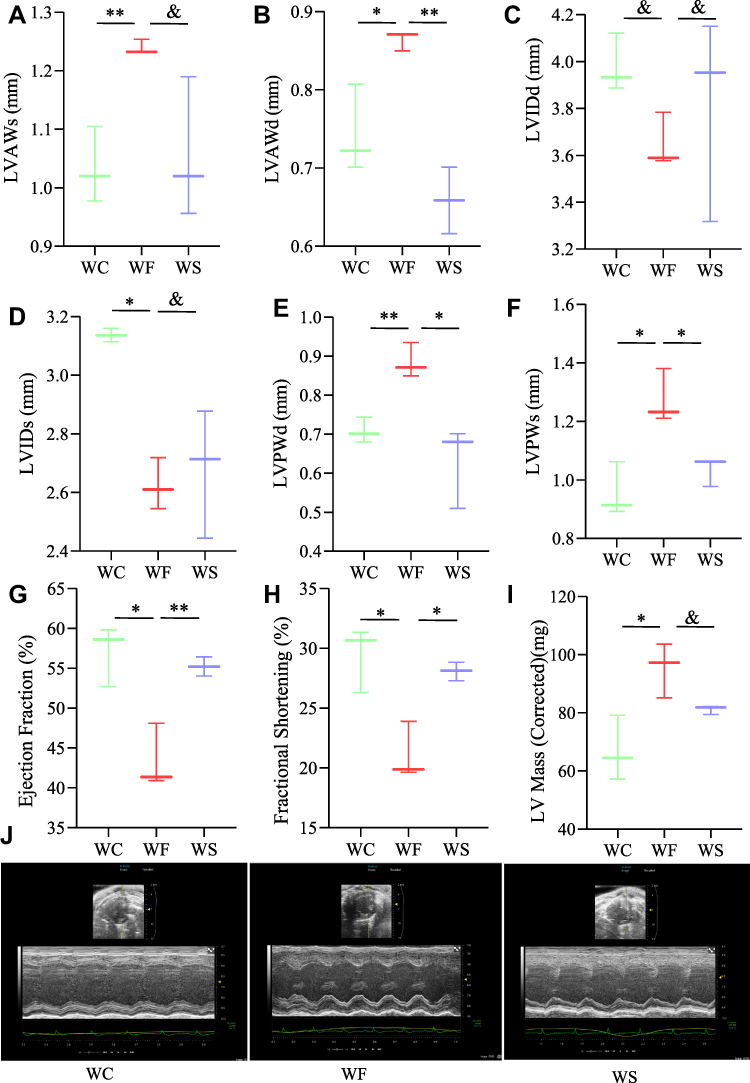 |
Figure 4 Structural and functional changes of myocardium in three groups of mice. (A) Left ventricular anterior wall thickness in systole (LVAWs). (B) Left ventricular anterior wall thickness in diastole (LVAWd). (C) Left ventricular internal dimension in diastole (LVIDd). (D) Left ventricular internal dimension in systole (LVIDs). (E) Left ventricular posterior wall thickness in diastole (LVPWd). (F) Left ventricular posterior wall thickness in systole (LVPWs). (G) Left ventricular ejection fraction (LVEF). (H) Left ventricular fraction shortening (LVFS). (I) Left ventricular mass. (J) Representative echocardiograph images. Values are expressed using the mean±SD (n=3). **P < 0.01, *P < 0.05, and P > 0.05. Abbreviations: WC, control group; WF, high-fat diet; WS, high-fat diet+semaglutide. |
Identification of Differentially Expressed Proteins
According to the DEPs screening criteria, a total of 64 DEPs were identified in heart tissues of the WF/WC group, including 39 upregulated and 25 downregulated proteins. Similarly, in the WS/WC group, 83 DEPs containing 57 up- and 26 downregulated proteins were identified. And in the WS/WF group, 25 up-regulated and 12 down-regulated proteins were identified. Volcano plots and heatmaps were used to visualize all DEPs data, as illustrated in Figures 5 and 6.
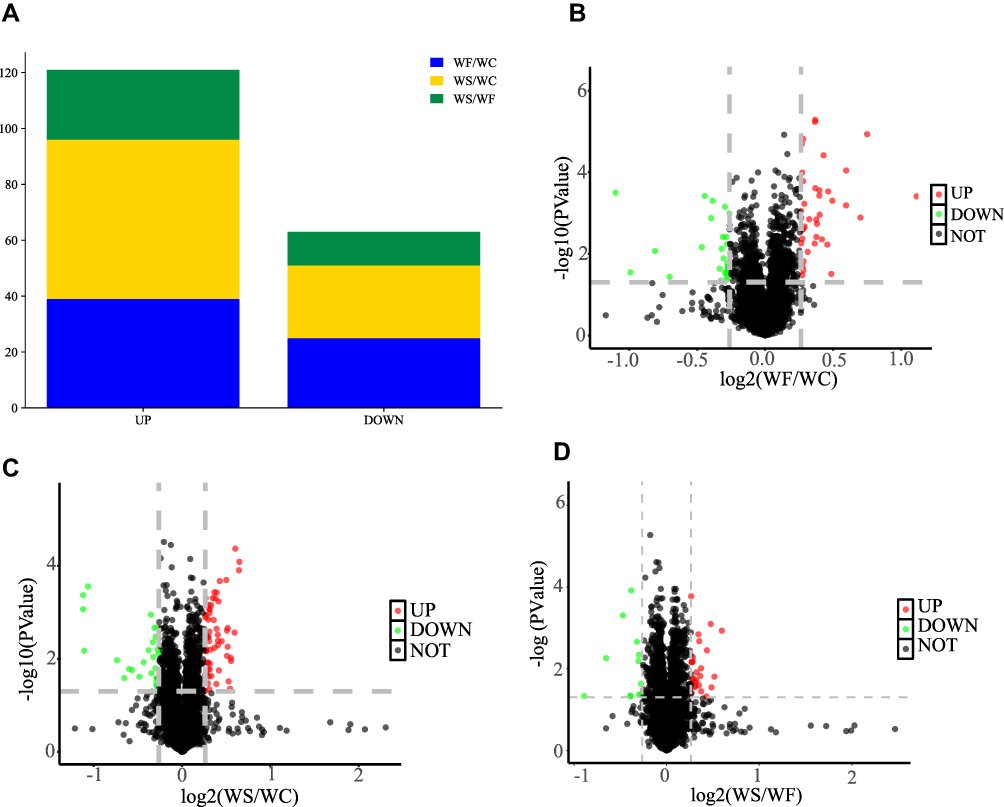 |
Figure 5 DEPs in the WF/WC and WS/WC groups. (A) The bar graphs show the number of total DEPs and up- and down-regulated proteins in the WF/WC and WS/WC groups. (B–D) The volcano plots of DEPs are shown in the WF/WC, WS/WC and WS/WF groups, respectively. The horizontal coordinate indicates the WF/WC group or WS/WC group log2 (Fold Change). The vertical coordinate indicates the -log10 (p-value) for comparison between the two groups. Screening criteria for DEPs were a Fold Change > 1.2 or < 0.83, and a p-value < 0.05. Abbreviations: DEPs, differentially expressed proteins; WC, control group; WF, high-fat diet; WS, high-fat diet+semaglutide. |
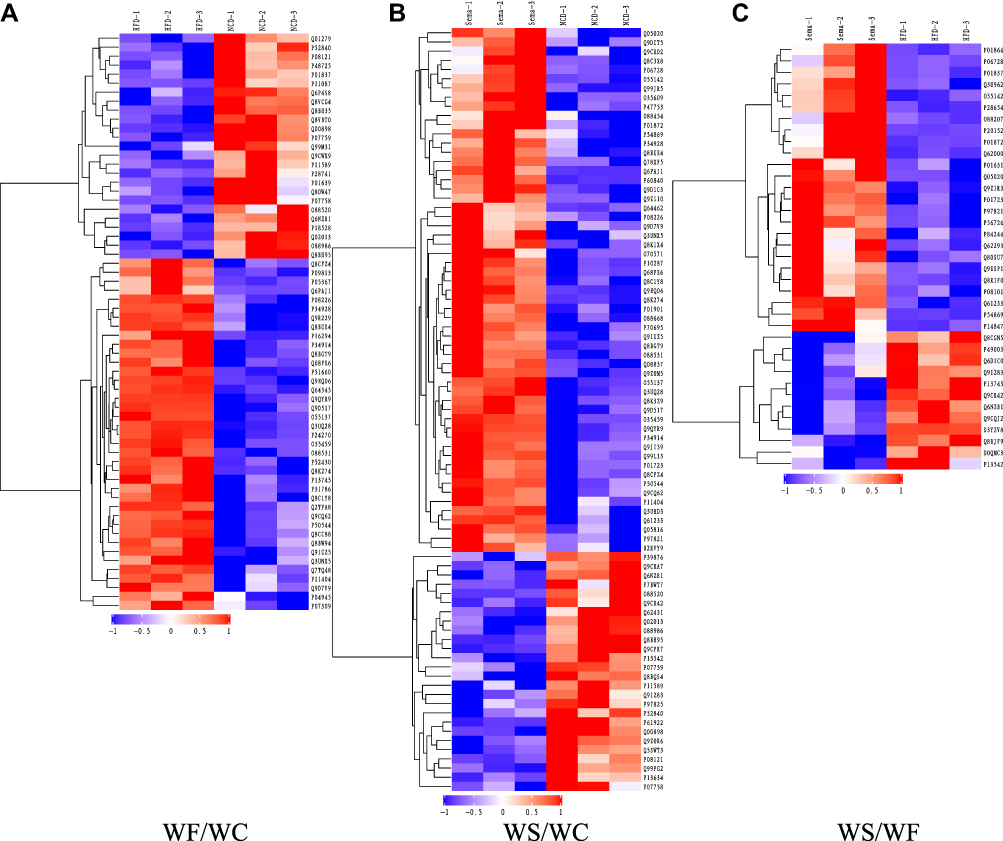 |
Figure 6 Heatmaps of DEPs. (A) Comparison of WF/WC groups. (B) Comparison of WS/WC groups. (C) Comparison of WS/WF groups. Each column represents a set of samples, and each row represents a protein number. The expression of DEPs in different samples is calculated by log2 method and displayed in the heatmaps in different colors, where red represents significantly up-regulated proteins, blue represents significantly down-regulated proteins, and gray part represents no quantitative information of proteins. WC-1, WC-2 and WC-3 denote the replicates of three independent samples in the WC group, and the WF and WS groups are represented in the same way. Abbreviations: DEPs, differentially expressed proteins; WC, control group; WF, high-fat diet; WS, high-fat diet+semaglutide. |
GO Enrichment Analysis
GO enrichment analysis is the description of genes in different dimensions and levels, mainly including Cellular component (CC), Biological process (BP), and Molecular function (MF) components. We used Blast2Go (https://www.blast2go.com/) software for GO functional annotation of all DEPs in this investigation. BP was mainly related to lipid catabolic process, fatty acid metabolic process, and lipid modification in the WF/WC group; CC was primarily related to the protein-lipid complex, high-density lipoprotein particle, and plasma lipoprotein particle; MF was mainly enriched in palmitoyl-CoA hydrolase activity, acyl-CoA hydrolase activity, and CoA hydrolase activity. In the WS/WC group, BP was mainly enriched in fatty acid metabolic process, lipid catabolic process, and lipid modification; CC was mainly related to very-low-density lipoprotein particle, triglyceride-rich plasma lipoprotein particle, and high-density lipoprotein particle; and MF was mainly enriched in palmitoyl-CoA hydrolase activity, fatty acid binding, and long-chain fatty acid transporter activity. In the WS/WF group, BP was mainly regulation of plasma lipoprotein particle levels, plasma lipoprotein particle clearance and heart morphogenesis; CC was mainly related to very-low-density lipoprotein particle, triglyceride-rich plasma lipoprotein particle and high-density lipoprotein particle; and MF was mainly enriched in extracellular matrix structural constituent, extracellular matrix structural constituent conferring compression resistance and microfilament motor activity. Figure 7 and 8 depicts specific GO enrichment results.
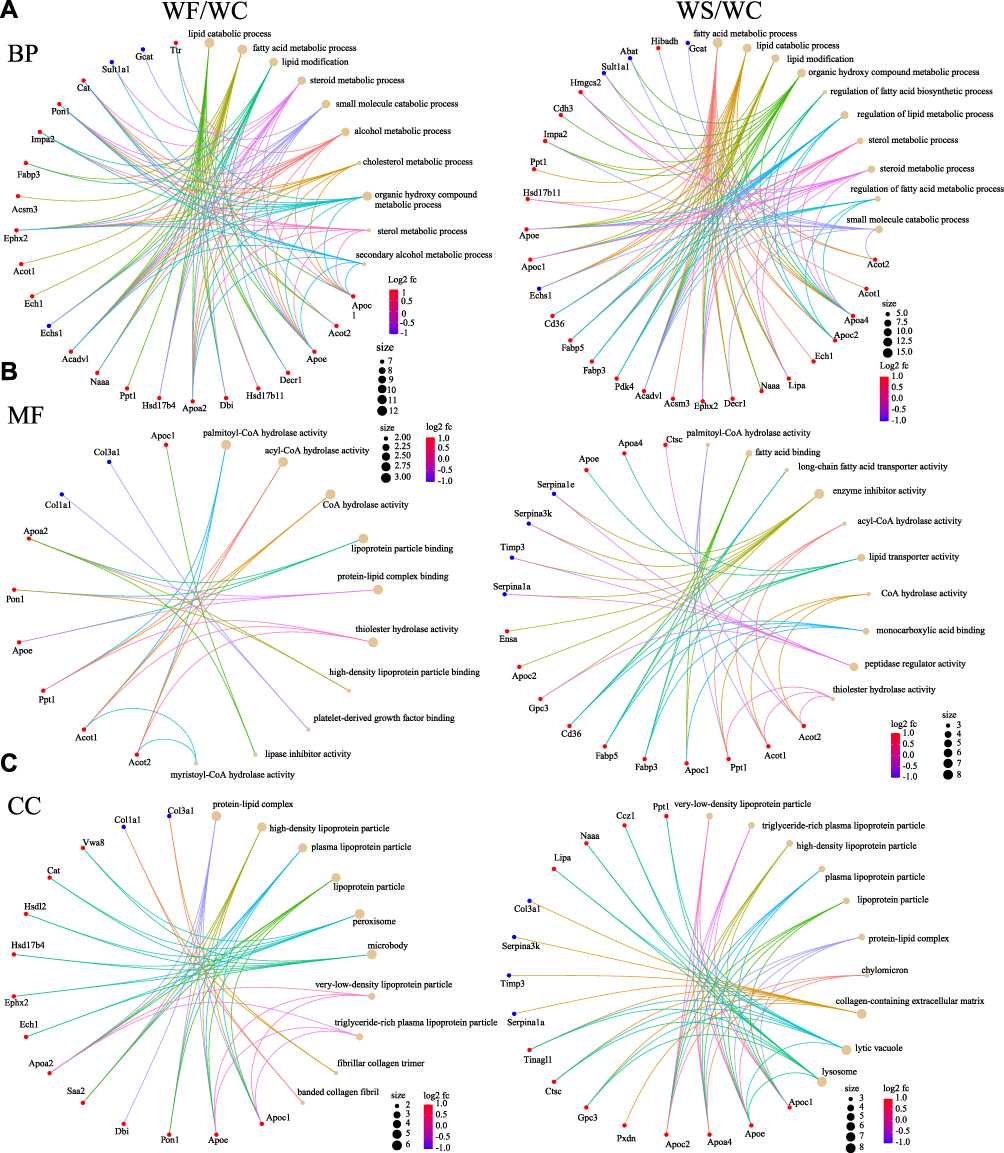 |
Figure 7 The GO functional enrichment circle map of DEPs between groups. (A) BP. (B) MF. (C) CC. The left side of the graph represents the WF/WC group, while the right side represents the WS/WC group. The brown circles and the different colored line segments represent different items. The different colors indicate the difference in fold change, with red being the largest and blue the smallest. The size of the circles represents the number of proteins enriched in the item. Abbreviations: DEPs, differentially expressed proteins; GO, Gene Ontology; BP, biological processes; MF, molecular function; CC, cell composition; WC, control group; WF, high-fat diet; WS, high-fat diet+semaglutide. |
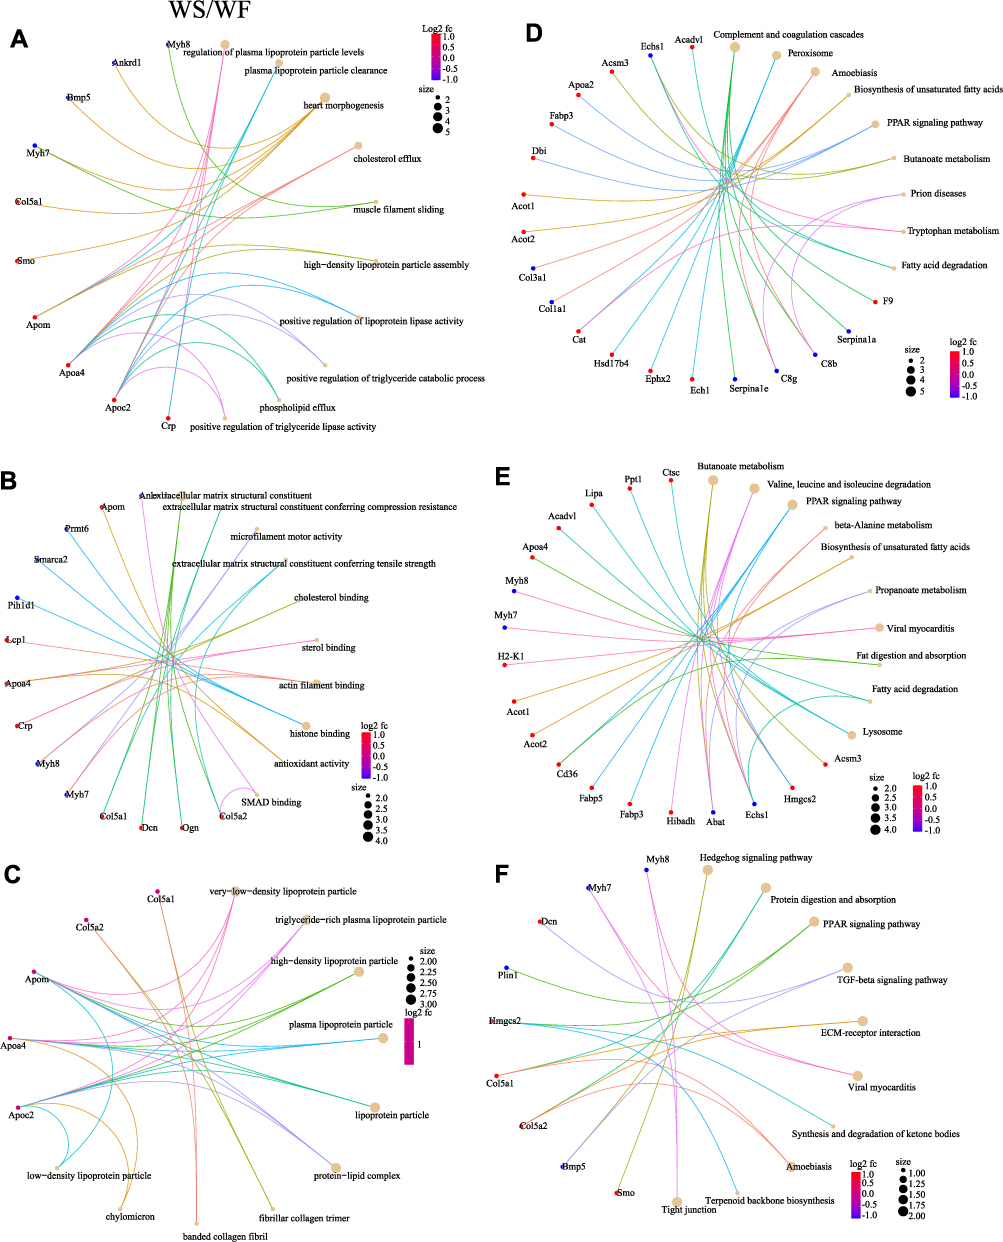 |
Figure 8 The GO functional enrichment and KEGG pathway enrichment. GO functional enrichment in WS/WF group. (A) BP. (B) MF. (C) CC. KEGG pathway enrichment analysis in WF/WC (D), WS/WC (E) and WS/WF (F). The left side represents the WF/WC group compared to each other, while the right side shows the WS/WC group compared to each other. The brown circles and the different colored line segments represent different items. The different colors indicate the difference in fold change, with red being the largest and blue the smallest. The size of the circles represents the number of proteins enriched in the item. Abbreviations: GO, Gene Ontology; BP, biological processes; MF, molecular function; CC, cell composition; KEGG, Kyoto Encyclopedia of Genes and Genomes; WC, control group; WF, high-fat diet; WS, high-fat diet+semaglutide. |
KEGG Pathway Analysis
Figure 8D-F displays the KEGG enrichment information of DEPs. Cardiac tissue DEPs in the WF/WC group were mainly associated with the complement and coagulation cascades, as well as peroxisome and amoebiasis. KEGG pathway analysis in the WS/WC group revealed that DEPs were mainly enriched in butanoate metabolism, valine, leucine, and isoleucine degradation, and the PPAR signaling pathway. In the WS/WF group, DEPs were mainly enriched in the Hedgehog signaling pathway, protein digestion and absorption and PPAR signaling pathway.
Analysis of DEPs in the WC/WF/WS Group
When DEPs from the three groups were compared, 15 upregulated proteins in the WF/WC group showed a significant decrease in expression following semaglutide intervention, whereas 13 downregulated proteins exhibited a significant increase in expression. The protein-protein interaction network of 28 DEPs showed that apolipoprotein A-II (Apoa2), catalase (Cat), diazepam-binding inhibitor (Dbi), paraoxonase-1 (Pon1), and hydroxysteroid 17-dehydrogenase-4 (Hsd17b4) were closely associated with each other and with the Cellular lipid metabolic process (Figure 9A). KEGG pathway analysis showed that the above proteins were mainly associated with the PPAR signaling pathway and the Peroxisome. Figure 9B demonstrates that semaglutide attenuated the elevated expression of Apoa2, Cat, Dbi, Pon1, and Hsd17b4 caused by obesity, indicating that semaglutide may exert cardioprotective effects by reducing Apoa2, Cat, Dbi, Pon1, and Hsd17b4 expressions.
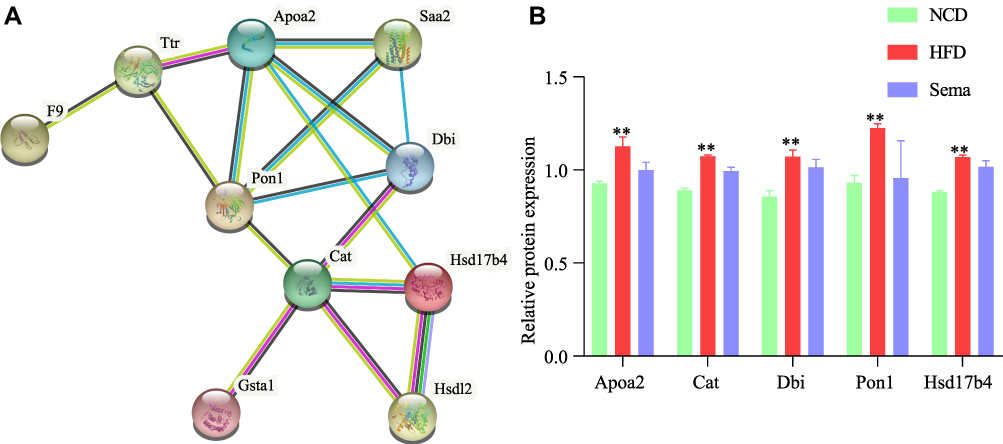 |
Figure 9 Interaction network and expression analysis of DEPs. (A) Protein-protein interaction network analysis of DEGs. (B) Relative expression of proteins. **P < 0.01. Abbreviations: DEPs, differentially expressed proteins; WC, control group; WF, high-fat diet; WS, high-fat diet+semaglutide. |
Discussion
Obesity is a major healthcare expense around the world, and it’s becoming worse every year.23 The rising prevalence of obesity is caused by changes in food structure, physical inactivity, and stress, with changes in the dietary structure being particularly crucial. According to multiple clinical and basic experiments, obesity generates a significant increase in lipid glucose levels and leads to metabolic disorders.24 According to the findings, obesity increased blood TG, TC, LDL-C, and fasting glucose levels in a high-fat diet-induced obesity mice model. Elevated cholesterol levels combined with the inflammatory state that occurs with obesity accelerate lipid oxidation, leading to atherosclerosis and impairment of heart function.25,26 TNF-α and IL-6 levels were significantly higher in obese serum and cardiac tissue, indicating a persistent inflammatory condition in vivo. Furthermore, increased ROS in cardiac tissue caused by obesity might result in lipid peroxidation and the production of toxic MDA. Increased lipid synthesis, inflammation, and oxidative stress all contribute to excessive MDA generation from lipid peroxidation. MDA levels in cardiac tissue are linked to mitochondrial activity, cell membrane damage, and the extent of peroxidative damage. Alterations in both lipid and oxidative stress indicators can affect cardiomyocyte metabolism and thus heart function.27,28 In the pre-obesity stage, activation of compensatory mechanisms in the heart (cardiomyocyte hypertrophy and ventricular wall thickening) can still produce adequate compensatory function, but once decompensated, it can result in irreversible and severe impairment of cardiac function.29,30 In mice, cardiac ultrasonography showed thickened ventricular walls and reduced ventricular volumes, indicating centripetal hypertrophy. However, a significant decrease in cardiac function was also observed in obese mice, as evidenced by a decrease in EF and FS, which may be related to the longer duration of the experiment and the smaller sample size.
Semaglutide is a new generation hypoglycemic drug, however, a large number of trials have demonstrated its considerable weight loss effect in individuals with diabetes and obesity.31 Semaglutide’s weight-loss efficacy has been widely investigated clinically in recent years, and the medicine can lower basal body weight by 20–30% with fewer side effects.32,33 Semaglutide has been discovered to have a preventive impact in the field of cardiovascular illnesses. Semaglutide has been demonstrated to reduce the risk of cardiovascular events in patients with type 2 diabetes and cardiovascular disease, as well as having cardioprotective benefits in patients with preexisting cardiovascular disease who are overweight or obese but do not have diabetes.34,35 Obese or overweight people may derive cardiac benefits from weight loss. It is unknown if semaglutide’s cardioprotective benefits are achieved through weight reduction or other mechanisms. Although this study did not examine the cardioprotective effects of weight loss with semaglutide. However, semaglutide significantly reduced body weight, which is a key aspect of its pharmacological effects. According to this study, semaglutide reduced lipid, TNF-α, IL-6, ROS, and MDA levels in obese mice. Semaglutide may protect the heart by reducing lipid synthesis and lipid peroxidation, according to the evidence.
The cardioprotective effects of semaglutide were evaluated using proteomics methods. Obesity altered cardiac protein expression significantly, primarily affecting lipid cholesterol metabolism. Following semaglutide administration, several proteins, particularly those involved in lipid metabolism, underwent significant changes. We discovered that the expression of Apoa2, Cat, Dbi, Pon1, and Hsd17b4 was dramatically increased in obesity but significantly reduced following semaglutide intervention, which, contrary to prior studies, did not change significantly after weight loss.36 As a result, we hypothesize that semaglutide may have cardioprotective effects by lowering the expression of the aforementioned proteins. Apoa2, Cat, Dbi, Pon1, and Hsd17b4 were also shown to be mostly connected with the PPAR signaling pathway and Peroxisome. The stimulation of the PPAR signaling system is linked to increased lipid synthesis and could be a cause of obesity-related lipid metabolism disorders. Obesity-related Peroxisome hyperactivation can lead to increased inflammation and oxidative stress, and we found that inflammation and oxidative stress levels are significantly higher in both serum and lipid tissues in obesity. To summarize, changes in the expression of these proteins may cause increased lipid synthesis combined with increased levels of inflammation and oxidative stress, resulting in increased lipid peroxide production. These factors together lead to impaired cardiac metabolism as well as function, and semaglutide may play a cardioprotective role through these aspects.
The HSD17B family plays a key role in sex steroid metabolism because of their propensity to interconvert different steroids.37 Hsd17b4 is involved in the catabolism of fatty acids and steroid hormones, and various studies have revealed Hsdl7b4 to be implicated in the development of prostate and breast cancer.38,39 Hsd17b4 is linked to the peroxisome, which catalyzes many critical metabolic activities, primarily related to lipid metabolism. Obesity alters peroxisome function, resulting in aberrant lipid metabolism.40 However, no relevant studies on the link between Hsd17b4 and cardiovascular illnesses have been conducted, and we discovered that semaglutide lowers Hsd17b4 levels induced by obesity, laying the groundwork for additional research.
ACBP (also known as a diazepam-binding inhibitor, DBI) is a tiny 87-amino-acid protein that regulates lipid metabolism by binding to long-chain acyl-CoA molecules intracellularly.41 According to mouse and human studies, ACBP is overexpressed in obesity, and inhibiting ACBP expression suppresses appetite and leads to weight reduction, making it a promising target for obesity treatment.42,43 Furthermore, there is a relationship between ACBP and PPAR, with studies in rats overexpressing ACBP showing a significant reduction in the expression levels of PPAR transcription factors, implicated in lipid metabolic disorders.44 According to the current study’s findings, ACBP expression in cardiac tissues was also raised in obesity and was strongly connected with PPAR, whereas levels reduced after semaglutide intervention. The previous study has demonstrated that semaglutide suppresses appetite, and since ACBP is an appetite-stimulating protein, the inhibition of ACBP protein expression by semaglutide is also well understood.
Apoa2 is the main component protein in human HDL particles, and unlike apoAI and the negative association with atherosclerosis, the biological and physiological functions of Apoa2 are largely unknown.45 Currently, research suggests that Apoa2 over-expression is associated with an increased risk of cardiovascular disease. Over-expression of Apoa2 has been associated with insulin resistance and exacerbation of atheromatous plaques in animal studies, with the possible mechanism being that cysteinylation of the monomeric chain regulates Apoa2 dimerization and increased HDL-C levels.46–48 In the present study, it was similarly found that HDL-C levels increased in obese mice and Apoa2 expression increased in cardiac tissues, whereas HDL-C levels did not decrease significantly after semaglutide intervention, but Apoa2 expression did, suggesting that semaglutide has a heart-protective effect.
Cat, expressed by the peroxidase gene, is a key antioxidant enzyme in the body, primarily responsible for the breakdown of toxic H2O2.49 Obesity raises H2O2 levels significantly owing to lower Cat expression, increasing oxidative stress in the body and causing cardiovascular disease.50,51 However, oxidative stress caused by Cat deficiency may alleviate obesity-related metabolic problems by decreasing inflammation.52 Furthermore, proteomics outcomes for obese mice’s heart tissues revealed that the Cat expression was upregulated, and one possible mechanism is that fatty acid oxidation increases mitochondrial H2O2 production during obesity, implying a higher level of oxidative stress in cardiac tissues during obesity,53 which is consistent with our findings. Pon-1 has also been demonstrated to prevent the oxidation of LDL particles, linked to several oxidative stress disorders, including cardiovascular disease and diabetes.54 Pon1 expression was higher in obesity, indicating higher levels of oxidative stress in cardiac tissue. On the other hand, decreased Cat and Pon1 expressions after semaglutide intervention reduces oxidative stress in the heart tissues. Of course, the above results may be related to the fact that the subjects of our experiments were mice and the time and dose of semaglutide intervention, which requires further experiments to verify our findings.
Conclusion
Obesity raises blood lipids, inflammation, and oxidative stress levels, resulting in lipid peroxidation and impaired heart function. Semaglutide treatment improved lipid metabolism, reduced oxidative stress and inflammation, decreased lipid peroxidation, and protected cardiac functions. Proteomics results of cardiac tissues revealed that semaglutide affected the Apoa2, Cat, Dbi, Pon1, and Hsd17b4 expression in obese mouse heart tissues, all of which are involved in lipid synthesis and transport. Therefore, we speculate that semaglutide may exert cardioprotective effects by reducing the expression of these proteins.
Data Sharing Statement
All data generated or analyzed during this study are included in the manuscript and are also available from the corresponding author upon request.
Ethical Approval
Animals used in this study were handled in accordance with the Guide for the Care and Use of Laboratory Animals published by the National Institutes of Health (NIH Publications No. 8023, revised 1978). All animal protocols were approved by the Animal Ethics Committee of Hebei General Hospital.
Disclosure
The authors report no conflicts of interest in this work.
References
1. Khazaei S, Soleimani M, Tafti SHA, Aghdam RM, Hojati Z. Improvement of Heart Function After Transplantation of Encapsulated Stem Cells Induced with miR-1/Myocd in Myocardial Infarction Model of Rat. Cell Transplant. 2021;30:9636897211048786. doi:10.1177/09636897211048786
2. Goudhaman L, Raja Jagadeesan A, Sundaramoorthi S, Thotla S, Krishna Mohan S. Association of Serum Asymmetric Dimethylarginine with the Severity of Coronary Artery Disease: a Pilot Study. Rep Biochem Mol Biol. 2021;10(2):302–306. doi:10.52547/rbmb.10.2.302
3. Berinstein E, Levy A. Recent developments and future directions for the use of pharmacogenomics in cardiovascular disease treatments. Expert Opin Drug Metab Toxicol. 2017;13(9):973–983. doi:10.1080/17425255.2017.1363887
4. Amar J. Microbiota-Host Crosstalk: a Bridge Between Cardiovascular Risk Factors, Diet, and Cardiovascular Disease. Am J Hypertens. 2018;31(8):941–944. doi:10.1093/ajh/hpy067
5. Francula-Zaninovic S, Nola IA. Management of Measurable Variable Cardiovascular Disease’ Risk Factors. Curr Cardiol Rev. 2018;14(3):153–163. doi:10.2174/1573403X14666180222102312
6. van Dongen LH, de Goede P, Moeller S, et al. Temporal variation in out-of-hospital cardiac arrest occurrence in individuals with or without diabetes. Resusc Plus. 2021;8:100167. doi:10.1016/j.resplu.2021.100167
7. Moore KJ, Shah R. Introduction to the Obesity, Metabolic Syndrome, and CVD Compendium. Circ Res. 2020;126(11):1475–1476. doi:10.1161/CIRCRESAHA.120.317240
8. Pang S, Song P, Sun X, et al. Dietary fructose and risk of metabolic syndrome in Chinese residents aged 45 and above: results from the China National Nutrition and Health Survey. Nutr J. 2021;20(1):83. doi:10.1186/s12937-021-00739-9
9. Liu SS, Kim JY, Park JH, et al. Fruit Intake and Changes of Cardio-Metabolic Risk Factors in People with Obesity. Korean J Fam Med. 2021;42(5):382–389. doi:10.4082/kjfm.20.0205
10. van der Velden AIM, van den Berg BM, de Mutsert R, et al. Microvascular differences in individuals with obesity at risk of developing cardiovascular disease. Obesity. 2021;29(9):1439–1444. doi:10.1002/oby.23222
11. Sagaro GG, Battineni G, Di Canio M, Amenta F. Self-Reported Modifiable Risk Factors of Cardiovascular Disease among Seafarers: a Cross-Sectional Study of Prevalence and Clustering. J Pers Med. 2021;11(6):512. doi:10.3390/jpm11060512
12. Juli L, Juli R, Juli G, Juli MR. New Therapeutic Strategies for Eating Disorders and Obesity Treatment. Psychiatr Danub. 2021;33(Suppl 9):84–85.
13. Rayner CK, Jones KL, Horowitz M. Semaglutide vs Placebo as an Adjunct to Intensive Behavioral Therapy and Body Weight in Adults With Overweight or Obesity. JAMA. 2021;326(12):1213–1214. doi:10.1001/jama.2021.13021
14. Klonoff DC, Bassock S, Engels E, et al. Semaglutide single-dose pen-injector: post hoc analysis of summative usability testing for weight management. Diabetes Obes Metab. 2021;23(11):2590–2594. doi:10.1111/dom.14509
15. Chen Y, Wei D, Deng M. Comparative Analysis of Serum Proteins Between Hepatitis B Virus Genotypes B and C Infection by DIA-Based Quantitative Proteomics. Infect Drug Resist. 2021;14:4701–4715. doi:10.2147/IDR.S335666
16. Moulder R, Schvartz D, Goodlett DR, Dayon L. Proteomics of Diabetes, Obesity, and Related Disorders. Proteomics Clin Appl. 2018;12(1):845. doi:10.1002/prca.201600134
17. López-Villar E, Martos-Moreno GÁ, Chowen JA, Okada S, Kopchick JJ, Argente J. A proteomic approach to obesity and type 2 diabetes. J Cell Mol Med. 2015;19(7):1455–1470. doi:10.1111/jcmm.12600
18. Hanash S. Disease proteomics. Nature. 2003;422(6928):226–232. doi:10.1038/nature01514
19. Xu L, Yu Y, Sang R, Li J, Ge B, Zhang X. Protective Effects of Taraxasterol against Ethanol-Induced Liver Injury by Regulating CYP2E1/Nrf2/HO-1 and NF-κB Signaling Pathways in Mice. Oxid Med Cell Longev. 2018;2018:8284107. doi:10.1155/2018/8284107
20. Pan X, Chen X, Ren Q, et al. Single-cell transcriptome reveals effects of semaglutide on non-cardiomyocytes of obese mice. Biochem Biophys Res Commun. 2022;622:22–29. doi:10.1016/j.bbrc.2022.07.034
21. Vileigas DF, Harman VM, Freire PP, et al. Landscape of heart proteome changes in a diet-induced obesity model. Sci Rep. 2019;9(1):18050. doi:10.1038/s41598-019-54522-2
22. Pan X, Chen S, Chen X, et al. UTP14A, DKC1, DDX10, PinX1, and ESF1 Modulate Cardiac Angiogenesis Leading to Obesity-Induced Cardiac Injury. J Diabetes Res. 2022;2022:2923291. doi:10.1155/2022/2923291
23. le Roux CW, Hartvig NV, Haase CL, Nordsborg RB, Olsen AH, Satylganova A. Obesity, cardiovascular risk and healthcare resource utilization in the UK. Eur J Prev Cardiol. 2021;28(11):1235–1241. doi:10.1177/2047487320925639
24. O’Neil PM, Birkenfeld AL, McGowan B, et al. Efficacy and safety of semaglutide compared with liraglutide and placebo for weight loss in patients with obesity: a randomised, double-blind, placebo and active controlled, dose-ranging, Phase 2 trial. Lancet. 2018;392(10148):637–649. doi:10.1016/S0140-6736(18
25. Piché ME, Tchernof A, Després JP. Obesity Phenotypes, Diabetes, and Cardiovascular Diseases. Circ Res. 2020;126(11):1477–1500. doi:10.1161/CIRCRESAHA.120.316101
26. Nishida K, Otsu K. Inflammation and metabolic cardiomyopathy. Cardiovasc Res. 2017;113(4):389–398. doi:10.1093/cvr/cvx012
27. Kolijn D, Pabel S, Tian Y, et al. Empagliflozin improves endothelial and cardiomyocyte function in human heart failure with preserved ejection fraction via reduced pro-inflammatory-oxidative pathways and protein kinase Gα oxidation. Cardiovasc Res. 2021;117(2):495–507. doi:10.1093/cvr/cvaa123
28. Watanabe K, Nagao M, Toh R, et al. Critical role of glutamine metabolism in cardiomyocytes under oxidative stress. Biochem Biophys Res Commun. 2021;534:687–693. doi:10.1016/j.bbrc.2020.11.018
29. Alpert MA, Omran J, Bostick BP. Effects of Obesity on Cardiovascular Hemodynamics, Cardiac Morphology, and Ventricular Function. Curr Obes Rep. 2016;5(4):424–434. doi:10.1007/s13679-016-0235-6
30. Harada T, Obokata M. Obesity-Related Heart Failure with Preserved Ejection Fraction: pathophysiology, Diagnosis, and Potential Therapies. Heart Fail Clin. 2020;16(3):357–368. doi:10.1016/j.hfc.2020.02.004
31. Ryan DH, Lingvay I, Colhoun HM, et al. Semaglutide Effects on Cardiovascular Outcomes in People With Overweight or Obesity (SELECT) rationale and design. Am Heart J. 2020;229:61–69. doi:10.1016/j.ahj.2020.07.008
32. Aroda VR, Ahmann A, Cariou B, et al. Comparative efficacy, safety, and cardiovascular outcomes with once-weekly subcutaneous semaglutide in the treatment of type 2 diabetes: insights from the SUSTAIN 1-7 trials. Diabetes Metab. 2019;45(5):409–418. doi:10.1016/j.diabet.2018.12.001
33. Thethi TK, Pratley R, Meier JJ. Efficacy, safety and cardiovascular outcomes of once-daily oral semaglutide in patients with type 2 diabetes: the PIONEER programme. Diabetes Obes Metab. 2020;22(8):1263–1277. doi:10.1111/dom.14054
34. Husain M, Birkenfeld AL, Donsmark M, et al. Oral Semaglutide and Cardiovascular Outcomes in Patients with Type 2 Diabetes. N Engl J Med. 2019;381(9):841–851. doi:10.1056/NEJMoa1901118
35. Bain SC, Mosenzon O, Arechavaleta R, et al. Cardiovascular safety of oral semaglutide in patients with type 2 diabetes: rationale, design and patient baseline characteristics for the PIONEER 6 trial. Diabetes Obes Metab. 2019;21(3):499–508. doi:10.1111/dom.13553
36. Liśkiewicz AD, Marczak Ł, Bogus K, Liśkiewicz D, Przybyła M, Lewin-Kowalik J. Proteomic and Structural Manifestations of Cardiomyopathy in Rat Models of Obesity and Weight Loss. Front Endocrinol. 2021;12:568197. doi:10.3389/fendo.2021.568197
37. Pan LC, Xiao HY, Yin WJ, Lin Z. Correlation between HSD17B4 expression in rat liver cancer tissues and inflammation or proliferation. Eur Rev Med Pharmacol Sci. 2018;22(11):3386–3393. doi:10.26355/eurrev_201806_15160
38. Huang H, Liu R, Huang Y, et al. Acetylation-mediated degradation of HSD17B4 regulates the progression of prostate cancer. Aging. 2020;12(14):14699–14717. doi:10.18632/aging.103530
39. Yamashita S, Hattori N, Fujii S, et al. Multi-omics analyses identify HSD17B4 methylation-silencing as a predictive and response marker of HER2-positive breast cancer to HER2-directed therapy. Sci Rep. 2020;10(1):15530. doi:10.1038/s41598-020-72661-9
40. Pyun JA, Kim S, Cha DH, Ko JJ, Kwack K. Epistasis between the HSD17B4 and TG polymorphisms is associated with premature ovarian failure. Fertil Steril. 2012;97(4):968–973. doi:10.1016/j.fertnstert.2011.12.044
41. Neess D, Kruse V, Marcher AB, et al. Epidermal Acyl-CoA-binding protein is indispensable for systemic energy homeostasis. Mol Metab. 2021;44:101144. doi:10.1016/j.molmet.2020.101144
42. Bravo-San Pedro JM, Sica V, Martins I, et al. Acyl-CoA-Binding Protein Is a Lipogenic Factor that Triggers Food Intake and Obesity. Cell Metab. 2019;30(4):754–767.e9. doi:10.1016/j.cmet.2019.07.010
43. Charmpilas N, Ruckenstuhl C, Sica V, et al. Acyl-CoA-binding protein (ACBP): a phylogenetically conserved appetite stimulator. Cell Death Dis. 2020;11(1):7. doi:10.1038/s41419-019-2205-x
44. Oikari S, Ahtialansaari T, Heinonen MV, et al. Downregulation of PPARs and SREBP by acyl-CoA-binding protein overexpression in transgenic rats. Pflugers Arch. 2008;456(2):369–377. doi:10.1007/s00424-007-0416-y
45. Melchior JT, Street SE, Vaisar T, et al. Apolipoprotein A-I modulates HDL particle size in the absence of apolipoprotein A-II. J Lipid Res. 2021;62:100099. doi:10.1016/j.jlr.2021.100099
46. Koike T, Koike Y, Yang D, et al. Human apolipoprotein A-II reduces atherosclerosis in knock-in rabbits. Atherosclerosis. 2021;316:32–40. doi:10.1016/j.atherosclerosis.2020.11.028
47. Warden CH, Hedrick CC, Qiao JH, Castellani LW, Lusis AJ. Atherosclerosis in transgenic mice overexpressing apolipoprotein A-II. Science. 1993;261(5120):469–472. doi:10.1126/science.8332912
48. Castellani LW, Gargalovic P, Febbraio M, Charugundla S, Jien ML, Lusis AJ. Mechanisms mediating insulin resistance in transgenic mice overexpressing mouse apolipoprotein A-II. J Lipid Res. 2004;45(12):2377–2387. doi:10.1194/jlr.M400345-JLR200
49. Li MY, Wang Y, Lei X, et al. Molecular characterization of a catalase gene from the green peach aphid (Myzus persicae). Arch Insect Biochem Physiol. 2021;108(2):e21835. doi:10.1002/arch.21835
50. Liang L, Shou XL, Zhao HK, et al. Antioxidant catalase rescues against high fat diet-induced cardiac dysfunction via an IKKβ-AMPK-dependent regulation of autophagy. Biochim Biophys Acta. 2015;1852(2):343–352. doi:10.1016/j.bbadis.2014.06.027
51. Gao J, Xie Q, Wei T, Huang C, Zhou W, Shen W. Nebivolol improves obesity-induced vascular remodelling by suppressing NLRP3 activation. J Cardiovasc Pharmacol. 2019. doi:10.1097/FJC.0000000000000667
52. Kim HR, Choi EJ, Kie JH, Lee JH, Seoh JY. Deficiency of glutathione peroxidase-1 and catalase attenuated diet-induced obesity and associated metabolic disorders. Acta Diabetol. 2020;57(2):151–161. doi:10.1007/s00592-019-01388-5
53. Rindler PM, Plafker SM, Szweda LI, Kinter M. High dietary fat selectively increases catalase expression within cardiac mitochondria. J Biol Chem. 2013;288(3):1979–1990. doi:10.1074/jbc.M112.412890
54. Yıldırım S, Akar S, Kuyucu M, Yıldırım A, Dane S, Aygül R. Paraoxonase 1 gene polymorphisms, paraoxonase/arylesterase activities and oxidized low-density lipoprotein levels in patients with migraine. Cell Biochem Funct. 2011;29(7):549–554. doi:10.1002/cbf.1785
 © 2022 The Author(s). This work is published and licensed by Dove Medical Press Limited. The full terms of this license are available at https://www.dovepress.com/terms.php and incorporate the Creative Commons Attribution - Non Commercial (unported, v3.0) License.
By accessing the work you hereby accept the Terms. Non-commercial uses of the work are permitted without any further permission from Dove Medical Press Limited, provided the work is properly attributed. For permission for commercial use of this work, please see paragraphs 4.2 and 5 of our Terms.
© 2022 The Author(s). This work is published and licensed by Dove Medical Press Limited. The full terms of this license are available at https://www.dovepress.com/terms.php and incorporate the Creative Commons Attribution - Non Commercial (unported, v3.0) License.
By accessing the work you hereby accept the Terms. Non-commercial uses of the work are permitted without any further permission from Dove Medical Press Limited, provided the work is properly attributed. For permission for commercial use of this work, please see paragraphs 4.2 and 5 of our Terms.