Back to Journals » Diabetes, Metabolic Syndrome and Obesity » Volume 16
Correlation Between Mean Amplitude of Glycemic Excursion and Bone Turnover Markers in Patients with Type 2 Diabetes: A Cross-Sectional Study
Authors Yang J, Zheng C, Wang Y, Yang L, Liu L
Received 9 September 2022
Accepted for publication 13 January 2023
Published 10 February 2023 Volume 2023:16 Pages 397—407
DOI https://doi.org/10.2147/DMSO.S388919
Checked for plagiarism Yes
Review by Single anonymous peer review
Peer reviewer comments 2
Editor who approved publication: Professor Gian Paolo Fadini
Jiamiao Yang,* Chao Zheng,* Yan Wang, Ling Yang, Lianyong Liu
Department of Endocrinology, Shanghai Punan Hospital of Pudong New District, Shanghai, People’s Republic of China
*These authors contributed equally to this work
Correspondence: Lianyong Liu; Ling Yang, Department of Endocrinology, Shanghai Punan Hospital of Pudong New District, No. 279, Linyi Road, Pudong New District, Shanghai, 200125, People’s Republic of China, Tel +86-18930502267 ; Tel +86-18930502267, Email [email protected]; [email protected]
Objective: The present study explores the relationship between glycemic excursion and bone turnover markers.
Methods: A total of 250 patients with type 2 diabetes mellitus (T2DM) (142 female and 108 male patients) were enrolled in this study. All participants underwent 72 hours of continuous glycemic monitoring to evaluate the mean amplitude of glycemic excursions (MAGE) of each person. Bone turnover markers and other biochemical data were measured for each patient. Linear regression was performed to explore the relationship between bone turnover markers and glycemic excursion. A value of P < 0.05 was considered statistically significant.
Results: MAGE was negatively correlated to N-terminal propeptide of type 1 collagen (P1NP) female: [odds ratios (95% confidence interval) (OR (95% CI)), − 2.516 (− 5.389, 0.356)]; male: [− 2.895, (− 6.521, − 0.731)] and C-terminal telopeptide fragments of type-I collagen (β-CTX) female [− 0.025, (− 0.036, 0.005)]; male [− 0.043, (− 0.082, 0.003)]. MAGE was still negatively correlated with β-CTX female [− 0.036, (− 0.198, − 0.030)]; male [− 0.048, (− 0.089, − 0.007)] after adjusting for clinical data and biochemical indices.
Conclusion: An independent negative relationship between glycemic excursion and bone turnover markers in patients with T2DM was identified in this study.
Keywords: bone turnover markers, continuous glucose monitoring, glycemic variability, mean amplitude of glycemic excursions, type 2 diabetes mellitus
Introduction
Type 2 diabetes mellitus (T2DM) has been proven to be a risk factor for osteoporosis despite some individuals having a higher bone mineral density (BMD).1–4 The leading external cause of fractures in patients with type 2 diabetes is the increased likelihood of patients suffering a fall.5 Hypoglycemia, increased nocturia, decreased vision (retinopathy or cataracts), reduced balance function (neuropathy, foot ulcers, and amputation), orthostatic hypotension, and reduced response are all related to falls and fractures in patients with diabetes. A 7-year prospective follow-up study of more than 90,000 patients with type 2 diabetes revealed that patients with type 2 diabetes had a 20% higher fracture risk than those without diabetes, even after adjusting for factors such as falls and fracture history.6 Decreased bone strength and impaired bone quality are inherent factors associated with higher fracture risk in type 2 diabetes. In patients with type 2 diabetes, cortical bone thickness and trabecular bone volume decreases, cortical bone porosity increases, and bone material scientific parameters worsen.7,8 It has been proven in vitro that hyperglycemia can inhibit bone formation and resorption.9,10 In this current clinical work, the glycemic control levels were primarily assessed based on glycated hemoglobin (HbA1c). Previous studies have demonstrated that poor glycemic control, as assessed by HbA1c, was associated with lower concentrations of bone formation biomarkers.11 However, HbA1c can only be used to evaluate long-term glycemic control and cannot reflect short-term blood glucose fluctuations. Previous studies have shown that the mean amplitude of glycemic excursions (MAGE) has also been confirmed as an independent risk factor for chronic complications of diabetes, even in type 2 diabetes patients with the glycated standard.12 A recent cross-sectional study showed that glycemic excursions are negatively related with bone turnover markers in patients with short diabetes duration and reasonable glucose control.13 However, the association between glycemic excursion and bone turnover markers in other diabetic stages has not been examined.
The present study is designed to explore the relationship between the variability of glucose and bone turnover markers among patients with T2DM. The hypothesis put forward in this study is that in patients with T2DM, bone turnover markers are negatively associated with glycemic excursion.
Materials and Methods
Study Population
This study was carried out in accordance with the principles and ethical standards of the Declaration of Helsinki.14
In this cross-sectional study, the medical records of patients with T2DM visiting the Department of Endocrinology and Metabolism, Shanghai Punan Hospital of Pudong New District (Shanghai, P.R. China) from February 1 to July 30, 2021, were collected. T2DM was defined in accordance with the standards outlined by the American Diabetes Association.15 The exclusion criteria included patients who had acute or chronic infections, end-stage renal disease, past or current malignancies, pregnancy, were lactating, acute complications of diabetes, long-term bedridden status, and those who were taking antiosteoporosis medications. Patients with incomplete data on bone metabolism and continuous glucose monitoring (CGM) were also excluded.
Assessment
Relevant information about the patients such as age, sex, whether diabetes duration was longer than 5 years, menstrual history, disease history, and current medications were recorded.
Overnight fasting venous blood samples were acquired. Fasting plasma glucose was tested using the glucose oxidase method. The HbA1c test was conducted by high-performance liquid chromatography (HPLC). The plasma insulin was tested using the immunoradiometric method. Total cholesterol (TC), triglycerides (TG), high-density lipoprotein (HDL), and low-density lipoprotein (LDL) were all measured using the enzyme-linked immunosorbent assay. Serum osteocalcin, C-terminal telopeptide fragments of type-I collagen (β-CTX), and calcifediol were tested by radioimmunoassay. Serum calcium and phosphorus, alanine transaminase, aspartate transaminase, and serum creatinine were determined using an autoanalyzer (Modular DP analyzer, Roche, Swiss). The estimated glomerular filtration rate (eGFR) was calculated to evaluate renal function.16 The homeostatic model assessment of insulin resistance was calculated using the formula  , with FPG and FPI representing the fasting plasma glucose and fasting plasma insulin levels, respectively.
All patients were equipped with a CGM sensor for at least 72 hours (iPro 2; Medtronic MiniMed). Patients were told not to change their usual lifestyle during the monitoring period. The patients’ MAGE—the most typical glycemic variability index—was recorded.17 The MAGE was defined as the average of the absolute values of all adjacent peak-valley differences greater than one standard deviation (SD).18
Statistical Analysis
Based on normal distribution, continuous data were represented by the mean ± SD or median (quartile difference, inter-quartile range). Categorical variables were represented by numbers (percentages). All analyses were performed using SPSS 22.0 software (SPSS Inc., IBM). Scatter plots were performed by GraphPad Prism 7.0 software (San Diego, CA, USA) to explore the relationship between glucose variability and bone turnover markers. Non normally distributed data were transformed using natural logarithms until they conformed to a normal distribution. Comparisons between the two groups were made with independent-sample t-tests for continuous variables and Chi-squared tests for categorical variables. When establishing the linear regression model, the normal distribution hypothesis, the linear hypothesis of the dependent variable and independent variable, the confidence hypothesis and the homovariance hypothesis were tested. Linear regression was used to evaluate the associations among patient characteristics, glycemic control, and bone turnover markers. Multivariate regression included univariate linear regression and confounding factors of hypoglycemic medication history with P < 0.1. In this study, P < 0.05 was considered statistically significant.
Results
A total of 396 patients were recruited for this observational study, and 146 were excluded (Figure 1). The demographics and characteristics of the enrolled patients are shown in Table 1. Significant differences were found between male and female patients in waist–hip ratio, smoking, HDL-C, and N-terminal propeptide of type 1 collagen (P1NP), as shown in Table 1. Male T2D patients generally had a larger waist–hip ratio, higher smoking ratio, lower HDL-C, and lower P1NP than female patients. Age, body mass index (BMI), diabetes duration, physical activity, antidiabetic medication, and glucose control were roughly the same between the sexes (Table 1).
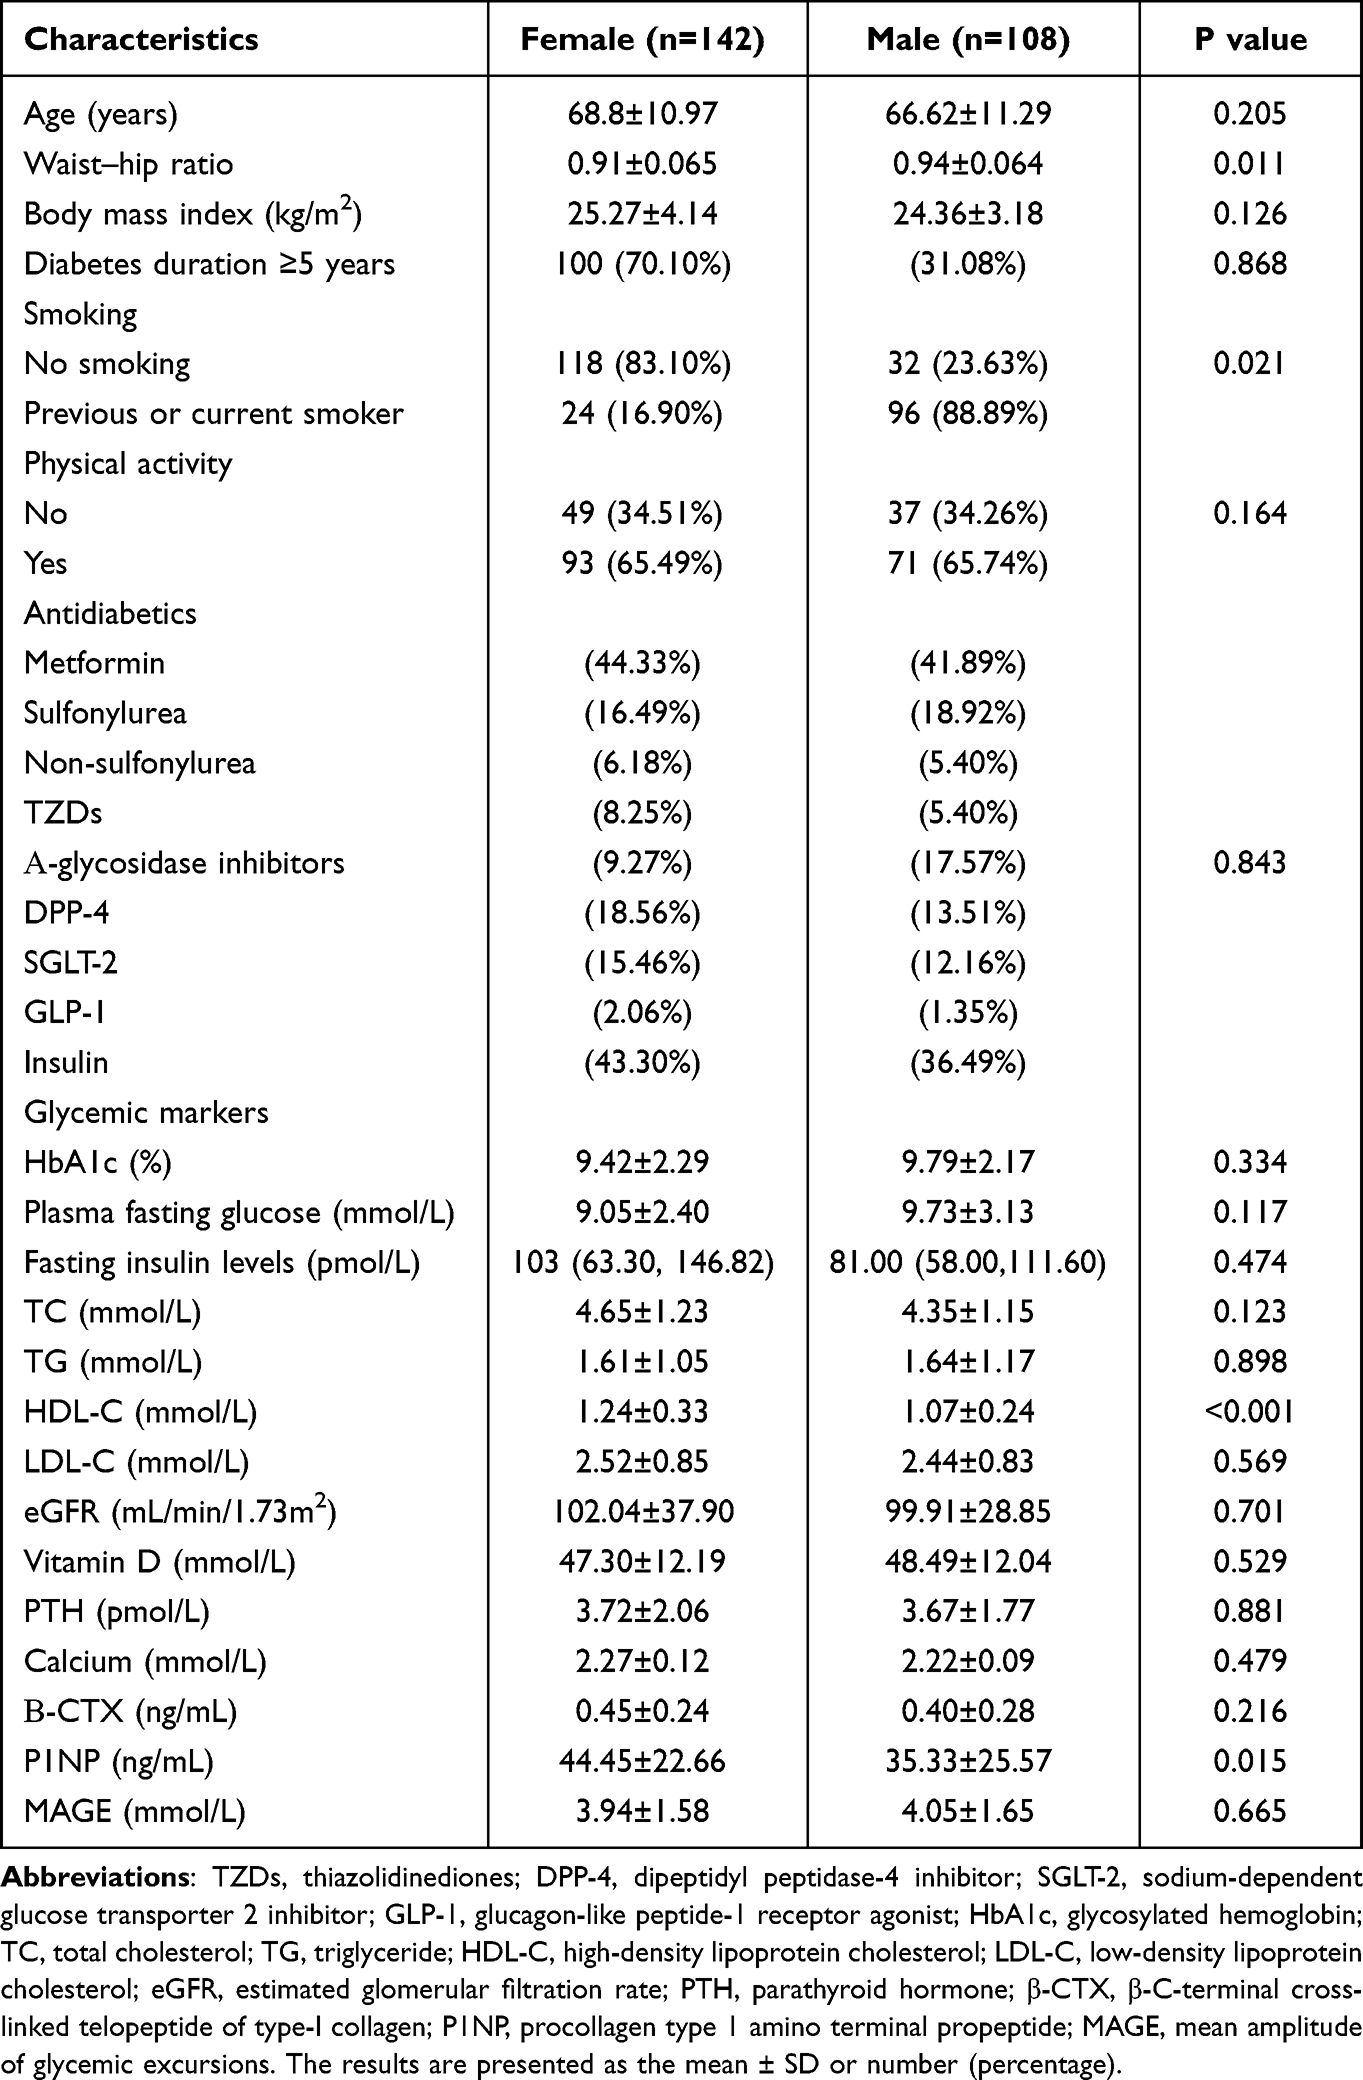 |
Table 1 Patient Characteristics |
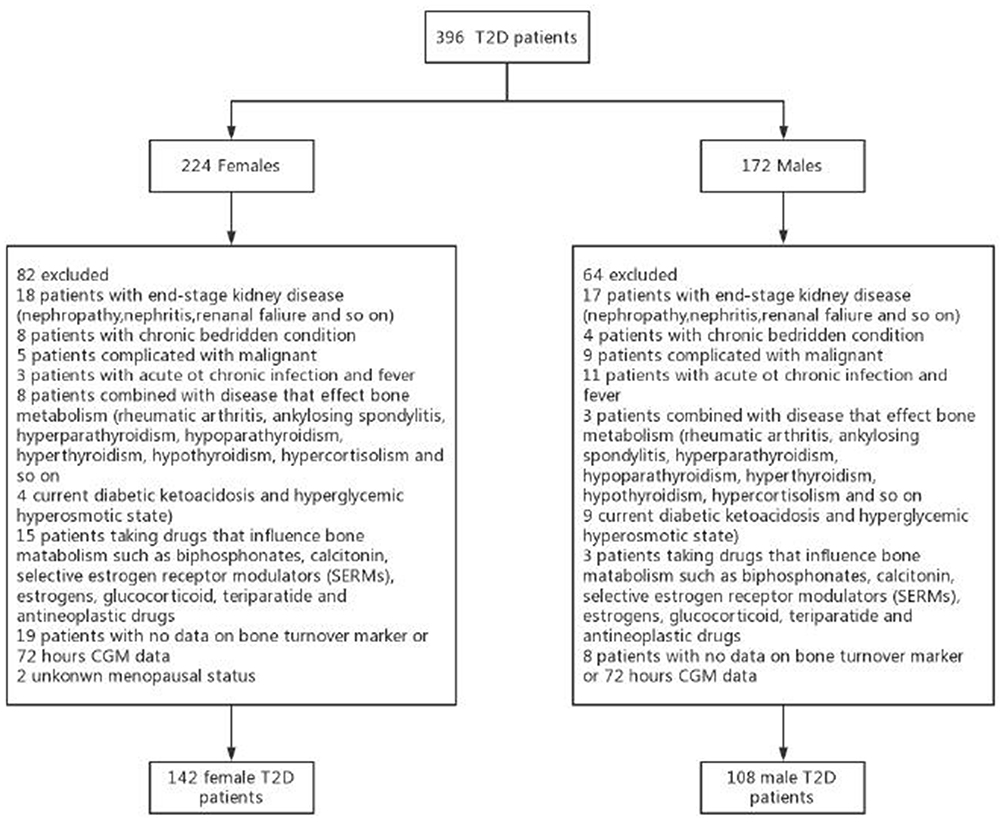 |
Figure 1 Flow chart of the study. A total of 396 patients with type 2 diabetes mellitus (T2DM) were recruited. After applying the inclusion and exclusion criteria, 146 patients were excluded. Finally, 250 patients with T2DM (142 female and 108 male patients) were included in the analysis. |
Bone Turnover Markers and the Relationship with the Demographic Data and Biochemical Markers
As shown in Table 2, in female patients, β-CTX was significantly correlated with age [odds ratios (95% confidence interval), 0.005, (0.001, 0.010)], menstrual history [0.195, (0.011, 0.380)], TG [−0.049, (−0.097, −0.001)], and LDL-C [−0.063, (−0.122, −0.003)], and was borderline associated with MAGE [−0.025, (−0.036, 0.005)] in univariate linear regression. P1NP was significantly correlated with age [0.468, (0.058, 0.877)], BMI [1.215, (0.100, 2.330)], menstrual history [18.384, (0.726, 36.042)], HbA1c [−2.759, (−4.932, −0.586)], and LDL-C [−6.443, (−12.181, −0.705)], and was borderline associated with TC [−3.798, (−7.788, 0.793)], eGFR [−0.112, (−0.237, 0.014)], and MAGE [−2.516, (−5.389, 0.356)] in univariate linear regression.
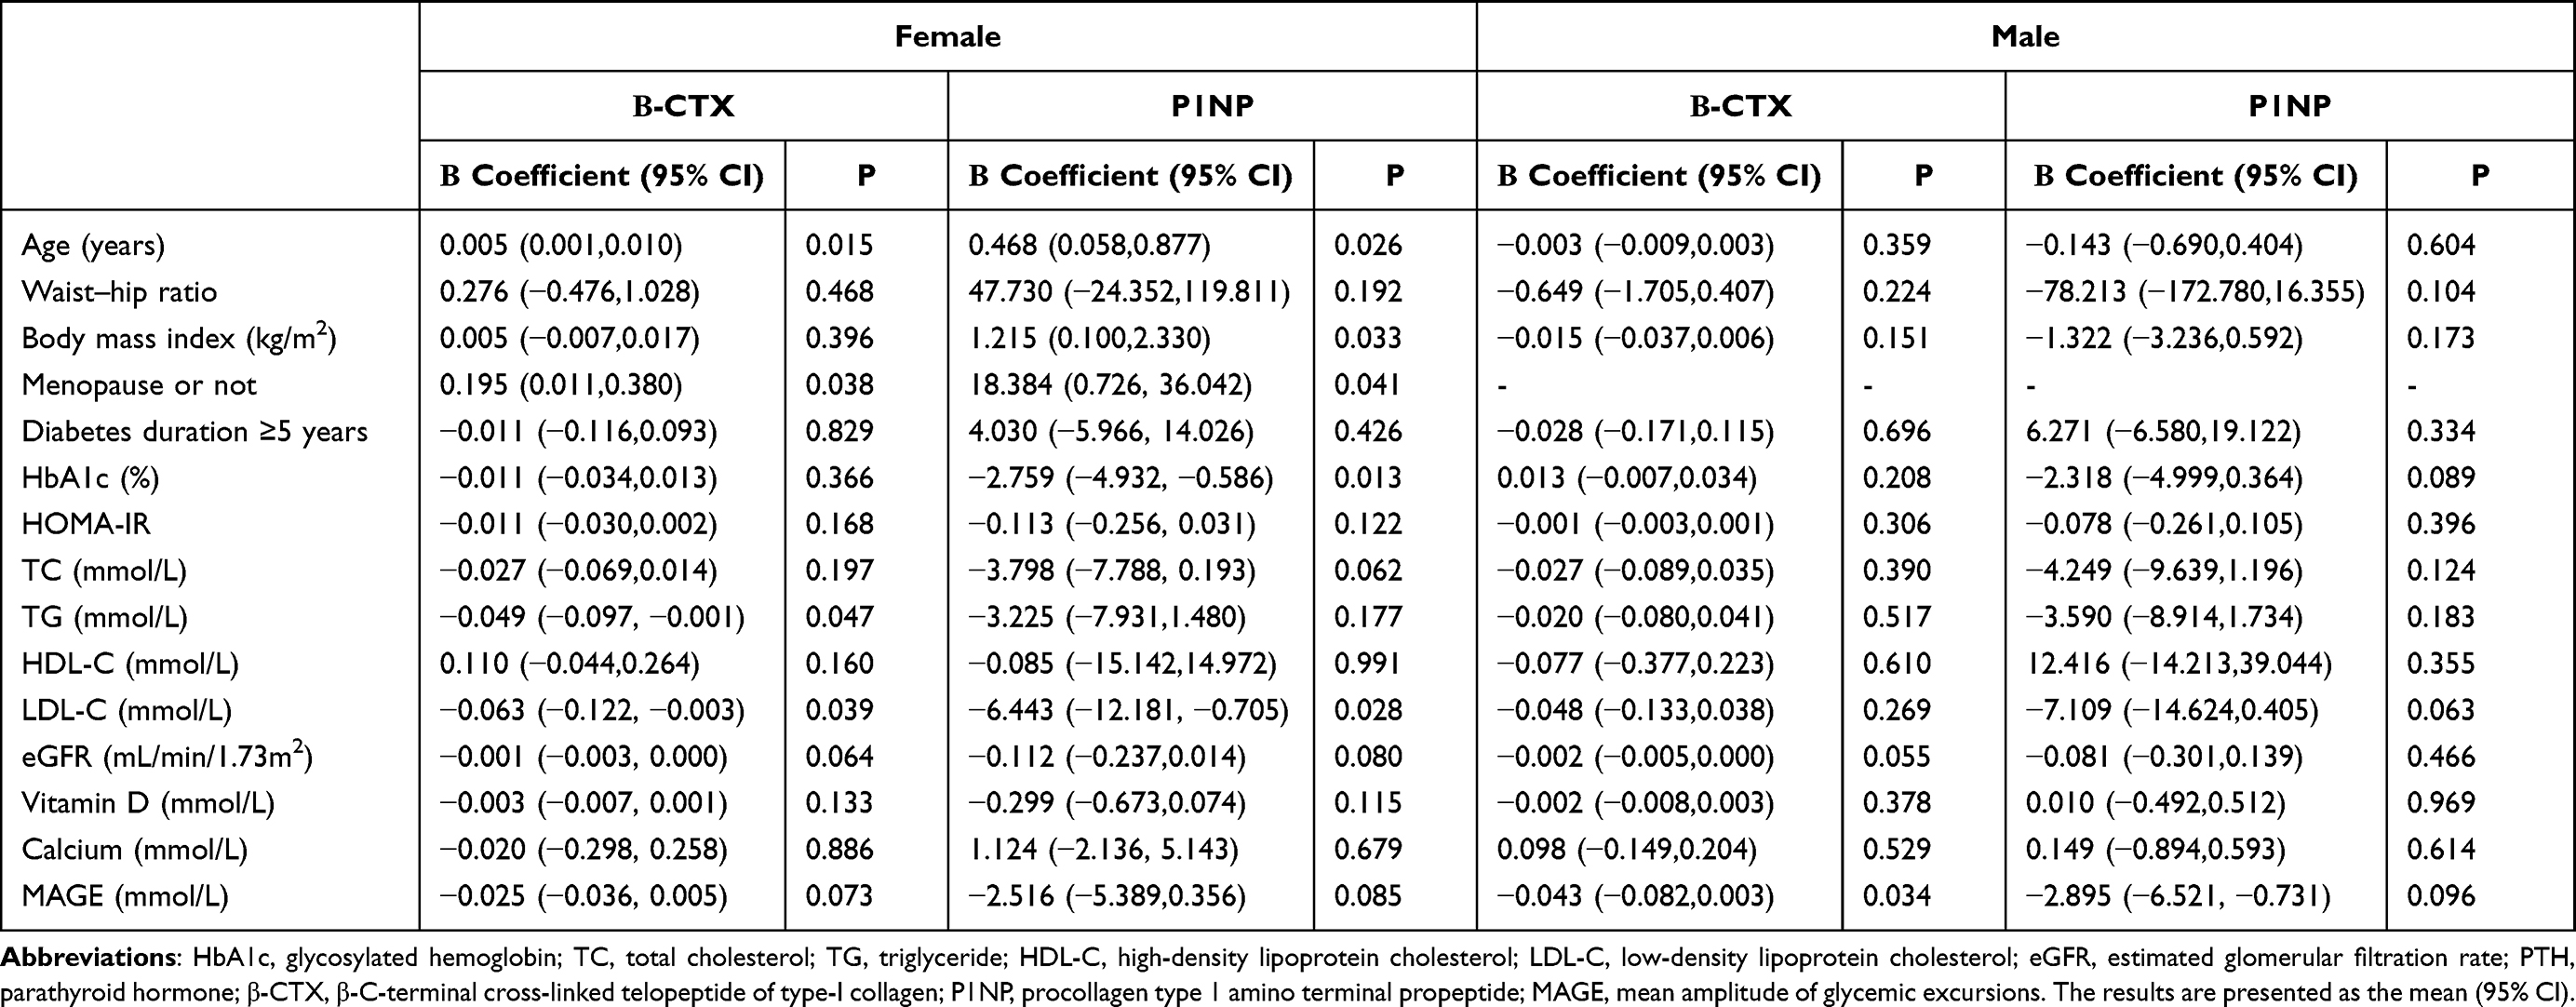 |
Table 2 Univariable Regression Analysis of the Correlation Between Bone Markers and Demographic/Biochemical Datas |
However, among male patients, β-CTX only showed a significant correlation with MAGE [−0.043, (−0.082, 0.003)] and was marginally correlated with eGFR [−0.002, (−0.005, 0.000)] in univariate linear regression. P1NP was marginally associated with HbA1c [−2.318, (−4.999, 0.364)], LDL-C [−7.109, (−14.624, 0.405)], and MAGE [−2.895, (−6.521, −0.731)] in univariate linear regression (Table 2). Figure 2 displays the association between CTX and P1NP with MAGE in men and women.
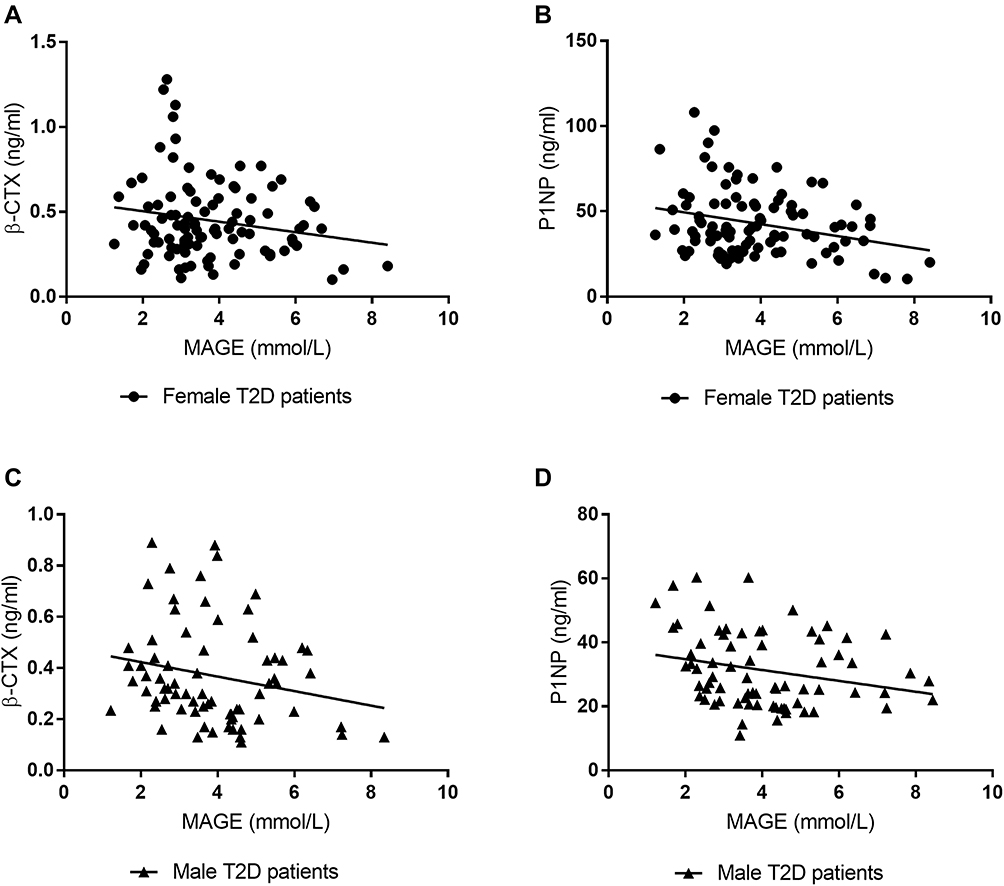 |
Figure 2 Scatterplot and regression line of C-terminal telopeptide fragments of type-I collagen (β-CTX) and N-terminal propeptide of type 1 collagen (P1NP) levels by the mean amplitude of glycemic excursions (MAGE). (A) The β-CTX by MAGE in female patients with T2DM, (B) P1NP by MAGE in female patients with T2DM, (C) β-CTX by MAGE in male patients with T2DM, and (D) P1NP by MAGE in male patients with T2DM. |
Multivariate Association Between Bone Markers and Glucose Variability
A multivariate association analysis was performed to eliminate the influence of confounding factors on the relationship between glycemic excursion and bone turnover markers. The results of the multivariate association analysis are shown in Table 3.
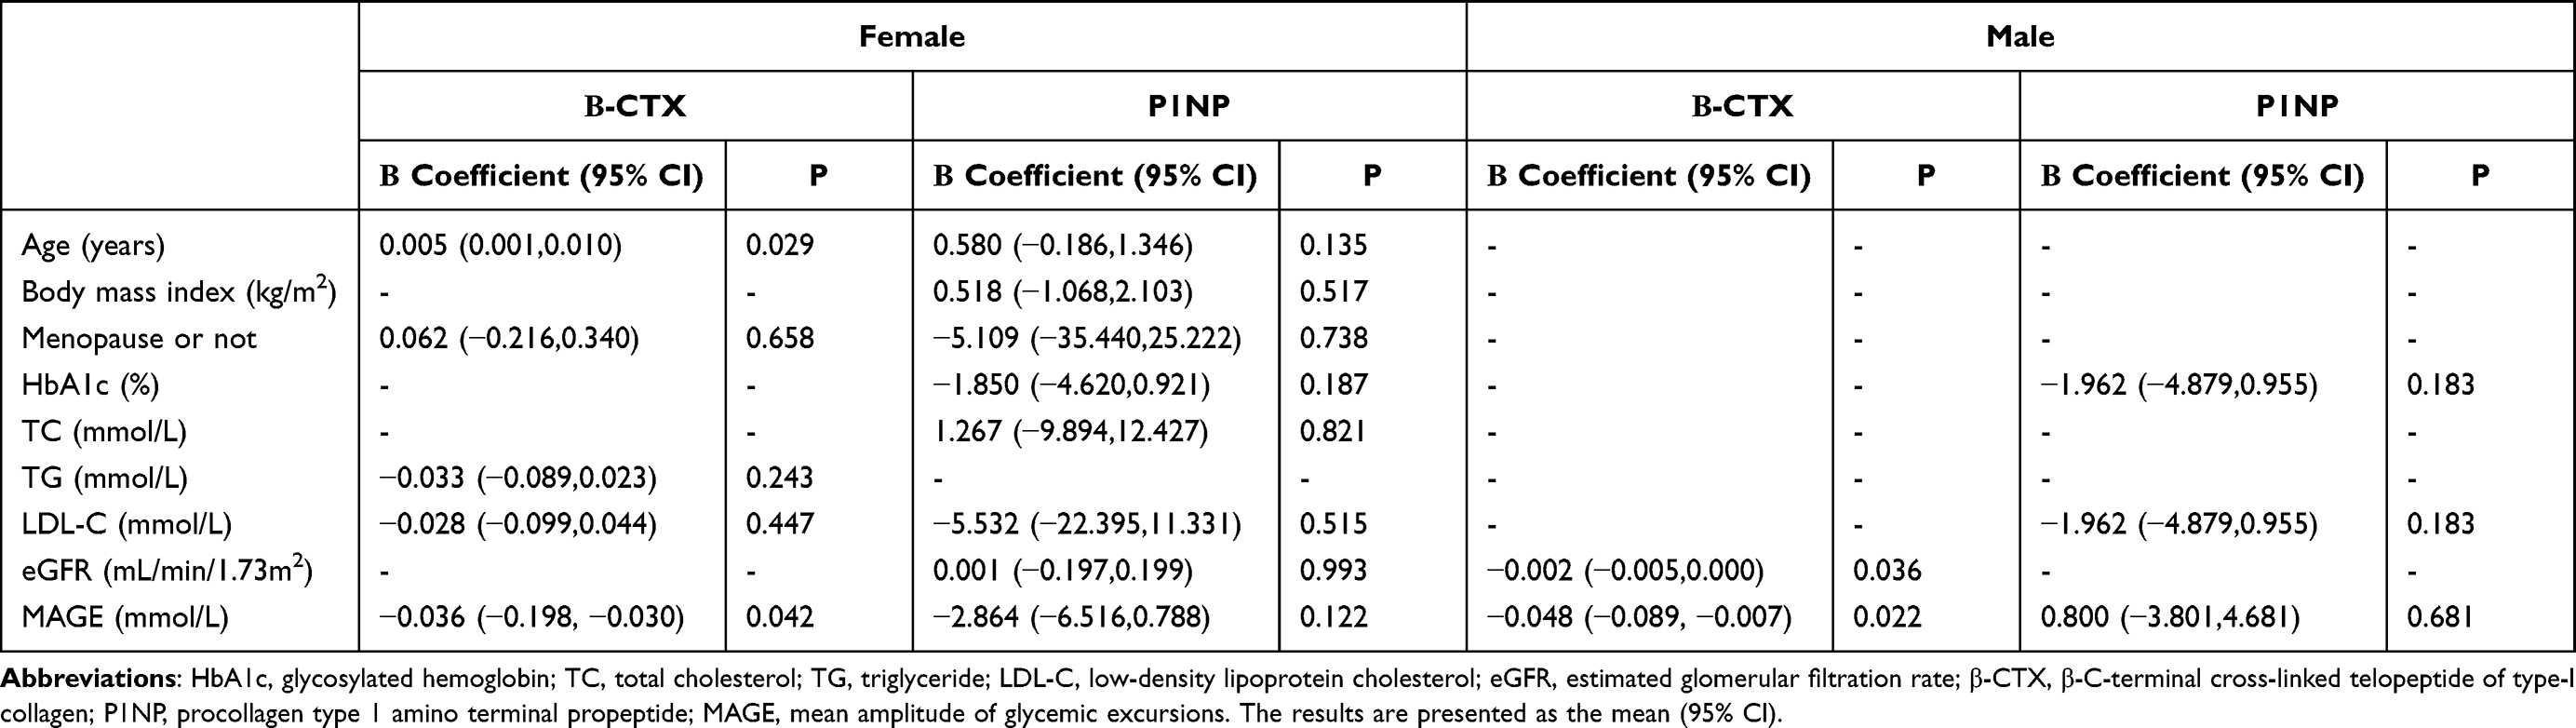 |
Table 3 Multivariable Regression Analysis of the Correlation Between Bone Markers and Glycemic Variability |
A significant association remained between MAGE and β-CTX [odds ratios (95% confidence interval), −0.036, (−0.198, −0.030)] after adjusting for age, menstrual history, TC, LDL-C, and medication history for female patients with diabetes. However, the correlation between MAGE and P1NP [−2.864, (−6.516, 0.788)] was eliminated when age, BMI, menstrual history, HbA1c, TC, LDL-C, eGFR, and medication history were included (Table 3).
The correlation between MAGE and bone markers among male patients was similar to that among female patients. A significant association still existed between MAGE and β-CTX [odds ratios (95% confidence interval),−0.048, (−0.089, −0.007)] after adjusting for eGFR. There was no significant relationship between MAGE and P1NP [0.800, (−3.801, 4.681)] after adjusting for HbA1c and LDL-C (Table 3).
Discussion
The results of this study confirmed that bone turnover markers were negatively associated with glucose variability in male and female patients with T2DM, irrespective of disease duration. To the best of this authors’ knowledge, this is the first study to explore the relationship between glucose variability and bone metabolism among patients with T2DM who had poor glucose control. β-CTX was significantly negatively correlated with glucose variability even when the effects of medical history and metabolism were eliminated. This finding concurs with the conclusion of a recent study of well-controlled glycemic level of patients whose diabetes duration was under 5 years.13
The MAGE can reflect a more detailed glucose profile than HbA1c. A recent study demonstrated that MAGE is an independent predictive factor of osteoporosis in patients with T2DM.19 In the present study, MAGE was demonstrated to be a vital influencing factor of bone turnover, as shown in Figure 2. Furthermore, β-CTX was found to be independently negatively correlated with glycemic variability; however, with respect to P1NP, the relationship was weakened after adjustment. P1NP has high specificity and sensitivity in predicting the occurrence of osteoporosis and evaluating and monitoring its treatment, and is not affected by hormones.20 Regrettably, sex hormones were not included in the analysis in this study, which may have caused the different results of β-CTX and P1NP in the multivariate analysis.
The mechanism of association of MAGE with bone conversion remains unclear. The negative correlation between bone turnover markers and glycemic variability may be due to the direct influence of hyperglycemia on osteoclasts and osteoblasts.21,22 In patients with T2DM, the risk of fracture is increased despite an increased BMD.3 The hypothesis put forward in this study is that patients with T2DM have high bone mineralization and accumulate micro-fractures due to low bone turnover, leading to clinical fractures.23 In patients with T2DM, blood glucose fluctuations may lead to low bone metabolic activity and lower bone metabolic marker levels, causing bone hypermetabolism.
In addition, high glycemic variability may also adversely affect the clinical outcomes of patients with T2DM, including atherosclerotic vascular disease.24–26 Atherosclerotic vascular disease is associated with significant changes in BMD and structure. Recent studies have shown that low BMD and osteoporosis are associated with cardiovascular disease.27 In addition, increased glycemic variability is also associated with short-term weight loss in patients with T2DM.28–30 Fluctuations in glucose significantly impact the structure of the intestinal gut flora.31 An observational study in England and Henan Province in China proved that gut microbiota is associated with bone mineral density, indicating that gut microbiota potentially impacts bone metabolism.32,33 The gut microbiota may mediate the MAGE-induced bone hypermetabolic state.
Interestingly, the levels of bone turnover markers were more strongly correlated with age, menstrual history, and metabolic index in women with T2DM than in men. In female patients, age was significantly associated with P1NP and β-CTX. Estrogen levels in older women decline rapidly after menopause, while testosterone levels in older men decline more slowly.34 It has been well established that sex hormones strongly influence bone metabolism. Several studies have confirmed the effects of estrogen on osteoporosis. In vitro studies have confirmed that estrogen inhibits the apoptosis of bone cells,35 osteoclasts, and bone resorption.36 Androgen regulates bone metabolism by transforming into estrogen through aromatization and inhibits osteoclast formation induced by the parathyroid hormone.37 In this study, the patients enrolled were mainly older and experiencing changes in sex hormones, leading to different results in male and female patients.
It has been previously reported that patients with T2DM with higher HbA1c levels have lower bone turnover markers.38,39 In this study, HbA1c was negatively correlated with P1NP but not with β-CTX. Previous studies have confirmed that patients with T2DM have suppressed bone turnover and reduced bone formation,7,40 which is consistent with the results of this study.
However, whether the reason for the relationship between bone turnover markers and MAGE is the glucose variability itself or if there are other elements affecting glucose fluctuations such as medication history, could not be confirmed in the current study. Many hypoglycemic drugs are available to treat T2DM such as insulin, metformin, and sulfonylureas. Previous studies have demonstrated that different types of antidiabetic drugs may have a positive, neutral, or negative impact on bone metabolism.41 No significant relationship between medical history and bone turnover markers was found in this study. This may be due to the small sample size and uneven course of T2DM.
There were several limitations of this study. The clinical parameters included in the study were affected by various factors such as sex hormone and bone-derived alkaline phosphatase, and whether glucose variability directly impacts bone metabolism needs further study. In addition, this was a cross-sectional study of a prominent phenomenon and could not establish a causal relationship between glucose fluctuations and bone turnover markers. The causality and underlying mechanisms between glucose excursion and bone turnover remain to be elucidated.
Conclusion
In conclusion, these results demonstrate a negative correlation between bone turnover markers and glucose variability in patients with T2DM. However, more prospective studies are needed to confirm this.
Highlights
There is a negative association between glycemic variability and bone turnover markers in patients with T2DM.
Ethics Approval and Consent to Participate
This study was conducted in accordance with the declaration of Helsinki. This study was conducted with approval from the Ethics Committee of Shanghai Punan Hospital of Pudong New District. A written informed consent was obtained from all participants.
Author Contributions
All authors made a significant contribution to the work reported, whether that is in the conception, study design, execution, acquisition of data, analysis and interpretation, or in all these areas; took part in drafting, revising or critically reviewing the article; gave final approval of the version to be published; have agreed on the journal to which the article has been submitted; and agree to be accountable for all aspects of the work.
Funding
The Outstanding Leaders Training Program of Pudong Health Bureau of Shanghai (PWRI2018-02) and Shanghai Municipal Health Commission (201940408).
Disclosure
The authors report no conflicts of interest in this work.
References
1. Schwartz AV, Vittinghoff E, Bauer DC, et al. Association of BMD and FRAX score with risk of fracture in older adults with type 2 diabetes. JAMA. 2011;305(21):2184–2192. doi:10.1001/jama.2011.715
2. Wang H, Ba Y, Xing Q, et al. Diabetes mellitus and the risk of fractures at specific sites: a meta-analysis. BMJ Open. 2019;9(1):e24067.
3. Vestergaard P. Discrepancies in bone mineral density and fracture risk in patients with type 1 and type 2 diabetes--a meta-analysis. Osteoporos Int. 2007;18(4):427–444. doi:10.1007/s00198-006-0253-4
4. Janghorbani M, Van Dam RM, Willett WC, et al. Systematic review of type 1 and type 2 diabetes mellitus and risk of fracture. Am J Epidemiol. 2007;166(5):495–505. doi:10.1093/aje/kwm106
5. Gregg EW, Beckles GL, Williamson DF, et al. Diabetes and physical disability among older U.S. adults. Diabetes Care. 2000;23(9):1272–1277. doi:10.2337/diacare.23.9.1272
6. Bonds DE, Larson JC, Schwartz AV, et al. Risk of fracture in women with type 2 diabetes: the Women’s Health Initiative Observational Study. J Clin Endocrinol Metab. 2006;91(9):3404–3410. doi:10.1210/jc.2006-0614
7. Manavalan JS, Cremers S, Dempster DW, et al. Circulating osteogenic precursor cells in type 2 diabetes mellitus. J Clin Endocrinol Metab. 2012;97(9):3240–3250. doi:10.1210/jc.2012-1546
8. Farr JN, Drake MT, Amin S, et al. In vivo assessment of bone quality in postmenopausal women with type 2 diabetes. J Bone Miner Res. 2014;29(4):787–795. doi:10.1002/jbmr.2106
9. Tanaka K, Yamaguchi T, Kanazawa I, et al. Effects of high glucose and advanced glycation end products on the expressions of sclerostin and RANKL as well as apoptosis in osteocyte-like MLO-Y4-A2 cells. Biochem Biophys Res Commun. 2015;461(2):193–199. doi:10.1016/j.bbrc.2015.02.091
10. Pacicca DM, Brown T, Watkins D, et al. Elevated glucose acts directly on osteocytes to increase sclerostin expression in diabetes. Sci Rep. 2019;9(1):17353. doi:10.1038/s41598-019-52224-3
11. Starup-Linde J, Lykkeboe S, Gregersen S, et al. Differences in biochemical bone markers by diabetes type and the impact of glucose. Bone. 2016;83:149–155. doi:10.1016/j.bone.2015.11.004
12. Xu F, Zhao LH, Su JB, et al. The relationship between glycemic variability and diabetic peripheral neuropathy in type 2 diabetes with well-controlled HbA1c. Diabetol Metab Syndr. 2014;6(1):139. doi:10.1186/1758-5996-6-139
13. Starup-Linde J, Lykkeboe S, Handberg A, et al. Glucose variability and low bone turnover in people with type 2 diabetes. Bone. 2021;153:116159. doi:10.1016/j.bone.2021.116159
14. Noble JJ. Declaration of Helsinki. DEAD BMJ. 2007;335(7623):736.
15. Draznin B, Aroda VR, Bakris G, et al. Summary of revisions: standards of medical care in diabetes-2022. Diabetes Care. 2022;45(Supplement_1):S4–S7.
16. Levey AS, Coresh J, Greene T, et al. Using standardized serum creatinine values in the modification of diet in renal disease study equation for estimating glomerular filtration rate. Ann Intern Med. 2006;145(4):247–254. doi:10.7326/0003-4819-145-4-200608150-00004
17. Monnier L, Colette C, Sardinoux M, et al. Frequency and severity of the Dawn phenomenon in type 2 diabetes: relationship to age. Diabetes Care. 2012;35(12):2597–2599. doi:10.2337/dc12-0385
18. Rausch JR. Measures of glycemic variability and links with psychological functioning. Curr Diab Rep. 2010;10(6):415–421. doi:10.1007/s11892-010-0152-0
19. Rong Huang HWZS. Increased glycemic variability evaluated by continuous glucose monitoring is associated with osteoporosis in type 2 diabetic patients. Front Endocrinol. 2022;13:861131.
20. Krege JH, Lane NE, Harris JM, et al. PINP as a biological response marker during teriparatide treatment for osteoporosis. Osteoporos Int. 2014;25(9):2159–2171. doi:10.1007/s00198-014-2646-0
21. Xu F, Ye YP, Dong YH, et al. Inhibitory effects of high glucose/insulin environment on osteoclast formation and resorption in vitro. J Huazhong Univ Sci Technol Med Sci. 2013;33(2):244–249. doi:10.1007/s11596-013-1105-z
22. Levinger I, Seeman E, Jerums G, et al. Glucose-loading reduces bone remodeling in women and osteoblast function in vitro. Physiol Rep. 2016;4(3):e12700. doi:10.14814/phy2.12700
23. Tanaka KI. [ASBMR topics from clinical research(osteoporosis and sarcopenia).]. Clin Calcium. 2019;29(1):112–115. Japanese.
24. Smith-Palmer J, Brandle M, Trevisan R, et al. Assessment of the association between glycemic variability and diabetes-related complications in type 1 and type 2 diabetes. Diabetes Res Clin Pract. 2014;105(3):273–284. doi:10.1016/j.diabres.2014.06.007
25. Nalysnyk L, Hernandez-Medina M, Krishnarajah G. Glycaemic variability and complications in patients with diabetes mellitus: evidence from a systematic review of the literature. Diabetes Obes Metab. 2010;12(4):288–298. doi:10.1111/j.1463-1326.2009.01160.x
26. Gorst C, Kwok CS, Aslam S, et al. Long-term glycemic variability and risk of adverse outcomes: a systematic review and meta-analysis. Diabetes Care. 2015;38(12):2354–2369. doi:10.2337/dc15-1188
27. Tanko LB, Christiansen C, Cox DA, et al. Relationship between osteoporosis and cardiovascular disease in postmenopausal women. J Bone Miner Res. 2005;20(11):1912–1920. doi:10.1359/JBMR.050711
28. Compston JE, Laskey MA, Croucher PI, et al. Effect of diet-induced weight loss on total body bone mass. Clin Sci. 1992;82(4):429–432. doi:10.1042/cs0820429
29. Andersen RE, Wadden TA, Herzog RJ. Changes in bone mineral content in obese dieting women. Metabolism. 1997;46(8):857–861. doi:10.1016/S0026-0495(97)90070-6
30. Jensen LB, Kollerup G, Quaade F, et al. Bone minerals changes in obese women during a moderate weight loss with and without calcium supplementation. J Bone Miner Res. 2001;16(1):141–147. doi:10.1359/jbmr.2001.16.1.141
31. Anhe FF, Barra NG, Schertzer JD. Glucose alters the symbiotic relationships between gut microbiota and host physiology. Am J Physiol Endocrinol Metab. 2020;318(2):E111–E116. doi:10.1152/ajpendo.00485.2019
32. Cheng B, Wen Y, Yang X, et al. Gut microbiota is associated with bone mineral density: an observational and genome-wide environmental interaction analysis in the UK Biobank cohort. Bone Joint Res. 2021;10(11):734–741. doi:10.1302/2046-3758.1011.BJR-2021-0181.R1
33. Qin Q, Yan S, Yang Y, et al. The relationship between osteoporosis and intestinal microbes in the Henan Province of China. Front Cell Dev Biol. 2021;9:752990. doi:10.3389/fcell.2021.752990
34. Liu R, Chao A, Wang K, et al. Incidence and risk factors of medical complications and direct medical costs after osteoporotic fracture among patients in China. Arch Osteoporos. 2018;13(1):12. doi:10.1007/s11657-018-0429-5
35. Domazetovic V, Fontani F, Marcucci G, et al. Estrogen inhibits starvation-induced apoptosis in osteocytes by a redox-independent process involving association of JNK and glutathione S-transferase P1-1. FEBS Open Bio. 2017;7(5):705–718. doi:10.1002/2211-5463.12216
36. Guo L, Chen K, Yuan J, et al. Estrogen inhibits osteoclasts formation and bone resorption via microRNA-27a targeting PPARgamma and APC. J Cell Physiol. 2018;234(1):581–594. doi:10.1002/jcp.26788
37. Chen Q, Kaji H, Sugimoto T, et al. Testosterone inhibits osteoclast formation stimulated by parathyroid hormone through androgen receptor. FEBS Lett. 2001;491(1–2):91–93. doi:10.1016/S0014-5793(01)02160-3
38. Rianon NJ, Smith SM, Lee M, et al. Glycemic control and bone turnover in older Mexican Americans with type 2 diabetes. J Osteoporos. 2018;2018:7153021. doi:10.1155/2018/7153021
39. Kulkarni SV, Meenatchi S, Reeta R, et al. Association of glycemic status with bone turnover markers in type 2 diabetes mellitus. Int J Appl Basic Med Res. 2017;7(4):247–251. doi:10.4103/ijabmr.IJABMR_35_17
40. Colleluori G, Aguirre L, Dorin R, et al. Hypogonadal men with type 2 diabetes mellitus have smaller bone size and lower bone turnover. Bone. 2017;99:14–19. doi:10.1016/j.bone.2017.03.039
41. Thornton JD, Saunders R, Lian J, Karolicki B, Valentine W. The cost-effectiveness and budget impact of stepwise addition of bolus insulin in the treatment of type 2 diabetes: evaluation of the FullSTEP trial. J Med Econ. 2014;17(12):827–836. doi:10.3111/13696998.2014.959590
 © 2023 The Author(s). This work is published and licensed by Dove Medical Press Limited. The
full terms of this license are available at https://www.dovepress.com/terms
and incorporate the Creative Commons Attribution
- Non Commercial (unported, 3.0) License.
By accessing the work you hereby accept the Terms. Non-commercial uses of the work are permitted
without any further permission from Dove Medical Press Limited, provided the work is properly
attributed. For permission for commercial use of this work, please see paragraphs 4.2 and 5 of our Terms.
© 2023 The Author(s). This work is published and licensed by Dove Medical Press Limited. The
full terms of this license are available at https://www.dovepress.com/terms
and incorporate the Creative Commons Attribution
- Non Commercial (unported, 3.0) License.
By accessing the work you hereby accept the Terms. Non-commercial uses of the work are permitted
without any further permission from Dove Medical Press Limited, provided the work is properly
attributed. For permission for commercial use of this work, please see paragraphs 4.2 and 5 of our Terms.
Recommended articles
Association of Bone Turnover Markers with Type 2 Diabetes Mellitus and Microvascular Complications: A Matched Case-Control Study
Hou Y, Hou X, Nie Q, Xia Q, Hu R, Yang X, Song G, Ren L
Diabetes, Metabolic Syndrome and Obesity 2023, 16:1177-1192
Published Date: 26 April 2023
Association Between Intestinal Prevotella copri Abundance and Glycemic Fluctuation in Patients with Brittle Diabetes
Liu J, Zhou L, Sun L, Ye X, Ma M, Dou M, Shi L
Diabetes, Metabolic Syndrome and Obesity 2023, 16:1613-1621
Published Date: 3 June 2023
Effects of Glycemic Variability on Regulatory T Cells in Patients with Type 2 Diabetes and Kidney Disease
Gu QW, Sun Q, Wang J, Gu WS, Wang W, Mao XM
Diabetes, Metabolic Syndrome and Obesity 2023, 16:2365-2375
Published Date: 8 August 2023
Effect of Imeglimin, a Novel Anti-Diabetic Agent, on Insulin Secretion and Glycemic Variability in Type 2 Diabetes Treated with DPP-4 Inhibitor: A 16-Week, Open Label, Pilot Study
Itsukaichi A, Yoshikawa F, Fuchigami A, Iwata Y, Sato G, Miyagi M, Hirose T, Uchino H
Diabetes, Metabolic Syndrome and Obesity 2025, 18:101-111
Published Date: 9 January 2025
Factors Associated with Blood Glucose Fluctuations in Patients with Type 2 Diabetes: A Retrospective Observational Study Using Continuous Glucose Monitoring
Zhong N, Zhang A, Chen J, Hu Z, Nie R, Huang J, Wu M, Pan H
Diabetes, Metabolic Syndrome and Obesity 2025, 18:4049-4057
Published Date: 5 November 2025