Back to Journals » Diabetes, Metabolic Syndrome and Obesity » Volume 16
Effects of Glycemic Variability on Regulatory T Cells in Patients with Type 2 Diabetes and Kidney Disease
Authors Gu QW, Sun Q ![]() , Wang J, Gu WS
, Wang J, Gu WS ![]() , Wang W
, Wang W ![]() , Mao XM
, Mao XM
Received 21 March 2023
Accepted for publication 3 August 2023
Published 8 August 2023 Volume 2023:16 Pages 2365—2375
DOI https://doi.org/10.2147/DMSO.S413407
Checked for plagiarism Yes
Review by Single anonymous peer review
Peer reviewer comments 3
Editor who approved publication: Professor Gian Paolo Fadini
Qing-Wei Gu,* Qi Sun,* Jie Wang, Wen-Sha Gu, Wei Wang, Xiao-Ming Mao
Department of Endocrinology, Nanjing First Hospital, Nanjing Medical University, Nanjing, 210006, People’s Republic of China
*These authors contributed equally to this work
Correspondence: Xiao-Ming Mao, Department of Endocrinology, Nanjing First Hospital, Nanjing Medical University, 68 ChangLe Street, Nanjing, Jiangsu, 210006, People’s Republic of China, Tel +86-18951670295, Email [email protected]
Purpose: To investigate the pathogenesis of diabetic kidney disease (DKD) in type 2 diabetes mellitus (T2DM), we evaluated the effects of short-term glycemic variability (GV) on the profile of T cell subpopulations.
Methods: A total of 47 T2DM patients with normoalbuminuria, 47 microalbuminuria, and 49 macroalbuminuria were enrolled. The continuous glucose monitoring (CGM) determined the GV of enrolled patients. Flow cytometry was used to determine the proportion of T cell subpopulations.
Results: The frequency of T helper (Th) 17 and Th1 cells significantly increased while regulatory T cells (Tregs) significantly decreased in the macroalbuminuria group compared to normoalbuminuria and microalbuminuria groups (P < 0.01). The suppressive function of Tregs was significantly lower in the macroalbuminuria group than the normoalbuminuria group (P < 0.05). Compared with the normoalbuminuria group, the mean amplitude of glucose excursions (MAGE) of the macroalbuminuria group was significantly higher (P< 0.05). Furthermore, there were negative associations between the proportion of Tregs and MAGE.
Conclusions: Increased GV could decrease the proportion of Tregs and may impair their function. This may lead to increases in Th1 and Th17 cells, and some inflammatory cytokines, which might contribute to the development and progression of DKD in T2DM.
Keywords: type 2 diabetes mellitus, diabetic kidney disease, glycemic variability, regulatory T cells, inflammatory cytokines
Introduction
Diabetic kidney disease (DKD) is a common and serious complication of diabetes mellitus that entails increased morbidity and mortality for diabetic patients.1 DKD affects approximately 25% of patients with type 2 diabetes mellitus (T2DM) and is the main cause of end-stage kidney disease (ESKD) in affluent countries.2 The pathogenesis of DKD remains elusive and complex, leading to suboptimal therapeutic outcomes. Standard therapy, involving tight blood sugar and blood pressure control, has proven insufficient to halt the progression of DKD to ESKD3 and reduce DKD-related mortality.4 Enhancing understanding and elucidating the pathogenic mechanisms of DKD is crucial for devising new strategies to treat DKD.
Increased glycemic variability (GV) has recently been considered as a risk factor for DKD in T2DM.5,6 However, the mechanism of increased GV in DKD development is not fully understood. Recent studies have demonstrated that inflammation is considered the major contributor to the pathology of the onset and progression of DKD, and anti-inflammation may be a potential strategy for preventing or alleviating DKD in diabetes.7,8 Regulatory T cells (Tregs) are a powerful immunosuppressive population in inflammatory disorders; they can antagonize proinflammatory cell populations, especially T helper (Th)1 and Th17 cells.9 Tregs are a diverse population of lymphocytes that act as key regulators of peripheral tolerance homeostasis in higher vertebrates.10 CD4+CD25+FOXP3+ T cells have thus far been known to be natural Tregs; FOXP3 and CD25 (interleukin [IL]-2Rα) are not merely markers of Tregs, but Tregs survival and function are also critically dependent on them. Tregs mediate suppressive functions by producing cytokines, including transforming growth factor (TGF)-β, IL-10, and IL-35. They also use direct cell-cell contacts to inhibit the proliferation and activation of T effector cells (Teff).11,12
Foxp3 deficiency in scurfy mice triggers T cell activation as early as the neonatal stage, which swiftly escalates to widespread immune cell activation and inflammatory cytokine production.13 Conversely, adoptive transfer of CD4+ Foxp3+ Tregs to the db/db mouse model could limit the proinflammatory milieu, and improve insulin sensitivity and diabetic nephropathy.14 In T2DM patients, urine albumin/creatinine ratio (UACR) correlated positively with the percentages of Th1 and Th17 cells, as well as the Th17/Treg cell ratio, and negatively with the percentages of Treg cells.15,16
To elucidate whether short-term GV can affect subsets of T cells and their roles in DKD in patients with T2DM, we evaluated some indexes of the short-term GV and T cell subpopulations and analyzed the relationship between short-term GV and T cell subsets in T2DM patients with DKD.
Patients and Methods
Patients
A total of 143 patients with T2DM were recruited from the Nanjing First Hospital between April 2019 to March 2022. T2DM was diagnosed according to the WHO diagnostic criteria (1999).17 Patients with other renal and autoimmune diseases, cardiovascular diseases, chronic infectious diseases, or inflammatory diseases were excluded. No patient was receiving anti-inflammatory drugs and/or immunosuppressive agents known to interfere with the immune system prior to examination. The protocol and informed consent document were approved by the ethics committee of Nanjing First Hospital and all participants gave written informed consent.
Study Design
All the enrolled patients were admitted to our hospital. Urinary albumin and creatinine concentrations were measured in spot urine samples and used to calculate the UACR. Normoalbuminuria was defined as a UACR <30 mg/g, microalbuminuria as a UACR of 30–300 mg/g, and macroalbuminuria as a UACR ≥300 mg/g. The estimated glomerular filtration rate (eGFR) was calculated using the CDK-EPI formula.18 Patients with T2DM were divided into three groups according to the UACR as follows: normoalbuminuria group, microalbuminuria group, and macroalbuminuria group.
Before modifying the original glucose-lowering treatment plan, all patients received iPro2 continuous glucose monitoring (CGM) (Medtronic, Dublin, Ireland) for 72 hours. We extracted the system measurement data and uploaded them to a computer using the Dynamic Glucose Test Report Management System 2.0 for data analysis. Before breakfast was served on the participant’s first day in the hospital, one of the researchers attached a sensor to the participant’s triceps. The sensors were affixed with adhesive tape, and the researcher removed them after every monitoring period. Included among the GV parameters were the mean amplitude of glycemic excursions (MAGE), mean blood glucose (MBG), time above range (TAR, blood glucose level: >10.1 mmol/L), and time in range (TIR, blood glucose level: 3.9–10 mmol/L).
Laboratory Analyses
After overnight fasting, participants’ blood samples were collected. Glycated hemoglobin A1c (HbA1c) was measured by high-pressure liquid chromatography (D-10TM; Bio-Rad Laboratories, CA, USA), and lipid profiles were evaluated by an enzymatic colorimetric assay using an automatic biochemistry analyzer (HITACHI-7600; Hitachi, Tokyo, Japan). Urine albumin was quantified using the turbidimetric method (albumin; Roche, Basel, Switzerland), and urine creatinine was assessed using the colorimetric method (CREA; Roche). Both measurements were performed using an automated analyzer (HITACHI-7600; Hitachi).
Flow Cytometry Analysis
Peripheral blood mononuclear cells (PBMCs) were isolated from heparinized blood by Ficoll-Hypaque density gradient separation. The immuno-phenotype of the PBMCs was determined using the FACSC antoTM II flow cytometer (BD Biosciences, Franklin Lakes, NJ, USA) with FACSDivaTM software version 6.1.1 (BD Biosciences) for data evaluation. PBMCs were washed and stained, and then four-color flow cytometry analyses were performed. Th1 cells were stained with anti-CD4-PerCP-Cy5-5 and anti-interferon (IFN)-γ-FITC antibodies, Th17 cells with anti-CD4-PerCP-Cy5-5 and anti-human IL-17A-PE antibodies, Th2 cells with anti-CD4-PerCP-Cy5-5 and anti-IL-4-PE antibodies. All antibodies used in the flow cytometry analysis were purchased from BD Biosciences.
Quantitative Real-Time PCR
The RNA extracted from Tregs and PBMCs using TRIzol reagent (Life Technologies, Carlsbad, CA, USA) was quantified and assessed for purity by measuring the absorbance at 260/280 nm using a spectrophotometer; an A260/A280 ratio of 1.8 to 2.0 was considered acceptable. Reverse transcription was performed using PrimeScriptTM RT reagent kit (Takara Bio Inc., Shiga, Japan) according to the manufacturer’s instructions for two-step RT-PCR (Applied Biosystems, CA, USA): (1) synthesis of complementary cDNA, followed by (2) PCR amplification. PCR reaction mixture consisted of SYBR® Premix Ex Taq (2×) (Takara Bio Inc., Shiga, Japan), 10 μL; cDNA 2μL; both upstream and downstream primers, 0.8μL; ROX Reference Dye II (50×) (Takara Bio Inc., Shiga, Japan), 0.4 μL, and ddH2O, 6μL. The PCR program included an initial denaturation step at 95°C for 30 seconds, followed by 40 cycles of denaturation at 95°C for 5 seconds, and annealing/extension at 60°C for 34 seconds. The expression levels of FOXP3, TGF-β, and IL-10 in Tregs and IL-6, IL-17, and IFN-γ in PBMCs were normalized to β-actin using the 2−∆∆CT method. All experiments were repeated independently more than 3 times. The primers used are listed in Table 1.
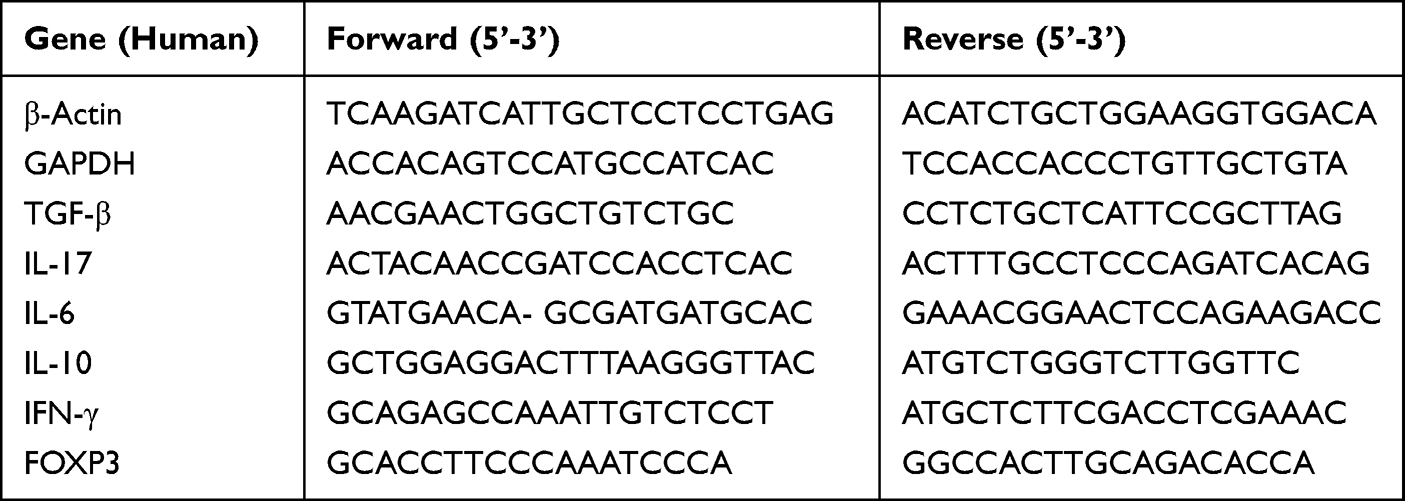 |
Table 1 Primer Sequences for RT-PCR in Human |
Functional Analysis of Tregs
Treg function is reflected by the inhibition rate of Teff proliferation. Previous research indicated that Tregs cultured with a fixed amount of Teff at a 1:8 ratio exhibited significant suppression.19 Three control groups and three experimental groups were established to evaluate how Tregs inhibit Teff proliferation at different stages of DKD. Three control groups consisted solely of CD4+CD25- T cells in an RPMI-1640 complete medium at a concentration of 5×10⁶ cells/mL, with anti-human CD3 and anti-human CD28 antibodies serving as the controls. In the three experimental groups, Teff and Tregs were cocultured at a ratio of 8:1. After 72 hours, cell proliferation was determined using the Cell Trace carboxyfluorescein succinimidyl ester staining assay (BD Biosciences) for 30 minutes at 37°C, followed by flow cytometry analysis after the cells were stained with APC-anti-CD25 for another 30 minutes at 4°C. The inhibition rate of Teff proliferation (%) was recognized as a function of Tregs and was calculated using the following formula:  .
.
Statistical Analyses
Data were analyzed using statistical software (SPSS 22.0; LEAD Technologies, Inc., Chicago, IL, USA, and GraphPad Prism 6.1; CA, USA). All variables were tested for normality or homogeneity of variance, continuous variables of normal distribution were expressed as mean ± standard deviation (mean ± SD), and variables of non-normal distribution were expressed as median (interquartile range). When the data were normally distributed, independent samples t-test was used for comparison between two groups, and one-way ANOVA was used for comparison among multiple groups; when the data were not normally distributed, nonparametric tests were performed. The relationship between variables was analyzed by Pearson (normally distributed variables) or Spearman (non-normally distributed or ordinal variables) correlation. Multiple stepwise linear regression analysis evaluated the effect of GV on T cell subpopulations. The independent variables were gender, age, body mass index (BMI), systolic blood pressure (SBP), total cholesterol (TC), low-density lipoprotein-cholesterol (LDL-C), serum uric acid (sUA), the duration of diabetes mellitus (DM), TIR, MAGE, HbA1c, and UACR. In the end, the Tregs model retained the variables UACR, sUA, and MAGE. A p value <0.05 was considered to be statistically significant.
Results
Baseline Characteristics
The study population consisted of 47 T2DM patients with normoalbuminuria, 47 with microalbuminuria, and 49 with macroalbuminuria (Table 2). There were no significant differences in age, gender, BMI, diastolic blood pressure (DBP), total triglyceride (TG), high-density lipoprotein-cholesterol (HDL-C), or LDL-C among the three groups (P > 0.05 for all). However, the duration of DM and UACR were significantly higher in the microalbuminuria group than in the normoalbuminuria group, and the duration of DM, SBP, HbA1c, fasting plasma glucose (FPG), TC, sUA, creatinine (Cr), and UACR were all higher in the macroalbuminuria group than in the normoalbuminuria group (P < 0.05 for all). The duration of DM, SBP, TC, Cr, and UACR values were higher, but the eGFR was lower in the macroalbuminuria group than in the microalbuminuria group (P < 0.05 for all)(Table 2).
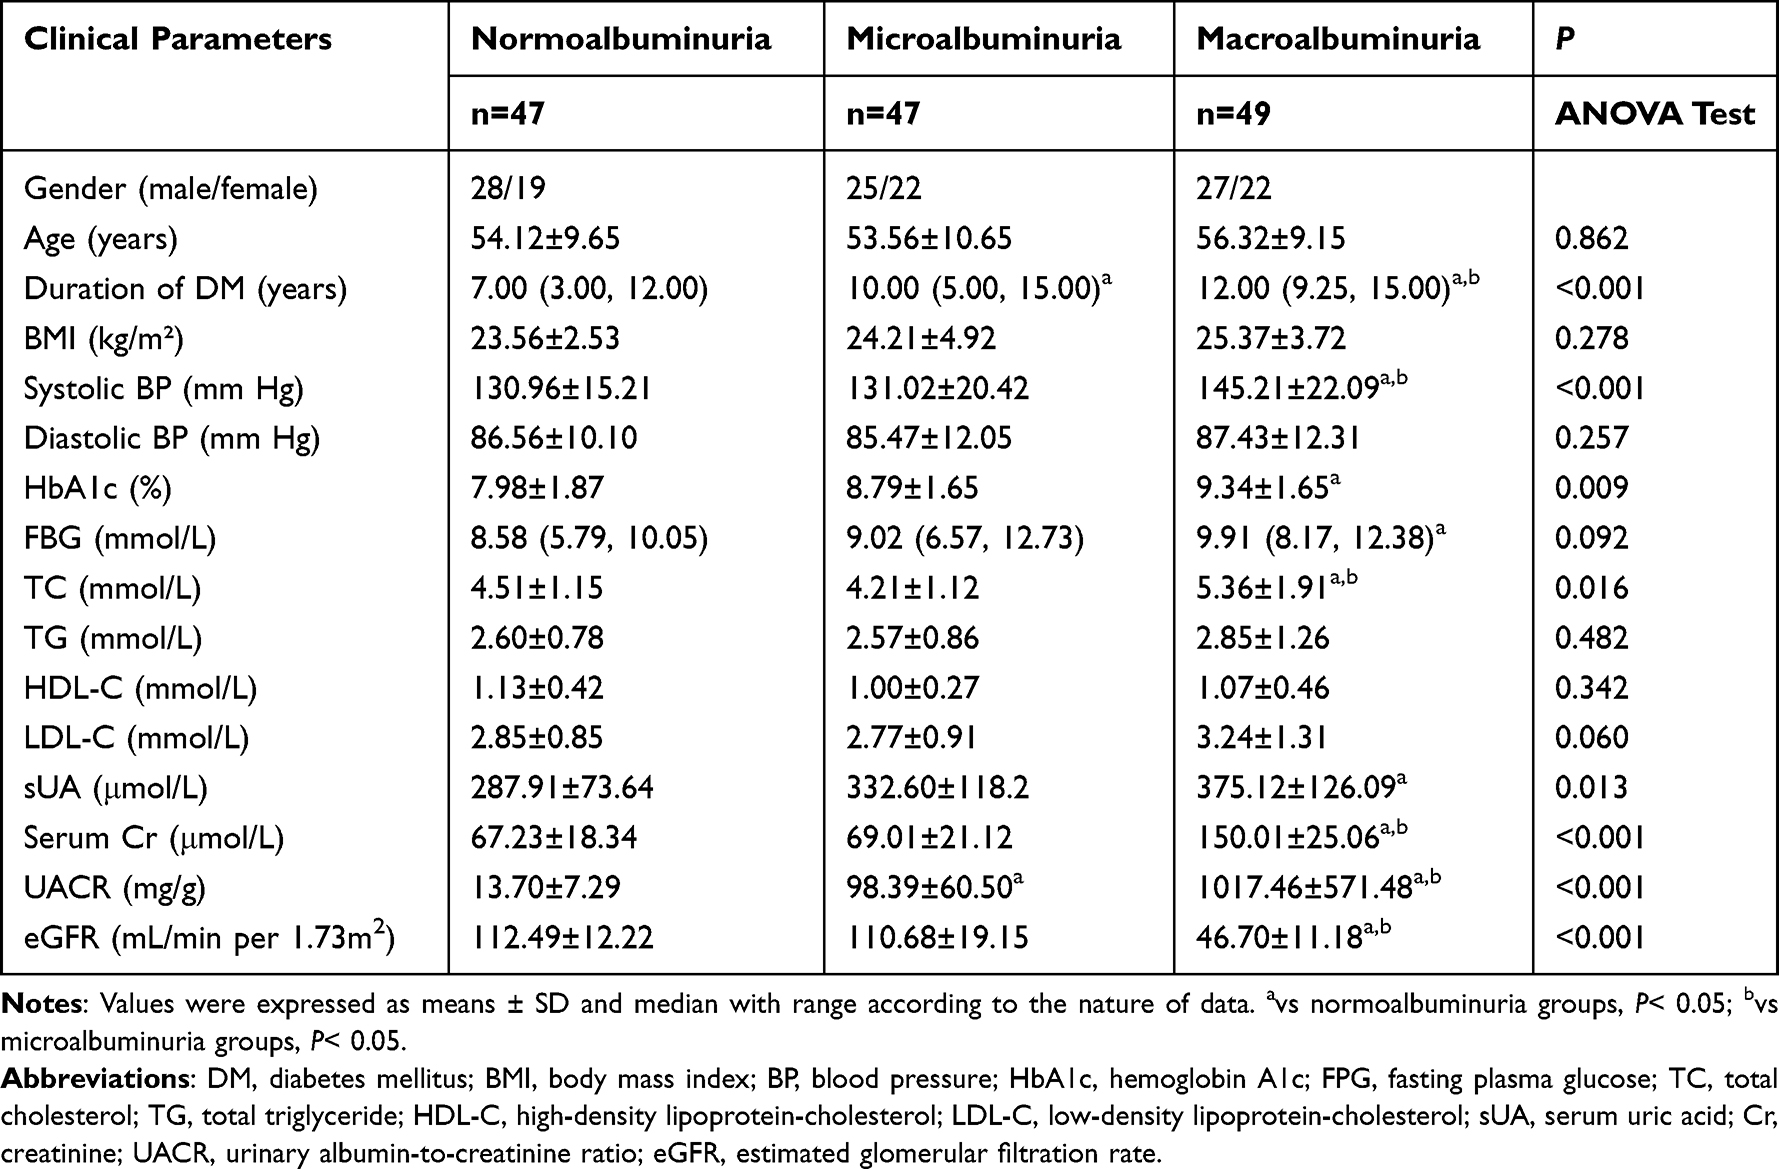 |
Table 2 Baseline Patient Characteristics |
Frequency and Function of Tregs in Patients with DKD
To evaluate the frequency and function of Tregs at different stages of DKD, we used flow cytometry to detect the frequency and suppressive function of Tregs in the three groups. Stable expressions of FOXP3, IL-10, and TGF-β are vital for Tregs to play immunomodulatory roles; therefore, we also compared their mRNA expressions in all groups.
The frequency of Tregs was significantly lower in the macroalbuminuria group than in the normoalbuminuria and microalbuminuria groups (P < 0.01 for all). The frequency of Tregs was significantly lower in the microalbuminuria group than in the normoalbuminuria group (P < 0.05) (Figure 1A). FOXP3, IL-10, and TGF-β mRNA expressions in Tregs significantly decreased in the macroalbuminuria and microalbuminuria groups compared with the normoalbuminuria group (P < 0.05 and 0.01, respectively), but only IL-10 mRNA expression significantly decreased in the macroalbuminuria group compared with the microalbuminuria group (P < 0.05) (Figure 1B–D).
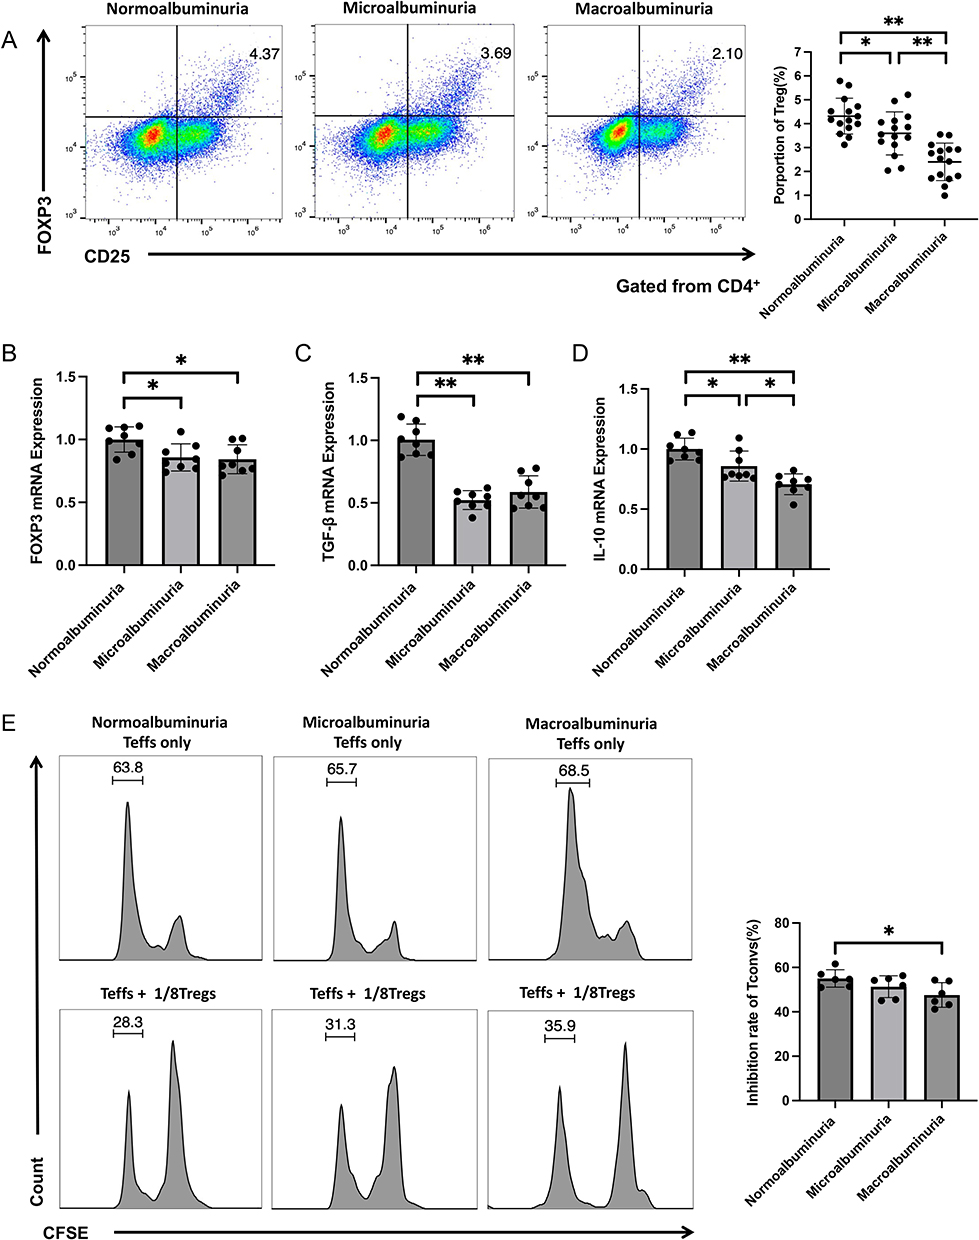 |
Figure 1 Representative FACS dot-plots used for the quantification of Tregs, FACS for the quantification of the suppressive function of Tregs, and qPCR for the quantification of FOXP3, IL-10, and TGF-β mRNA expressions. PBMCs were stained with anti-CD4-FITC, anti-CD25-PE, and anti-FOXP3-APC antibodies. (A) Tregs were defined as CD4+CD25+ FOXP3+ cells in the three groups; the average fractions of Tregs are shown in the right panels (n = 15 in each group). FOXP3 (B), TGF-β (C), and IL-10 (D) mRNA expressions in Tregs of the three groups (n = 8 in each group). (E) Representative suppressive functions of Tregs in the three groups are presented (n = 6 in each group). The CD4+CD25+ cells (Tregs) and CD4+CD25- cells were isolated and cocultured at a ratio of 8:1 for 72h. The proliferation of Teff was detected by FACS. *p< 0.05; **p < 0.01. |
CD4+CD25+ Tregs and Teff were isolated from patients’ peripheral blood, and a standard in vitro suppression assay was performed. The results showed that the suppressive function of Tregs significantly decreased in the macroalbuminuria group compared with the normoalbuminuria group (P < 0.05); however, there was no significant difference between the normoalbuminuria and microalbuminuria groups and between the microalbuminuria and macroalbuminuria groups (P > 0.05) (Figure 1E).
Distribution of T Cell Subpopulations in Patients with DKD
The proportion of T cell subpopulations in the peripheral blood was evaluated by flow cytometry. The frequency of Th17 and Th1 cells significantly increased in the macroalbuminuria group compared with the normoalbuminuria and microalbuminuria groups (P < 0.01 for all). The frequency of Th17 cells significantly increased in the microalbuminuria group compared to the normoalbuminuria group (P < 0.01), but there was no significant difference in Th1 cells between the two groups (P > 0.05) (Figure 2A and B). There were no significant differences in the frequency of Th2 cells among the three groups (P > 0.05 for all) (Figure 2C).
 |
Figure 2 Representative FACS dot-plots were used for the quantification of T cell subpopulations and qPCR for the quantification of inflammatory factor mRNA expressions. PBMCs were stained with anti-CD4-PerCP-Cy5-5, anti-IFN-γ-FITC, IL-17A-PE, and anti-IL-4-PE antibodies (n = 15 in each group). (A) Th17 cells were defined as CD4+IL-17A+ cells in the three groups; the average fractions of Th17 cells are shown in the right panels. (B) Th1 cells were defined as CD4+IFN-γ+ cells in the three groups, the average fractions of Th1 cells are shown in the right panels. (C) Th2 cells were defined as CD4+IL4+ cells in the three groups, the average fractions of Th2 cells are shown in the right panels. The IL-6 (D), IL-17 (E), and IFN-γ (F) mRNA expressions in PBMCs of the three groups are shown (n = 8 in each group). *p< 0.05; **p < 0.01. |
Moreover, the inflammatory factors in PBMCs of the patients, such as IL-6, IL-17, and IFN-γ mRNA expressions, all significantly increased in the macroalbuminuria group compared with the normoalbuminuria and microalbuminuria groups (P < 0.01 for all). There was no significant difference in IL-6 mRNA expression between the normoalbuminuria and microalbuminuria groups (P >0.05), but IL-17 and IFN-γ mRNA expressions significantly increased in the microalbuminuria group compared with the normoalbuminuria group (P <0.05 and 0.01, respectively) (Figure 2D–F).
GV in Patients with DKD
The glycemic results obtained from the CGM reports of the patients are presented in Table 3. The MBG and TAR significantly increased and the TIR significantly decreased in the microalbuminuria and macroalbuminuria groups compared with the normoalbuminuria group (P < 0.001 for all). The MBG significantly increased in the macroalbuminuria group compared with the microalbuminuria group (P < 0.05). MAGE levels were higher in the macroalbuminuria group than in the normoalbuminuria group (P < 0.05). There were no significant differences in CV and TBR (blood glucose level: < 3.9 mmol/L) among the three groups.
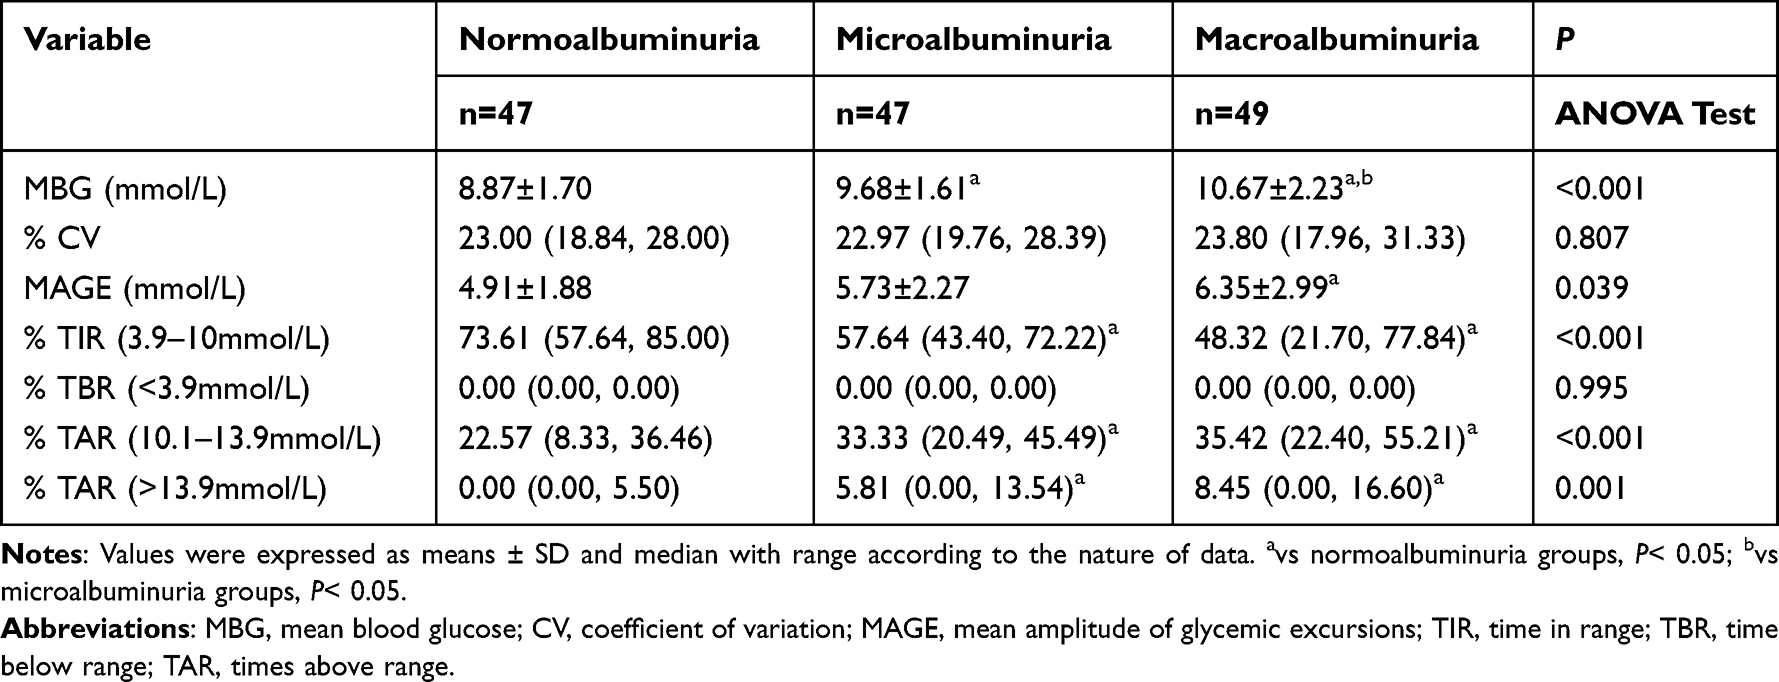 |
Table 3 Glycemic Parameters Obtained from CGM |
The Correlation of T Cell Subpopulations with GV
To evaluate the effect of short-term GV on T cell subpopulations, we analyzed the relationship between some indices of short-term GV and the frequency of T cell subpopulations in three groups of patients. The results confirmed that MAGE was negatively correlated with the frequency of Tregs (Figure 3A) and positively correlated with the frequency of Th1 and Th17 cells in the three groups (Figure 3B and C). In contrast, the TIR was positively correlated with the frequency of Tregs (Figure 3E) and negatively correlated with the frequency of Th1 and Th17 cells (Figure 3F and G). There was no significant correlation between the MAGE or TIR and the frequency of Th2 cells (Figure 3D and H).
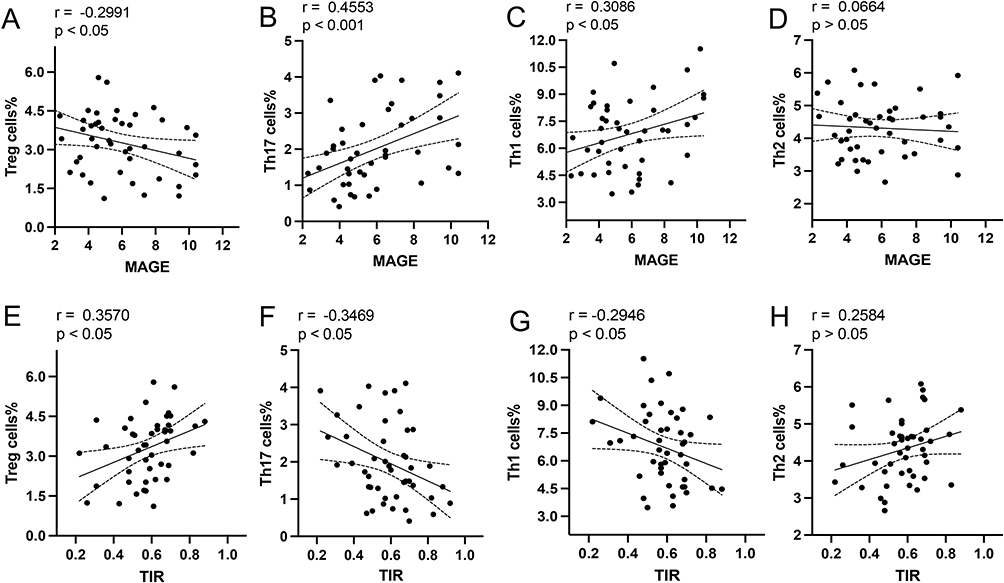 |
Figure 3 Linear correlation between the frequency of T cell subpopulations and some indexes of short-term GV. The relationships between the MAGE and frequency of Tregs (A), Th17 (B), Th1 (C), and Th2 (D) are shown. The relationships between the TIR and frequency of Tregs (E), Th17 (F), Th1 (G), and Th2 (H) are presented. |
Regression Analysis of Associations Between T Cell Subpopulations and GV
Multiple stepwise linear regression analysis evaluated the effect of GV on T cell subpopulations. The independent variables were gender, age, BMI, SBP, TC, LDL-C, sUA, the duration of DM, TIR, MAGE, HbA1c, and UACR. The dependent variable was the proportion of T cell subpopulations. The analysis showed a significant negative correlation between the proportion of Tregs and MAGE (β = −0.204; P < 0.05) (Table 4).
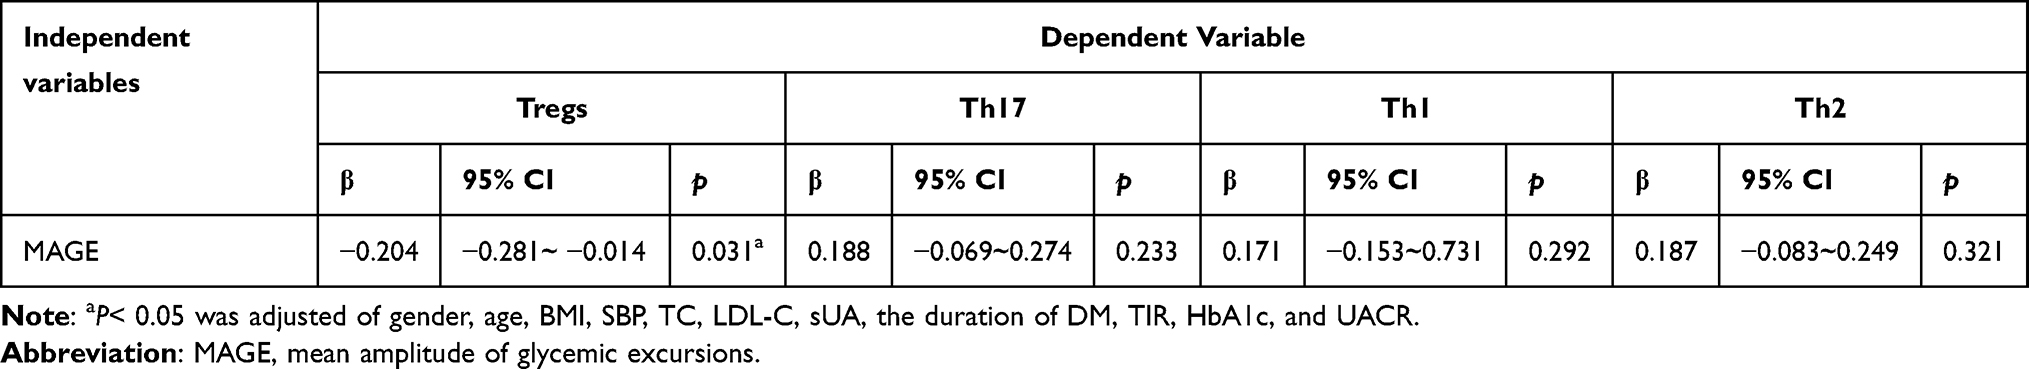 |
Table 4 Multivariate Linear Regression Model of GV Parameters Related to the Proportion of T Cell Subpopulations |
Discussion
Herein, we found that the frequency, suppressive function, and FOXP3, IL-10, and TGF-β mRNA expressions of Tregs were decreased in T2DM patients with DKD, especially in T2DM patients with massive albuminuria. Moreover, we verified for the first time that the frequency of Tregs was negatively correlated with the MAGE. Currently, MAGE is a reliable indicator of short-term GV level,20 which has been acknowledged by most researchers. These results suggest that abnormal T cell subpopulations might be, at least in part, due to increased GV in T2DM and DKD.
We acknowledge that high blood glucose is the main cause of abnormal T cell subpopulations in T2DM and T2DM patients with DKD. In our previous studies, we have demonstrated that abnormal T cell subpopulations are associated with HbA1c in T2DM.21 GV may further aggravate abnormal T cell subpopulations in T2DM patients with DKD.
Clinical studies have demonstrated that GV contributes to DKD in T2DM patients. GV has two forms: long-term GV, measured by HbA1c and fasting and postprandial blood glucose levels, and short-term GV, based on the daily and day-to-day fluctuations in blood glucose.21 Both increased long-term22–25 and short-term GV5,6 are pathogenic factors in the development of DKD in T2DM, although there is some inconsistency about short-term GV in association with DKD.26 Some studies have found that hyperglycemia can also impair the function of Tregs.27 However, this study did not find a significant difference in the percentage of TAR (>13.9mmol/L) between the macroalbuminuria and microalbuminuria groups, which excludes the effect of hyperglycemia on the function of Tregs. Therefore, we speculate that increased short-term GV could impair Tregs function and increase the inflammatory response, due to the changes of immune cells and inflammatory response usually taking place within days. If short-term GV elevation is ignored in patients with T2DM, it may result in failure to achieve long-term GV targets over time. Because complications of T2DM usually emerge several years after the disease onset, if the inflammatory response is persistent, DKD may develop.
DKD has traditionally been regarded as a non-inflammatory disease, especially in T2DM patients. However, Recent evidence has shown that renal inflammation is important in initiating the development and progression of DKD.28 In T2DM, interstitial infiltration of CD4+ T cells correlates with the degree of proteinuria.29 IL-17A, a cytokine from the IL17 family, originates from activated Th17 cells. Excess IL-17A causes renal damage, such as mesangial matrix expansion and glomerular basement membrane thickening, which IL-17A neutralizing antibodies can reduce.30 Serum IL-6 level correlates with albuminuria severity31 and morphological changes in DKD, such as thickening of the glomerular basement membrane.32
DKD is considered a complex disease with a central role of chronic inflammation, progressive tubular damage, and fibrosis of the tubulointerstitium.7 On the other hand, protective tubular proteins, including EGF, Klotho, uromodulin, and BMP-7, have been associated with a slower decline in eGFR in diabetes patients.7 However, whether these protective and inflammatory factors are affected by GV, and anti-inflammatory treatment has beneficial effects in human DKD need further to be studied.
Tregs modulate the immune system by inducing IL-10 and TGF-β, besides direct cell–cell contact to inhibit Teff proliferation and activation. IL-10 can impair Teff proliferation, migration, and cytokine production.33,34 TGF-β can induce and maintain FOXP3 expression in nTregs and induce iTregs from naïve CD4+ T cells.35,36 Furthermore, IL-10 and TGF-β can suppress CD4+ T-cell proliferation and do not promote fibrosis in inflamed kidneys.37,38
In conclusion, the proportion of Tregs is negatively associated with MAGE, which may compromise the function of Tregs and lead to an increase in the proportion of Th1 and Th17 cells, as well as the levels of inflammatory cytokines. Increased GV impairs the function of Tregs and aggravates the inflammatory response, which might be one of the mechanisms in the development and progression of DKD. Although short-term GV may reflect long-term blood glucose levels, the effects of long-term GV on immune system imbalance and its role in the development and progression of DKD should be further evaluated.
Data Sharing Statement
The datasets generated during and/or analyzed during the current study are available from the corresponding author on reasonable request.
Ethics Statement
All procedures performed in studies involving human participants were in accordance with the ethical standards of the institutional and/or national research committee and with the 1964 Helsinki declaration and its later amendments or comparable ethical standards. Informed consent was obtained from all individual participants included in the study.
Acknowledgments
We thank the participants for their involvement in the study.
Funding
This work was supported by the National Natural Science Foundation of China (81570710).
Disclosure
The authors declare no conflicts of interest that could be perceived as prejudicing the impartiality of this study.
References
1. Valencia WM, Florez H. How to prevent the microvascular complications of type 2 diabetes beyond glucose control. BMJ. 2017;356:i6505. doi:10.1136/bmj.i6505
2. Wang G, Ouyang J, Li S, et al. The analysis of risk factors for diabetic nephropathy progression and the construction of a prognostic database for chronic kidney diseases. J Transl Med. 2019;17(1):264. doi:10.1186/s12967-019-2016-y
3. Arora MK, Singh UK. Molecular mechanisms in the pathogenesis of diabetic nephropathy: an update. Vascul Pharmacol. 2013;58(4):259–271. doi:10.1016/j.vph.2013.01.001
4. Kopel J, Pena-Hernandez C, Nugent K. Evolving spectrum of diabetic nephropathy. World J Diabetes. 2019;10(5):269–279. doi:10.4239/wjd.v10.i5.269
5. Yoo JH, Choi MS, Ahn J, et al. Association between continuous glucose monitoring-derived time in range, other core metrics, and albuminuria in type 2 diabetes. Diabetes Technol Ther. 2020;22(10):768–776. doi:10.1089/dia.2019.0499
6. Wakasugi S, Mita T, Katakami N, et al. Associations between continuous glucose monitoring-derived metrics and diabetic retinopathy and albuminuria in patients with type 2 diabetes. BMJ Open Diabetes Res Care. 2021;9(1):e001923. doi:10.1136/bmjdrc-2020-001923
7. Nowak N. Protective factors as biomarkers and targets for prevention and treatment of diabetic nephropathy: from current human evidence to future possibilities. J Diabetes Investig. 2020;11(5):1085–1096. doi:10.1111/jdi.13257
8. Perez-Morales RE, Del Pino MD, Valdivielso JM, Ortiz A, Mora-Fernandez C, Navarro-Gonzalez JF. Inflammation in diabetic kidney disease. Nephron. 2019;143(1):12–16. doi:10.1159/000493278
9. Siegmund K, Feuerer M, Siewert C, et al. Migration matters: regulatory T-cell compartmentalization determines suppressive activity in vivo. Blood. 2005;106(9):3097–3104. doi:10.1182/blood-2005-05-1864
10. Josefowicz SZ, Lu LF, Rudensky AY. Regulatory T cells: mechanisms of differentiation and function. Annu Rev Immunol. 2012;30(1):531–564. doi:10.1146/annurev.immunol.25.022106.141623
11. Buckner JH. Mechanisms of impaired regulation by CD4(+)CD25(+)FOXP3(+) regulatory T cells in human autoimmune diseases. Nat Rev Immunol. 2010;10(12):849–859. doi:10.1038/nri2889
12. Collison LW, Workman CJ, Kuo TT, et al. The inhibitory cytokine IL-35 contributes to regulatory T-cell function. Nature. 2007;450(7169):566–569. doi:10.1038/nature06306
13. Sharma R, Jarjour WN, Zheng L, Gaskin F, Fu SM, Ju ST. Large functional repertoire of regulatory T-cell suppressible autoimmune T cells in scurfy mice. J Autoimmun. 2007;29(1):10–19. doi:10.1016/j.jaut.2007.04.001
14. Eller K, Kirsch A, Wolf AM, et al. Potential role of regulatory T cells in reversing obesity-linked insulin resistance and diabetic nephropathy. Diabetes. 2011;60(11):2954–2962. doi:10.2337/db11-0358
15. Zhang C, Xiao C, Wang P, et al. The alteration of Th1/Th2/Th17/Treg paradigm in patients with type 2 diabetes mellitus: relationship with diabetic nephropathy. Hum Immunol. 2014;75(4):289–296. doi:10.1016/j.humimm.2014.02.007
16. Abouzeid S, Sherif N. Role of alteration in Treg/Th17 cells’ balance in nephropathic patients with type 2 diabetes mellitus. Electron Physician. 2015;7(8):1613–1618. doi:10.19082/1613
17. Metcalf PA, Scragg RK. Comparison of WHO and ADA criteria for diagnosis of glucose status in adults. Diabetes Res Clin Pract. 2000;49(2–3):169–180. doi:10.1016/s0168-8227(00)00147-9
18. Levey AS, Stevens LA, Schmid CH, et al. A new equation to estimate glomerular filtration rate. Ann Intern Med. 2009;150(9):604–612. doi:10.7326/0003-4819-150-9-200905050-00006
19. Hu Y, Li N, Jiang P, et al. Elevated thyroglobulin level is associated with dysfunction of regulatory T cells in patients with thyroid nodules. Endocr Connect. 2019;8(4):309–317. doi:10.1530/EC-18-0545
20. Monnier L, Colette C, Owens DR. Integrating glycaemic variability in the glycaemic disorders of type 2 diabetes: a move towards a unified glucose tetrad concept. Diabetes Metab Res Rev. 2009;25(5):393–402. doi:10.1002/dmrr.962
21. Cheng L, Yang F, Cao X, et al. The effect of short-term intensive insulin therapy on circulating T cell subpopulations in patients with newly diagnosed type 2 diabetes mellitus. Diabetes Res Clin Pract. 2019;149:107–114. doi:10.1016/j.diabres.2019.02.007
22. Ceriello A, Monnier L, Owens D. Glycaemic variability in diabetes: clinical and therapeutic implications. Lancet Diabetes Endocrinol. 2019;7(3):221–230. doi:10.1016/S2213-8587(18)30136-0
23. Hsu CC, Chang HY, Huang MC, et al. HbA1c variability is associated with microalbuminuria development in type 2 diabetes: a 7-year prospective cohort study. Diabetologia. 2012;55(12):3163–3172. doi:10.1007/s00125-012-2700-4
24. Zhou JJ, Coleman R, Holman RR, Reaven P. Long-term glucose variability and risk of nephropathy complication in UKPDS, ACCORD and VADT trials. Diabetologia. 2020;63(11):2482–2485. doi:10.1007/s00125-020-05273-7
25. Ceriello A, De Cosmo S, Rossi MC, et al. Variability in HbA1c, blood pressure, lipid parameters and serum uric acid, and risk of development of chronic kidney disease in type 2 diabetes. Diabetes Obes Metab. 2017;19(11):1570–1578. doi:10.1111/dom.12976
26. Sonoda S, Okada Y, Mori H, et al. Association between diabetic microangiopathies and glycemic variability assessed by continuous glucose monitoring. J UOEH. 2018;40(1):11–18. doi:10.7888/juoeh.40.11
27. Watson MJ, Vignali PDA, Mullett SJ, et al. Metabolic support of tumour-infiltrating regulatory T cells by lactic acid. Nature. 2021;591(7851):645–651. doi:10.1038/s41586-020-03045-2
28. Khanijou V, Zafari N, Coughlan MT, MacIsaac RJ, Ekinci EI. Review of potential biomarkers of inflammation and kidney injury in diabetic kidney disease. Diabetes Metab Res Rev. 2022;38(6):e3556. doi:10.1002/dmrr.3556
29. Moon JY, Jeong KH, Lee TW, Ihm CG, Lim SJ, Lee SH. Aberrant recruitment and activation of T cells in diabetic nephropathy. Am J Nephrol. 2012;35(2):164–174. doi:10.1159/000334928
30. Lavoz C, Matus YS, Orejudo M, et al. Interleukin-17A blockade reduces albuminuria and kidney injury in an accelerated model of diabetic nephropathy. Kidney Int. 2019;95(6):1418–1432. doi:10.1016/j.kint.2018.12.031
31. Saraheimo M, Teppo AM, Forsblom C, Fagerudd J, Groop PH. Diabetic nephropathy is associated with low-grade inflammation in Type 1 diabetic patients. Diabetologia. 2003;46(10):1402–1407. doi:10.1007/s00125-003-1194-5
32. Dalla Vestra M, Mussap M, Gallina P, et al. Acute-phase markers of inflammation and glomerular structure in patients with type 2 diabetes. J Am Soc Nephrol. 2005;16(Suppl 1):S78–S82. doi:10.1681/asn.2004110961
33. Navarro-Gonzalez JF, Mora-Fernandez C, Muros de Fuentes M, Garcia-Perez J. Inflammatory molecules and pathways in the pathogenesis of diabetic nephropathy. Nat Rev Nephrol. 2011;7(6):327–340. doi:10.1038/nrneph.2011.51
34. Annacker O, Pimenta-Araujo R, Burlen-Defranoux O, Barbosa TC, Cumano A, Bandeira A. CD25+ CD4+ T cells regulate the expansion of peripheral CD4 T cells through the production of IL-10. J Immunol. 2001;166(5):3008–3018. doi:10.4049/jimmunol.166.5.3008
35. Collison LW, Pillai MR, Chaturvedi V, Vignali DA. Regulatory T cell suppression is potentiated by target T cells in a cell contact, IL-35- and IL-10-dependent manner. J Immunol. 2009;182(10):6121–6128. doi:10.4049/jimmunol.0803646
36. Marie JC, Letterio JJ, Gavin M, Rudensky AY. TGF-beta1 maintains suppressor function and Foxp3 expression in CD4+CD25+ regulatory T cells. J Exp Med. 2005;201(7):1061–1067. doi:10.1084/jem.20042276
37. Tran DQ. TGF-beta: the sword, the wand, and the shield of FOXP3(+) regulatory T cells. J Mol Cell Biol. 2012;4(1):29–37. doi:10.1093/jmcb/mjr033
38. Cao Q, Wang Y, Zheng D, et al. IL-10/TGF-beta-modified macrophages induce regulatory T cells and protect against Adriamycin nephrosis. J Am Soc Nephrol. 2010;21(6):933–942. doi:10.1681/ASN.2009060592
 © 2023 The Author(s). This work is published and licensed by Dove Medical Press Limited. The
full terms of this license are available at https://www.dovepress.com/terms
and incorporate the Creative Commons Attribution
- Non Commercial (unported, 3.0) License.
By accessing the work you hereby accept the Terms. Non-commercial uses of the work are permitted
without any further permission from Dove Medical Press Limited, provided the work is properly
attributed. For permission for commercial use of this work, please see paragraphs 4.2 and 5 of our Terms.
© 2023 The Author(s). This work is published and licensed by Dove Medical Press Limited. The
full terms of this license are available at https://www.dovepress.com/terms
and incorporate the Creative Commons Attribution
- Non Commercial (unported, 3.0) License.
By accessing the work you hereby accept the Terms. Non-commercial uses of the work are permitted
without any further permission from Dove Medical Press Limited, provided the work is properly
attributed. For permission for commercial use of this work, please see paragraphs 4.2 and 5 of our Terms.
Recommended articles
Association Between Serum Albumin Level and Microvascular Complications of Type 2 Diabetes Mellitus
Zhang J, Deng Y, Wan Y, He S, Cai W, Xu J
Diabetes, Metabolic Syndrome and Obesity 2022, 15:2173-2182
Published Date: 23 July 2022
Correlation Between Mean Amplitude of Glycemic Excursion and Bone Turnover Markers in Patients with Type 2 Diabetes: A Cross-Sectional Study
Yang J, Zheng C, Wang Y, Yang L, Liu L
Diabetes, Metabolic Syndrome and Obesity 2023, 16:397-407
Published Date: 10 February 2023
Association Between Intestinal Prevotella copri Abundance and Glycemic Fluctuation in Patients with Brittle Diabetes
Liu J, Zhou L, Sun L, Ye X, Ma M, Dou M, Shi L
Diabetes, Metabolic Syndrome and Obesity 2023, 16:1613-1621
Published Date: 3 June 2023
Retinal Microvascular Diameters are Associated with Diabetic Kidney Disease in Patients with Type 2 Diabetes Mellitus
Feng J, Xie X, Teng Z, Fei W, Zhen Y, Liu J, Yang L, Chen S
Diabetes, Metabolic Syndrome and Obesity 2023, 16:1821-1831
Published Date: 21 June 2023
Sex Difference in the Association Between Serum Versican and Albuminuria in Patients with Type 2 Diabetes Mellitus
Li S, Li N, Li L, Zhan J
Diabetes, Metabolic Syndrome and Obesity 2023, 16:3631-3639
Published Date: 11 November 2023