Back to Journals » Diabetes, Metabolic Syndrome and Obesity » Volume 16
Association Between Intestinal Prevotella copri Abundance and Glycemic Fluctuation in Patients with Brittle Diabetes
Authors Liu J, Zhou L, Sun L, Ye X ![]() , Ma M, Dou M, Shi L
, Ma M, Dou M, Shi L
Received 16 March 2023
Accepted for publication 13 May 2023
Published 3 June 2023 Volume 2023:16 Pages 1613—1621
DOI https://doi.org/10.2147/DMSO.S412872
Checked for plagiarism Yes
Review by Single anonymous peer review
Peer reviewer comments 3
Editor who approved publication: Dr Konstantinos Tziomalos
Juan Liu,1 Liang Zhou,1 Lili Sun,1 Xinhua Ye,1 Menglu Ma,2 Min Dou,2 Li Shi1
1Department of Endocrinology, The Affiliated Changzhou No.2 People’s Hospital of Nanjing Medical University, Changzhou, Jiangsu, 213164, People’s Republic of China; 2Bengbu Medical College, Bengbu, Anhui, 233000, People’s Republic of China
Correspondence: Li Shi; Xinhua Ye, Department of Endocrinology, The Affiliated Changzhou No.2 People’s Hospital of Nanjing Medical University, No. 68 Gehu Middle Road, Wujin District, Changzhou, Jiangsu, 213164, People’s Republic of China, Email [email protected]; [email protected]
Objective: Previous studies have demonstrated an association between gut microbiota composition and non-brittle type 2 diabetes (NBT2DM) pathogenesis. However, little is known about the correlation between the abundance of intestinal Prevotella copri and glycemic fluctuations in patients with brittle diabetes mellitus (BDM). In this context, we conducted a case-control study of BDM patients and patients with NBT2DM, aiming to determine and analyze the relationship between the abundance of intestinal Prevotella copri and glycemic fluctuations in patients with BDM.
Research Design and methods: We performed a metagenomic analysis of the gut microbiome obtained from fecal samples of 10 BDM patients, and compared their microbial composition and function to NBT2DM patients (1:1 ratio). Then further collected data including age, sex, BMI, glycated hemoglobin (HbA1c), blood lipids, and alpha diversity of the gut microbiota, which were comparable between the BDM and NBT2DM patients by t-test.
Results: A significant difference existed in the beta diversity of the gut microbiota between the two groups (PCoA, R2 = 0.254, P = 0.0001). The phylum-level abundance of Bacteroidetes in the gut microbiota of the BDM patients was significantly lower, by 24.9% (P = 0.001), than that of the NBT2DM patients. At the gene level, the abundance of Prevotella copri was obviously reduced, Correlation analysis showed that the Prevotella copri abundance was inversely correlated to the standard deviation of blood glucose (SDBG) (r = − 0.477, P = 0.034). Quantitative PCR confirmed that the abundance of Prevotella copri in the BDM patients in the validation cohort was significantly lower than that in NBT2DM patients, and was negatively correlated with SDBG (r = − 0.318, P = 0.043). Glycemic variability in BDM was inversely correlated with the abundance of intestinal Prevotella copri.
Conclusion: The decreased abundance of Prevotella copri in patients with BDM may be associated with glycemic fluctuation.
Keywords: brittle diabetes, glycemic variability, Prevotella copri, type 2 diabetes mellitus, case-control study
Introduction
Brittle diabetes mellitus (BDM), also known as unstable diabetes, was first introduced by Woodyatt in 1934 to describe the unexplainable changes in glycemic levels. BDM is characterized by large blood sugar fluctuations, extremely unstable conditions, and repeated alternative hypoglycemia and ketosis. BDM is common in patients with type 1 diabetes (T1DM) or type 2 diabetes (T2DM) complicated by severe insulin deficiency. The incidence of BDM in adults with diabetes is 12/10,000, and the incidence of T1DM is 6–20%.1,2 BDM patients are often hospitalized for diabetic ketoacidosis or hypoglycemia, and frequent alternation of chronic hyperglycemia and hypoglycemia leads to a significantly elevated risk of chronic cardiovascular and neurological complications, considerably increasing the risk of death and disability. The main causes of glycemic fluctuations in patients with BDM are poor islet β-cell function, unreasonable diet and exercise, and ineffective drug treatment strategies. In addition, the process of food absorption in the intestine is also an important factor affecting postprandial glucose level changes. The stabilization of glycemic fluctuations in BDM patients has always been challenging in clinical practice.
A large number of microorganisms and their communities inhabit the human intestinal tract, reaching 1014, which is close to 10 times the number of human somatic cells.3 Intestinal flora plays an irreplaceable role in digestion, absorption, nutrient metabolism, and immune defense.
The regulation of the glucose level by intestinal flora may be related to energy imbalance and altered food absorption due to intestinal permeability changes caused by inflammation, which is triggered by translocation of lipopolysaccharides or bacterial flora into the blood.4,5 Previous studies have demonstrated an association between gut microbiota composition and general type 2 diabetes.6 However, it is still unknown why BMD patients develop severe swings in blood glucose and how their gut microbiota differs compared with NBT2DM patients.
A recent report showed that by transplanting the intestinal flora of healthy individuals into BDM patients, the glycemic fluctuations in the latter can be significantly improved, but the specific mechanism remains unclear.7 Therefore, here, we aimed to elucidate if it was possible to impact glycemic fluctuations in patients with BDM by changing their gut microbiota composition. We compared the composition of gut microbiota of patients with BMD and those with non-brittle type 2 diabetes (NBT2DM). Using correlation analysis, we screened out the bacteria that may affect glycemic fluctuations.
Methods
Study Design and Population
This observational study included patients with BDM and NBT2DM admitted to the Changzhou No.2 People’s Hospital between August 2020 and December 2021. All patients were permanent residents of the city. Age, BMI, disease duration, HbA1c, and blood lipids level were comparable for the two groups of study subjects.The gut microbiota compositions of 10 BDM patients and 10 NBT2DM patients were analyzed by deep sequencing to establish the existing differences. Then, validation analysis was performed in 41 BDM and 36 NBT2DM patients. Prevotella copri was detected by quantitative PCR.
The present study was conducted in compliance with the Declaration of Helsinki and was approved by Ethics Committee of Changzhou No.2 People’s Hospital ([2020] KY131-01). All participants were informed consent to the study.
Inclusion Criteria
(1) The patients in the BDM group met the diagnostic criteria for BDM in practical endocrinology:8 1) daily variation of fasting blood glucose ≥ 5.55 mmol/L and the change showing a V-curve; 2) daily urine sugar excretion fluctuation of more than 30 g; 3) unexpected hypoglycemia; 4) frequent presence of positive urine ketone bodies; 5) intraday blood glucose variation range ≥ 11.1 mmol/L; the NBT2DM group patients met the diagnostic criteria of T2DM in Chinese Guidelines, SDBG ≤ 3.54 mmol/L;9 (2) Age: 18–75 years; (3) BMI < 24 kg/m2.
Exclusion Criteria
(1) Intestinal organic diseases and a history of abdominal surgery; (2) Pregnant or breastfeeding; (3) Use of bulking agents, antidiarrheal drugs, antispasmodics, probiotics, and antibacterial drugs within the past two weeks; (4) Recent use of metformin, acarbose, or DPP-4 inhibitor in the past two weeks.
Blood glucose was controlled by using insulin subcutaneous pump in BDM patients and sulfonylurea or glinide oral hypoglycemic drugs in NBT2DM patients.
Data Collection and Definition
All subjects fasted for 10 hours overnight, and their heights and weights were measured. Fasting venous blood was collected and sent to the central laboratory for analysis of blood glucose, lipids, liver and kidney function, fasting serum C-peptide, and glycosylated hemoglobin (HbA1c). Blood glucose index was detected by the glucose oxidase method, and blood lipids were determined by an enzymatic method (TOSOH Corp., Kyoto, Japan). Serum C-peptide was measured by chemiluminescence immunoassay and detected by an automatic microparticle chemiluminescence immunoassay analyzer (Beckman Coulter, Brea, CA, USA). HbA1c was measured using high liquid chromatography and detected by HLC-723G8 automatic HbA1c analyzer (TOSOH Corp., Kyoto, Japan).
Aucc-P
The patients were fasted from 20:00 of the day before the test to 8:00 on the day of the test when fasting blood samples were taken. They were asked to eat 100 g of steamed bread made of flour, which was completed within 15 min after the first bite was started. Venous blood was drawn at 60 and 120 min afterwards for measurements of the blood glucose and C-peptide levels. The following formula was used for the calculations:10 AUCC-P = (C-P0 min + C-P120 min)/2 + C-P60 min.
Standard Deviation of Blood Glucose (SDBG)
All study subjects underwent fingertip blood glucose monitoring for two consecutive days at 7:00 (before and 2 hours after each meal, and before bedtime). The daily SDBG was calculated, and the average of the two days’ SDBG was used to evaluate the glycemic fluctuation.
Deep Sequencing
Fresh feces were collected under aseptic conditions, and the central parts of the feces (10 ± 5) g were placed in sterile cryopreservation tubes and quickly frozen at −80 °C. Next, DNA was extracted from stool samples based on the QIAamp DNA Fecal Mini Kit (Waldbronn, Germany). Genomic DNA was then amplified with bacterial 16S rRNA gene. Agencourt AMPure XP magnetic beads were utilized for purification and then dissolved in elution buffer to complete the library construction. The fragment range of the library was tested using an Agilent 2100 Bioanalyzer (Agilent Technologies Deutschland GmbH, Waldbronn, Germany). The qualified libraries were sequenced on the HiSeq platform.
qPCR
The Prevotella copri biomarkers initially identified above were confirmed by qPCR in the samples of a new set of BDM and NBT2DM patients. Specific PCR primers were designed, the result of which is listed in Table 1. All qPCR tests were carried out twice, and the averaged values of the results were used for further calculation and analysis. Each reaction mixture of 20 μL was combined with 0.4 μL of forward primer, 0.4 μL of reverse primer, 10 μL of SYBR Green Mix, 2 μL of template DNA, and 7.2 μL RNase-free ddH2O. Real-time qPCR was then performed under the cycle as follow: initial incubation at 95 °C for 5 min, 40 cycles of denaturation at 95 °C for 10s and annealing/extension at 60 °C for 30s.
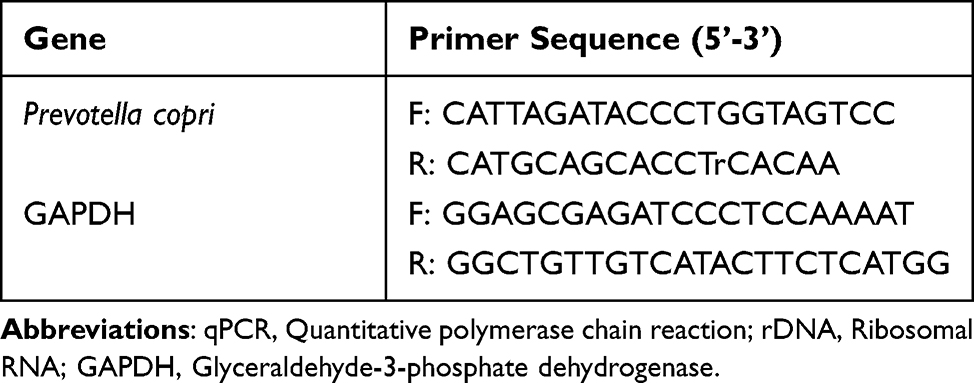 |
Table 1 The Primers Used for qPCR Analysis of 16S rDNA |
Statistical Analysis
Data with normal distribution were described as mean ± SD; an t-test was employed for intergroup comparisons. The data that were not normally distributed were expressed as the median and quartiles. The rank-sum test was used to measure the differences between the two groups. The results of intestinal flora abundance were converted from log 10 to normal distribution before statistical analysis. Statistically difference is judged by P < 0.05. The correlation of variables was verified by Pearson’s or Spearman’s analysis. All data analyses were conducted with SPSS version 19 statistical analysis software program.
Results
Demographic Characteristics
No significant differences were established in gender ratio, age, BMI, diabetes duration, HbA1c, and blood lipid levels between the BDM and NBT2DM groups. The islet β-cell function of AUCC-P of the BDM group patients was significantly lower than that of the NBT2DM group patients; the blood glucose fluctuation levels of SDBG in the BDM group patients were significantly higher (Table 2).
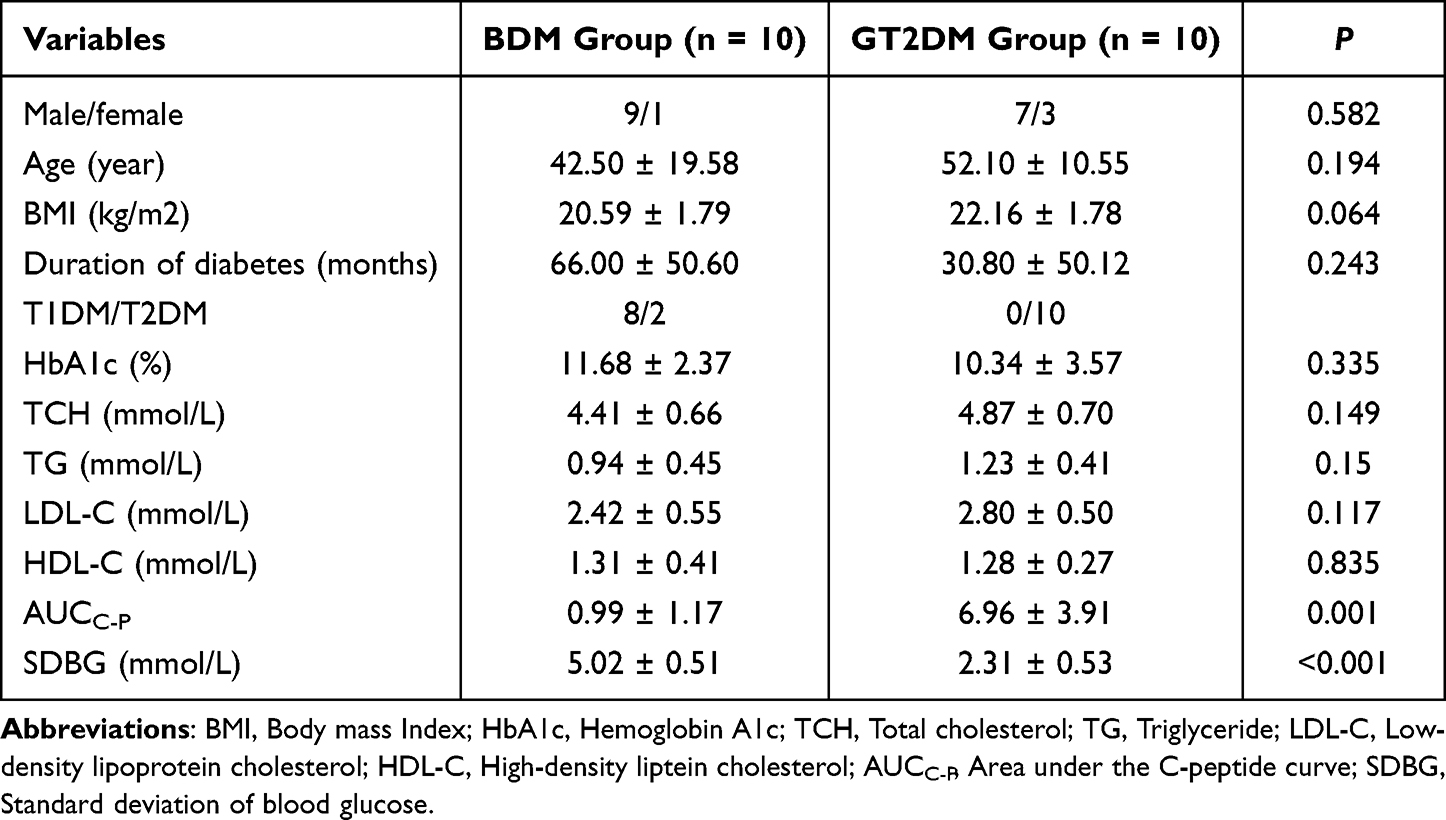 |
Table 2 Demographic Characteristics |
Fecal Microbiota
Clustering bacterial communities using principal coordinates analysis (PCoA) revealed that the fecal microbiota of the BDM patients differed from that of the NBT2DM patients (analysis of similarities [ANOSIM]: R2 = 0.254, P = 0.0001; Figure 1A). Based on the Shannon diversity index (Figure 1B), no difference was found in the alpha diversity between the BDM and NBT2DM patients (P = 0.684). The relative abundance of the represented three main phyla (Bacteroidetes, Firmicutes, and Proteobacteria) exceeded 90% of all sequences at the phylum level: 90.8% in the BDM patients and 98.3% in the NBT2DM patients. However, we established 24.9% lower relative abundance of Bacteroidetes in the BDM patients than that in the NBT2DM patients (P = 0.001) (Figure 1C). At the genus level, a marked difference was revealed in the fecal microbiota between the BDM and NBT2DM patients (Figure 1D). The linear discriminant analysis effect size (LEfSe) indicated a clear difference in the fecal microbiota between the BDM and NBT2DM patients, with increased levels of Prevotella copri (LDA = 5.15, P = 0.03) in the NBT2DM patients and of Akkermansia (LDA = 4.39, P = 0.01), Lactobacillus (LDA = 3.77, P = 0.004), Collinsella (LDA = 3.52, P = 0.04), Streptococcus (LDA = 4.04, P = 0.013), and Bifidobacterium (LDA = 3.87, P = 0.008) in the BDM patients (Figure 1E). These findings indicate the presence of significant differences in the composition of the gut microbiota between the BDM and the NBT2DM groups. Furthermore, the abundance of Prevotella copri in the gut microbiota of the BDM patients was significantly lower, whereas the abundance of Akkermansia, Lactobacillus, Collinsella, Streptococcus, and Bifidobacterium was significantly higher, than that of the NBT2DM patients.
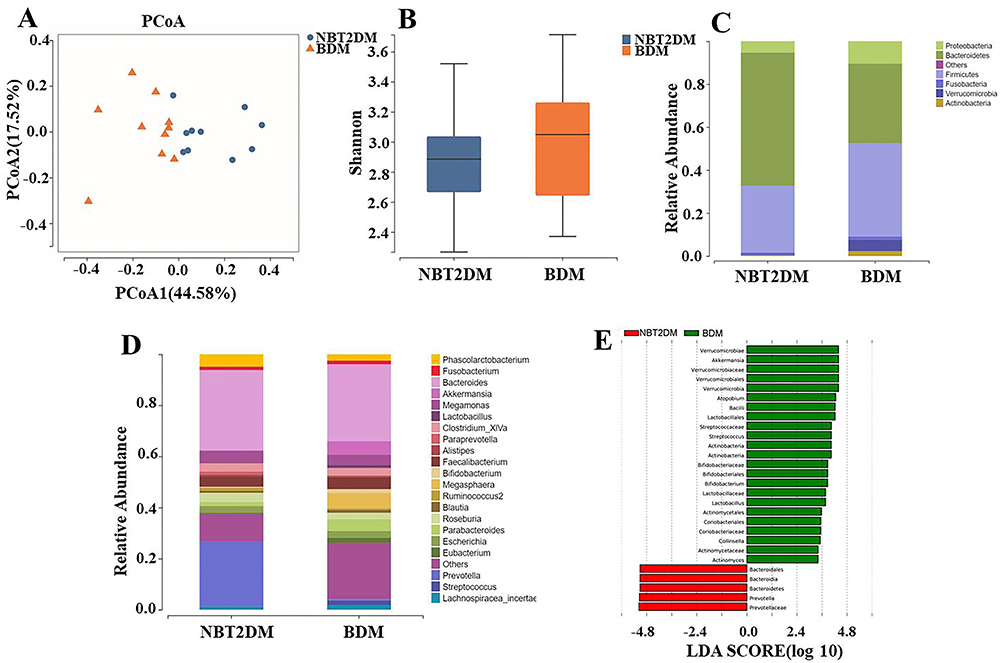 |
Figure 1 Gut microbiota analysis. (A) Principal coordinates analysis (PCoA) of the BDM group (n = 10) and NBT2DM group (n = 10) subjects based on unweighted UniFrac distance measures (Yellow triangles: BDM group; blue circles: NBT2DM group); (B) Shannon index of alpha diversity in the BDM group and NBT2DM group; (C) Taxonomic summary of the fecal microbiota at the phylum level and (D) at the genus level; (E) Discriminative taxa at the species level as determined by linear discriminant analysis (LDA) effect size. |
Correlation Analysis Between Glycemic Fluctuation and Bacterial Relative Abundance
To establish the relationship between the intestinal flora and glycemic fluctuation, we analyzed the correlation between the bacterial flora with significant differences in the relative abundance and glycemic fluctuation. As can be seen in Figure 2, the abundance of Prevotella copri was significantly negatively correlated with glycemic fluctuation (r = −0.477, P = 0.034). However, the no significant correlation was found between the abundance of Akkermansia, Lactobacillus, Collinsella, Streptococcus, and Bifidobacterium and glycemic fluctuation.
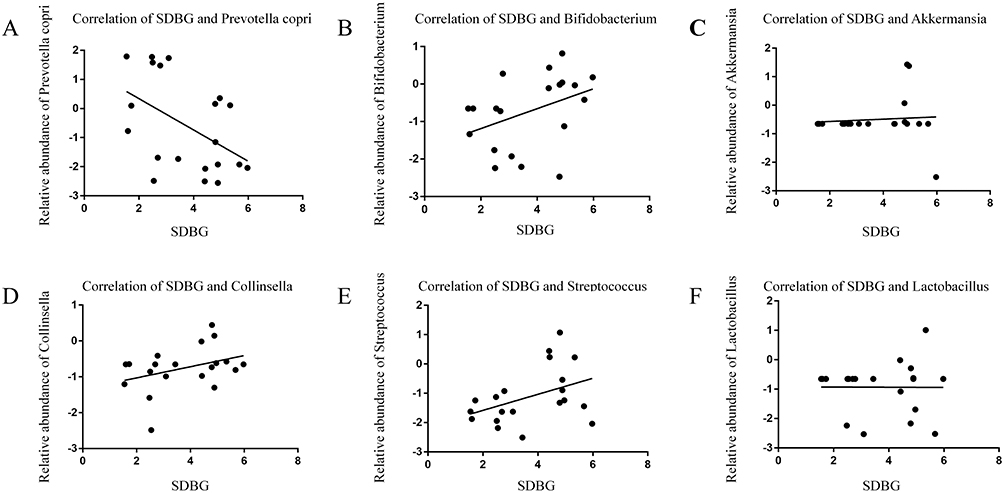 |
Figure 2 Correlation between glycemic fluctuation and bacterial relative abundance. (A) Prevotella copri, r = −0.477, P = 0.034; (B) Bifidobacterium, r = −0.389, P = 0.090; (C) AKKermansia, r = 0.176, P = 0.458; (D) Collinsella, r = 0.360, P = 0.119; (E) Streptococcus, r = 0.411, P = 0.072; (F) Lactobacillus, r = 0.067, P = 0.780. |
Validation of the Correlation Between Prevotella copri and Glycemic Fluctuation
To further verify the correlation between Prevotella copri and glycemic fluctuation, we selected 41 BDM and 36 NBT2DM patients for validation. The results showed no significant differences in age, disease course, BMI, blood glucose, and blood lipids between the two groups in the validation cohort. The insulin secretion level of the patients in the BDM group was significantly lower than that of the NBT2DM patients, and the blood glucose fluctuation level was significantly higher than that of the NBT2DM patients (Table 3). qPCR results revealed a significantly lower number of Prevotella copri in patients with BDM than in NBT2DM (P < 0.001) (Figure 3A). The abundance of intestinal Prevotella copri in the BDM patients was negatively correlated with glycemic fluctuations (r = −0.318, P = 0.043) (Figure 3B).
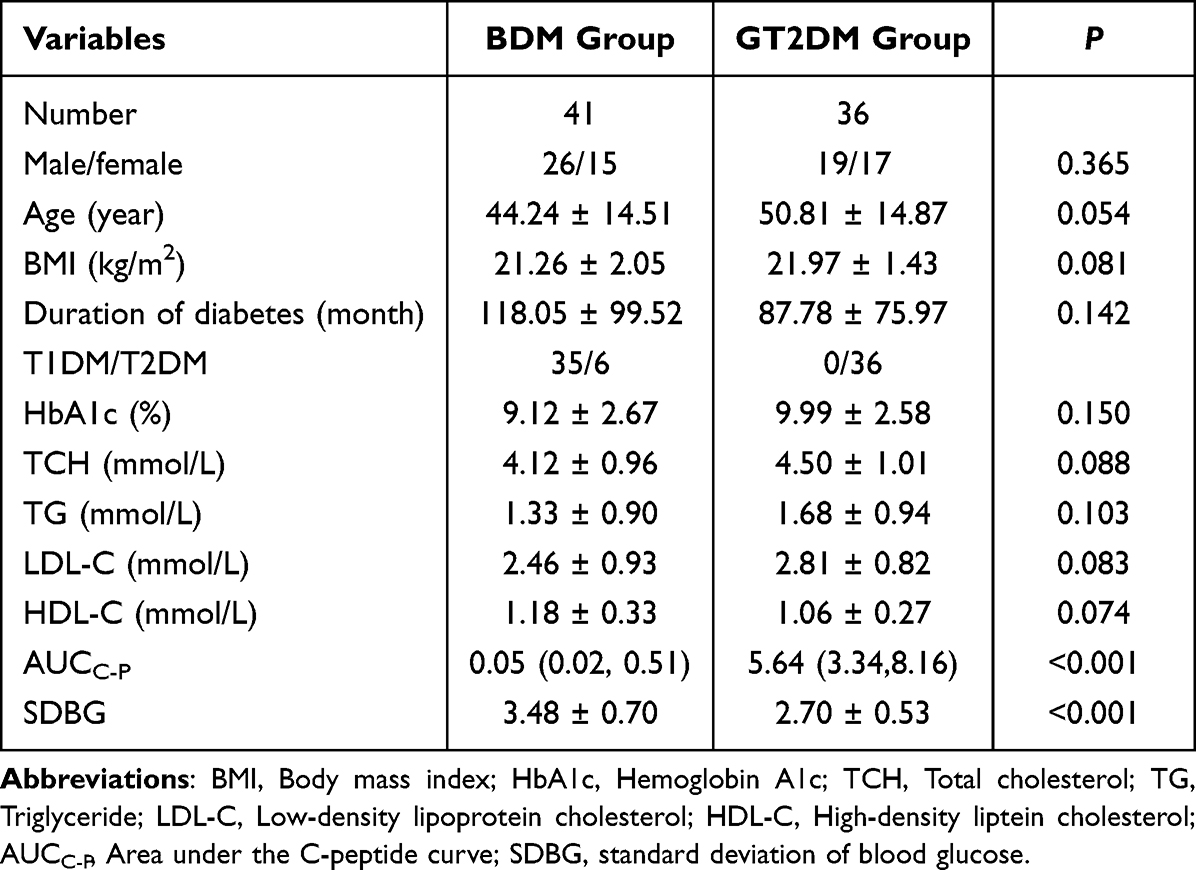 |
Table 3 Clinicopathological Parameters of the Subjects in the Validation Cohort |
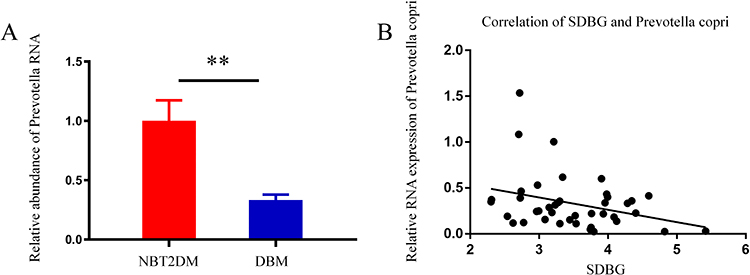 |
Figure 3 (A) Comparison of the content of Prevotella copri in the intestinal flora of the validation cohort. The abundance of Prevotella copri in the intestinal flora of patients with BDM was significantly lower than that of patients with NBT2DM, P = 0.002 (**P≤0.01); (B) Validation cohort analysis of the correlation between the intestinal Prevotella copri abundance and glycemic fluctuation in patients with BDM, r = −0.318, P = 0.043. |
Discussion
According to the current study, 16sDNA sequencing results show a significant difference in the beta diversity of the gut microbiota between BDM and NBT2DM patients. In terms of clinical manifestations, the essential difference between the BDM and NBT2DM groups was that the blood glucose fluctuation range of the BDM group was significantly higher than that of the NBT2DM group. According to Li Y’s study, by transplanting the intestinal flora of healthy individuals into BDM patients, the glycemic fluctuations in the latter can be significantly improved.7 This suggests that the gut microbiota is associated with blood glucose fluctuations in BDM patients, with changes in one factor reflecting fluctuations in the other.
Moreover, the proportion of Bacteroidetes in the gut microbiota was reduced in patients with BDM. Previous studies also showed that the ratio of Firmicutes/Bacteroidetes was increased, which was related to the disturbance of glucose metabolism.11,12
We further analyzed the abundance of this kind of species at the gene level and found that the abundance of Prevotella copri in the BDM patients was significantly lower than that in the NBT2DM patients. These findings were validated in an independent validation cohort. According to the experimental results, it can be judged that there is a close relationship between the abundance of Prevotella and the metabolic level of such patients, and it determines their blood glucose metabolism. This result has high reference value and provides support for the determination of relevant treatment schemes.
The presence of differences between the content of Prevotella copri in the intestinal flora of patients with T2DM and controls has been debatable.13–15 Studies have shown a significantly reduced abundance of Prevotella copri in the intestinal flora of patients with T1DM,16,17 which is highly consistent with this paper, since most BDM patients were patients with type 1 diabetes in this study, whereas the control group consisted of patients with type 2 diabetes.
We analyzed the correlation between the abundance of Prevotella copri and the level of glycemic fluctuation, and found that they were significantly negatively correlated, indicating that the increased abundance of Prevotella copri in the gut may reduce blood glucose fluctuations in patients with BDM.
Prevotella copri is an anaerobic bacterium of the genus Bacteroidetes Prevotella group, main fermentation products of which are acetic and succinic acids and little isovaleric, lactic acids. Previous studies have found that Prevotella copri is also involved in the body’s glucose metabolism. For example, the glucose tolerance of GK rats was improved after the intestinal perfusion of Prevotella copri.18 Cindy et al found that the increased abundance of Prevotella copri regulated the enteropancreatic axis and blood glucose through its metabolites short-chain fatty acids and the promoted release of glucagon-like peptide-1 from L cells.19 Succinate, the major metabolite of Prevotella copri, can improve glucose homeostasis through intestinal gluconeogenesis.20
To exclude the effects of drugs on the intestinal flora, insulin was administrated to BDM patients to control blood glucose, and sulfonylurea or glinide hypoglycemic drugs were used in NBT2DM patients. In addition, anti-diabetic drugs such as metformin, acarbose, and DPP-4 inhibitors were avoided.
This study is not without limitations. First, the sample size in the deep sequencing cohort was small. This can lead to detection bias for relatively low abundance flora. The impact of this bias was minimized by including a follow-up validation cohort. Second, healthy subjects were not used as control. We enrolled well-matched (by age, disease duration, BMI, HbA1c, and blood lipids level) NBT2DM subjects as control. The two groups studied consisted of patients with diabetes, the major difference of whom was that BDM patients have significantly higher fluctuation in blood glucose than NBT2DM patients. However, to further validate our results, healthy volunteers need to be enrolled as control to find out their intestinal Prevotella copri abundance. It should be noted that, this paper only found that Prevotella copri was obviously related to the blood glucose fluctuations in BDM patients; however, it could not be determined whether Prevotella copri abundance is a cause or a consequence for blood glucose fluctuation. Therefore, it is necessary to clarify this question in future.
Conclusion
The findings of the present study suggest the presence of obvious differences in the gut microbiota between patients with BDM and those with NBT2DM, and that the decreased abundance of Prevotella copri in patients with BDM may be associated with glycemic fluctuation. Nevertheless, large cohort research is still needed to further confirm above conclusion and elucidate the underlying mechanism of action and the significance of the relationships between Prevotella copri abundance in BDM patients and their glycemic level dynamics.
Abbreviations
BDM, Brittle diabetes mellitus; NBT2DM, Non-brittle type 2 diabetes; BMI, Body mass index; HbA1c, Glycated hemoglobin; TCH, Total cholesterol; TG, Triglyceride; HDL-C, High-density liptein cholesterol; AUCC-P, Area under the C-peptide curve; SD, Standard deviation; SDBG, Standard deviation of blood glucose; qPCR, Quantitative polymerase chain reaction; T1DM, Type 1 diabetes mellitus; T2DM, Type 1 diabetes mellitus; PCoA, Principal coordinates analysis; LDA, Linear discriminant analysis.
Data Sharing Statement
The data generated in this study are available within the article. Further inquiries can be directed to the corresponding author.
Acknowledgments
We thank all the study participants for their cooperation.
Funding
This research was funded by Changzhou Sci & Tech Program (No. CJ20210111).
Disclosure
The authors declare that they have no conflict of interest.
References
1. Hirsch IB, Gaudiani LM. A new look at brittle diabetes. J Diabetes Complications. 2021;35(1):107646. doi:10.1016/j.jdiacomp.2020.107646
2. Gill GV, Lucas S, Kent LA. Prevalence and characteristics of brittle diabetes in Britain. QJM. 1996;89(11):839–843. doi:10.1093/qjmed/89.11.839
3. Lynch SV, Pedersen O. The human intestinal microbiome in health and disease. N Engl J Med. 2016;375(24):2369–2379. doi:10.1056/NEJMra1600266
4. Ley RE, Turnbaugh PJ, Klein S, Gordon JI. Microbial ecology: human gut microbes associated with obesity. Nature. 2006;444(7122):1022–1023. doi:10.1038/4441022a
5. Erejuwa OO, Sulaiman SA, Ab Wahab MS. Modulation of gut microbiota in the management of metabolic disorders: the prospects and challenges. Int J Mol Sci. 2014;15(3):4158–4188. doi:10.3390/ijms15034158
6. Zhou Z, Sun B, Yu D, Zhu C. Gut microbiota: an important player in type 2 diabetes mellitus. Front Cell Infect Microbiol. 2022;12:834485. doi:10.3389/fcimb.2022.834485
7. Li YY, Zhu YX, Zhou Y, Qian C, Zhou Q. Efficacy and safety of washed microbiota transplantation in the treatment of brittle diabetes. Chin J Diabetes Mellitus. 2020;12:962–967.
8. Liu X. Practical Endocrinology. People’s Medical Officer Press; 1997:356.
9. Zhigu L, Bin Y, Beisi L, et al. Correlation between glycemic variability indices calculated by self-monitoring of blood glucose and mean amplitude of glycemicexcursion in patients with type 2 diabetes mellitus. Chin J Diabetes Mellitus. 2021;13(5):476–481.
10. Lebovitz HE, Banerji MA. Ketosis-prone diabetes (flatbush diabetes): an emerging worldwide clinically important entity. Curr Diab Rep. 2018;18(11):120. doi:10.1007/s11892-018-1075-4
11. Gill SR, Pop M, Deboy RT, et al. Metagenomic analysis of the human distal gut microbiome. Science. 2006;312(5778):1355–1359. doi:10.1126/science.1124234
12. Chen B, Wang Z, Wang J, et al. The oral microbiome profile and biomarker in Chinese type 2 diabetes mellitus patients. Endocrine. 2020;68(3):564–572. doi:10.1007/s12020-020-02269-6
13. Sato J, Kanazawa A, Ikeda F, et al. Gut dysbiosis and detection of “live gut bacteria” in blood of Japanese patients with type 2 diabetes. Diabetes Care. 2014;37(8):2343–2350. doi:10.2337/dc13-2817
14. Medina-Vera I, Sanchez-Tapia M, Noriega-López L, et al. A dietary intervention with functional foods reduces metabolic endotoxaemia and attenuates biochemical abnormalities by modifying faecal microbiota in people with type 2 diabetes. Diabetes Metab. 2019;45(2):122–131. doi:10.1016/j.diabet.2018.09.004
15. Sedighi M, Razavi S, Navab-Moghadam F, et al. Comparison of gut microbiota in adult patients with type 2 diabetes and healthy individuals. Microb Pathog. 2017;111:362–369. doi:10.1016/j.micpath.2017.08.038
16. Brown CT, Davis-Richardson AG, Giongo A, et al. Gut microbiome metagenomics analysis suggests a functional model for the development of autoimmunity for type 1 diabetes. PLoS One. 2011;6(10):e25792. doi:10.1371/journal.pone.0025792
17. Leiva-Gea I, Sánchez-Alcoholado L, Martín-Tejedor B, et al. Gut microbiota differs in composition and functionality between children with type 1 diabetes and MODY2 and healthy control subjects: a case-control study. Diabetes Care. 2018;41(11):2385–2395. doi:10.2337/dc18-0253
18. Péan N, Le Lay A, Brial F, et al. Dominant gut Prevotella copri in gastrectomised non-obese diabetic Goto-Kakizaki rats improves glucose homeostasis through enhanced FXR signalling. Diabetologia. 2020;63(6):1223–1235. doi:10.1007/s00125-020-05122-7
19. Le Bourgot C, Ferret-Bernard S, Apper E, et al. Perinatal short-chain fructooligosaccharides program intestinal microbiota and improve enteroinsular axis function and inflammatory status in high-fat diet-fed adult pigs. FASEB J. 2019;33(1):301–313. doi:10.1096/fj.201800108R
20. De Vadder F, Kovatcheva-Datchary P, Zitoun C, Duchampt A, Bäckhed F, Mithieux G. Microbiota-produced succinate improves glucose homeostasis via intestinal gluconeogenesis. Cell Metab. 2016;24(1):151–157. doi:10.1016/j.cmet.2016.06.013
 © 2023 The Author(s). This work is published and licensed by Dove Medical Press Limited. The
full terms of this license are available at https://www.dovepress.com/terms
and incorporate the Creative Commons Attribution
- Non Commercial (unported, 3.0) License.
By accessing the work you hereby accept the Terms. Non-commercial uses of the work are permitted
without any further permission from Dove Medical Press Limited, provided the work is properly
attributed. For permission for commercial use of this work, please see paragraphs 4.2 and 5 of our Terms.
© 2023 The Author(s). This work is published and licensed by Dove Medical Press Limited. The
full terms of this license are available at https://www.dovepress.com/terms
and incorporate the Creative Commons Attribution
- Non Commercial (unported, 3.0) License.
By accessing the work you hereby accept the Terms. Non-commercial uses of the work are permitted
without any further permission from Dove Medical Press Limited, provided the work is properly
attributed. For permission for commercial use of this work, please see paragraphs 4.2 and 5 of our Terms.
Recommended articles
Correlation Between Mean Amplitude of Glycemic Excursion and Bone Turnover Markers in Patients with Type 2 Diabetes: A Cross-Sectional Study
Yang J, Zheng C, Wang Y, Yang L, Liu L
Diabetes, Metabolic Syndrome and Obesity 2023, 16:397-407
Published Date: 10 February 2023
Effects of Glycemic Variability on Regulatory T Cells in Patients with Type 2 Diabetes and Kidney Disease
Gu QW, Sun Q, Wang J, Gu WS, Wang W, Mao XM
Diabetes, Metabolic Syndrome and Obesity 2023, 16:2365-2375
Published Date: 8 August 2023