
Back to Journals » Diabetes, Metabolic Syndrome and Obesity » Volume 18
Factors Associated with Blood Glucose Fluctuations in Patients with Type 2 Diabetes: A Retrospective Observational Study Using Continuous Glucose Monitoring
Authors Zhong N, Zhang A, Chen J, Hu Z, Nie R, Huang J, Wu M, Pan H
Received 6 June 2025
Accepted for publication 18 October 2025
Published 5 November 2025 Volume 2025:18 Pages 4049—4057
DOI https://doi.org/10.2147/DMSO.S542547
Checked for plagiarism Yes
Review by Single anonymous peer review
Peer reviewer comments 2
Editor who approved publication: Prof. Dr. Ernesto Maddaloni
Ni Zhong,1 Ao Zhang,1 Jiashen Chen,1 Zihan Hu,1 Renshan Nie,2 Jinzhu Huang,2 Meifen Wu,2 Haiyan Pan1,2
1School of Public Health, Guangdong Medical University, Dongguan, Guangdong, People’s Republic of China; 2Department of Endocrinology, the First Dongguan Affiliated Hospital of Guangdong Medical University, Dongguan, Guangdong, People’s Republic of China
Correspondence: Haiyan Pan, Email [email protected] Meifen Wu, Email [email protected]
Objective: To investigate the factors associated with glucose fluctuations in patients with type 2 diabetes mellitus (T2DM) using continuous glucose monitoring (CGM).
Methods: This retrospective observational study included 252 patients with T2DM who underwent CGM during hospitalization. Participants were stratified into two groups based on their coefficient of variation (CV) of glucose: the high-CV group (CV ≥ 33%, n=53) and the low-CV group (CV < 33%, n=199). Glucose fluctuation indices were calculated from CGM data. All patients underwent 3-day CGM during hospitalization. General clinical data and biochemical indicators were collected. Statistical analyses included t-tests, Mann–Whitney U-tests, logistic regression, and restricted cubic spline models.
Results: Significant differences were observed between the two groups in terms of disease duration, BMI, triglycerides, and C-peptide levels (P< 0.05). Compared to the low-CV group, patients in the high-CV group had significantly lower Time in Range (TIR) and higher Time Above Range (TAR) and Time Below Range (TBR) (all P< 0.001).
Multivariate Logistic regression analysis revealed that low BMI, low C-peptide, and longer disease duration may be risk factors for abnormal blood glucose fluctuations in T2DM patients (P< 0.05). Linear regression revealed a significant negative correlation between C-peptide levels and CV (β = -0.02, P=0.003).
A threshold effect was observed between C-peptide and the coefficient of variation(CV) of blood glucose (Cut-off=0.913 nmol/L), with CV increasing by 0.07 per 1 nmol/L decrease in C-peptide below this threshold (P=0.029).
Conclusion: This study suggests that patients with longer disease duration, lower BMI, and poorer pancreatic function have higher odds of significant glucose fluctuations. Enhanced monitoring of glucose fluctuations and education on potential risks are recommended for these subgroups to improve self-management abilities.
Keywords: type 2 diabetes mellitus, glucose fluctuation, continuous glucose monitoring, coefficient of variation, time in range
Introduction
Type 2 diabetes mellitus (T2DM) is a complex metabolic disorder characterized by persistent hyperglycemia due to a combination of insulin resistance and progressive β-cell dysfunction.1 Although achieving target glycated hemoglobin (HbA1c) levels remains a cornerstone of glycemic management, emerging evidence indicates that glycemic variability—encompassing the magnitude, frequency, and duration of glucose fluctuations—may also play a significant and independent role in diabetes-related outcomes.2
Significant glucose fluctuations in patients with T2DM have been demonstrated to directly affect treatment efficacy and lead to adverse clinical outcomes in the short term,3 while potentially increasing the risk of diabetic complications and cardiovascular events in the long term.4,5 Recent research indicates that acute glycemic fluctuations induce oxidative stress and inflammatory responses that contribute to vascular endothelial dysfunction independently of average glucose levels.6–8 This pathophysiological mechanism may explain why some patients with apparently well-controlled HbA1c still develop diabetic complications, underscoring the importance of addressing glycemic variability in comprehensive diabetes management.
Continuous glucose monitoring (CGM) represents a significant advancement in diabetes care, providing comprehensive insights into glucose dynamics by continuously measuring glucose concentrations in interstitial fluid through subcutaneous sensors.9,10 Unlike traditional self-monitoring of blood glucose (SMBG) or point-of-care testing (POCT), which offer only intermittent “snapshots” of glycemic status, CGM enables detection of otherwise unrecognized hyperglycemic and hypoglycemic episodes and their durations, thus offering a more complete picture of glycemic control.11
Among the various metrics derived from CGM data, the coefficient of variation (CV) of glucose has emerged as the preferred indicator for assessing glycemic variability.12,13 According to the 2021 Chinese Guidelines for Clinical Application of Blood Glucose Monitoring, a CV below 33% is recommended as the target for the Chinese diabetic population.14 Additionally, time in range (TIR), time above range (TAR), and time below range (TBR) have been recognized by international consensus as valuable parameters for comprehensive evaluation of glycemic control.15
Despite the increasing recognition of glycemic variability as a clinically relevant aspect of diabetes management, the factors that contribute to abnormal glucose fluctuations in T2DM patients remain incompletely understood. Identifying these factors is crucial for developing targeted interventions to optimize glycemic stability. Therefore, this study aims to conduct a retrospective analysis of the medical records of patients with type 2 diabetes, utilizing continuous glucose monitoring data to evaluate blood glucose fluctuation patterns under different patient characteristics, and to identify factors associated with abnormal glycemic variability, thereby identifying at-risk subgroups for better-targeted treatment strategies.
Materials and Methods
Study Design and Population
This retrospective observational study was conducted at the Department of Endocrinology, First Dongguan Affiliated Hospital of Guangdong Medical University, between May 2023 and August 2024. The study protocol was approved by the Medical Ethics Committee of the hospital (approval number: YJYS202405006), and the requirement for informed consent was waived due to the retrospective nature of the investigation.
We initially screened 252 hospitalized patients with type 2 diabetes mellitus (T2DM) who underwent continuous glucose monitoring (CGM) during the study period. T2DM was diagnosed according to the 2020 Chinese Guidelines for Prevention and Control of Type 2 Diabetes Mellitus,16 based on one or more of the following criteria: typical diabetic symptoms plus random blood glucose ≥ 11.1 mmol/L, fasting blood glucose ≥ 7.0 mmol/L, 2-hour blood glucose during an oral glucose tolerance test (OGTT) ≥ 11.1 mmol/L, or glycated hemoglobin (HbA1c) ≥ 6.5%.
Inclusion criteria were: (1) age ≥18 years; (2) confirmed diagnosis of T2DM; (3) completion of CGM examination; and (4) availability of complete clinical and laboratory data. Exclusion criteria comprised: (1) type 1 diabetes mellitus, gestational diabetes, or other special types of diabetes; (2) concurrent use of medications known to affect glucose metabolism (eg, glucocorticoids, immunosuppressants, or antipsychotics); (3) presence of acute complications (diabetic ketoacidosis, hyperosmolar hyperglycemic state, or severe infection); (4) severe hepatic or renal dysfunction; (5) pregnancy or lactation; and (6) poor adherence to CGM monitoring procedures or incomplete CGM data (recording time <72 hours or missing data >20%).
Data Collection
Basic data such as age, sex, height, weight, disease duration and clinical biochemical indicators including glycosylated hemoglobin (HbA1c), triglyceride (TG), total cholesterol (TCHO), high-density lipoprotein cholesterol (HDL-C), low-density lipoprotein cholesterol (LDL-C), creatinine (cr), uric acid (UA), fasting C-peptide and urinary albumin/creatinine ratio (ACR) were collected from all study participants at the time of admission.
After the patient is admitted, the CGM device will be worn with their informed consent, which is consists of a disposable glucose testing probe and glucose recorder. After appropriate skin preparation and disinfection, the subcutaneous sensor was inserted into the upper lateral abdominal area by trained healthcare professionals. The sensor continuously measured interstitial fluid glucose concentrations at 5-minute intervals, providing approximately 288 readings per day and storing the data in the blood glucose management system. The CGM blood glucose data of the patient will be extracted and analyzed during the period of insulin intensive therapy (3 days). This stable treatment plan can minimize the interference of the treatment plan on our research.
Indicators of glucose fluctuations include the following: (1) Coefficient of Variation (CV) is the percentage obtained from the ratio of the standard deviation of mean glucose values (SDBG) to average of all glucose values (MBG) and is used to evaluate glucose fluctuations. (2) Time in range (TIR) refers to the percentage of time that glucose is in the target range, which in this study was 3.9–10.0 mmol/L.15 (3) Time above range (TAR) refers to the percentage of time that glucose is above the target range, which in this study was glucose > 10.0 mmol/L.15 (4) Time below range (TBR) refers to the percentage of time that glucose is below the target range, which in this study was glucose < 3.9 mmol/L.15
Statistical Analysis
Statistical analyses were performed using SPSS software (version 25.0) and R software version 4.1.0. Categorical variables were expressed as counts and percentages, and between-group comparisons were conducted using the chi-square test or Fisher’s exact test as appropriate. For continuous variables, normality was assessed using the Shapiro–Wilk test and visual inspection of histograms. Normally distributed variables were presented as mean ± standard deviation and compared using independent samples t-tests, while non-normally distributed variables were expressed as median with interquartile range (M [P25, P75]) and compared using the Mann–Whitney U-test.
Potential factors associated with abnormal glucose fluctuations were initially identified through univariate analysis. Variables with statistically significant differences (P<0.05) were subsequently incorporated into multivariate logistic regression models to determine independent predictors of abnormal glycemic variability. Odds ratios (ORs) and 95% confidence intervals (CIs) were calculated.
To explore the relationship between significant clinical parameters and glycemic variability metrics, both linear and non-linear correlation analyses were performed. For non-linear analyses, restricted cubic spline models were constructed using the “rms” package in R software. Model selection was based on the Akaike information criterion (AIC), with lower AIC values indicating better fit. Three statistical models were constructed: Model 1 (unadjusted); Model 2 (adjusted for age, sex, and BMI); and Model 3 (adjusted for all baseline variables). For all analyses, a two-sided P<0.05 was considered statistically significant.
Results
Participant Characteristics Stratified by CV Groups
Based on the 2021 Chinese Guidelines for Clinical Application of Blood Glucose Monitoring,14 participants were stratified into two cohorts: high-CV group (CV ≥ 33%, n=53) and low-CV group (CV < 33%, n=199).
For patients who were monitored using CGM, there was no statistically significant difference in age, sex, HbA1c, TCHO, HDL-C, LDL-C, UA, cr, and ACR between the two groups (P>0.05). There was a statistically significant difference between the two groups for BMI, duration of disease, TG, and C-peptide (P<0.05). Patients in the high-CV group had longer disease duration and lower BMI, TG and C-peptide compared to the low-CV group. Details are reported in Table 1.
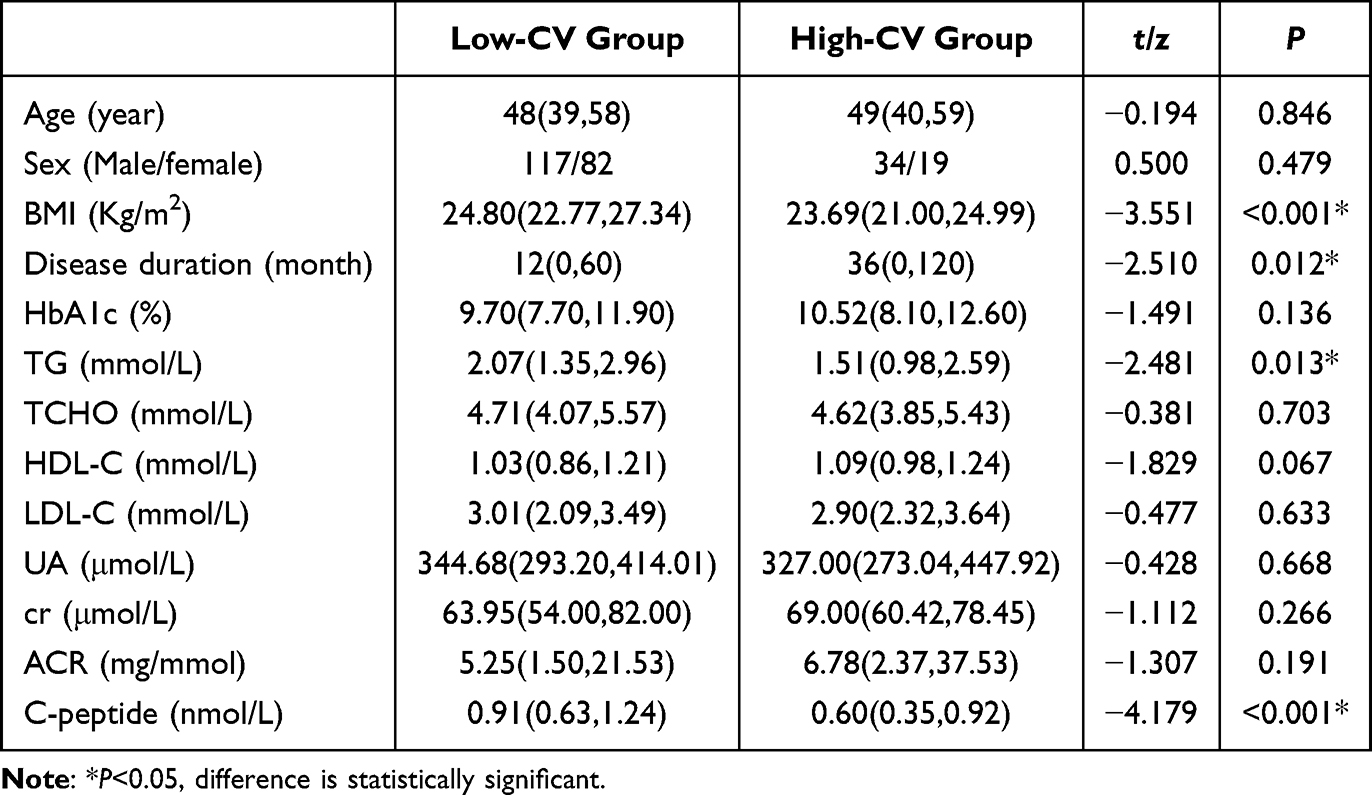 |
Table 1 Clinical Characteristics of Patients with Type 2 Diabetes Stratified by Coefficient of Variation (CV) Groups |
Comparison of CGM Parameter Indices Between CV Groups
Patients with T2DM in the high-CV group had lower TIR and higher TAR and TBR compared to the low-CV group. Patients in the low-CV group had TIR, TAR and TBR within the guideline-recommended control target values (TIR>70%, TBR<4%, TAR<25%). Patients in the high-CV group had TIR and TBR within the guideline-recommended control target values except for TAR (26.50 (17.00,44.02)), which suggests that abnormal glucose fluctuations may be more due to the occurrence of hyperglycemic events. Details are reported in Table 2.
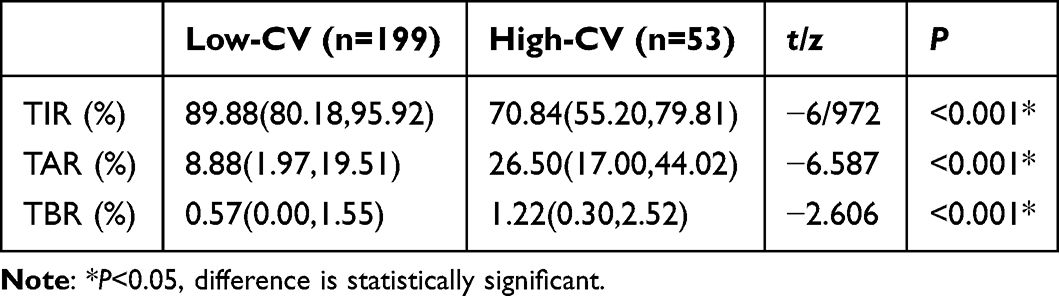 |
Table 2 Comparison of CGM-Derived Metrics Between Patients with Low and High Coefficient of Variation (CV) |
Linear Regression Analysis of CGM Parameters
Patient baseline information was adjusted as a covariate, and CV, TIR, TAR, and TBR in the CGM parameters were used as outcome variables. Linear regression analyses were performed for the variables that were statistically significant in the univariate analyses in Table 1. The linear regression results showed that C-peptide level was significantly negatively correlated with CV (β=−0.02, 95% CI: −0.03~-0.01, P=0.003), and TG level was significantly negatively correlated with TBR (β=−0.001, 95% CI: −0.99~-0.001, P=0.016), suggesting that islet β-cell dysfunction may directly lead to increased glucose fluctuations. Results are shown in Table 3.
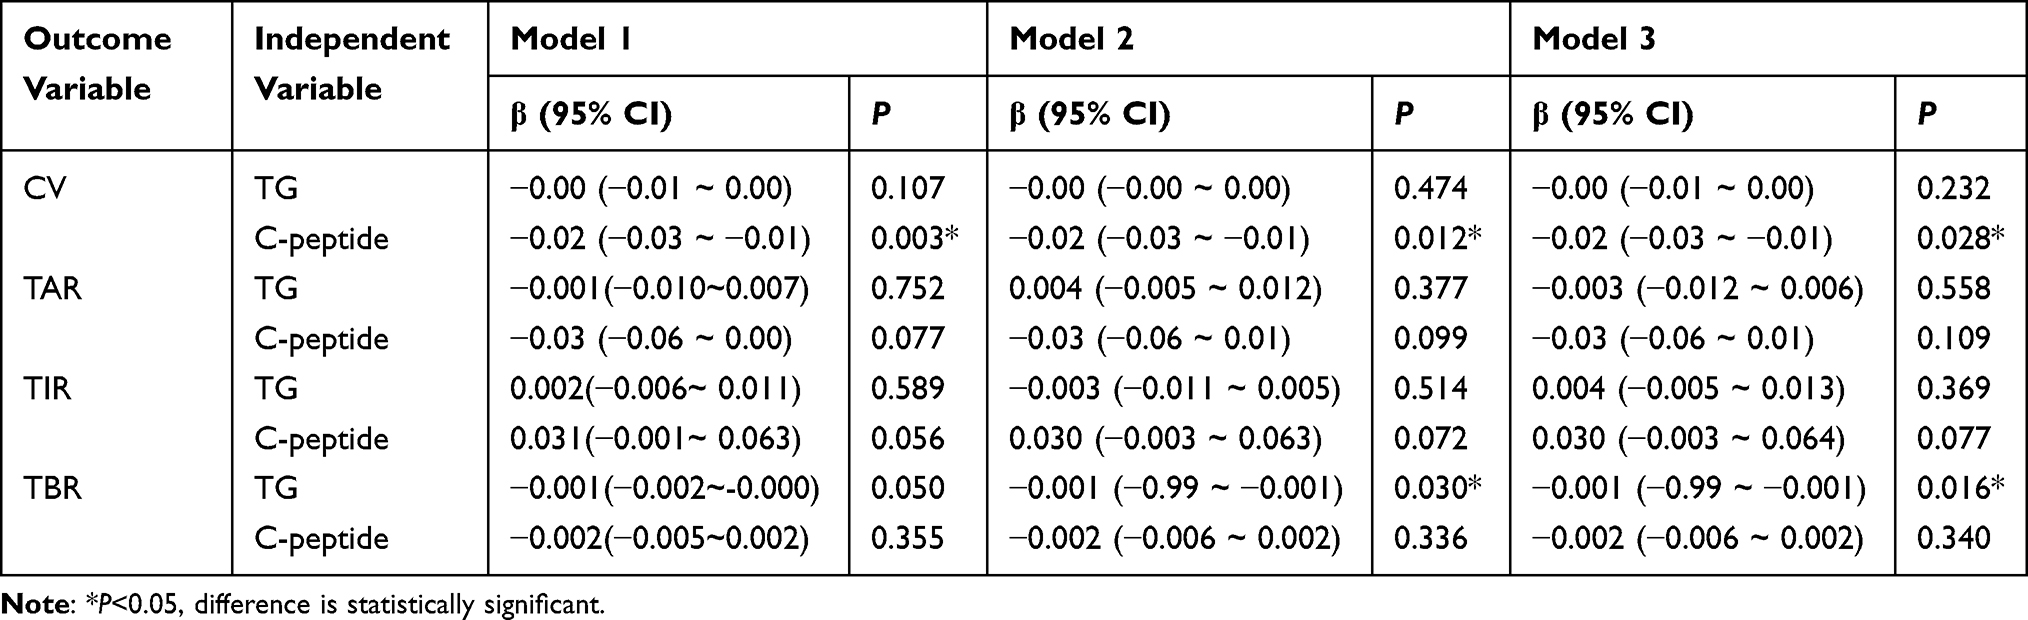 |
Table 3 Linear Regression Analysis of Factors Associated with Glucose Variability Metrics |
Nonlinear Correlation Analysis
To further explore whether there was a nonlinear relationship between significant laboratory values and glycemic variability, we used restricted cubic spline for nonlinear relationship exploration. The results showed that TG and CV showed a nonlinear positive correlation, with the slope of the curve gradually increasing as TG levels increased. C-peptide showed an inverted U-shaped relationship with CV, with the lowest CV values at intermediate C-peptide levels and elevated CV at low (β-cell failure) or high (insulin resistance) levels. After adjusting for all baseline variables, the threshold effect of C-peptide versus CV was significant, with CV rising sharply when C-peptide was below the threshold, suggesting that β-cell dysfunction is an important driver of glycemic fluctuations (Figure 1).
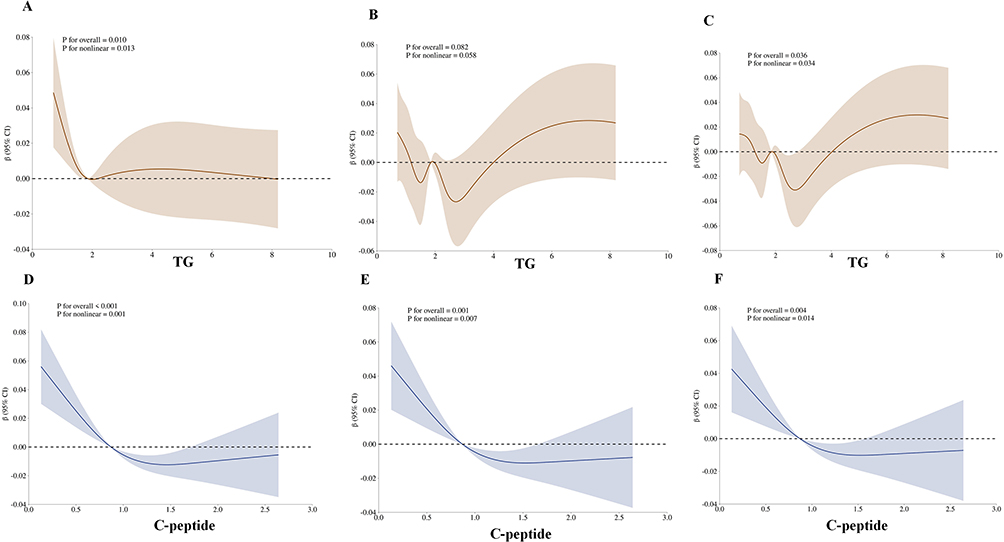 |
Figure 1 Nonlinear associations between TG/C-peptide levels and coefficient of variation (CV) abnormality risk in patients with type 2 diabetes. The x-axis represents the normalized levels of the TG/C-peptide ratio. The y-axis represents the hazard ratio (HR) for the association between TG/C-peptide ratio levels and CV abnormality risk. The dashed line at HR = 1 indicates no effect of TG/C-peptide ratio levels on CV abnormality risk. An HR > 1 indicates that higher TG/C-peptide ratio levels are associated with increased CV abnormality risk. An HR < 1 indicates that lower TG/C-peptide ratio levels are associated with reduced CV abnormality risk. The shaded areas represent the 95% confidence intervals (CI). (A) Univariate nonlinear analysis of TG ratio and CV abnormality risk. (B) Nonlinear analysis of TG ratio and CV abnormality risk adjusted for covariates (BMI, disease duration). (C) Nonlinear analysis of TG ratio and CV abnormality risk adjusted for all baseline covariates. (D) Univariate nonlinear analysis of C-peptide and CV abnormality risk. (E) Nonlinear analysis of C-peptide and CV abnormality risk adjusted for covariates (BMI, disease duration). (F) Nonlinear analysis of C-peptide and CV abnormality risk adjusted for all baseline covariates. |
Multivariate Logistic Regression Analysis of Factors Associated with High CV
Variables with statistically significant differences in the univariate analysis in Table 1 were included in the multivariate logistic regression model. Ultimately, low BMI, low C-peptide, and long duration of disease were found to be independently associated with higher odds of abnormal glucose fluctuation in diabetic patients (P<0.05). Details are shown in Table 4.
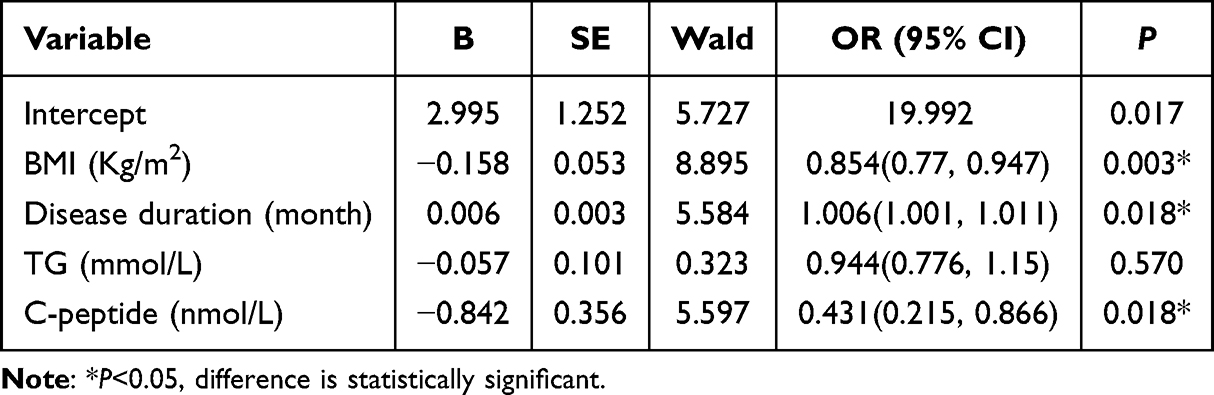 |
Table 4 Multivariate Logistic Regression Analysis of Factors Associated with High Coefficient of Variation (CV) in Patients with Type 2 Diabetes |
Threshold Effects Between Glucose Fluctuations and C-Peptide
There was a threshold effect for the association between C-peptide and CV (P=0.007). Overall, the association between C-peptide and CV was negative [β (95% CI): −0.02 (−0.03 - −0.00)]. When C-peptide was lower than 0.913 nmol/L, C-peptide and CV were negatively associated [β (95% CI): −0.07 (−0.12 - −0.01)], and no association was observed when C-peptide was higher than 0.913 nmol/L. Details are shown in Table 5 and Figure 2.
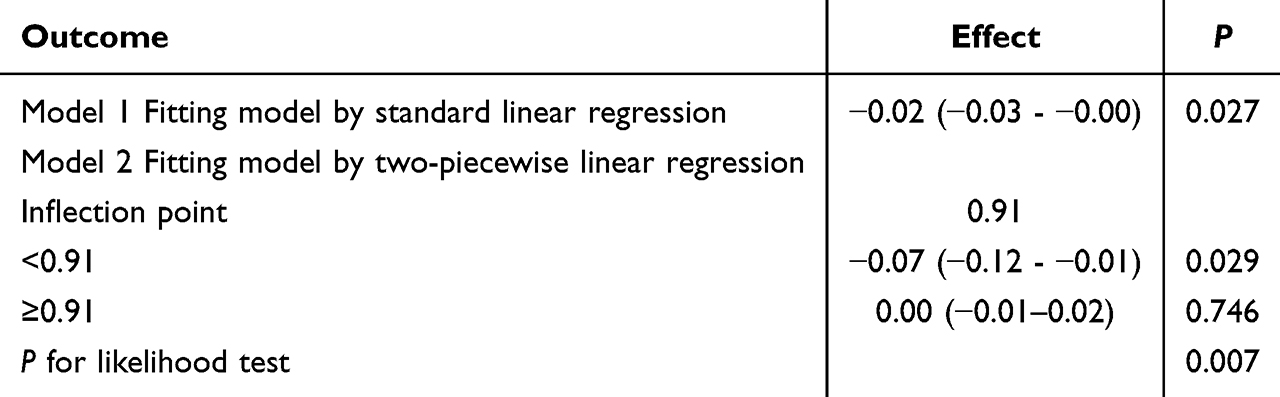 |
Table 5 Threshold Effect Analysis of C-Peptide and Coefficient of Variation (CV) in Patients with Type 2 Diabetes |
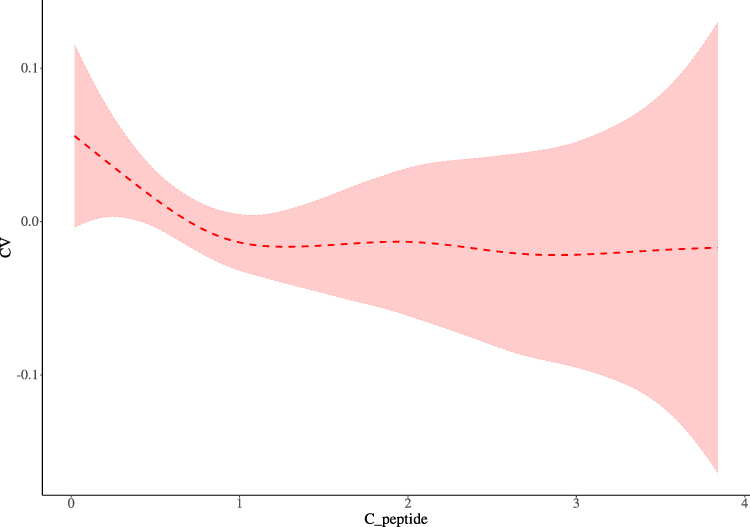 |
Figure 2 Threshold effect of C-peptide on coefficient of variation (CV) of glucose in patients with type 2 diabetes. The figure shows the smoothed curve of the relationship between C-peptide levels and CV of glucose, demonstrating a threshold effect at C-peptide level of 0.913 nmol/L. |
Discussion
This study investigated factors associated with glycemic variability in patients with type 2 diabetes mellitus (T2DM) using continuous glucose monitoring (CGM). We identified lower BMI, reduced C-peptide levels, and longer disease duration as factors independently associated with higher odds of abnormal glycemic variability. Moreover, we detected a threshold effect in the relationship between C-peptide and glycemic coefficient of variation (CV), with a cut-off value of 0.913 nmol/L, below which the association between declining C-peptide and increasing glycemic instability was particularly pronounced.
Our study shows that the TIR in the high-CV group was 70.84%, which was significantly lower than the 89.88% in the low-CV group (Table 2). One study found that for every 10% decrease in TIR, the risk of microvascular complications increased by 40%.17 Therefore, it is clinically important to include TIR in the glycemic management goal (recommended >70%). Although the TIR of the high-CV group in this study was still close to the guideline-recommended target of ≥70%, the significant increase in their TAR (26.50%) suggested that hyperglycemic events were the main driver of abnormal glycemic fluctuations. This result is consistent with the study by Saisho et al18 that acute glycemic fluctuations increase the risk of vascular injury through oxidative stress and inflammatory response independently of HbA1c.
The results of the study indicated that disease duration, body mass index (BMI), triglycerides (TG) and C-peptide may be important factors associated with glucose fluctuation (P<0.05). In this study, we found that patients with abnormal glucose fluctuations usually had lower C-peptide values, longer disease duration, and lower BMI. C-peptide levels showed a significant negative correlation with the coefficient of variation (CV) of glucose (β=−0.02, P=0.003), suggesting that pancreatic β-cell dysfunction may directly exacerbate glucose fluctuations through insufficient insulin secretion. This result is consistent with the study of Zhang et al,19 which pointed out that decreased C-peptide levels lead to decreased glucose homeostatic regulation, thus increasing the risk of short-term glucose fluctuations.
C-peptide is mainly used as an indicator for detecting and observing the secretory function of pancreatic islet cells, and C-peptide levels can be measured to evaluate one’s own pancreatic islet β-cell function.18 In T2DM patients, prolonged hyperglycemia further exacerbates insulin resistance, leading to depletion of pancreatic β-cells and decreasing their responsiveness to glucose. Notably, the nonlinear relationship between C-peptide and CV (inverted U-shape) suggests that intermediate C-peptide levels (0.6–1.2 nmol/L) correspond to optimal glucose variability control, whereas low C-peptide (β-cell depletion) may elevate glycemic variability through insufficient insulin secretion.
In addition, patients with longer disease duration have more complications and their pancreatic β-cell function gradually declines, which may partly contribute to abnormal glucose fluctuations. The increased glycemic variability observed in patients with longer disease duration likely involves multiple pathophysiological mechanisms. Chronic hyperglycemia induces glucotoxicity, which further impairs β-cell function through oxidative stress, endoplasmic reticulum stress, and inflammatory pathways.20 Additionally, long-standing diabetes is associated with progressive autonomic neuropathy, which compromises counter-regulatory hormone responses to glycemic excursions.21 These combined mechanisms create a vicious cycle wherein glycemic instability further deteriorates β-cell function and blunts homeostatic responses.22
The relationship between BMI and glucose fluctuations observed in this study showed that low BMI was associated with higher odds of abnormal glucose fluctuations. Funakoshi et al23 found that BMI was positively correlated with β-cell function in patients with T2DM, and that the effect of BMI on β-cell secretory function was more prominent in diabetic populations with a shorter duration of disease. Another study found24 that subjects with higher BMI had higher C-peptide and that C-peptide was significantly negatively correlated with T2DM disease duration. However, the significant difference in serum C-peptide between physically lean and obese subjects disappeared in subjects with a disease duration of more than 10 years. The patients included in this study had relatively shorter disease duration, and the subjects with higher BMI had more endogenous insulin secretion, so their glucose was relatively smoother. This may explain the lower BMI in T2DM patients with higher CV.
It should be noted that during the hospitalization period, all patients received a multiple daily injection (MDI) insulin regimen as part of a standardized glycemic control protocol. Therefore, the analysis of antidiabetic therapy types was not feasible in this study, as there was no variability in treatment during the CGM monitoring period.
However, several limitations warrant consideration. First, the cross-sectional design precludes establishment of causal relationships between identified factors and glycemic variability. Longitudinal studies are needed to elucidate temporal relationships and determine whether interventions targeting these factors improve glycemic stability. Secondly, our study assessed fasting C-peptide only, which may not fully capture dynamic β-cell responsiveness to glucose challenges. Future studies incorporating measures such as glucagon stimulation testing or mixed meal tolerance tests may provide additional insights into the relationship between β-cell function and glycemic variability. Third, the lack of analysis of antidiabetic medications due to standardized inpatient treatment represents a limitation that should be addressed in future studies with more diverse treatment regimens.
In summary, our findings underscore the value of CGM in capturing glucose fluctuations that are not reflected by conventional HbA1c or fasting glucose measurements. Patients with longer disease duration, lower BMI, and poorer pancreatic function have higher odds of significant glucose fluctuations. Enhanced monitoring of glucose fluctuations and education on potential risks are recommended for these subgroups to improve self-management abilities. Our findings emphasize the importance of recognizing glycemic variability as a distinct aspect of diabetes management and implementing targeted interventions based on individual risk profiles.
Ethical Approval
The study was granted ethical approval by the Medical Ethics Committee of Dongguan First Hospital Affiliated to Guangdong Medical University. The study was carried out in accordance with the ethical standards of the responsible committee on human experimentation and with the 1975 Helsinki Declaration and its later amendments. All methods were performed in accordance with the relevant guidelines and regulations. The requirement for consent was waived by the ethics committee. All patient data were handled confidentially and in accordance with the ethical standards of the committee and the Helsinki Declaration.
Author Contributions
All authors made a significant contribution to the work reported, whether that is in the conception, study design, execution, acquisition of data, analysis and interpretation, or in all these areas; took part in drafting, revising or critically reviewing the article; gave final approval of the version to be published; have agreed on the journal to which the article has been submitted; and agree to be accountable for all aspects of the work.
Funding
This study is funded by 2023 Dongguan Social Development Science and Technology Program (Key Projects) (20231800936252), Guangdong Medical University-Southern Medical University Twinning Research Team Project (4SG23035G) and Songshan Lake Medical-Industrial Integration Innovation Center Project(4SG22301P).
Disclosure
The authors declare that there is no conflicts of interest in this work.
References
1. American Diabetes Association. Standards of medical care in diabetes-2025. Diabetes Care. 2025;48(1 Suppl 1):S59–S85. doi:10.2337/dc25-S004
2. Kusunoki Y, Konishi K, Tsunoda T, Koyama H. Significance of glycemic variability in diabetes mellitus. Intern Med. 2022;61(3):281–290. doi:10.2169/internalmedicine.8424-21
3. Jiang W, Xiao Q, Shen J, et al. Current clinical application of information-integrated in-hospital glucose management model. Chin J Diabet. 2016;24(12):1123–1125.
4. Belli M, Bellia A, Sergi D, Barone L, Lauro D, Barillà F. Glucose variability: a new risk factor for cardiovascular disease. Acta Diabetol. 2023;60(10):1291–1299. doi:10.1007/s00592-023-02097-w
5. Wang D, He C, Zou S, et al. Glycemic variability and its association with short and long term clinical outcomes in critically ill patients with cerebral hemorrhage. Sci Rep. 2025;15(1):7820. doi:10.1038/s41598-025-92415-9
6. Monnier L, Mas E, Ginet C, et al. Activation of oxidative stress by acute glucose fluctuations compared with sustained chronic hyperglycemia in patients with type 2 diabetes. JAMA. 2006;295(14):1681–1687. doi:10.1001/jama.295.14.1681
7. Alexander CM. The coming of age of the metabolic syndrome. Diabetes Care. 2003;26(11):3180–3181. doi:10.2337/diacare.26.11.3180
8. Coletti M, Goldstein M. Response to “Evolution, revolution, or obsolescence: an examination of writings on the future of health sciences libraries”. J Med Libr Assoc. 2012;100(3):156. doi:10.3163/1536-5050.100.3.002
9. Martirani-Von Abercron SM, Marín P, Solsona-Ferraz M, Castañeda-Cataña MA, Marqués S. Naphthalene biodegradation under oxygen-limiting conditions: community dynamics and the relevance of biofilm-forming capacity. Microb Biotechnol. 2017;10(6):1781–1796. doi:10.1111/1751-7915.12842
10. Koerber HR, McIlwrath SL, Lawson JJ, et al. Cutaneous C-polymodal fibers lacking TRPV1 are sensitized to heat following inflammation, but fail to drive heat hyperalgesia in the absence of TPV1 containing C-heat fibers. Mol Pain. 2010;6:58. doi:10.1186/1744-8069-6-58
11. Zhong F, Sun P, Luo W, Yan T, Wang Y. AD-VAT+: an asymmetric dueling mechanism for learning and understanding visual active tracking. IEEE Trans Pattern Anal Mach Intell. 2021;43(5):1467–1482. doi:10.1109/TPAMI.2019.2952590
12. Taylor AJ, Kim JH, Singh V, Halfen EJ, Pfeuffer J, Ress D. More than BOLD: dual-spin populations create functional contrast. Magn Reson Med. 2020;83(2):681–694. doi:10.1002/mrm.27941
13. Urakami T, Terada H, Tanabe S, et al. Clinical significance of coefficient of variation in continuous glucose monitoring for glycemic management in children and adolescents with type 1 diabetes. J Diabetes Investig. 2024;15(11):1669–1674. doi:10.1111/jdi.14303
14. Diabetes Mellitus Branch of Chinese Medical Association. Guidelines for clinical application of blood glucose monitoring in China (2021 edition). Chin Diabet J. 2021.
15. Battelino T, Danne T, Bergenstal RM, et al. Clinical targets for continuous glucose monitoring data interpretation: recommendations from the international consensus on time in range. Diabetes Care. 2019;42(8):1593–1603.
16. Chinese Medical Association Diabetes Branch. Guidelines for the prevention and treatment of type 2 diabetes mellitus in China (2020 edition). Chin J Endocrinol Metab. 2021;13(4):315–409.
17. Beck RW, Bergenstal RM, Cheng P, et al. The relationships between time in range, hyperglycemia metrics, and HbA1c. J Diabetes Sci Technol. 2019;13(4):614–626. doi:10.1177/1932296818822496
18. Saisho Y. Postprandial C-peptide to glucose ratio as a marker of β cell function: implication for the management of type 2 diabetes. Int J Mol Sci. 2016;17(5):744. doi:10.3390/ijms17050744
19. Zhang L, Guo K, Tian Q, et al. The continuous spectrum of glycaemic variability changes with pancreatic islet function: a multicentre cross-sectional study in China. Diabetes Metab Res Rev. 2022;38:e3579.
20. Ding J, Liang Z. Research progress on the effect of glucose toxicity on pancreatic β-cell function. Shenzhen J Integr Chin West Med. 2015;25(17):197–199.
21. Wei R, Cui X, Feng J, et al. Dapagliflozin promotes beta cell regeneration by inducing pancreatic endocrine cell phenotype conversion in type 2 diabetic mice. Metabolism. 2020;111:154324. doi:10.1016/j.metabol.2020.154324
22. Hou ZQ. Chronic Stress and Fluctuating High Glucose-Induced Glucose Toxicity in Rat Pancreatic Islets and INS-1 Cells. Shandong University; 2008.
23. Funakoshi S, Fujimoto S, Hamasaki A, et al. Analysis of factors influencing pancreatic beta-cell function in Japanese patients with type 2 diabetes: association with body mass index and duration of diabetic exposure. Diabetes Res Clin Pract. 2008;82:353–358. doi:10.1016/j.diabres.2008.09.010
24. Saisho Y, Tanaka K, Abe T, et al. Effect of obesity on declining beta cell function after diagnosis of type 2 diabetes: a possible link suggested by cross-sectional analysis. Endocr J. 2012;59:187–195. doi:10.1507/endocrj.EJ11-0206
 © 2025 The Author(s). This work is published and licensed by Dove Medical Press Limited. The
full terms of this license are available at https://www.dovepress.com/terms
and incorporate the Creative Commons Attribution
- Non Commercial (unported, 4.0) License.
By accessing the work you hereby accept the Terms. Non-commercial uses of the work are permitted
without any further permission from Dove Medical Press Limited, provided the work is properly
attributed. For permission for commercial use of this work, please see paragraphs 4.2 and 5 of our Terms.
© 2025 The Author(s). This work is published and licensed by Dove Medical Press Limited. The
full terms of this license are available at https://www.dovepress.com/terms
and incorporate the Creative Commons Attribution
- Non Commercial (unported, 4.0) License.
By accessing the work you hereby accept the Terms. Non-commercial uses of the work are permitted
without any further permission from Dove Medical Press Limited, provided the work is properly
attributed. For permission for commercial use of this work, please see paragraphs 4.2 and 5 of our Terms.
Recommended articles
Correlation Between Mean Amplitude of Glycemic Excursion and Bone Turnover Markers in Patients with Type 2 Diabetes: A Cross-Sectional Study
Yang J, Zheng C, Wang Y, Yang L, Liu L
Diabetes, Metabolic Syndrome and Obesity 2023, 16:397-407
Published Date: 10 February 2023
Postprandial Glycemic Impact of Meal Timing and Staple Type in Outpatients with Dysglycemia: A Pilot Study Under a Streamlined and Real-World Framework
Wang S, Song S, Gao J, Wu W, Fu Y, Yuan T, Zhao W
International Journal of General Medicine 2026, 19:591057
Published Date: 26 February 2026