Back to Journals » Diabetes, Metabolic Syndrome and Obesity » Volume 16
Association of Bone Turnover Markers with Type 2 Diabetes Mellitus and Microvascular Complications: A Matched Case-Control Study
Authors Hou Y ![]() , Hou X, Nie Q
, Hou X, Nie Q ![]() , Xia Q, Hu R, Yang X, Song G, Ren L
, Xia Q, Hu R, Yang X, Song G, Ren L
Received 6 December 2022
Accepted for publication 12 April 2023
Published 26 April 2023 Volume 2023:16 Pages 1177—1192
DOI https://doi.org/10.2147/DMSO.S400285
Checked for plagiarism Yes
Review by Single anonymous peer review
Peer reviewer comments 5
Editor who approved publication: Professor Gian Paolo Fadini
Yilin Hou,1,2 Xiaoyu Hou,1,2 Qian Nie,3 Qiuyang Xia,1,2 Rui Hu,1,2 Xiaoyue Yang,1,2 Guangyao Song,2,4 Luping Ren2,4
1Graduate School, Hebei Medical University, Shijiazhuang, Hebei, 050017, People’s Republic of China; 2Department of Endocrinology, Hebei General Hospital, Shijiazhuang, Hebei, 050051, People’s Republic of China; 3Health Examination Center, Hebei General Hospital, Shijiazhuang, Hebei, 050051, People’s Republic of China; 4Department of Internal Medicine, Hebei Medical University, Shijiazhuang, Hebei, 050017, People’s Republic of China
Correspondence: Guangyao Song; Luping Ren, Department of Endocrinology, Hebei General Hospital, Shijiazhuang, Hebei, 050051, People’s Republic of China, Email [email protected]; [email protected]
Purpose: The aim of this study was to evaluate the association of bone turnover markers (BTMs) with type 2 diabetes mellitus (T2DM) and microvascular complications.
Methods: A total of 166 T2DM patients and 166 non-diabetic controls matched by gender and age were enrolled. T2DM patients were sub-classified into groups based on whether they had diabetic peripheral neuropathy (DPN), diabetic retinopathy (DR), and diabetic kidney disease (DKD). Clinical data including demographic characteristics and blood test results [serum levels of osteocalcin (OC), N-terminal propeptide of type 1 procollagen (P1NP), and β-crosslaps (β-CTX)] were collected. Logistic regression and restrictive cubic spline curves were performed to examine the association of BTMs with the risk of T2DM and microvascular complications.
Results: After adjusting for family history of diabetes, sex and age, an inverse association was observed between elevated serum OC levels [O, p < 0.001] and increased serum P1NP levels , p < 0.001] with the risk of T2DM. Moreover, there was an inverse linear association of serum OC and P1NP levels with the risk of T2DM. However, β-CTX was not associated with T2DM. Further analysis showed a nonlinear association between OC and the risk of DR, while P1NP and β-CTX were not correlated with DR. Serum concentrations of BTMs were not associated with the risks of DPN and DKD.
Conclusion: Serum OC and P1NP levels were negatively correlated with T2DM risk. Particularly, serum OC levels were associated with DR risk. Given that BTMs are widely used as markers of bone remodeling, the present finding provides a new perspective for estimating the risk of diabetic microvascular complications.
Keywords: bone turnover markers, type 2 diabetes mellitus, microvascular complications
Introduction
Diabetes mellitus affects approximately 10.5% of the adult population worldwide and presents a considerable danger to human health.1 Type 2 diabetes mellitus (T2DM) accounts for more than 90% of all cases of diabetes.2 Diabetic vasculopathy affects the microvasculature and macrovasculature of the body. Macrovascular complications include cardiovascular, cerebrovascular, and peripheral vascular disease whereas microvascular complications (MVCs) refer to specific chronic diabetic conditions characterized by multiorgan microvascular dysfunction, including diabetic peripheral neuropathy (DPN), retinopathy (DR), and kidney disease (DKD).3 The progression of MVCs is subtle and most patients are diagnosed when the disease is at an advanced stage when they cannot respond satisfactorily to current treatments. This increases the overall mortality of patients.4 In a global multicenter study (DISCOVER, 2014–2016), it was reported that approximately 18.8% of T2DM patients had at least one type of MVCs. For instance, 7.7% had DPN, 5.0% had DR, and 3.9% had DKD.5 During follow-up for three years, the prevalence of MVCs increased to 31.5%.6 Multiple factors, including hyperglycemia, lipid metabolism disorders, and genetic susceptibility, increase the incidence of MVCs among T2DM patients.7
T2DM can also impair the skeletal system. For example, it can lead to diabetic osteoporosis which is characterized by bone fragility and increased fracture risk. Although the bone density of T2DM patients is comparable to or higher than that of non-diabetic individuals, they have a higher risk of bone fracture.8,9 Bone microvascular homeostasis plays an important role in the regulation of bone health.10 Diabetic osteoporosis is considered to be a type of MVCs.11 Osteoblasts form new bones whereas osteoclasts resorb old bones to maintain bone structure integrity. The metabolites produced during this process are known as bone turnover markers (BTMs). These markers indicate changes in bone metabolism that occur over a short period. The commonly assessed bone formation markers include N-terminal propeptide of type 1 procollagen (P1NP) and osteocalcin (OC), and bone resorption markers, including β-crosslaps (β-CTX). During type 1 collagen secretion, osteoblasts release P1NP into circulation, which is has been found to be a sensitive marker of bone formation.12 The OC secreted by osteoblasts is involved in various physiological processes, including bone metabolism, energy metabolism, reproduction, and cognition among others.13 During the degradation of type 1 collagen, osteoclasts release β-CTX, which can serve as an indicator of bone resorption.12
It has been reported that serum levels of BTMs in individuals with T2DM are significantly lower compared to those without diabetes. This suggests that progressive hyperglycemia influences bone metabolism. T2DM patients with MVCs have also been shown to have lower serum levels of OC, P1NP, and β-CTX compared with those without.14 Serum BTMs may predict the risk of cardiovascular disease and mortality.15–17 Serum level of OC was reported to be highly associated with T2DM risk, and OC was confirmed to be an independent factor for macrovascular complications in T2DM patients.18,19 However, few comprehensive analyses have been performed to clarify the association of BTMs and MVCs with T2DM patients in China. BTMs are hypothesized to be potential biochemical indicators of hyperglycemia and microcirculatory dysfunction. Therefore, we compared serum levels of BTMs between T2DM and non-diabetic individuals, and between T2DM patients with and without MVCs. The association of serum levels of BTMs with the risk of T2DM or MVCs was further investigated.
Methods
Study Design and Participants
This was a cross-sectional, case-control study conducted at Hebei General Hospital from April 2021 to September 2021. A total of 588 participants with complete clinical information including diabetes screening and blood test of BTMs were recruited at the Health Examination Center. Diabetic complications were screened was conducted at the Department of Endocrinology among patients with diabetes. After removing 142 individuals who met the exclusion criteria, 166 T2DM patients matched with 166 non-diabetic subjects by sex and age (±5 years) were included in this study. Four T2DM patients and 110 non-diabetic individuals were not matched. The flow chart of the study is shown in Figure 1. All the participants self-identified as Han Chinese and were from Hebei province, China. The age of participants was in the range of 30~75 years. The 2020 World Health Organization guideline was used for T2DM diagnosis as follows: fasting plasma glucose (FPG) ≥ 7.0 mmol/L, 2-hour post-load plasma glucose ≥ 11.1 mmol/L, random plasma glucose ≥ 11.1 mmol/L, and (or) HbA1c ≥ 6.5%.3 The definition of MVCs was based on the 2020 edition of the guidelines for the prevention and control of T2DM in China.20 DPN was defined as the occurrence of neuropathy in diabetic patients with clinical symptoms and (or) signs such as distal symmetrical limb paresthesia, numbness, pain, and (or) pressure sense, acupuncture sense, vibration sense, temperature sense, and ankle reflex abnormalities. If the patients were asymptomatic, a neurophysiological examination was performed to exclude other neuropathies. DKD was defined as persistent proteinuria and (or) progressive renal insufficiency. In patients without other chronic kidney diseases, those with urinary albumin/creatinine ratio ≥ 30 mg/g and (or) estimated glomerular filtration rate (eGFR) ≤ 60 mL·min−1(1.73m2)−1 twice after three tests in 3~6 months were considered to have developed DKD. Fundus examination was performed by ophthalmologists in our hospital to diagnose DR. The exclusion criteria for patient enrollment were: i. Severe heart, liver, and kidney diseases (except for DKD) in the recent 6 months; ii. Acute infections and acute complications of diabetes (diabetic ketoacidosis, hyperosmolar coma, hypoglycemia) in the past 6 months; iii. Thyroid dysfunctions, parathyroid dysfunctions, Cushing syndrome, osteoarticular inflammation, osteoporosis, or bone fracture in the recent 6 months; iv. Use of drugs that affect bone metabolism, including anti-osteoporosis drugs (calcium, vitamin D, bisphosphonate, estrogen, or other drugs), steroid hormones, thyroid hormones, and anti-diabetic agents (pioglitazone, SGLT-2 inhibitors, and GLP-1 analogues) in the recent 6 months; v. Cancer; vi. Pregnancy and lactation.
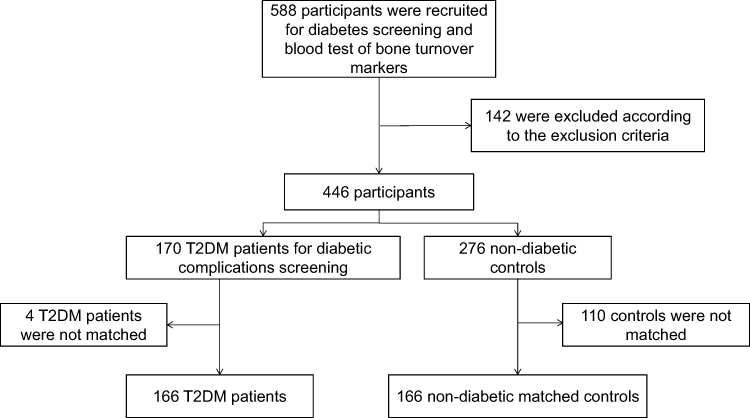 |
Figure 1 Flow chart of the study. |
Data Collection and Detection Methods
The medical history of the participants was obtained from the electronic medical records system. The following information was collected: age, sex, self-reported family history of diabetes, diabetic duration, use of anti-diabetes drugs, physical examination, and blood test results. The age was classified into < 60 and ≥ 60 years. Physical examinations were performed by experienced clinical doctors who calculated the weights and heights of the participants. The body mass index (BMI) was calculated as  . BMI was stratified into < 24 kg/m2 and ≥ 24 kg/m2. After fasting for 8 h, fasting venous blood samples were collected and placed in a coagulation pro-coagulation. All samples were stored at −80 °C for subsequent analyses. FPG levels were determined using an automatic biochemical analyzer. The CKD-EPI equation was used to calculate eGFR.21 The levels of OC, P1NP, β-CTX, 25 hydroxy-vitamin D [25(OH)D], parathyroid (PTH), fasting insulin (FINS), and glycated hemoglobin A1c (HbA1c) were assayed via electrochemiluminescence assays. The homeostasis model assessment of insulin resistance (HOMA-IR) was calculated based on the following formula:
  .22
.22
Statistical Analysis
Statistical analyses were conducted using the software programs SPSS 25.0 and R 4.1.1. Normal and non-normal distribution continuous variables were presented as mean ± standardized deviation (SD) and median [interquartile range (IQR)], respectively. Categorical variables were presented as numbers and percentages. The normally distributed data were analyzed using the independent sample t-test, the non-normally distributed data were analyzed using the Mann–Whitney U-test, whereas count data were analyzed using the χ2 test. Spearman’s rank correlation coefficient was determined to explore the association between BTMs and continuous covariates. Serum BTMs levels were regarded as independent variables, whereas T2DM or MVCs were considered as dependent variables. The odds ratios (OR) and 95% confidence interval (95% CI) were estimated by logistic regression. The first quartile of BTMs was used as a reference in logistic regression. The risks of T2DM were evaluated by a crude model and a multivariable model adjusted for age and family history of diabetes. The risks of T2DM were further explored by subgroup analysis based on age and family history of diabetes. The risks of DR, DPN, and DKD were also estimated by an unadjusted model and a model adjusted for the duration of diabetes and usage of anti-diabetes drugs. After adjusting for diabetic duration, the risks of DR, DPN, and DKD were further investigated by logistic regression models stratified by the usage of anti-diabetes drugs. The association of BTMs with the risk of T2DM or MVC was further evaluated on a continuous scale with restrictive cubic spline (RCS) curves with 3 knots. After reciprocal transformation of the OC (1/OC), a receiver-operating characteristic (ROC) curve was plotted and area under ROC curve (AUC) was calculated to estimate the predictive value of OC for DR. Optimal cutoff points were determined using the Youden index. p < 0.05 (two-sided) was set as the threshold for statistical significance.
Results
Clinical Parameters for All Participants
The characteristics of participants are presented in Table 1. The average age of the 166 non-diabetic controls was 54.87±8.55 years old, while that for the 166 T2DM patients was 54.96±9.97 years old. Among the study participants, 34.3% were female and 65.7% were male. The median duration of diabetes was eight years. Notably, 74.1% of the T2DM patients received anti-diabetes drug therapy. The levels of HbA1c and HOMA-IR were 9.54±2.14% and 2.83(1.21,5.08), respectively. Compared to the controls, the T2DM patients had higher proportions of family history of diabetes, as well as elevated levels of BMI, eGFR, FPG, and PTH. 25(OH)D levels were not statistically different between the groups. Further analysis of serum levels of BTMs revealed that the concentration of OC [12.32(9.19,15.37) vs 15.01(11.12,19.90), p < 0.001] and P1NP [34.13(26.92,45.80) vs 46.19(33.65,62.40), p < 0.001] were lower in the T2DM patients relative to the levels in non-diabetic controls. However, β-CTX levels were not significantly different between the groups.
 |
Table 1 The Characteristics of the Participants |
Comparison of Serum BTMs Concentrations According to Clinical Traits
Table 2 shows serum BTMs levels stratified by sex, family history of diabetes, age, and BMI. Males had lower levels of P1NP [37.69(28.37,50.15) vs 43.07(29.06,59.86), p = 0.045] compared with females. Participants with a diabetic family history had lower levels of P1NP [37.33(25.40,47.64) vs 40.48(29.33,56.42), p = 0.036] compared with individuals without a family history. Compared with older individuals (≥ 60 years), younger participants (< 60 years) had lower levels of OC [12.81(9.90,16.92) vs 14.89(11.05,19.72), p = 0.009] and P1NP [37.83(27.56,50.69) vs 44.14(31.63,60.26), p = 0.011]. There was no significant difference in serum levels of β-CTX between the different age groups and family history of diabetes Serum BTMs concentrations were not significantly different between the BMI groups.
 |
Table 2 Comparisons of BTMs According to Clinical Traits |
Independent Effects of Serum BTMs Levels on T2DM Patients
Logistic regression analysis results are presented in Table 3. In the crude model, the OC showed an inverse association with T2DM [Q4 vs Q1:  , p < 0.001; Ptrend < 0.001], and P1NP showed an inverse association with T2DM [Q3 vs Q1:
  , p = 0.013; Q4 vs Q1:
  , p < 0.001; Ptrend < 0.001]. After adjusting for sex, age and family history of diabetes, the two inverse associations remained unaltered [OC: Q4 vs Q1:
  , p < 0.001; Ptrend < 0.001; P1NP: Q3 vs Q1:
  , p = 0.013; Q4 vs Q1:
  , p < 0.001; Ptrend < 0.001]. RCS results are shown in Figure 2. In the multivariable model, RCS showed a linear inverse association between serum OC levels and T2DM (Poverall < 0.001, Pnonlinear = 0.987), and a linear inverse association between serum P1NP levels and T2DM (Poverall < 0.001, Pnonlinear = 0.619). Serum level of β-CTX was not associated with the risk of T2DM.
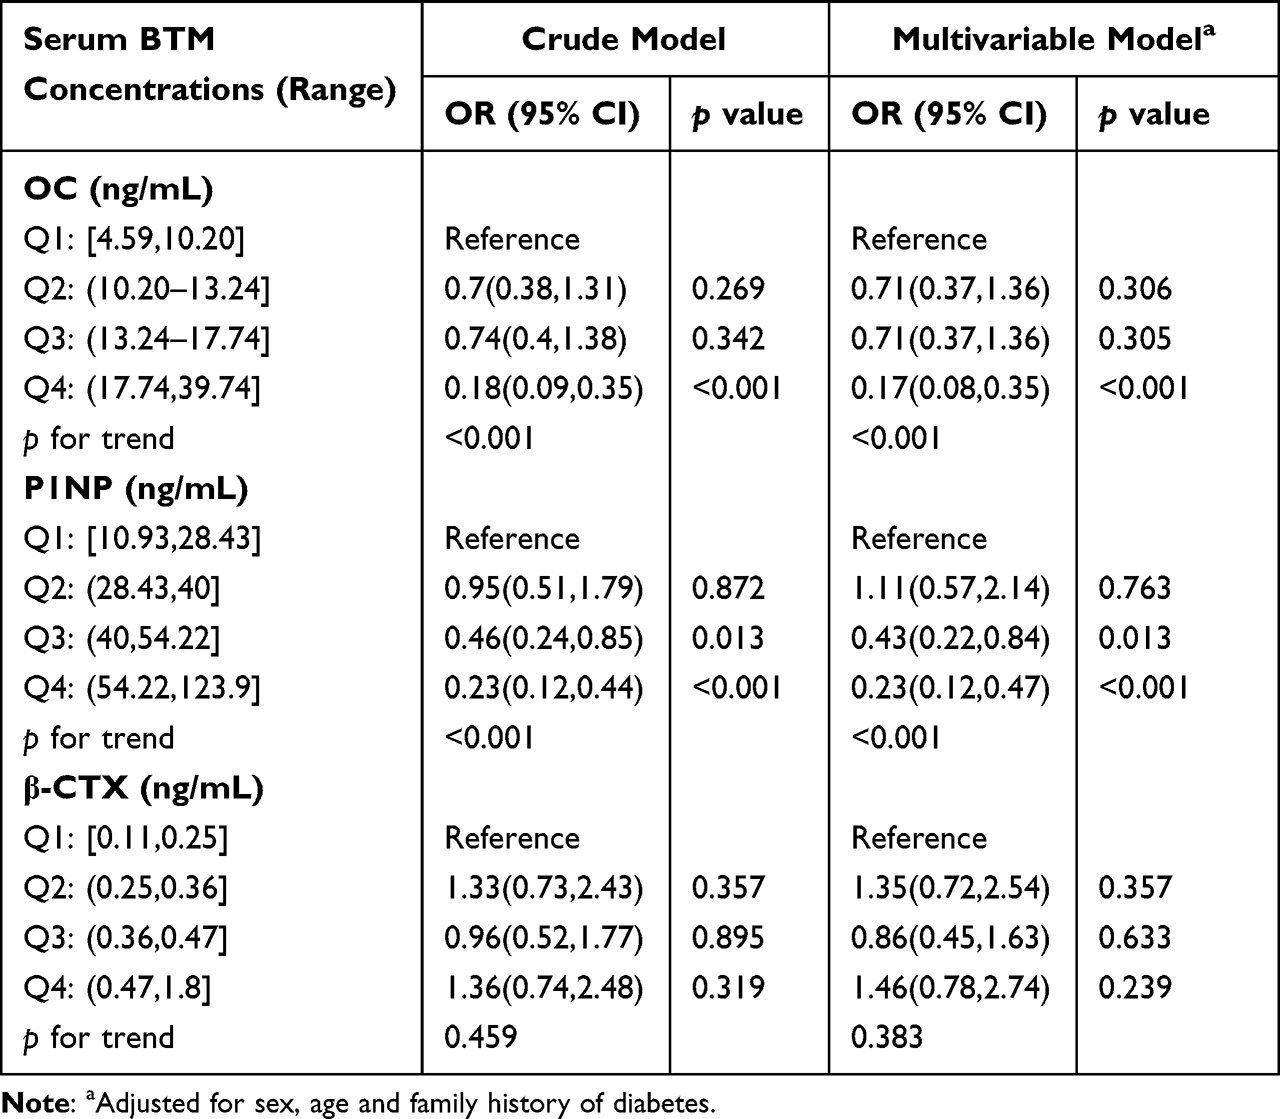 |
Table 3 The Association Between Serum BTMs Levels and T2DM |
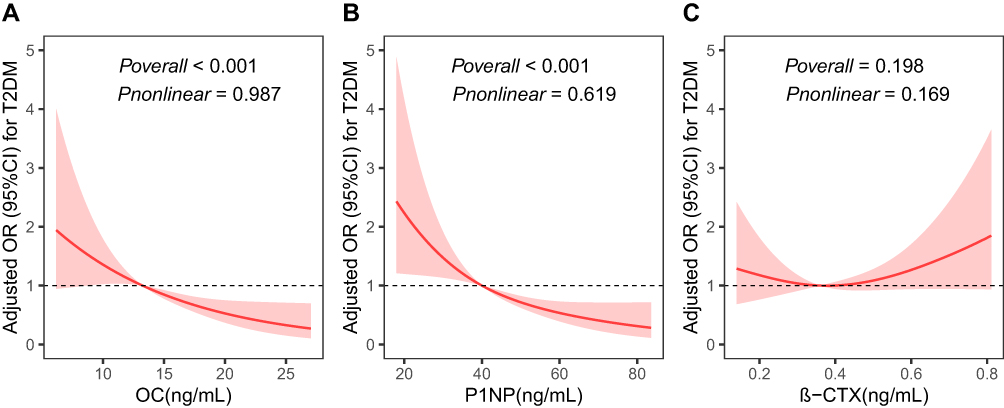 |
Figure 2 Adjusted restricted cubic splines for BTMs and T2DM risk. Notes: Adjusted for family history of diabetes and age. (A) For OC, (B) For P1NP, and (C) For β-CTX. |
Subgroup Analysis of Serum BTMs Effects on T2DM
As shown in Table 4, the effect sizes of P1NP on T2DM risk were significantly different between participants with and without diabetic family history  vs
vs  ; Pinteraction = 0.031], whereas the effect sizes of OC and β-CTX were not different between the groups. The test results for interactions were not significant for sex and age.
 |
Table 4 Subgroup Analysis of Serum BTMs Effects on T2DM |
Comparisons of BTMs Among T2DM Patients According to Diabetic Traits
As shown in Table 5, among 166 T2DM patients, 123 participants who had received anti-diabetic drug therapy had lower levels of β-CTX [0.33(0.24,0.46) vs 0.45(0.34,0.60), p = 0.001] compared with those who did not, whereas P1NP and OC was not significantly different between the two groups. Serum levels of BTMs were comparable between sex, age, BMI, DR, DPN, and DKD groups. As shown in Table 6, β-CTX was inversely associated with T2DM duration, whereas OC and P1NP were not correlated with T2DM duration. Serum BTMs concentrations were not associated with FPG, HbA1c, and HOMA-IR.
 |
Table 5 Comparisons of BTMs Among T2DM Patients According to Clinical Traits |
 |
Table 6 Correlation Between BTMs and Other Parameters in T2DM Patients |
Independent Effects of Serum BTMs Levels on Different Types of MVCs
Table 7 shows the findings from logistic regression analysis of the relationship between BTMs and the risk of MVCs. In the crude model, OC was inversely associated with DR [Q2 vs Q1:  , p = 0.019; Q3 vs Q1:
  , p = 0.034; Q4 vs Q1:
  , p = 0.048; Ptrend = 0.046]. After adjusting for the use of anti-diabetes drugs and duration of diabetes, the inverse association was not significant. RCS showed that the observed association between serum OC levels and DR was non-linear (Poverall = 0.016, Pnonlinear = 0.011) (Figure 3A). The risk estimates markedly increased when serum OC levels were lower than 14.74 ng/mL. P1NP and β-CTX did not exhibit any independent effects on DR in the multivariable model. Moreover, RCS revealed that P1NP and β-CTX did not have any independent effects on DR (Figure 3B and C). Reciprocal transformation of OC concentrations was used in the ROC curve analysis. The predictive values of OC in the presence of DR are shown in Figure 4. OC (AUC = 0.645, p < 0.001) showed significant discriminatory ability in DR. Optimal cut-off points estimated with the Youden index for DR according to OC (sensitivity = 89.2%, specificity = 36.7%, Youden index = 0.259) were 17.84 ng/mL.
 |
Table 7 The Association Between Serum BTM Levels and Different Types of MVCs |
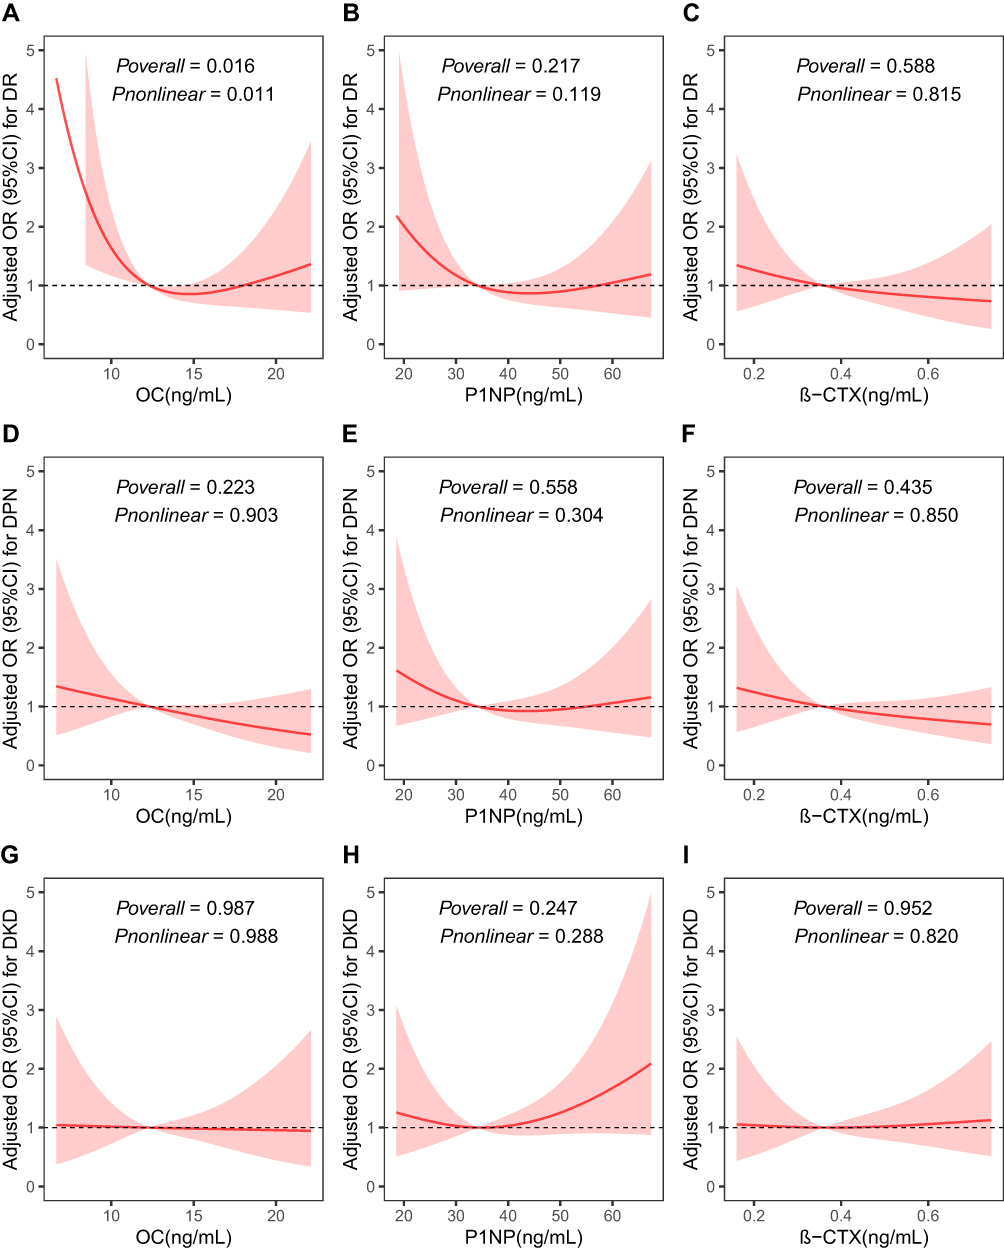 |
Figure 3 Adjusted restricted cubic splines for BTMs and MVCs risk. Notes: Adjusted for the duration of diabetes and use of anti-diabetes drugs. The association between serum BTMs levels and the risks of DR are shown in (A) For OC, (B) For P1NP, and (C) For β-CTX. The association between serum BTMs levels and the risks of DPN are shown in (D) For OC, (E) For P1NP, and (F) For β-CTX. The association between serum BTMs levels and the risks of DKD are shown in: (G) For OC, (H) For P1NP, and (I) For β-CTX. |
 |
Figure 4 Receiver-operating characteristic curve for predictive values of OC in the presence of DR. Note: OC concentrations were transformed reciprocally. |
Univariable and multivariable logistic regression analyses did not show any association between serum BTMs concentration and DPN or DKD risk. RCS also showed that BTMs had no marked effects on DPN risk (Figure 3D–F) and DKD risk (Figure 3G–I).
Subgroup Analysis of Serum BTMs Effects on MVCs
Table 8 displays the results of subgroup analyses conducted to investigate the effects of serum BTMs on different types of MVCs. After adjusting for the duration of diabetes, interactions test was not statistically significant for the usage of anti-diabetes drugs in DR, DPN, and DKD.
 |
Table 8 Subgroup Analysis of Serum BTMs Effects on MVCs Stratified by Use of Anti-Diabetes Drugs |
Discussion
In this study, we observed significantly lower levels of bone formation markers, specifically OC and P1NP, in patients with T2DM compared to non-diabetic participants. We conducted multivariable logistic regression analysis and found a significant inverse relationship between bone formation markers and T2DM risk, with a linear dose-response relationship. Importantly, these associations were found to be independent of potential confounding factors such as sex, age, and family history of diabetes. Subgroup analysis showed that the effect sizes were smaller in participants with a family history of diabetes relative to those without. Additionally, we did not observe any significant differences in serum bone turnover marker concentrations between T2DM patients with and without MVCs. Interestingly, a non-linear dose-response relationship was identified between OC and the risk of DR, which was independent of the use of anti-diabetes drugs and diabetic duration. Moreover, the ROC curve analysis revealed that the optimal cut-off point for predicting DR was 17.84 ng/mL of OC. Given that the bone remodeling process is energy-consuming, we hypothesized that the observed decrease in bone formation markers in T2DM patients might be associated with a disturbance in energy metabolism and microcirculation.23
Our results are consistent with those reported in the observational studies by Jung et al.24 Wang et al18 and Hunt et al.25 A South Korean cross-sectional study involving 322 men and 387 women aged 20–85 years showed that reduced serum OC levels were strongly associated with deteriorated glucose metabolism in men of all ages and premenopausal women, implying that studies investigating BTMs should consider age and sex.24 In another cross-sectional study involving 919 men and 4171 women in China, it was found that OC levels were significantly lower among male T2DM patients compared to people with normal glucose levels, while the OC and P1NP levels were significantly lower among women with impaired glucose tolerance compared to those with normal levels. Additionally, the OC and P1NP levels were low among T2DM women, compared with women with impaired glucose tolerance.18 Hunt et al25 reported that among 25 T2DM women, serum P1NP and uncarboxylated OC levels were 25% lower than those in 35 women with normal glucose tolerance. Furthermore, serum P1NP levels were 24% lower among T2DM patients compared to those with impaired glucose tolerance. In terms of bone resorption markers, there were no significant differences in β-CTX levels among both male and female T2DM patients compared to non-diabetic populations.25 These findings suggest that bone formation decreases in tandem with glucose metabolism deterioration.
Comparison of BTMs levels revealed that family history of diabetes, sex, and age may be confounding factors for the association between BTMs and T2DM risk. After adjusting for these factors, our results were consistent with those reported by Wang et al18 who found a significant association between OC and T2DM risk  , p = 0.0001] in 4171 Chinese postmenopausal females. In another cross-sectional study involving 4713 Swedish women aged 55–86 years old, both OC and β-CTX exhibited an inverse association with T2DM risk [OC:
  ; β-CTX:
  ].26 Our subgroup analysis showed that the correlations between bone formation markers and T2DM risk were stronger in patients with a family history of diabetes, indicating that genetic factors may significantly influence bone and glucose metabolism. This finding is consistent with a previous study.27
The T2DM patients who participated in this study exhibited suboptimal glycemic control with a high fasting glucose of 9.22 (6.52,12.55) mmol/L, and HbA1c levels greater than 9%. This state of hyperglycemia is responsible for several changes in metabolism, including inflammation, mitochondrial dysfunction, oxidative stress, and apoptosis.28 Studies have associated poor glucose control with low BTMs levels.29,30 Hyperglycemia promotes the accumulation of advanced glycosylation end products (AGEs), which are formed in bones when early glucose metabolism abnormalities occur.31 Over time, the deposition of AGEs is not affected by short-term changes in glycemic control.32 AGE deposition, leads to a decrease in the number of osteoblasts and osteoclasts, which in turn results in reduced bone formation and resorption. Additionally, AGEs have been found to upregulate the SOST gene expression, as well as SOST-encoded sclerotic protein levels and Dickoppf-1 expression.32–34 Sclerotic and Dickoppf-1 proteins inhibit the Wnt-β-catenin signaling pathway, leading to the downregulation of RUNX-2, which is a key regulator of bone formation.32,34,35 The decrease in RUNX-2 suppresses the abundance of osteoblasts, which express less nuclear factor κ B receptor activator ligands and osteoprotegerin required for the maturation of osteoclasts. As a result, the bone resorption rate decreases and bone turnover is characterized by low bone formation and resorption, while the abundance of immature osteoclasts increases.34,36 This might account for the low bone turnover among diabetic patients in this study. In addition, AGEs induce microangiopathy by inducing vascular endothelial dysfunction that primarily affects small arteries, leading to increased microvascular permeability, and apoptosis of pancreatic islet endothelial cells.28,31,37,38 Bones are highly vascularized,39 and in our study, low bone formation markers (OC and P1NP) concentrations in T2DM patients with MVCs might be attributed to microangiopathy induced by AGEs. Therefore, we speculate that decreases in OC and P1NP might reflect microvascular dysfunction in T2DM patients and we provide further analysis. Additionally, osteoblast-secreted OC also affects energy metabolism by regulating islet β cell functions after decarboxylation.40–42 However, it is yet to be conclusively determined whether OC affects the circulatory system by regulating vascular endothelial functions.43,44 In this study, a machine learning model was established by combining OC, P1NP, and other personal information to detect diabetic osteoporosis early, indicating that BTMs are useful tools for monitoring diabetes complications.45
Several antihyperglycemic drugs have been shown to have pleiotropic effects, such as endothelial dysfunction amelioration and regulating bone metabolism. Previous studies have confirmed the impact of pioglitazone, SGLT-2 inhibitors, and GLP-1 analogs on bone metabolism. Therefore, we excluded patients with T2DM who received these medications.46–48 In this study, T2DM patients who received anti-diabetes drug therapy had lower levels of BTMs, especially among patients using metformin, α-glucosidase inhibitors, sulfonylureas, insulin, and (or) its analogs. Therefore, the use of anti-diabetes drugs and diabetic duration, which were observed by analyzing correlations between BTMs and other parameters, were the main confounding factors for the association between BTMs and MVCs. After adjusting these factors, our results were similar to those of previous studies. An et al49 found that serum OC and β-CTX levels were significantly lower among 117 patients with DR than among 168 patients without DR. However, they observed that serum P1NP and β-CTX levels were inversely associated with DR risk, which was different from our results. The lack of consideration of antidiabetes drugs use may account for this difference. The indication of BTMs for DR risk may be attributed to the OC function in energy metabolism and vascular endothelial regulation. However, further investigations are needed to explore the interactions between BTMs.
The differences in serum BTMs levels between T2DM patients with and without DPN or DKD were not significant. The correlation analysis did not show independent effects of serum BTMs levels on DPN or DKD. Similarly, in a previous study, there were no marked differences in P1NP and β-CTX levels between T1DM patients with or without DPN and healthy controls.50 However, Rasul et al51 conducted a cross-sectional study involving 68 male and 52 female T2DM patients with an average age beyond 60 years in Austria and found that P1NP levels in the DPN group were higher than in the non-DPN group. They also found that OC and P1NP levels were significantly higher among male patients with DPN compared to non-DPN patients but not in women. The severity of DPN was negatively associated with OC and β-CTX.52 However, differences in age and race among the participants may have influenced the results, so follow-up studies should recruit participants from multi-centers to clarify the relationship between DPN and BTMs. In another study by Zhu et al53 conducted in China, they investigated 221 diabetic patients and 155 healthy controls and found that serum OC, P1NP, and β-CTX were negatively correlated with eGFR, indicating that bone turnover increases with DKD progression. Maghbooli et al54 conducted a case-control study involving 204 T2DM patients in Iran. They found that levels of OC, CTX, and parathyroid hormone levels were significantly higher in the 104 patients with DR and (or) DKD compared to the 100 patients without MVC. The levels of OC and CTX increased as estimated eGFR decreased or parathyroid hormone levels increased, suggesting that elevated parathyroid hormone levels enhance bone turnover. The decline in renal function in MVC patients was associated with a decrease in renal clearance of BTMs, resulting in increased BTMs levels among MVC patients. Serum uric acid was found to be highly associated with T2DM and DKD.55 Additionally, serum uric acid normalized by creatinine was negatively associated with P1NP and β-CTX among T2DM patients.56 A study of 459 T2DM patients with an eGFR ≥ 60 mL·min−1(1.73 m2)−1 in China found that patients with albuminuria had lower levels of P1NP than patients without albuminuria, although this difference disappeared after adjusting for blood glucose levels.57 However, these results differ from previous studies, which may be attributed to the small number of subjects with DKD included in the study. Specifically, out of the 57 DKD patients, 51 were in early stages with normal or high eGFR, which may also account for the higher eGFR observed in the diabetic population compared to the control group. However, the limited number of early-stage DKD patients may not fully reflect BTMs changes. Future studies with larger samples are needed to clarify the impact of BTMs variations on DKD patients.
This study had several limitations. First, this was a cross-sectional, case-control study, which is generally considered inadequate to demonstrate causal relationships. Second, due to the relatively small sample size, the authors did not analyze the relationship stratified by gender and (or) age, and the T2DM patients included in this study did not reflect the varying periods of diabetic patients with MVCs. Third, all participants were of Han Chinese ethnicity. Thus, the results may not be generalized to other ethnic groups, as bone metabolism and osteoporosis vary among different races. Lastly, selection bias could not be avoided in this hospital-based study. Prospective studies with large sample sizes are needed to assess BTM changes in the early stages of glucose metabolism disorders and to evaluate the relationship between BTMs changes and the progression of glucose metabolism disorders. More research is needed on BTMs at different stages of MVCs to provide deeper insights.
Conclusions
In conclusion, the results of this study suggest that T2DM patients are in a low state of bone formation as evidenced by decreased levels of OC and P1NP. However, there was no significant difference in β-CTX levels between the groups stratified by T2DM and MVCs. Additionally, while OC and P1NP levels were found to be negatively correlated with T2DM risk, β-CTX was not associated with T2DM in this study. Specifically, serum OC levels were found to be associated with DR risk. Given the wide use of BTMs in evaluating bone remodeling, this finding could help clinicians estimate the risk of diabetic microvascular complications risks from a new perspective. However, further studies are needed to validate the mechanisms underlying the deficits in bone remodeling and microvascular dysfunction in diabetes.
Abbreviations
T2DM, Type 2 diabetes mellitus; OC, osteocalcin; P1NP, N-terminal propeptide of type 1 procollagen; β-CTX, β-crosslaps; MVCs, microvascular complications of diabetes; DPN, diabetic peripheral neuropathy; DR, diabetic retinopathy; DKD, diabetic kidney disease; BTMs, bone turnover markers; eGFR, estimated glomerular filtration rate; BMI, body mass index; FPG, fasting plasma glucose; 25(OH)D, 25 hydroxy-vitamin D; PTH, parathyroid; FINS, fasting insulin; HbA1c, glycated hemoglobin A1c; HOMA-IR, homeostasis model assessment parameter of insulin resistance; OR, odds ratios; 95% CI, 95% confidence interval; AGEs, advanced glycosylation end products.
Data Sharing Statement
All data are available upon reasonable request after publication.
Ethics Approval and Informed Consent
This study was approved by the Ethics Committee of Hebei General Hospital (No: 2020-01). All participants signed informed consent. This study was conducted in accordance with the Declaration of Helsinki.58
Acknowledgments
The authors would like to thank all the reviewers who participated in the review and MJEditor company for their linguistic editing assistance.
Funding
This research did not receive any specific grant from funding agencies.
Disclosure
The authors report no conflicts of interest in this work.
References
1. Sun H, Saeedi P, Karuranga S, et al. IDF diabetes atlas: global, regional and country-level diabetes prevalence estimates for 2021 and projections for 2045. Diabetes Res Clin Pract. 2022;183:109119. doi:10.1016/j.diabres.2021.109119
2. Tang X, Yan X, Zhou H, et al. Prevalence and identification of type 1 diabetes in Chinese adults with newly diagnosed diabetes. Diabetes Metab Syndr Obes. 2019;12:1527–1541. doi:10.2147/DMSO.S202193
3. World Health Organization. Diagnosis and management of type 2 diabetes (HEARTS-D); 2020. Available from: https://www.who.int/publications/i/item/who-ucn-ncd-20.1.
4. Yap J, Anbalakan K, Tay WT, et al. Impact of type 2 diabetes and microvascular complications on mortality and cardiovascular outcomes in a multiethnic Asian population. BMJ Open Diabetes Res Care. 2021;9(1):e001413. doi:10.1136/bmjdrc-2020-001413
5. Kosiborod M, Gomes MB, Nicolucci A, et al. Vascular complications in patients with type 2 diabetes: prevalence and associated factors in 38 countries (the DISCOVER study program). Cardiovasc Diabetol. 2018;17(1):150. doi:10.1186/s12933-018-0787-8
6. Arnold SV, Khunti K, Tang F, et al. Incidence rates and predictors of microvascular and macrovascular complications in patients with type 2 diabetes: results from the longitudinal global discover study. Am Heart J. 2022;243:232–239. doi:10.1016/j.ahj.2021.10.181
7. Park S, Kang HJ, Jeon JH, Kim MJ, Lee IK. Recent advances in the pathogenesis of microvascular complications in diabetes. Arch Pharm Res. 2019;42(3):252–262. doi:10.1007/s12272-019-01130-3
8. Mitchell A, Fall T, Melhus H, et al. Type 2 diabetes and change in total hip bone area and bone mineral density in Swedish men and women older than 55 years. J Clin Endocrinol Metab. 2021;106(10):2840–2854. doi:10.1210/clinem/dgab490
9. Schousboe JT, Morin SN, Kline GA, Lix LM, Leslie WD. Differential risk of fracture attributable to type 2 diabetes mellitus according to skeletal site. Bone. 2022;154:116220. doi:10.1016/j.bone.2021.116220
10. Lee EJ, Jain M, Alimperti S. Bone microvasculature: stimulus for tissue function and regeneration. Tissue Eng Part B Rev. 2021;27(4):313–329. doi:10.1089/ten.TEB.2020.0154
11. Shanbhogue VV, Hansen S, Frost M, Brixen K, Hermann AP. Bone disease in diabetes: another manifestation of microvascular disease? Lancet Diabetes Endocrinol. 2017;5(10):827–838. doi:10.1016/S2213-8587(17)30134-1
12. Glendenning P, Chubb SAP, Vasikaran S. Clinical utility of bone turnover markers in the management of common metabolic bone diseases in adults. Clin Chim Acta. 2018;481:161–170. doi:10.1016/j.cca.2018.03.009
13. Han Y, You X, Xing W, Zhang Z, Zou W. Paracrine and endocrine actions of bone-the functions of secretory proteins from osteoblasts, osteocytes, and osteoclasts. Bone Res. 2018;6:16. doi:10.1038/s41413-018-0019-6
14. Shanbhogue VV, Hansen S, Frost M, et al. Compromised cortical bone compartment in type 2 diabetes mellitus patients with microvascular disease. Eur J Endocrinol. 2016;174(2):115–124. doi:10.1530/EJE-15-0860
15. Zwakenberg SR, van der Schouw YT, Schalkwijk CG, Spijkerman AMW, Beulens JWJ. Bone markers and cardiovascular risk in type 2 diabetes patients. Cardiovasc Diabetol. 2018;17(1):45. doi:10.1186/s12933-018-0691-2
16. Holvik K, van Schoor NM, Eekhoff EM, et al. Plasma osteocalcin levels as a predictor of cardiovascular disease in older men and women: a population-based cohort study. Eur J Endocrinol. 2014;171(2):161–170. doi:10.1530/EJE-13-1044
17. Robertson CL, Ghosh G, Fitzgerald P, et al. Bone turnover markers including undercarboxylated osteocalcin are associated with mortality risk in older men. J Bone Miner Res. 2022;37(8):1464–1472. doi:10.1002/jbmr.4631
18. Wang J, Yan DD, Hou XH, et al. Association of bone turnover markers with glucose metabolism in Chinese population. Acta Pharmacol Sin. 2017;38(12):1611–1617. doi:10.1038/aps.2017.23
19. Li W, Liu X, Liu L, et al. Relationships of serum bone turnover markers with metabolic syndrome components and carotid atherosclerosis in patients with type 2 diabetes mellitus. Front Cardiovasc Med. 2022;9:824561. doi:10.3389/fcvm.2022.824561
20. Chinese Diabetes Society.中国2型糖尿病防治指南(2020年版) [Guideline for the prevention and treatment of type 2 diabetes mellitus in China (2020 edition)]. Chin J Diabetes Mellitus. 2021;13(4):315–409. Chinese. doi:10.3760/cma.j.cn115791-20210221-00095
21. Levey AS, Stevens LA, Schmid CH, et al. A new equation to estimate glomerular filtration rate. Ann Intern Med. 2009;150(9):604–612. doi:10.7326/0003-4819-150-9-200905050-00006
22. Hanley AJ, Williams K, Stern MP, Haffner SM. Homeostasis model assessment of insulin resistance in relation to the incidence of cardiovascular disease: the San Antonio heart study. Diabetes Care. 2002;25(7):1177–1184. doi:10.2337/diacare.25.7.1177
23. Wang H, Zheng X, Zhang Y, et al. The endocrine role of bone: novel functions of bone-derived cytokines. Biochem Pharmacol. 2021;183:114308. doi:10.1016/j.bcp.2020.114308
24. Jung KY, Kim KM, Ku EJ, et al. Age- and sex-specific association of circulating osteocalcin with dynamic measures of glucose homeostasis. Osteoporos Int. 2016;27(3):1021–1029. doi:10.1007/s00198-015-3315-7
25. Hunt HB, Miller NA, Hemmerling KJ, et al. Bone tissue composition in postmenopausal women varies with glycemic control from normal glucose tolerance to type 2 diabetes mellitus. J Bone Miner Res. 2021;36(2):334–346. doi:10.1002/jbmr.4186
26. Mitchell A, Fall T, Melhus H, et al. Type 2 diabetes in relation to hip bone density, area, and bone turnover in Swedish men and women: a cross-sectional study. Calcif Tissue Int. 2018;103(5):501–511. doi:10.1007/s00223-018-0446-9
27. Dalgård C, Hansen MS, Möller S, Kyvik KO, Frost M. Disentangling the relationship between bone turnover and glucose homeostasis: a prospective, population-based twin study. Bone Rep. 2021;14:100752. doi:10.1016/j.bonr.2021.100752
28. Salvatore T, Galiero R, Caturano A, et al. An overview of the cardiorenal protective mechanisms of SGLT2 inhibitors. Int J Mol Sci. 2022;23(7):3651. doi:10.3390/ijms23073651
29. Ballato E, Deepika FNU, Russo V, et al. One-year mean A1c of > 7% is associated with poor bone microarchitecture and strength in men with type 2 diabetes mellitus. Calcif Tissue Int. 2022;111(3):267–278. doi:10.1007/s00223-022-00993-x
30. Zhao H, Zhang M, Zhen Y, Tang Y. The relationships between glycated hemoglobin and bone turnover markers in patients with type 2 diabetes but no diabetic nephropathy. Int J Gen Med. 2022;15:5591–5598. doi:10.2147/ijgm.S366725
31. de la Cruz-Ares S, Cardelo MP, Gutierrez-Mariscal FM, et al. Endothelial dysfunction and advanced glycation end products in patients with newly diagnosed versus established diabetes: from the CORDIOPREV study. Nutrients. 2020;12(1):238. doi:10.3390/nu12010238
32. Piccoli A, Cannata F, Strollo R, et al. Sclerostin regulation, microarchitecture, and advanced glycation end-products in the bone of elderly women with type 2 diabetes. J Bone Miner Res. 2020;35(12):2415–2422. doi:10.1002/jbmr.4153
33. Wu Y, Xu SY, Liu SY, et al. Upregulated serum sclerostin level in the T2DM patients with femur fracture inhibits the expression of bone formation/remodeling-associated biomarkers via antagonizing Wnt signaling. Eur Rev Med Pharmacol Sci. 2017;21(3):470–478.
34. Sassi F, Buondonno I, Luppi C, et al. Type 2 diabetes affects bone cells precursors and bone turnover. BMC Endocr Disord. 2018;18(1):55. doi:10.1186/s12902-018-0283-x
35. Eckhardt BA, Rowsey JL, Thicke BS, et al. Accelerated osteocyte senescence and skeletal fragility in mice with type 2 diabetes. JCI Insight. 2020;5(9). doi:10.1172/jci.insight.135236
36. Peng J, Hui K, Hao C, et al. Low bone turnover and reduced angiogenesis in streptozotocin-induced osteoporotic mice. Connect Tissue Res. 2016;57(4):277–289. doi:10.3109/03008207.2016.1171858
37. Weng J, Chen Z, Li J, et al. Advanced glycation end products induce endothelial hyperpermeability via beta-catenin phosphorylation and subsequent up-regulation of ADAM10. J Cell Mol Med. 2021;25(16):7746–7759. doi:10.1111/jcmm.16659
38. Lan KC, Chiu CY, Kao CW, et al. Advanced glycation end-products induce apoptosis in pancreatic islet endothelial cells via NF-kappaB-activated cyclooxygenase-2/prostaglandin E2 up-regulation. PLoS One. 2015;10(4):e0124418. doi:10.1371/journal.pone.0124418
39. Hu K, Olsen BR. The roles of vascular endothelial growth factor in bone repair and regeneration. Bone. 2016;91:30–38. doi:10.1016/j.bone.2016.06.013
40. Lin X, Parker L, McLennan E, et al. Undercarboxylated osteocalcin improves insulin-stimulated glucose uptake in muscles of corticosterone-treated mice. J Bone Miner Res. 2019;34(8):1517–1530. doi:10.1002/jbmr.3731
41. Park D, Gu H, Baek JH, Baek K. Undercarboxylated osteocalcin downregulates pancreatic lipase expression in an ATF4-dependent manner in pancreatic acinar cells. Bone. 2019;127:220–227. doi:10.1016/j.bone.2019.06.009
42. Guo Q, Li H, Xu L, et al. Undercarboxylated osteocalcin reverts insulin resistance induced by endoplasmic reticulum stress in human umbilical vein endothelial cells. Sci Rep. 2017;7(1):46. doi:10.1016/j.bone.2019.06.009
43. Tacey A, Smith C, Woessner MN, et al. Undercarboxylated osteocalcin is associated with vascular function in female older adults but does not influence vascular function in male rabbit carotid artery ex vivo. PLoS One. 2020;15(11):e0242774. doi:10.1371/journal.pone.0242774
44. Dou J, Li H, Ma X, et al. Osteocalcin attenuates high fat diet-induced impairment of endothelium-dependent relaxation through Akt/eNOS-dependent pathway. Cardiovasc Diabetol. 2014;13(1):74. doi:10.1186/1475-2840-13-74
45. Wang C, Zhang T, Wang P, et al. Bone metabolic biomarker-based diagnosis of type 2 diabetes osteoporosis by support vector machine. Ann Transl Med. 2021;9(4):316. doi:10.21037/atm-20-3388
46. Ha J, Lim Y, Kim MK, et al. Comparison of the effects of various antidiabetic medication on bone mineral density in patients with type 2 diabetes mellitus. Endocrinol Metab. 2021;36(4):895–903. doi:10.3803/EnM.2021.1026
47. Adil M, Khan RA, Kalam A, et al. Effect of anti-diabetic drugs on bone metabolism: evidence from preclinical and clinical studies. Pharmacol Rep. 2017;69(6):1328–1340. doi:10.1016/j.pharep.2017.05.008
48. Salvatore T, Galiero R, Caturano A, et al. Effects of metformin in heart failure: from pathophysiological rationale to clinical evidence. Biomolecules. 2021;11(12):1834. doi:10.3390/biom11121834
49. An Y, Liu S, Wang W, et al. Low serum levels of bone turnover markers are associated with the presence and severity of diabetic retinopathy in patients with type 2 diabetes mellitus. J Diabetes. 2021;13(2):111–123. doi:10.1111/1753-0407.13089
50. Vilaca T, Paggiosi M, Walsh JS, Selvarajah D, Eastell R. The effects of type 1 diabetes and diabetic peripheral neuropathy on the musculoskeletal system: a case-control study. J Bone Miner Res. 2021;36(6):1048–1059. doi:10.1002/jbmr.4271
51. Rasul S, Ilhan A, Wagner L, Luger A, Kautzky-Willer A. Diabetic polyneuropathy relates to bone metabolism and markers of bone turnover in elderly patients with type 2 diabetes: greater effects in male patients. Gend Med. 2012;9(3):187–196. doi:10.1016/j.genm.2012.03.004
52. Kara Z, Güneş M, Bolayırlı IM, Oşar Siva Z. The effects of diabetic polyneuropathy and autonomic neuropathy on bone turnover. Metab Syndr Relat Disord. 2022;20(1):11–19. doi:10.1089/met.2021.0028
53. Zhu X, Zhou Y, Hong S, Xue Y, Cui Y, Rizzo R. Correlation between serum bone turnover markers and estimated glomerular filtration rate in Chinese patients with diabetes. Dis Markers. 2021;2021:6731218. doi:10.1155/2021/6731218
54. Maghbooli Z, Shabani P, Gorgani-Firuzjaee S, Hossein-Nezhad A. The association between bone turnover markers and microvascular complications of type 2 diabetes. J Diabetes Metab Disord. 2016;15(1):51. doi:10.1186/s40200-016-0274-2
55. Kocak MZ, Aktas G, Duman TT, Atak BM, Savli H. Is uric acid elevation a random finding or a causative agent of diabetic nephropathy? Rev Assoc Med Bras. 2019;65(9):1155–1160. doi:10.1590/1806-9282.65.9.1156
56. Xing Y, Liu J, Liu H, Ma H. Relationship of bone turnover markers with serum uric acid-to-creatinine ratio in men and postmenopausal women with type 2 diabetes. Diabetes Metab Syndr Obes. 2022;15:3205–3217. doi:10.2147/dmso.S384694
57. Xu L, Niu M, Yu W, et al. Associations between FGF21, osteonectin and bone turnover markers in type 2 diabetic patients with albuminuria. J Diabetes Complications. 2017;31(3):583–588. doi:10.1016/j.jdiacomp.2016.11.012
58. Noble JH
 © 2023 The Author(s). This work is published and licensed by Dove Medical Press Limited. The
full terms of this license are available at https://www.dovepress.com/terms
and incorporate the Creative Commons Attribution
- Non Commercial (unported, 3.0) License.
By accessing the work you hereby accept the Terms. Non-commercial uses of the work are permitted
without any further permission from Dove Medical Press Limited, provided the work is properly
attributed. For permission for commercial use of this work, please see paragraphs 4.2 and 5 of our Terms.
© 2023 The Author(s). This work is published and licensed by Dove Medical Press Limited. The
full terms of this license are available at https://www.dovepress.com/terms
and incorporate the Creative Commons Attribution
- Non Commercial (unported, 3.0) License.
By accessing the work you hereby accept the Terms. Non-commercial uses of the work are permitted
without any further permission from Dove Medical Press Limited, provided the work is properly
attributed. For permission for commercial use of this work, please see paragraphs 4.2 and 5 of our Terms.
Recommended articles
Correlation Between Mean Amplitude of Glycemic Excursion and Bone Turnover Markers in Patients with Type 2 Diabetes: A Cross-Sectional Study
Yang J, Zheng C, Wang Y, Yang L, Liu L
Diabetes, Metabolic Syndrome and Obesity 2023, 16:397-407
Published Date: 10 February 2023