
Back to Journals » International Journal of Nanomedicine » Volume 20
Computational Prediction of Tissue Iron Dynamics in Iron Deficiency Anemia Following Intravenous Ferric Carboxymaltose Therapy
Authors Cao K  , Fan X, Lee CF , Wong RSM, Chan DKL, Yan X
Received 13 April 2025
Accepted for publication 22 August 2025
Published 1 October 2025 Volume 2025:20 Pages 12019—12039
DOI https://doi.org/10.2147/IJN.S534063
Checked for plagiarism Yes
Review by Single anonymous peer review
Peer reviewer comments 2
Editor who approved publication: Professor Dong Wang
Kangna Cao,1 Xiaoqing Fan,1 C F Lee,1 Raymond SM Wong,2 Donald KL Chan,3 Xiaoyu Yan1
1Guangdong-Hong Kong-Macao Joint Laboratory for New Drug Screening, School of Pharmacy, The Chinese University of Hong Kong, Hong Kong SAR, People’s Republic of China; 2Division of Hematology, Department of Medicine and Therapeutics, Faculty of Medicine, The Chinese University of Hong Kong, Hong Kong SAR, People’s Republic of China; 3Department of Chemistry, Faculty of Science, The Chinese University of Hong Kong, Hong Kong SAR, People’s Republic of China
Correspondence: Xiaoyu Yan, The Chinese University of Hong Kong, 8th Floor, Lo Kwee-Seong Integrated Biomedical Sciences Building, Area 39, Shatin, Hong Kong SAR, People’s Republic of China, Tel +852 3943 5012, Fax +852 2603 5295, Email [email protected]
Background: Iron deficiency anemia (IDA) is a global public health concern. Intravenous iron therapy, particularly ferric carboxymaltose (FCM), is a cornerstone therapy for IDA treatment. However, its application is hindered by limited understanding of long-term tissue iron distribution post-therapy and the lack of practical clinical methods to assess tissue iron. This study aims to investigate the tissue iron distribution following FCM and develop a computational model for predicting tissue iron levels in both rats and humans.
Methods: Using an IDA model in rats, we evaluated tissue distribution of iron and dynamic changes of serum iron biomarkers over time after a single dose of FCM. Then we developed a mathematical model to characterize tissue-specific iron kinetics. The model was further scaled to humans and validated using clinical data.
Results: The computational model accurately captured tissue-specific iron distribution and serum ferritin dynamics in IDA rats. Among the analyzed tissues, the liver and spleen exhibited the highest tissue-to-plasma partition coefficient (KPt) values, estimated at 21.7 and 25.9, respectively. The bone marrow (BM) also demonstrated a notable KPt value of 21.6, reflecting the prioritization of iron delivery to BM for erythropoiesis in IDA. Notably, the heart displayed a relatively high KPt value of 18, underscoring its limited capacity to clear excess iron. Our model accurately predicted serum iron profiles in IDA patients. Correlation analysis revealed a strong correlation between model-predicted iron levels in the liver and spleen and magnetic resonance imaging (MRI)-derived relaxation time parameters (P < 0.001), highlighting the model’s predictive capability for tissue iron levels in humans.
Conclusion: This study provides critical insights into the long-term tissue distribution of iron following single dose of FCM and highlights the clinical potential of the computational approach to predict tissue iron content, optimize dosing strategies, and ultimately enhance the safety and efficacy of iron therapy.
Keywords: ferric carboxymaltose, iron deficiency anemia, distribution, PBPK model, intravenous iron, serum iron biomarkers
Graphical Abstract:

Introduction
Iron deficiency anemia (IDA) is a serious global public health problem, which affects around 1.6 billion (24.8%) people worldwide, such as patients with chronic kidney disease (CKD), inflammatory bowel disease (IBD), and heart failure.1 For patients who cannot tolerate or fail to respond to oral iron supplementation, intravenous (IV) iron has become a cornerstone therapy for IDA. In recent years, practice trends in managing CKD-related anemia have increasingly shifted toward greater reliance on IV iron, largely due to adverse outcomes associated with erythropoiesis-stimulating agents use.2 Furthermore, multiple randomized clinical trials have demonstrated the superiority of IV iron over oral iron in managing anemia in populations such as those with end-stage renal disease (ESRD) and IBD.3,4
Despite its widespread clinical use, significant challenges remain in optimizing IV iron therapy and monitoring tissue iron distribution. Iron homeostasis is tightly regulated by complex, coordinated systems to ensure adequate delivery to target tissues while minimizing harmful effects, such as iron-mediated oxidative stress and ferroptosis.5 Ferritin serves as the primary storage form of iron in the human body, accounting for approximately 25% of total iron content. Circulating iron is bound to transferrin, which delivers it to tissues, particularly the bone marrow (BM), for red blood cell (RBC) production. The majority of functional iron (65%-70%) is incorporated into hemoglobin (HGB) for oxygen transport, with smaller amounts present in myoglobin and enzymes. The body efficiently recycles iron, with macrophages in the spleen and liver recovering iron from HGB in aged RBCs. However, because the body lacks an active mechanism for iron excretion, excessive IV iron administration can lead to iron overload, which is associated with tissue damage, increased risk of infection, and tumor progression.6,7 Epidemiological studies have linked excessive IV iron to higher mortality and cardiovascular events in hemodialysis patients.8,9 Therefore, there is a growing safety concern over upward trends in IV iron use and suboptimal iron dose.2,6,10
Currently, there is no practical method in clinical practice to accurately assess tissue iron levels to guide iron dosing. Serum iron concentration measures the amount of iron in the bloodstream but provides limited information on tissue iron stores or iron available for erythropoiesis.11 Serum ferritin and transferrin saturation (TSAT) are commonly used biomarkers for evaluating iron status. However, they often fail to reliably predict tissue-specific iron availability or therapeutic response to IV iron therapy, particularly in the presence of inflammation.12 Magnetic resonance imaging (MRI) has become a valuable non-invasive tool for diagnosing and monitoring iron overload diseases through liver iron concentration (LIC) measurement in non-CKD populations.13 However, its high cost, limited accessibility, and reduced accuracy due to interference from paramagnetic IV iron products restrict its use in monitoring tissue iron in IDA management.14,15 Thus, enhancing understanding of iron distribution, improving methods to assess tissue iron levels, and optimizing IV iron dosage remain as critical priorities in anemia management.2
A computational approach based on preclinical data may serve as a promising solution to address these gaps. While several iron metabolism models exist in the literature,16–22 many focus solely on erythropoiesis and iron metabolism-related biomarkers without incorporating tissue iron content.16–18 Other studies have developed mathematical models to predict iron distribution in mice maintained on iron-deficient, iron-adequate, or iron-loaded diets.19–22 However, mice are known to rarely develop IDA through dietary iron restriction, making them suboptimal models for studying iron distribution under the IDA condition.23–26 This limitation is evident in these studies showing similar iron distribution in RBCs after iron infusion in mice on iron-deficient diets and iron-adequate diets.19–22 Additionally, these models rely on data derived from radioactive iron solutions, which may not accurately reflect the iron disposition of IV iron formulations commonly used in clinical practice.
Ferric carboxymaltose (FCM) is a next-generation IV iron formulation widely used in clinical practice for its favorable safety and efficacy.27 It consists of a ferric hydroxide core stabilized by a carbohydrate shell, which allows for the controlled release of iron.28,29 Its stable and robust complex structure tightly binds iron, resulting in the lowest release of labile, non-transferrin-bound iron (NTBI) among currently available IV iron formulations.30 This feature minimizes the risk of toxicity and oxidative stress associated with labile iron, making FCM well-tolerated clinically even at high doses. FCM also offers practical advantages, including rapid infusion, the ability to deliver large iron doses in a single administration (up to 1000 mg), and no need for a test dose (unlike iron dextran or iron sucrose), thereby enhancing patient convenience.28 While the short-term tissue distribution of iron following FCM administration has been studied in rats and humans,31,32 the long-term dynamics of tissue iron distribution remains poorly understood. In this study, using an IDA model in rats, we first assessed the tissue-specific distribution of iron and the dynamic changes in serum iron biomarkers over an extended timescale following a single dose of FCM. Based on these data, a computational model was developed to characterize iron kinetics in rats. The model was subsequently adapted to humans to predict tissue iron levels in humans and validated using clinical serum iron and MRI data from patients with IDA.
Materials and Methods
Animals and the Introduction of IDA in Rats
The animal experiments received approval from the Animal Experimentation Ethics Committee of the Chinese University of Hong Kong (Reference Number 23–263-ECS) and were conducted in accordance with Cap 340 Animals (Control of Experiments) Ordinance, The Hong Kong Code of Practice for Care and Use of Animals for Experimental Purposes, and The International Guiding Principles for Biomedical Research Involving Animals.33 Male Sprague-Dawley (SD) rats were utilized due to the similarities between rats and humans in iron homeostasis and erythropoiesis.23–25 Rats weighing between 200 to 250 grams were acquired from the Laboratory Animal Services Centre at the Chinese University of Hong Kong. The animals were housed in a controlled environment with unlimited access to water and food. To induce IDA,25,26 the rats were maintained on a low iron diet (<10 mg Fe/kg) throughout the experiment. Additionally, the rats underwent phlebotomy twice a week, with 1 mL of blood withdrawn each time during the first three weeks, followed by a stabilization period for one week. Healthy control animals were provided with a normal iron diet (approximately 200 mg Fe/kg) without phlebotomy. Hematological parameters were monitored twice weekly throughout the four weeks of model establishment.
Biodistribution Study of FCM in IDA Rats
To investigate the dynamics of tissue iron content following FCM administration, a biodistribution study was conducted in IDA rats (Figure 1). A total of 30 male SD rats were divided into two cohorts: a treatment group (n=18) and an IDA control group (n=12). The IDA control group was used to measure endogenous iron levels and monitor changes in tissue iron content with age. Rats in the treatment group received a single dose of 15 mg/kg FCM (Ferrinject®, Vifor Pharma, Glattbrugg, Switzerland) via the tail vein, while those in the IDA control group were given saline.
 |
Figure 1 Schematic diagram of the biodistribution study of FCM in IDA rats. (A) Overview of the study design. (B) Schematic illustration of the sample collection process and subsequent analyses. Created in BioRender. CAO, K. (2025) https://BioRender.com/7mtfwfw. |
Following treatment, three rats from the FCM treatment group were sacrificed at 1 h, 6 h, 24 h, 1 week, 3 weeks, and 5 weeks post-treatment to collect tissue samples for iron analysis. In the IDA control group, tissue iron concentrations were measured at baseline, 1 week, 3 weeks, and 5 weeks post-treatment, under the assumption that tissue iron content would not significantly change within 24 hours. This approach minimized the use of animals. The animals were weighed on the day of necropsy. All animals were sacrificed using anesthesia with isoflurane and were perfused with 200–250 mL saline to remove blood from the organs. Blood samples were collected from the tail vein prior to perfusion and divided into two portions: one for immediate hematological parameter measurement and the other for serum iron biomarkers analysis. The latter was centrifuged at 2000 g for 15 minutes to separate serum, which was then stored at −80 °C for further analysis. Tissue samples from the heart, liver, kidneys, spleen, femur, and lung were collected and subjected to weight measurement. Tissue samples were then stored at −80 °C for iron content determination with inductively coupled-mass spectrometry (ICP-MS).
Measurements of Hematological Parameters and Iron Homeostasis Biomarkers
Hematological parameters, including HGB, mean corpuscular volume (MCV), mean corpuscular hemoglobin (MCH), and hematocrit (HCT), were measured using BC2800VET Hematology Analyzer (BC-2800Vet, Mindray Medical International Limited, Shenzhen, China). Serum transferrin and ferritin concentrations were measured by ELISA kits (ab137993 and ab157732, Abcam, Waltham, MA, USA). Serum hepcidin and erythroferrone (EFRE) were measured by commercial ELISA kits (ER1504, ER1573, FineTest, Wuhan, China). TSAT was calculated using serum iron and total iron-binding capacity (TIBC) according to the formulas:


Iron Quantification via ICP-MS
For sample processing, approximately 0.1 g of the tissue samples were weighed and placed in a clean 50 mL tube. The exact mass was recorded. Then 4 mL of 68% nitric acid was added to the tube, and the samples were digested at 120°C for one hour using a graphite digestion instrument. Following the digestion process, the samples were allowed to cool for an hour before being transferred to a stock sample bottle, and then further diluted to 20 mL with ultrapure water for ICP-MS analysis.
Twenty-four mixed standard solutions (9–222EL, 1000 mg/L) from SPEX CertiPrep (Metuchen, NJ, USA) were used to generate calibration curves. Germanium (Ge) was chosen as the internal standard. The standard solution of Ge (GSB 04–1728-2004, 1000 mg/L) was purchased from the National Nonferrous Metals and Electronic Materials Analysis and Testing Center (Beijing, China). A Perkin Elmer (NexIon 1000, Shelton, CT, USA) ICP-MS instrument was used to determine the amount of total iron content in the tissues. The optimized operating conditions used for ICP-MS are summarized in Table S1. The assay was linear to 200 μg/L with the lowest limit of qualification of 10 μg/L.
Development of the Computational Model in IDA Rats
A computational model was developed to predict the iron levels versus time profiles in various tissues following FCM administration in IDA rats. The model structure, illustrated in Figure 2, is based on physiologically based pharmacokinetic (PBPK) modeling. In this model, each organ is treated as a well-stirred compartment, and drug transfer from blood to tissue is assumed to follow Fick’s law of diffusion. Each tissue is divided into vascular and extravascular compartments according to the permeability-limited mechanism. Iron content in each compartment is expressed as total iron with the unit of microgram, which was obtained by multiplying the iron concentration (μg/g) detected by ICP/MS by the weight of the corresponding tissues.
 |
Figure 2 Schematic diagram of the model structure. (A) Whole-body model. (B) Illustration of each tissue compartment. |
Based on the fact that HGB makes up about 95% of the dry weight of RBC and accounts for the vast majority of the iron present in RBC,34 the amount of iron in the RBC compartment was approximately considered equal to the iron content in HGB. The total iron in HGB was calculated according to the established relationship that the amount of iron in 1 g of HGB is 3.34 mg.35 The blood volume of rats was obtained from literature according to body weight.36 Iron content in the rest of the tissues like fat and muscles was lumped into the remainder compartment. A system of ordinary differential equations was utilized to characterize the kinetics of iron content in different tissue compartments.
Heart, kidney, and remainder:


where Vt_vas is the capillary volume of tissue, and Vt_exv represents the extravascular volume of tissue. Ct_vas is the iron concentration in the vascular compartment of the tissue while Ct_exv denotes the iron concentration in the extravascular compartment of the tissue. Qt is the plasma flow rate in the tissue. Cart is the iron concentration in the artery compartment. PSt is the membrane permeability of iron in the tissue. Kpt is the tissue-to-plasma partition coefficient of iron in the tissue.


where Vlun_vas is the capillary volume of the lung; Vlun_exv represents the extravascular volume of the lung; Clun_vas is the iron concentration in the vascular compartment while Clun_exv denotes iron concentration in the extravascular compartment. Qlun is the plasma flow rate in the lung. Cvein is the iron concentration in the vein compartment. PSlun is the membrane permeability of iron in the lung. Kplun is the tissue-to-plasma partition coefficient of iron in the lung.


After IV iron infusion, iron is mainly utilized to synthesize HGB in RBC formation, and this process mainly takes place in the BM.37 Recycle of iron in RBC mainly takes place via macrophage-medicated erythrophagocytosis in the spleen.38,39 The dynamics of iron in BM, RBC, and spleen compartments were described according to these physiological mechanisms.







Where QE is the production rate of RBC in the BM and Kout_RBC is the clearance rate of RBC. Vp is the total plasma volume and QC is the cardiac output. All physiological parameters, including plasma flow, vascular volume and extravascular volume in each tissue, were listed in Table 1. QC and plasma flow in each tissue were calculated based on literature data40 and the actual body weight of rats used in this study using the equation:
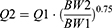
where Q1 and Q2 denote the plasma flow of 280 g rats in liturature40 and that of 325 g rats in the current study. Total tissue and plasma volume were calculated as follows:

where V1 and V2 denote the total tissue and plasma volume of 280 g rats in literature40 and those of 325 g rats in this study. The total volume of the BM was calculated based on the average weight of the femurs in the current study (2.74 mg) and the density of the femur with marrow in male rats (1.51 mg/mm3).41 The extravascular volume (Vt_exv) is equal to the total volume of the tissue multiplied by the proportion of the extravascular volume to the total tissue volume.40
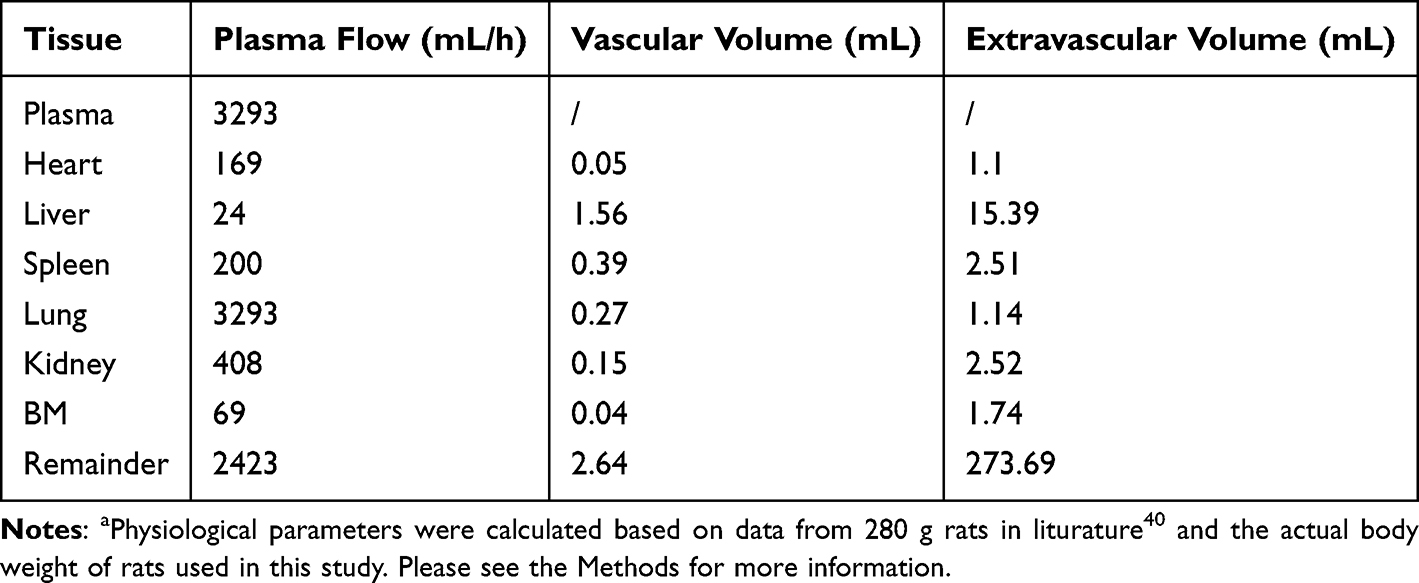 |
Table 1 Physiological Parameters Used in the Model in 325 g Ratsa |
Serum ferritin is also included in this model to recapitulate the interplay between its dynamics and iron storage in the body. Serum ferritin is derived primarily from macrophages in the spleen through a nonclassical secretory pathway.42 Therefore, the dynamics of serum ferritin was characterized as follows:

Where Kin_fer and Kout_fer are the synthesis and clearance rate of serum ferritin, respectively.
The model was implemented using NONMEM (V7.5, Icon plc, USA). Ordinary differential equations were solved using the ADVAN14 subroutine, and parameter estimation was performed using the FOCE algorithm. Data preparation and model diagnostics were performed using the R program (Version 4.3.0, R Core Team, 2023).
Extrapolation from Rats to Humans
The final model in rats was extrapolated to humans to simulate iron tissue levels after FCM administration in humans. Human physiological parameters, including organ volume, plasma flow rate, and organ weights, are shown in Table 2. The clearance rate of RBC in humans (Kout_RBC) was calculated according to the lifespan of RBC (120 days) in humans.43 The Kpt values were assumed to be identical between rats and humans, whereas PSt and QE were scaled to humans using the allometric scaling equation:


 |
Table 2 Physiological Parameters in Humans (70 Kg) |
The capacity of this model to predict serum iron concentrations in humans was validated by simulating the identical dosing regimen from the literature and comparing the model-predicted serum iron levels with clinical observations.48 Due to the invasive nature of tissue biopsies, it is challenging to obtain tissue iron data directly in clinical settings. MRI has provided a non-invasive method to measure tissue iron levels and has been widely used in iron overload diseases.49 Iron deposits in tissues create local magnetic field inhomogeneities, accelerating the relaxation of hydrogen protons. The MRI-derived relaxation time parameters (T2*/T2) are inversely correlated with tissue iron levels. Previous studies have demonstrated a strong correlation between relaxation rates R2 (1/T2) and R2* (1/T2*) and liver iron concentrations measured via biopsy in patients with hereditary hemochromatosis, transfusion-dependent thalassemia, and sickle cell disease.50,51 One literature reported MRI T2*/T2 at baseline, 3 hours, 14 days and 42 days after a single dose of FCM in IDA patients.52 Using this dataset, we simulated tissue iron content with our model and performed a correlation analysis between the model-predicted tissue iron levels and MRI-derived relaxation time parameters to validate the model’s ability to predict tissue iron content in humans.
Data Analysis and Statistics
Statistical analyses were conducted using GraphPad Prism (version 6.0.2, La Jolla, CA, USA), with a P value of less than 0.05 considered statistically significant for Student’s two-tailed t-test. Data were expressed as mean ± standard deviation (S.D.) in bar charts and GraphPad Prism was used to generate bar charts. Data preparation, line charts and Pearson correlation analysis were performed using R program (Version 4.3.0, R Core Team, 2023). The 3D-diagrams of the percent distribution of iron were generated using MATLAB (Version R2024b, Natick, Massachusetts: The MathWorks, Inc., available at: https://www.mathworks.com/).
Results
Development of the IDA Model in Rats
An IDA model was established in rats using a combination of an iron-deficient diet and phlebotomy to explore the dynamic tissue distribution of iron following FCM administration under anemic conditions. Four weeks after model induction, IDA rats exhibited significantly reduced HGB, MCV, MCH, and HCT compared to healthy controls (Figure 3A). Furthermore, serum iron levels, along with iron content in the liver and spleen, were markedly lower in IDA rats than in healthy controls, confirming the successful establishment of the IDA model (Figure 3B and C). As expected, HGB levels as well as HCT and MCV were significantly increased in IDA rats one week after FCM administration (Figure 3D and Figure S1).
 |
Figure 3 Successful development of the IDA model in rats. (A) Hematological parameters in healthy control (n=3) and IDA rats (n=12) at the endpoint of the IDA model establishment (Day 28). (B) Serum iron in healthy control and IDA rats at the endpoint of the IDA model establishment. Data were expressed as the mean ± S.D. **** P < 0.0001. (C) Liver and spleen sections stained with Prussian blue for iron detection. The blue area corresponds to iron staining. The results shown are from one representative experiment and one representative animal per group. Scale bar, 50 µm. (D) HGB levels after FCM administration. Abbreviations: HGB, hemoglobin; HCT, hematocrit; MCV, mean corpuscular volume; MCH, mean corpuscular hemoglobin. |
The Dynamic Process of Iron Tissue Distribution After FCM Treatment
We proceeded to investigate the tissue distribution of iron following FCM administration in IDA rats. The serum iron concentrations rose sharply within the first 15 minutes post-treatment, followed by near-complete clearance within 24 hours (Figure 4A and Figure S2). By one week after FCM dosing, no significant differences in serum iron levels were observed between the treatment and IDA control groups (Figure 4A), highlighting the limited ability of serum iron concentrations to reflect iron storage in the body.
 |
Figure 4 The dynamic process of iron tissue distribution. (A) Iron concentration in different tissues versus time in IDA rats given a single dose of FCM (15 mg/kg) or IDA control (n=3 at each time point). The data points represent the mean, and the error bars indicate the standard deviation. *P < 0.05, ** P < 0.01, *** P < 0.001. (B) Representative diagram of percent distribution of iron in the analyzed tissues. |
The BM, a primary target tissue for FCM’s pharmacological effects, exhibited a rapid increase in iron concentration, peaking at 6 hours post-administration and remaining stable at 24 hours (Figure S2). Iron levels in the BM then gradually declined, returning to levels similar to the IDA control group by five weeks post-dosing (Figure 4A). Larger increases of iron concentrations were observed in the liver and spleen. Liver iron concentrations peaked at 6 hours post-dosing and then gradually declined over the following five weeks (Figure 4A and Figure S2). Similarly, spleen iron concentrations peaked at 6 hours and remained elevated at 24 hours post-dosing (Figure S2). Afterward, spleen iron levels declined rapidly, stabilizing by one week post-treatment (Figure 4A). Long-term analysis revealed significantly higher iron concentrations in both liver and spleen in the FCM treatment group compared to the IDA control group.
Iron concentrations in the lungs, heart, and kidneys were also evaluated as toxicologically relevant tissues. Drug-induced increases in iron levels in these organs were relatively small. In the lung, a sustained increase in iron concentration was observed at 24 hours post-dosing (Figure S2), but no significant long-term iron accumulation was detected when compared to the IDA control groups (Figure 4A). Similarly, iron concentrations in the heart increased by 24 hours post-dosing. Unlike the lungs, however, heart iron levels remained elevated throughout the five-week study period (Figure 4A), suggesting a limited capacity for the heart to clear excess iron. This finding raises concerns about potential cardiac toxicity due to iron overload from long-term iron injections. In contrast, no significant changes in kidney iron levels were observed after dosing, and no differences in kidney iron concentrations were detected between the treatment and IDA control groups over the five-week study (Figure 4A).
To better understand overall iron distribution, data were expressed as a percentage of total measured iron across all tissues. Total tissue iron content was calculated by multiplying iron concentration by tissue mass, and the sum of these values determined the total measured iron. As shown in Figure 4B, the liver accounted for the largest proportion of total iron in IDA rats, followed by the BM and spleen, while the lung and plasma contributed the least. After FCM administration, plasma accounted for the highest proportion of iron among these tissues. However, as plasma iron was redistributed into tissues, the liver and spleen became the dominant reservoirs of iron by 6 hours post-treatment. Interestingly, despite an increase in BM iron concentration post-FCM, its proportion of total iron decreased in the treatment group compared to controls.
Dynamic Response of Serum Iron Homeostasis Biomarkers After FCM Treatment
The dynamic changes in iron homeostasis biomarkers, including serum ferritin, TSAT, hepcidin, and EFRE, were also evaluated to explore their relationship with tissue iron following FCM administration. Serum ferritin and TSAT are the most commonly used biomarkers in clinical practice to assess iron storage. As shown in Figure 5A, serum ferritin levels gradually increased following FCM treatment, with significantly higher concentrations observed at 10 h and 24 h post-administration compared to the IDA control group (P < 0.05 for both time points). TSAT increased rapidly in response to the spike in plasma iron concentration after FCM infusion and subsequently returned to pre-administration levels within 24 hours (Figure 5B). Over the long term, no significant differences in serum ferritin or TSAT levels were observed between the treatment and control groups during weeks 1 to 5 post-administration, despite significantly higher iron concentrations in the liver, spleen, and heart of the treatment group (Figure 4A). These findings highlight the limited ability of these two biomarkers to accurately reflect tissue iron concentrations and overall body iron storage.
 |
Figure 5 Dynamic response of serum iron homeostasis biomarkers, including serum ferritin (A), transferrin saturation (TSAT, (B)), serum hepcidin (C) and erythroferrone (EFRE, (D)) after a single dose of FCM (15 mg/kg) or saline in IDA rats. The red lines represent data in the treatment group, while the blue lines denote data in the IDA control group. The line points represent the mean, and the error bars indicate the standard deviation (n=3 at each time point). *P < 0.05. |
Hepcidin, a small peptide hormone primarily produced by the liver, plays a central role in regulating iron homeostasis by controlling dietary iron absorption and iron release from macrophages and hepatocytes.53 It has been proposed as a promising biomarker and therapeutic target in iron disorders.54,55 Consistent with previous reports in healthy condition,56,57 serum hepcidin exhibited a circadian rhythm in IDA rats (Figure 5C). After FCM treatment, a slight increasing trend in hepcidin was observed one hour post-administration (P = 0.06), likely reflecting its induction by rapid iron replenishment to prevent toxicity of iron excess.53 However, no significant differences in serum hepcidin levels were detected overall between the treatment and control groups (Figure 5C).
EFRE, a hormone secreted by erythroblasts, plays a key role in iron metabolism by suppressing hepcidin production and increasing iron availability for HGB synthesis.58 It has been proposed as a potential biomarker for effective erythropoiesis.59 This study for the first time reports both the immediate and long-term responses of EFRE to iron treatment under IDA conditions. Similar to hepcidin, EFRE exhibited a circadian rhythm in IDA rats, with levels rising from morning to night (Figure 5D). Notably, a significant increase in EFRE levels was observed at 1 hour and 2 hours post-FCM administration in the treatment group compared to the IDA control group. This increase is likely due to enhanced erythropoiesis in IDA condition following iron supplementation. By inhibiting hepcidin, this mechanism ensures an adequate supply of iron for HGB synthesis.60 However, no significant differences in serum EFRE levels were observed between the treatment and control groups beyond 6 hours after dosing, suggesting that EFRE may not be a reliable biomarker for assessing tissue iron content during IV iron therapy.
The Computational Model Accurately Captures Tissue Distribution of Iron Following FCM Treatment in IDA Rats
To better understand and predict the dynamic distribution of iron across various tissues following FCM administration in anemic rats, a computational model was developed. The structure of the model was illustrated in Figure 2. Each tissue was divided into vascular and extravascular compartments based on a permeability-limited mechanism. Additionally, serum ferritin dynamics were incorporated into the model to capture its interplay with iron storage in the body.
As shown in Figure 6A and Figure S3, the proposed model effectively captured the iron concentration-time profiles across different tissues, with predictions closely aligning with the observed experimental data. The model also accurately described the dynamic changes in serum ferritin levels over both short- and long-term periods (Figure 6B). The predicted AUC values of tissue iron were in good agreement with the observed data (Table 3). Parameter estimates for the final model are presented in Table 4, with most parameters estimated with reasonable precision. The membrane permeability in the kidney (PSkid) exhibited relatively high imprecision (RSE = 80.8%), likely attributable to the minimal iron accumulation observed in the kidney with KPkid estimated to be 9.66 and the higher variability in the experimental data for this tissue.
 |
Figure 6 Comparison of the model prediction versus observed data of tissue iron content (A) and serum ferritin (B) in IDA rats. The red lines represent model prediction, while the black dots denote observed experimental values. |
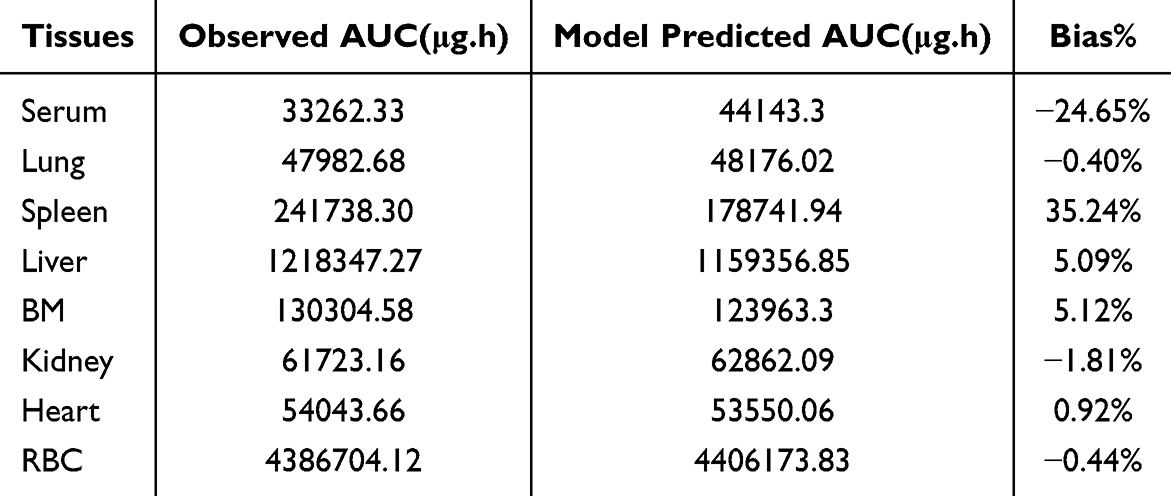 |
Table 3 Average Area Under the Curve (AUC) of Iron Across Different Tissues Based on Experimental Data and Model Predictions |
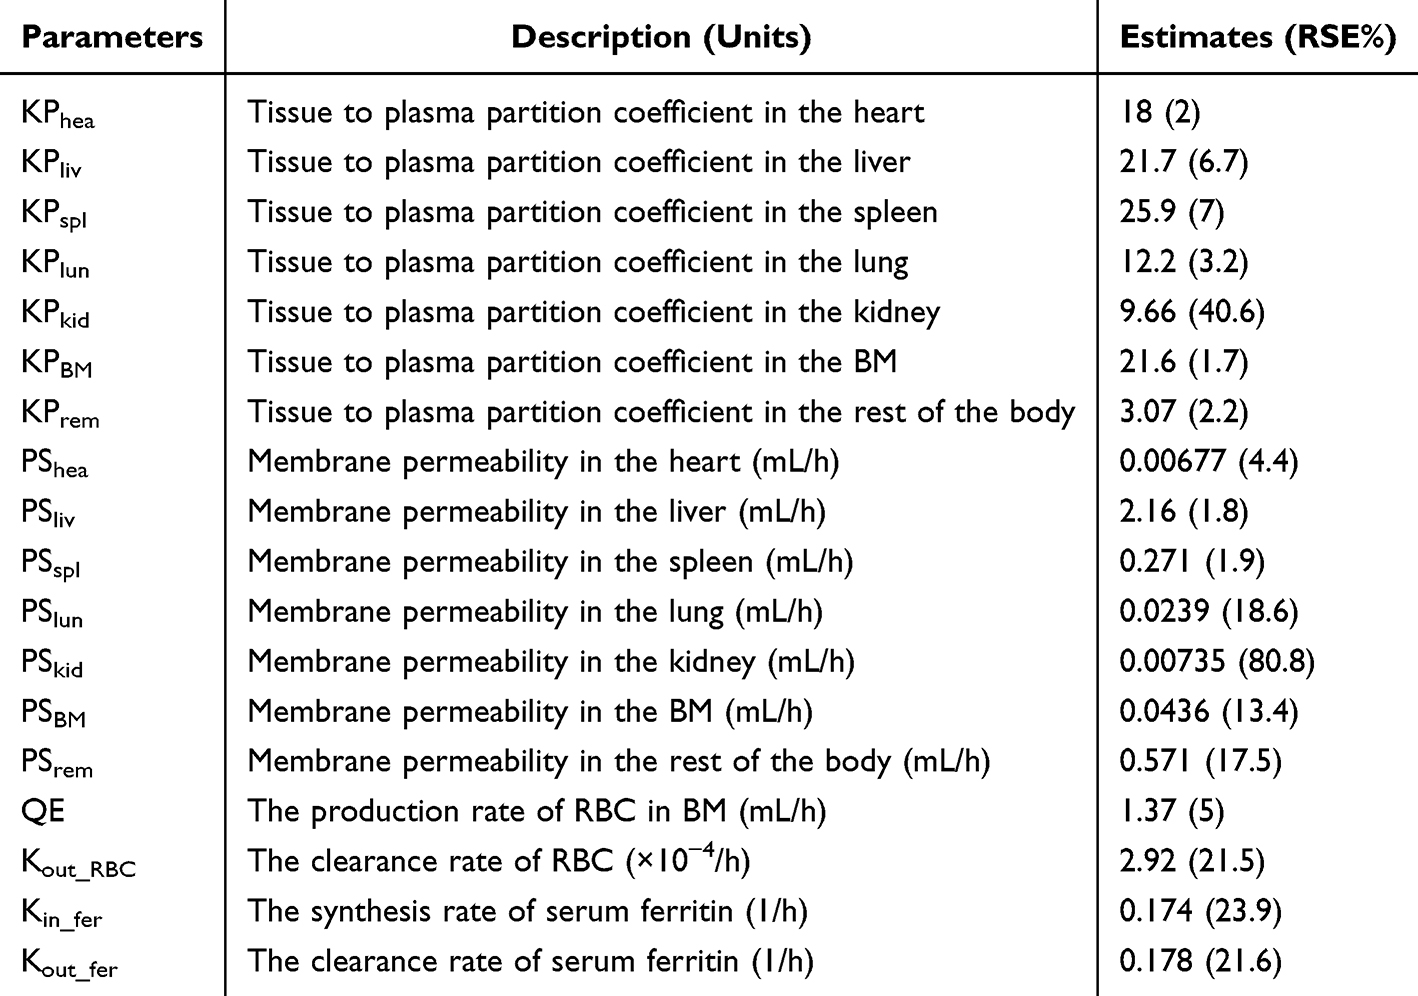 |
Table 4 Parameter Estimation of the Final Model in IDA Rats |
The liver and spleen, recognized as primary iron storage organs, exhibited the highest KPt values among the analyzed tissues, estimated to be 21.7 and 25.9, respectively. In addition, the BM demonstrated a notable partition coefficient (KPBM = 21.6), reflecting the prioritization of iron delivery to the BM for red blood cell production under IDA conditions. Notably, the heart displayed a relatively high KPt value of 18 among the toxicologically relevant tissues (kidney, liver, lung, and heart). This finding aligns with the observed data, which showed significantly higher iron concentrations in the heart three and five weeks after FCM administration compared to the IDA control group (Figure 4A). These results highlight the potential for iron accumulation in the heart during prolonged iron therapy, raising concerns about the risk of cardiac toxicity associated with excessive IV iron infusion.
The impact of different dosing strategies on tissue iron accumulation was further assessed using model-based simulations. Specifically, the dynamics of tissue iron were simulated for three dosing regimens: a single dose of 15 mg Fe/kg (A), 7.5 mg Fe/kg administered once weekly for two weeks (B), and 5 mg Fe/kg administered once weekly for three weeks (C). As shown in Figure S4, when similar iron levels in RBCs (indicative of efficacy) were achieved three weeks after the first dose across all three dosing strategies, the multiple dosing regimens with lower doses resulted in significantly lower iron accumulation in toxicologically relevant tissues, such as the heart (AUC0-5w for A = 54060 µg·h, B = 52777 µg·h, C = 51,605.8 µg·h). These findings suggest that, while the improved formulation of FCM has mitigated the risk of immediate hypersensitivity reactions associated with high-dose iron infusion,28,29 adopting a multiple dosing strategy with lower individual doses may enhance safety by mitigating long-term cardiac iron accumulation.
Prediction of Tissue Iron Levels After FCM Administration in Humans
The computational model was further scaled to humans to predict iron levels across tissues following FCM infusion. This was accomplished by adapting the model with physiological parameters specific to humans (Table 2). To validate the model, serum iron concentrations reported in the literature from patients with IDA were utilized.48 As shown in Figure 7A, the model accurately predicted serum iron profiles after different doses of FCM administration in IDA patients.
 |
Figure 7 Model validation in humans. (A) Observed and simulated serum iron profiles in humans following a single dose of FCM at 100 mg, 500 mg, 800 mg, and 1000 mg. The dots represent the mean of observed clinical data,6 while the lines depict predictions generated by the proposed computational model. (B and C) Pearson correlation analysis of the model-predicted tissue iron levels and MRI-derived relaxation time parameters (ΔT2*, ΔT2) in the liver (B) and Spleen (C). The red lines represent the linear regression line and its 95% confidence interval. |
Due to the invasive nature of tissue biopsies, it is challenging to obtain tissue iron data directly in clinical settings. Advancements in MRI have provided a non-invasive method to measure tissue iron levels. The MRI-derived relaxation time parameters (T2*/T2) are inversely correlated with tissue iron levels. Previous studies have demonstrated a strong correlation between relaxation rates 1/T2 and 1/T2* and liver iron concentrations measured via biopsy in patients with hereditary hemochromatosis, transfusion-dependent thalassemia, and sickle cell disease.50,51 Using MRI data in patients with IDA after a single dose of FCM,52 we simulated tissue iron content with our model and performed a correlation analysis between the model-predicted tissue iron levels and MRI-derived relaxation time parameters to validate the model’s ability to predict tissue iron level in humans (Figure 7 and Figure S5). As shown in Figure 7B, the model-predicted liver iron levels exhibited a strong correlation with MRI-derived T2* and T2 values, underscoring the model’s capability to well predict tissue iron distribution in humans. While the relationship between MRI relaxation times and spleen iron content is less well-studied compared to the liver,61,62 our results demonstrated a strong correlation between the model-predicted spleen iron levels and T2, *T2 values (Figure 7C).
In summary, the model effectively predicted tissue iron distribution in humans, as demonstrated by strong correlations between model-predicted tissue iron levels and MRI-derived parameters in the liver and spleen, as well as a good agreement between predicted and clinically observed serum iron concentrations.
Discussion
Optimizing IV iron dosing for the treatment of IDA remains a significant challenge in clinical practice due to limited understanding of long-term tissue iron distribution and the lack of reliable biomarkers for assessing tissue-specific iron levels and total body iron storage.2 This study aims to address these gaps by developing a computational model to characterize tissue-specific iron dynamics following FCM administration.
Using an IDA model in rats, we first evaluated the tissue-specific distribution of iron and the dynamic changes in serum iron biomarkers over an extended timescale following a single dose of FCM. Based on these data, we developed a computational model that effectively captured the dynamic distribution of iron across tissues in IDA rats and accurately predicted serum ferritin levels over time. We chose rats instead of mice for several reasons. First, previous studies have demonstrated that rats exhibit greater physiological similarity to humans compared to mice, particularly in terms of iron homeostasis and erythropoiesis.23,24 Second, the larger blood volume in rats facilitates the collection of sufficient tissue and blood samples for the measurement of multiple hematological parameters and serum iron biomarkers. This not only reduces the number of animals required but also enables more accurate quantification of biomarkers and tissue iron levels. Accordingly, previously published studies on the tissue distribution of IV iron formulations were mainly conducted in rats.25,63,64
Among the tissues analyzed, the liver and spleen exhibited the highest partition coefficients (KPt). This is reasonable given that these organs are the primary sites for iron storage and recycling.65 The bone marrow also exhibited a high KPt value, which is consistent with its critical role in erythropoiesis under IDA condition, where iron delivery to the BM is prioritized to support oxygen transport. Notably, this study revealed significant long-term iron accumulation in the heart after a single dose of FCM, with the heart displaying a relatively high KPt value among the toxicologically relevant tissues. These findings suggest that the heart has a limited capacity for iron clearance, raising concerns about potential cardiac toxicity with long-term IV iron therapy. This result aligns with the observation that the heart is more susceptible to genetic or acquired iron overload compared to other non-iron storage organs, such as the lungs and kidneys.66 Although there is no biodistribution data available for FCM in mice, a previous study using mice injected with 59Fe solution supported the finding of iron accumulation in the heart 28 days after IV iron injection.67
Iron enters cardiomyocytes primarily through the transferrin receptor 1 (TfR1) pathway, but it can also be transported via other mechanisms, including T-type calcium channels (TTCC), divalent metal transporter 1 (DMT1), L-type calcium channels (LTCC), and Zrt-, Irt-like proteins (ZIP).65,68 The only protein responsible for exporting iron from cardiomyocytes is ferroportin (FPN). While cardiomyocytes have multiple pathways for iron uptake, they rely on a single mechanism for iron export, which may explain the heart’s limited ability to remove excess iron during iron overload.68 In contrast, negligible iron accumulation in the kidney may be attributed to low TfR1 expression and limited iron uptake pathways in renal tissues.69 Excess iron accumulation in the heart can impair cardiac function, potentially leading to heart failure and arrhythmias.70 This study highlights the importance of monitoring cardiac iron levels in patients undergoing repeated IV iron therapy. Furthermore, our model-based simulations suggest that, under a fixed total iron dose, adopting a multiple-dosing strategy with lower individual doses may improve safety by mitigating cardiac iron accumulation.
The model was further scaled to humans and validated using clinical data, accurately predicting serum iron profiles in IDA patients. Correlation analysis showed a strong correlation between model-predicted iron levels in the liver and spleen and MRI-derived relaxation time parameters (T2*/T2), underscoring the potential of a computational approach to predict tissue-specific iron levels and optimize dosing strategies. This study also evaluated the dynamic changes in serum iron homeostasis biomarkers, including serum ferritin, TSAT, hepcidin, and ERFE, to explore their relationship with tissue iron following FCM administration. Ferritin serves both as an iron-storage protein and a positive acute-phase reactant.71 Small amounts of ferritin are found in serum, primarily due to secretion from macrophages or release following cell death and lysis.42 Although low serum ferritin is generally a good indicator of iron deficiency, it may not always accurately reflect tissue iron levels due to its nature as an acute-phase reactant.12 In the presence of inflammation, infection, or chronic diseases, serum ferritin levels can rise due to increased production by the liver, even if the body’s overall iron stores are low. Furthermore, our study demonstrates that neither serum ferritin nor TSAT can reflect long-term iron levels in the heart, liver, or spleen in IDA after a single dose of FCM. Hepcidin and EFRE are key regulators of iron homeostasis, specifically interacting to control iron availability for red blood cell production.54,55,59 Hepcidin reduces iron absorption and release from storage, while ERFE, produced by erythroblasts, suppresses hepcidin, promoting iron release during increased erythropoiesis. Although serum hepcidin and ERFE are valuable biomarkers for iron homeostasis,54,55,59 their levels are influenced by multiple factors, including inflammation, erythropoietic activity, chronic disease, and liver dysfunction, limiting their reliability in reflecting tissue-specific iron content or total iron storage.65 Our results show that, aside from a transient increase in ERFE at 1 and 2 hours after FCM administration, there were no significant differences in hepcidin and ERFE levels between the FCM treatment and control groups throughout the study period, highlighting their limited utility in assessing tissue iron stores. The limitations of these serum biomarkers emphasize the need for innovative approaches, such as the computational model proposed in this study, to evaluate tissue iron levels, optimize IV iron dosing, and improve the safety and efficacy of IV iron therapy.
This study has some limitations that warrant further investigations. First, the molecular mechanisms underlying iron uptake and distribution were simplified in the current model. For example, the roles of the reticuloendothelial system and transferrin-mediated iron uptake were not explicitly included to avoid overparameterization. Second, the clearance rate of iron was not estimated, as the experimental data did not support such an estimation. This aligns with the physiological understanding that the body lacks an active mechanism for iron excretion, with minimal daily iron loss occurring through cell shedding from the skin and gastrointestinal surfaces.65 In IDA conditions, this loss is likely even smaller, further complicating clearance estimations. Third, this study serves as a proof-of-concept for using computational modeling to predict tissue iron distribution following IV iron therapy. While the model performed well in IDA rats and was successfully scaled to humans, iron metabolism varies depending on the degree of iron deficiency, inflammation, and other disease conditions. Additional clinical data is needed to refine the model for broader applicability. Finally, the disposition of iron in the body can vary depending on the specific IV iron formulation used. This study focused exclusively on FCM, and the findings may not be generalizable to other formulations, such as iron sucrose or ferric derisomaltose. Future research should explore the applicability of this model to other IV iron products to broaden its clinical relevance.
Conclusion
In this study, we employed computational modeling to investigate the tissue distribution of iron following a single dose of FCM. Using an IDA model in rats, we first assessed the tissue-specific distribution of iron and the dynamic changes in serum iron biomarkers over an extended timescale after a single dose of FCM. Based on this data, we developed a computational model that effectively characterizes tissue iron kinetics and serum ferritin response in IDA rats. This model was subsequently scaled to humans and validated with clinical data, demonstrating its ability to predict tissue iron levels in humans. Our findings provide valuable insights into the long-term tissue distribution of iron after a single dose of FCM administration and highlight the clinical potential of the computational approach to predict tissue iron content, optimize dosing strategies, and ultimately improve the safety and efficacy of iron therapy in clinical practice.
Data Sharing Statement
Data will be made available from the corresponding author upon reasonable request.
Acknowledgments
Graphical abstract was created in BioRender. CAO, K. (2025) https://BioRender.com/p3gvej5.
Funding
The project was funded by Direct Grant for Research from the Chinese University of Hong Kong (4054851).
Disclosure
Dr Raymond Wong reports grants and/or personal fees from Apellis, AstraZeneca, BMS, CSL, Daiichi Sankyo, Gilead, GSK, Novartis, Regeneron, Roche, and Menarini, outside the submitted work. The authors report no other conflicts of interest in this work.
References
1. Kumar SB, Arnipalli SR, Mehta P, Carrau S, Ziouzenkova O. Iron deficiency anemia: efficacy and limitations of nutritional and comprehensive mitigation strategies. Nutrients. 2022;14(14). doi:10.3390/nu14142976
2. Babitt JL, Eisenga MF, Haase VH, et al. Controversies in optimal anemia management: conclusions from a kidney disease: improving global outcomes (KDIGO) conference. Kidney Int. 2021;99(6):1280–1295. doi:10.1016/j.kint.2021.03.020
3. Gasche C, Berstad A, Befrits R, et al. Guidelines on the diagnosis and management of iron deficiency and anemia in inflammatory bowel diseases#. Inflammatory Bowel Dis. 2007;13(12):1545–1553. doi:10.1002/ibd.20285
4. Macdougall IC, White C, Anker SD, et al. Intravenous iron in patients undergoing maintenance hemodialysis. N Engl J Med. 2019;380(5):447–458. doi:10.1056/NEJMoa1810742
5. Galy B, Conrad M, Muckenthaler M. Author correction: mechanisms controlling cellular and systemic iron homeostasis. Nat Rev Mol Cell Biol. 2024;25(8):671. doi:10.1038/s41580-024-00760-w
6. Nakanishi T, Kuragano T. Potential hazards of recent trends in liberal iron use for renal anemia. Clin Kidney J. 2021;14(1):59–69. doi:10.1093/ckj/sfaa117
7. Auerbach M, Ballard H. Clinical use of intravenous iron: administration, efficacy, and safety. Hematology Am Soc Hematol Educ Program. 2010;2010(1):338–347. doi:10.1182/asheducation-2010.1.338
8. Bailie GR, Larkina M, Goodkin DA, et al. Data from the dialysis outcomes and practice patterns study validate an association between high intravenous iron doses and mortality. Kidney Int. 2015;87(1):162–168. doi:10.1038/ki.2014.275
9. Kuragano T, Matsumura O, Matsuda A, et al. Association between hemoglobin variability, serum ferritin levels, and adverse events/mortality in maintenance hemodialysis patients. Kidney Int. 2014;86(4):845–854. doi:10.1038/ki.2014.114
10. Rostoker G, Vaziri ND. Risk of iron overload with chronic indiscriminate use of intravenous iron products in ESRD and IBD populations. Heliyon. 2019;5(7):e02045. doi:10.1016/j.heliyon.2019.e02045
11. Alston AB, Digigow R, Flühmann B, Wacker MG. Putting square pegs in round holes: why traditional pharmacokinetic principles cannot universally be applied to iron-carbohydrate complexes. Eur J Pharm Biopharm. 2023;188:6–14. doi:10.1016/j.ejpb.2023.04.025
12. Guedes M, Muenz DG, Zee J, et al. Serum biomarkers of iron stores are associated with increased risk of all-cause mortality and cardiovascular events in nondialysis CKD patients, with or without anemia. J Am Soc Nephrol. 2021;32(8):2020–2030. doi:10.1681/asn.2020101531
13. Gandon Y, Olivié D, Guyader D, et al. Non-invasive assessment of hepatic iron stores by MRI. Lancet. 2004;363(9406):357–362. doi:10.1016/s0140-6736(04)15436-6
14. Van Doren L, Auerbach M. IV iron formulations and use in adults. Hematology. 2023;2023(1):622–629. doi:10.1182/hematology.2023000495
15. Coyne DW. Iron overload in dialysis patients: rust or bust? Kidney Int Rep. 2017;2(6):995–997. doi:10.1016/j.ekir.2017.08.014
16. Sarkar J, Potdar AA, Saidel GM. Whole-body iron transport and metabolism: mechanistic, multi-scale model to improve treatment of anemia in chronic kidney disease. PLoS Comput Biol. 2018;14(4):e1006060. doi:10.1371/journal.pcbi.1006060
17. Schirm S, Scholz M. A biomathematical model of human erythropoiesis and iron metabolism. Sci Rep. 2020;10(1):8602. doi:10.1038/s41598-020-65313-5
18. Mitchell S, Mendes P. A computational model of liver iron metabolism. PLoS Comput Biol. 2013;9(11):e1003299. doi:10.1371/journal.pcbi.1003299
19. Parmar JH, Davis G, Shevchuk H, Mendes P. Modeling the dynamics of mouse iron body distribution: hepcidin is necessary but not sufficient. BMC Syst Biol. 2017;11(1):57. doi:10.1186/s12918-017-0431-3
20. Lopes TJ, Luganskaja T, Vujić Spasić M, et al. Systems analysis of iron metabolism: the network of iron pools and fluxes. BMC Syst Biol. 2010;4(1):112. doi:10.1186/1752-0509-4-112
21. Parmar JH, Mendes P. A computational model to understand mouse iron physiology and disease. PLoS Comput Biol. 2019;15(1):e1006680. doi:10.1371/journal.pcbi.1006680
22. Fan X, Cao K, Wong RSM, Yan X. A whole-body mechanistic physiologically-based pharmacokinetic modeling of intravenous iron. Drug Deliv Transl Res. 2024;15(4):1109–1120. doi:10.1007/s13346-024-01675-x
23. Wang X, Garrick MD, Collins JF. Animal models of normal and disturbed iron and copper metabolism. J Nutr. 2019;149(12):2085–2100. doi:10.1093/jn/nxz172
24. Zhang J, Liu Y, Han X, et al. Rats provide a superior model of human stress erythropoiesis. Exp Hematol. 2019;78:21–34.e3. doi:10.1016/j.exphem.2019.09.021
25. De Souza LV, Hoffmann A, Fischer C, et al. Comparative analysis of oral and intravenous iron therapy in rat models of inflammatory anemia and iron deficiency. Haematologica. 2023;108(1):135–149. doi:10.3324/haematol.2022.281149
26. Theurl I, Aigner E, Theurl M, et al. Regulation of iron homeostasis in anemia of chronic disease and iron deficiency anemia: diagnostic and therapeutic implications. Blood. 2009;113(21):5277–5286. doi:10.1182/blood-2008-12-195651
27. Scott LJ. Ferric carboxymaltose: a review in iron deficiency. Drugs. 2018;78(4):479–493. doi:10.1007/s40265-018-0885-7
28. Geisser P. The pharmacology and safety profile of ferric carboxymaltose (Ferinject®): structure/reactivity relationships of iron preparations. Port J Nephrol Hypert. 2009;23(1):11–16.
29. Lyseng-Williamson KA, Keating GM. Ferric carboxymaltose: a review of its use in iron-deficiency anaemia. Drugs. 2009;69(6):739–756. doi:10.2165/00003495-200969060-00007
30. Bhandari S, Pereira DIA, Chappell HF, Drakesmith H. Intravenous irons: from basic science to clinical practice. Pharmaceuticals. 2018;11(3):82. doi:10.3390/ph11030082
31. Funk F, Weber K, Nyffenegger N, Fuchs JA, Barton A. Tissue biodistribution of intravenous iron-carbohydrate nanomedicines differs between preparations with varying physicochemical characteristics in an anemic rat model. Eur J Pharm Biopharm. 2022;174:56–76. doi:10.1016/j.ejpb.2022.03.006
32. Beshara S, Sörensen J, Lubberink M, et al. Pharmacokinetics and red cell utilization of 52Fe/59Fe-labelled iron polymaltose in anaemic patients using positron emission tomography. Br J Haematol. 2003;120(5):853–859. doi:10.1046/j.1365-2141.2003.03590.x
33. Animal Experimentation Ethics Committee of the Chinese University of Hong Kong. Animal experimentation regulations at the chinese university of Hong Kong. Available from: https://aeec.cuhk.edu.hk/policy-guidelines.html.
34. Kaza N, Ojaghi A, Robles F. Hemoglobin quantification in red blood cells via dry mass mapping based on UV absorption. J Biomed Opt. 2021;26(8). doi:10.1117/1.Jbo.26.8.086501
35. Schrier SL. So you know how to treat iron deficiency anemia. Blood. 2015;126(17):1971. doi:10.1182/blood-2015-09-666511
36. Probst RJ, Lim JM, Bird DN, Pole GL, Sato AK, Claybaugh JR. Gender differences in the blood volume of conscious Sprague-Dawley rats. J Am Assoc Lab Anim Sci. 2006;45(2):49–52.
37. Stevens-Hernandez CJ, Flatt JF, Kupzig S, Bruce LJ. Reticulocyte maturation and variant red blood cells. Front Physiol. 2022;13:834463. doi:10.3389/fphys.2022.834463
38. Gottlieb Y, Topaz O, Cohen LA, et al. Physiologically aged red blood cells undergo erythrophagocytosis in vivo but not in vitro. Haematologica. 2012;97(7):994–1002. doi:10.3324/haematol.2011.057620
39. Korolnek T, Hamza I. Macrophages and iron trafficking at the birth and death of red cells. Blood. 2015;125(19):2893–2897. doi:10.1182/blood-2014-12-567776
40. Shah DK, Betts AM. Towards a platform PBPK model to characterize the plasma and tissue disposition of monoclonal antibodies in preclinical species and human. J Pharmacokinet Pharmacodyn. 2012;39(1):67–86. doi:10.1007/s10928-011-9232-2
41. Dekanić D. Bone marrow in male and female rats. Experientia. 1978;34(10):1313–1314. doi:10.1007/bf01981439
42. Cohen LA, Gutierrez L, Weiss A, et al. Serum ferritin is derived primarily from macrophages through a nonclassical secretory pathway. Blood. 2010;116(9):1574–1584. doi:10.1182/blood-2009-11-253815
43. Piomelli S, Seaman C. Mechanism of red blood cell aging: relationship of cell density and cell age. Am J Hematol. 1993;42(1):46–52. doi:10.1002/ajh.2830420110
44. Davies B, Morris T. Physiological parameters in laboratory animals and humans. Pharm Res. 1993;10(7):1093–1095. doi:10.1023/a:1018943613122
45. Molina DK, DiMaio VJ. Normal organ weights in men: part II-the brain, lungs, liver, spleen, and kidneys. Am J Forensic Med Pathol. 2012;33(4):368–372. doi:10.1097/PAF.0b013e31823d29ad
46. Molina DK, DiMaio VJ. Normal organ weights in women: part II-the brain, lungs, liver, spleen, and kidneys. Am J Forensic Med Pathol. 2015;36(3):182–187. doi:10.1097/paf.0000000000000175
47. Brown RP, Delp MD, Lindstedt SL, Rhomberg LR, Beliles RP. Physiological parameter values for physiologically based pharmacokinetic models. Toxicol Ind Health. 1997;13(4):407–484. doi:10.1177/074823379701300401
48. Geisser P, Banké-Bochita J. Pharmacokinetics, safety and tolerability of intravenous ferric carboxymaltose: a dose-escalation study in volunteers with mild iron-deficiency anaemia. Arzneimittelforschung. 2010;60(6a):362–372. doi:10.1055/s-0031-1296301
49. Reeder SB, Yokoo T, França M, et al. Quantification of liver iron overload with MRI: review and guidelines from the ESGAR and SAR. Radiology. 2023;307(1):e221856. doi:10.1148/radiol.221856
50. Wood JC, Enriquez C, Ghugre N, et al. MRI R2 and R2* mapping accurately estimates hepatic iron concentration in transfusion-dependent thalassemia and sickle cell disease patients. Blood. 2005;106(4):1460–1465. doi:10.1182/blood-2004-10-3982
51. St. Pierre TG, Clark PR, Chua-anusorn W, et al. Noninvasive measurement and imaging of liver iron concentrations using proton magnetic resonance. Blood. 2005;105(2):855–861. doi:10.1182/blood-2004-01-0177
52. Vera-Aviles M, Kabir SN, Shah A, et al. Intravenous iron therapy results in rapid and sustained rise in myocardial iron content through a novel pathway. Eur Heart J. 2024;45(42):4497–4508. doi:10.1093/eurheartj/ehae359
53. Wang CY, Babitt JL. Liver iron sensing and body iron homeostasis. Blood. 2019;133(1):18–29. doi:10.1182/blood-2018-06-815894
54. Hare DJ. Hepcidin: a real-time biomarker of iron need. Metallomics. 2017;9(6):606–618. doi:10.1039/c7mt00047b
55. Rana S, Prabhakar N. Iron disorders and hepcidin. Clin Chim Acta. 2021;523:454–468. doi:10.1016/j.cca.2021.10.032
56. Ganz T, Olbina G, Girelli D, Nemeth E, Westerman M. Immunoassay for human serum hepcidin. Blood. 2008;112(10):4292–4297. doi:10.1182/blood-2008-02-139915
57. Kroot JJ, Hendriks JC, Laarakkers CM, et al. (Pre)analytical imprecision, between-subject variability, and daily variations in serum and urine hepcidin: implications for clinical studies. Anal Biochem. 2009;389(2):124–129. doi:10.1016/j.ab.2009.03.039
58. Coffey R, Ganz T. Erythroferrone: an erythroid regulator of hepcidin and iron metabolism. Hemasphere. 2018;2(2):e35. doi:10.1097/hs9.0000000000000035
59. Xu P, Wong RSM, Yan X. Early erythroferrone levels can predict the long-term haemoglobin responses to erythropoiesis-stimulating agents. Br J Pharmacol. 2024;181(16):2833–2850. doi:10.1111/bph.16396
60. Kim A, Nemeth E. New insights into iron regulation and erythropoiesis. Curr Opin Hematol. 2015;22(3):199–205. doi:10.1097/moh.0000000000000132
61. Arrivé L, Thurnher S, Hricak H, Price DC. Magnetic resonance imaging of splenic iron overload. Eur J Radiol. 1990;10(2):98–104. doi:10.1016/0720-048x(90)90115-r
62. Hitti E, Eliat PA, Abgueguen E, et al. MRI quantification of splenic iron concentration in mouse. J Magn Reson Imaging. 2010;32(3):639–646. doi:10.1002/jmri.22290
63. Elford P, Bouchard J, Jaillet L, et al. Biodistribution and predictive hepatic gene expression of intravenous iron sucrose. J Pharmacol Toxicol Methods. 2013;68(3):374–383. doi:10.1016/j.vascn.2013.04.005
64. Beekman CR, Matta MK, Thomas CD, et al. Comparative evaluation of US brand and generic intravenous sodium ferric gluconate complex in sucrose injection: biodistribution after intravenous dosing in rats. Nanomaterials. 2018;8(1):10. doi:10.3390/nano8010010
65. Galy B, Conrad M, Muckenthaler M. Mechanisms controlling cellular and systemic iron homeostasis. Nat Rev Mol Cell Biol. 2024;25(2):133–155. doi:10.1038/s41580-023-00648-1
66. Palmer WC, Vishnu P, Sanchez W, et al. Diagnosis and management of genetic iron overload disorders. J Gen Intern Med. 2018;33(12):2230–2236. doi:10.1007/s11606-018-4669-2
67. Schümann K, Szegner B, Kohler B, Pfaffl MW, Ettle T. A method to assess 59Fe in residual tissue blood content in mice and its use to correct 59Fe-distribution kinetics accordingly. Toxicology. 2007;241(1):19–32. doi:10.1016/j.tox.2007.08.082
68. Paterek A, Mackiewicz U, Mączewski M. Iron and the heart: a paradigm shift from systemic to cardiomyocyte abnormalities. J Cell Physiol. 2019;234(12):21613–21629. doi:10.1002/jcp.28820
69. Guo Q, Qian C, Wang X, Qian Z-M. Transferrin receptors. Exp Mol Med. 2025;57(4):724–732. doi:10.1038/s12276-025-01436-x
70. Kremastinos DT, Farmakis D. Iron overload cardiomyopathy in clinical practice. Circulation. 2011;124(20):2253–2263. doi:10.1161/CIRCULATIONAHA.111.050773
71. Lakhal-Littleton S, Cleland JGF. Iron deficiency and supplementation in heart failure. Nat Rev Cardiol. 2024;21(7):463–486. doi:10.1038/s41569-024-00988-1
 © 2025 The Author(s). This work is published and licensed by Dove Medical Press Limited. The
full terms of this license are available at https://www.dovepress.com/terms
and incorporate the Creative Commons Attribution
- Non Commercial (unported, 4.0) License.
By accessing the work you hereby accept the Terms. Non-commercial uses of the work are permitted
without any further permission from Dove Medical Press Limited, provided the work is properly
attributed. For permission for commercial use of this work, please see paragraphs 4.2 and 5 of our Terms.
© 2025 The Author(s). This work is published and licensed by Dove Medical Press Limited. The
full terms of this license are available at https://www.dovepress.com/terms
and incorporate the Creative Commons Attribution
- Non Commercial (unported, 4.0) License.
By accessing the work you hereby accept the Terms. Non-commercial uses of the work are permitted
without any further permission from Dove Medical Press Limited, provided the work is properly
attributed. For permission for commercial use of this work, please see paragraphs 4.2 and 5 of our Terms.
Recommended articles

Patient-Reported Outcomes After Ferric Carboxymaltose Treatment for Iron Deficiency Anemia: A Prospective Observational Study
Kwong WJ, Numan S, Hunter TD, Alves D, Patel A, Shanbhag S
International Journal of General Medicine 2023, 16:3291-3300
Published Date: 2 August 2023
Use and Effectiveness of Carboximaltose Iron in Preoperative Anemia Treatment: A Multicenter and Retrospective Study
Yuste Gutierrez AM, Alonso-Moreno M, Perez Blanco JL, Berlana D, Peña Fernandez MA, Perez Maroto MT, Torralba M
Journal of Blood Medicine 2024, 15:477-486
Published Date: 16 November 2024

Perspectives on Intravenous Iron Therapy Logistics and Adherence: Results from a Patient Survey
Lee EJ, Louden L, Applequist J, Wilson BJ, Strauss J
Patient Related Outcome Measures 2025, 16:163-179
Published Date: 25 November 2025