Back to Journals » International Journal of General Medicine » Volume 18
Comprehensive Analysis Reveals Biomarkers Related to Diabetic Peripheral Neuropathy and Its Molecular Mechanism
Authors Zhu Q, Fan S, Mou J, Zhao M, Li C, Yang B, Shangguan Y, Chen X, Cai Y
Received 3 June 2025
Accepted for publication 22 September 2025
Published 30 October 2025 Volume 2025:18 Pages 6551—6570
DOI https://doi.org/10.2147/IJGM.S544464
Checked for plagiarism Yes
Review by Single anonymous peer review
Peer reviewer comments 3
Editor who approved publication: Dr Jacopo Manso
Qiujin Zhu,1,2,* Shangheng Fan,1,2,* Jingru Mou,1,2 Manlu Zhao,1,2 Changlu Li,1,2 Benben Yang,1,2 Yihan Shangguan,1,2 Xia Chen,3 Yulan Cai1– 3
1Department of Endocrinology, The Second Affiliated Hospital of Zunyi Medical University, Zunyi, 563006, People’s Republic of China; 2Department of Endocrinology and Metabolism, The Affiliated Hospital of Zunyi Medical University, Zunyi, 563006, People’s Republic of China; 3Department of Endocrinology, Kweichow Moutai Hospital, Renhuai, Guizhou, 564501, People’s Republic of China
*These authors contributed equally to this work
Correspondence: Xia Chen; Yulan Cai, Email [email protected]; [email protected]
Purpose: Diabetic peripheral neuropathy (DPN) is a common complication of both type 1 and 2 diabetes. DPN lacks accurate early diagnostic indicators, prompting united identification of biomarkers through transcriptomics and Mendelian randomization (MR) to inform DPN prevention and treatment strategies.
Patients and Methods: Differential expression analysis pinpointed DPN-related genes (DE-DPN-RGs) by screening differentially expressed genes (DEGs) across GSE95849 and GSE185011 datasets. MR approach validated DE-DPN-RGs causally linked to DPN as potential biomarkers, with sensitivity analysis and Steiger test reinforcing the findings. These biomarkers’ expressions were verified via RT-qPCR, while their biological roles, pathways influencing DPN progression, and possible therapeutic targets were comprehensively investigated.
Results: 124 DE-DPN-RGs were identified from 5340 DEGs1 and 896 DEGs2, among them, TNF, OSBPL8, IER3, SLC16A3, CREB5, and LRWD1, showing significant causal relationships with DPN. Sensitivity analysis along with the Steiger test validated the reliability of the results, demonstrating their resilience against reverse causation. Furthermore, OSBPL8, SLC16A3, CREB5, and LRWD1 demonstrated significant differential expression between DPN and control groups in both the GSE95849 and GSE185011 datasets, with consistent expression trends across both datasets, thereby warranting their designation as biomarkers. Biomarkers functioned in metabolic reactions of amino acids, rRNA processing, and translation, with potential therapeutic candidates including rosuvastatin, nitrofurfurylhydrazide, and neostigmine bromide. All four biomarkers exhibited significant upregulation in the DPN group as confirmed by RT-qPCR analysis, with the exception of OSBPL8, which displayed a non-significant difference between the groups.
Conclusion: In conclusion, SLC16A3, CREB5, and LRWD1 emerge as promising biomarkers, elucidating roles in DPN pathogenesis and offering potential therapeutic targets.
Keywords: diabetic peripheral neuropathy, mendelian randomization, biomarker, gene set enrichment analysis, drug prediction
Graphical Abstract:

Introduction
Globally, there is a concerning trend of the escalating prevalence rates and disease burden associated with diabetes, posing significant challenges to public health systems worldwide.1 The International Diabetes Federation (IDF) diabetes map, published in 2021, reports that a staggering 536.6 million individuals worldwide afflicted with diabetes, constituting a prevalence of 10.5%.2 Diabetic peripheral neuropathy (DPN) is one of the most common complications of diabetes, impacting approximately half of all individuals with diabetes.3 DPN manifests as a chronic, symmetrical, and progressive ailment typified by abnormal sensation or/and pain in its early stages. Patients frequently report lancinating, tingling, and burning sensations. These symptoms are often accompanied by depression, anxiety, and sleep disturbances.4 Due to the loss of peripheral nerve function, DPN initially affects the longest nerve fibers, with the condition subsequently progressing from distal to proximal regions.5 This progression can result in disability, severely diminishing the patient’s quality of life and imposing substantial physical, emotional, and financial burdens on both the affected individuals and the healthcare system.6 Therefore, early and timely diagnosis and treatment of DPN are crucial in improving clinical outcomes and alleviating the economic and emotional burdens on patients. Currently, the diagnosis of DPN relies on nerve conduction studies (NCS), which is considered the gold standard.7 However, its time-consuming, labor-intensive, and notably expensive nature makes routine clinical application impractical.8 Considering the lack of precise early diagnostic markers for DPN, the existing ambiguity in our understanding of the underlying mechanisms of DPN and the scarcity of effective treatment strategies. There exists a compelling imperative to diligently pursue biomarkers for early detection and a comprehensive examination of the molecular mechanisms underlying these markers is imperative. It will further improve the diagnosis, treatment, and prognosis of this disease.
The Mendelian randomization (MR) methodology holds significant promise in evaluating causal relationships between exposures and outcomes in epidemiology.9 By utilizing genetic variants as instrumental variables (IVs) in non-experimental data, MR offers a robust approach to investigating such associations. Since genetic alleles are randomly arranged at conception and the germline genotype cannot be modified by disease, MR analyses are not biased by confounding between exposures and outcomes, reverse causality, or measurement error.10 Therefore, MR emerges as a compelling approach for meticulously investigating the complex mechanisms involved in the pathogenesis of DPN. Most prior studies have employed MR to identify risk factors for DPN.11,12 However, fewer investigations focusing on the concurrent utilization of transcriptome analysis and MR in the study of DPN.
This study integrates transcriptome sequencing data of DPN in conjunction with MR analysis to scrutinize the correlation and causality between DEGs and the pathogenesis of DPN. This study will utilize enrichment analysis to investigate the relevant functional pathways and the pathogenesis of these genes. Furthermore, the validation of biomarker expression will be conducted using reverse transcription quantitative polymerase chain reaction (RT-qPCR). These comprehensive integrated methodologies, combining transcriptome sequencing data and MR analysis, are strategically crafted to unravel the intricate molecular mechanisms underlying the pathogenesis of DPN. By meticulously scrutinizing the correlation and causality between DEGs and DPN, these methodologies hold immense promise in unveiling novel therapeutic targets and paving the way for innovative interventions to ameliorate the burden of this debilitating condition.
Material and Methods
Statistical Collection of Data
The GSE95849 and GSE185011 datasets were obtained from the Gene Expression Ontology (GEO) database (https://www.ncbi.nlm.nih.gov/geo/).13 The GSE95849 dataset (GPL22448) was selected as the training set, wherein blood samples were obtained from six patients diagnosed with DPN and six control subjects.14 The GSE185011 dataset (GPL24676) served as the validation set, comprising blood samples obtained from five patients diagnosed with DPN and five normal control subjects.15 The integrative epidemiology unit open genome-wide association study database (IEU OpenGWAS, https://gwas.mrcieu.ac.uk/)16 was used to procure expression quantitative trait locus (eQTL) data for differentially expressed DPN-related genes (DE-DPN-RGs) which were employed as exposure factors in the MR analysis. The visit time was October 23, 2023. Simultaneously, a search was conducted by entering the keyword “diabetic neuropathy” in this database to obtain the “finn-b-DM_NEUROPATHY” dataset, utilized as the outcome. The dataset comprised 1,415 disease samples and 162,201 control samples, all sourced from European populations. The number of single nucleotide polymorphisms (SNPs) was 16,380,195.
Analysis of Differentially Expressed Genes (DEGs)
Gene expression data were extracted from DPN and normal control samples in the GSE95849 dataset. DEGs1 were then identified through screening using the “limma” (version 3.46.0)17 with |log2fold-change (FC)| > 1, adj. p < 0.05.18 Building upon this foundation, DEGs1 were visualized via the “ggplot2” (version 3.4.4)19 and the “pheatmap” (version 1.0.12) packages.20 In addition, DEGs2 between DPNs and controls in the GSE185011 dataset were identified and visualized using the same methodology. Following this, the sets of DEGs identified in the GSE95849 and GSE185011 datasets were intersected to obtain the subset of differentially expressed DPN-related genes (DE-DPN-RGs).
Functional Enrichment Analysis of DE-DPN-RGs and Construction of a Protein-Protein Interaction (PPI) Network
The subset of differentially expressed DE-DPN-RGs underwent Gene Ontology (GO) and Kyoto Encyclopedia of Genes and Genomes (KEGG) enrichment analysis using the “clusterProfiler” package (version 4.4.4), with a significance threshold of P < 0.05.21 This analysis aimed to elucidate the biological functions and signaling pathways associated with the DE-DPN-RGs. Additionally, interactions among the DE-DPN-RGs at the protein level were investigated. The PPI network of the DE-DPN-RGs was constructed using the Search Tool for the Retrieval of Interacting Genes (STRING) database (http://string-db.org),22 with an interaction score threshold greater than 0.7, and visualized using “Cytoscape” software (version 3.8.2).23
Selection of Instrumental Variables (IVs)
The following three assumptions were followed throughout the MR analysis: 1. The independence assumption (the causality between DE-DPN-RGs and DPN is independent of confounding factors); 2. The association assumption (there exists a robust correlation between IVs and DE-DPN-RGs); 3. The exclusivity assumption (DE-DPN-RGs represent the sole pathway through which genetic variation influences DPN).24 Subsequently, IVs satisfying all three aforementioned assumptions were identified through screening. Initially, the extract_instruments function of the “TwoSampleMR” package (version 0.5.7).25 It was employed to retrieve the differentially expressed DE-DPN-RGs and filter the IVs significantly correlated with the DE-DPN-RGs (p < 5×10⁻⁸). Subsequently, single nucleotide polymorphisms (SNPs) in linkage disequilibrium (LD) were excluded by the Clump function (clump = TRUE, r2 = 0.001, kb = 10,000). After that, the number of SNPs was greater than 3 and the SNPs with F-values greater than 10 were reserved. The calculation formula for F values was as follows. In the formula, R2 represents the cumulative explanatory variance of the selected SNPs, N represents the number of the samples.

Following this, the extract_outcome_data function was utilized to retrieve the outcome data, and the IVs that were not relevant to the outcome was retained. SNPs meeting stringent screening criteria were then employed for subsequent MR analysis. Moreover, the harmonise_data function was applied to standardize effect alleles and effect sizes, ensuring consistency in allele representation between exposure factors and outcomes. Similarly, SNPs for multivariable Mendelian randomization (MVMR) analysis were selected using the aforementioned methodology.
Univariable MR (UVMR) Analysis
The univariable UVMR analysis of DE-DPN-RGs (exposure factors) and DPN (outcome) were performed to investigate the causal relationship between them. In UVMR analysis, inverse variance weighted (IVW) method26 was employed as the primary approach, supplemented with the weighted median (WM),27 MR Egger,28 simple mode,29 and weighted mode30 methods. Notably, a p-value less than 0.05 from the IVW method indicated a significantly causal relationship between DE-DPN-RGs and DPN. Additionally, odds ratios (ORs) greater than 1 indicated that DE-DPN-RGs were risk factors for DPN, while ORs less than 1 indicated that DE-DPN-RGs were protective factors for DPN. Furthermore, the UVMR results were visualized using scatter plots, forest plots, and funnel plots.
Sensitivity Analysis
Subsequently, the reliability of the UVMR results was verified through sensitivity analyses. Firstly, a heterogeneity test was used to assess the presence of heterogeneity between the two datasets via the “TwoSampleMR”. If the p-value is greater than 0.05, there was no heterogeneity. If the results had heterogeneity (P < 0.05), random effects IVW was adopted in the MR, otherwise fixed effects IVW would be adopted.Secondly, the mr_pleiotropy_test function was utilized to assess whether there was horizontal pleiotropy between DE-DPN-RGs and the DPN dataset. In addition, the MR-PRESSO was used to correct for horizontal pleiotropy between them by removing outliers. If the p-value is greater than 0.05, it meant that there are no confounders and the results were trustworthy. The SNPs were then eliminated one by one using the leave-one-out (LOO) test to determine the effect of the remaining SNPs on the results.
MVMR Analysis
MVMR was further performed on the exposure factors screened by the UVMR analysis to determine if the exposure factors had a direct or indirect effect on DPN. Allelic effects and effect sizes were reconciled for DE-DPN-RGs and DPN data using the mv_harmonise_data function of “TwoSampleMR”. Unnecessary exposure factors were then removed using the mv_lasso_feature_selection function. Finally, the Steiger test was done to rule out the effect of reverse causation.
Identification of Biomarkers for DPN
Genes with a significantly causal relationship with DPN were screened as candidate biomarkers for DPN from DE-DPN-RGs based on UVMR analysis. In addition, the expression of candidate biomarkers in the GSE95849 and GSE185011 datasets was examined and validated. Ultimately, candidate biomarkers with significant expression differences between DPN and controls and consistent expression trends in both datasets could be used as biomarkers for DPN.
Functional Analysis of Biomarkers
In the GSE95849 dataset, the samples were divided into high and low expression groups based on the expression of biomarkers, and the genes between them were analyzed for differences, and |log2FC| of each gene was calculated and ranked from largest to smallest. The biomarkers were then subjected to gene set enrichment analysis (GSEA)31 using the “clusterProfiler” (version 4.7.1.003).32 The reference gene set was the background gene set “c2.all.v7.2.symbols.gmt” from the Molecular Signatures Database (MSigDB)33 (P < 0.05). To explore differential biological pathways between high and low expression groups of biomarkers, gene set variation analysis (GSVA) was performed on different expression groups based on the “c2.all.v7.2.symbols.gmt” (P < 0.05). In addition, the co-expression network of biomarkers and other functionally similar genes was explored using GeneMANIA (http://genemania.org/). In addition, functional similarities between biomarkers were analyzed with the help of the “GOSemSim” (version 2.24.0)34 (functional similarity score > 0.5).
Subcellular Localization and N6-Methyladenosine Binding Site Prediction
The localization of the biomarkers in subcells was predicted with the help of the mRNALocater online website (http://bio-bigdata.cn/mRNALocater).35 The localization scores of the biomarkers in different subcells were calculated. Next, the occupancy of the biomarkers in different subcells was plotted based on this score. To explore whether N6-methyladenosine (m6A) affected the translational stability of biomarkers, the biomarker m6A binding sites were predicted. First, genome sequence for the biomarkers were obtained at National Center for Biotechnology Information (NCBI, https://www.ncbi.nlm.nih.gov/).36 Then the m6A binding sites of the biomarkers were predicted from the sequence-based RNA adenosine methylation site predictor database (SRAMP, http://www.cuilab.cn/sramp).37
Construction of Biomarker Regulatory Networks
In order to investigate the regulatory mechanisms of biomarkers at the molecular level, the miRDB database (http://mirdb.org)38 and TargetScan database (http://www.targetscan.org)39 were used to predict the upstream miRNAs corresponding to biomarkers. And miRNAs were then obtained by taking the intersection of the predictions from the two databases. After that, the upstream lncRNAs of the miRNAs were predicted using the Starbase database (https://starbase.sysu.edu.cn/).40 In addition, a competing endogenous RNA (ceRNA) regulatory network was constructed using the “Cytoscape”. Potential transcription factors (TFs) for biomarkers were predicted in the Human Tranion Factor Targets database (hTFtarget, http://bioinfo.life.hust.edu.cn/hTFtarget/).41 Next, the TF-mRNA-miRNA network was mapped using the “Cytoscape”.
Prediction of Drugs for DPN-Targeted Therapies
The Drug Signatures Database (DsigDB, http://tanlab.ucdenver.edu/),42 an online database, was used to predict the targeted drugs associated with the biomarkers, and the targeting relationships between the biomarkers and drugs were demonstrated using “Cytoscape”.
Expression Analysis of Biomarkers
For validating the expression of biomarkers, reverse transcription quantitative polymerase chain reaction (RT-qPCR) was performed on 5 DPN and 5 control samples from peripheral blood mononuclear cell (PBMC). The blood samples used in this study were obtained from the Second Affiliated Hospital of Zunyi Medical University, with sample collection occurring between December 2023 and April 2024. All subjects provided informed consent prior to participation. The collection process adhered to the ethical standards set by the Medical Ethics Committee of Zunyi Medical University. The amplification conditions for RT-qPCR were 40 cycles with 1 minute at 95°C, 20 seconds at 95°C, 20 seconds at 55°C, and 30 seconds at 72°C. The qPCR primers were listed in Table S1 with GAPDH as reference gene. The relative expression levels of biomarkers were calculated using the 2−ΔΔCT method.
Statistical Analysis
The R programming language (version 4.2.1) was engaged in statistical analysis. Wilcoxon test was utilized to examine the discrepancies between 2 groups. P < 0.05 was considered notably significant. If not specified, adj. P<0.05 or P<0.05 indicates significant differences.
Results
The Biological Functions of 124 DE-DPN-RGs
Among 5,340 DEGs identified between DPN and controls in the GSE95849 dataset, 3,746 DEGs exhibited upregulation, while 1,594 DEGs demonstrated downregulation. The distribution of these DEGs1 was visualised using a volcano and a heatmap (Figure 1A and B). A total of 896 DEGs2 were identified between DPN and controls in the GSE185011 dataset, with 823 DEGs2 were up-regulated and 73 DEGs2 were down-regulated (Figure 1C and D). The intersection of the 3,746 DEGs from the GSE95849 dataset with the 896 DEGs from the GSE185011 dataset yielded a total of 124 DE-DPN-RGs (Figure 1E). Additionally, DE-DPN-RGs were significantly enriched in several biological functions, including the “intrinsic apoptotic signaling pathway”, “cell chemotaxis”, “regulation of neuron death”, “positive regulation of cytokine production”, “positive regulation of interleukin-6 production”, and “Toll-like receptor binding” (P < 0.05) (Figure 1F). In the KEGG analysis, DE-DPN-RGs were significantly enriched in the “TNF signaling pathway”, “Toll-like receptor signaling pathway”, “Antifolate resistance”, and “African trypanosomiasis” (P < 0.005) (Figure 1G). Furthermore, a robust linkage among these 124 DE-DPN-RGs was demonstrated in the PPI network, with prominent interactions observed among genes TNF, HIF1A, NOD2, and SAMD9L (Figure 1H).
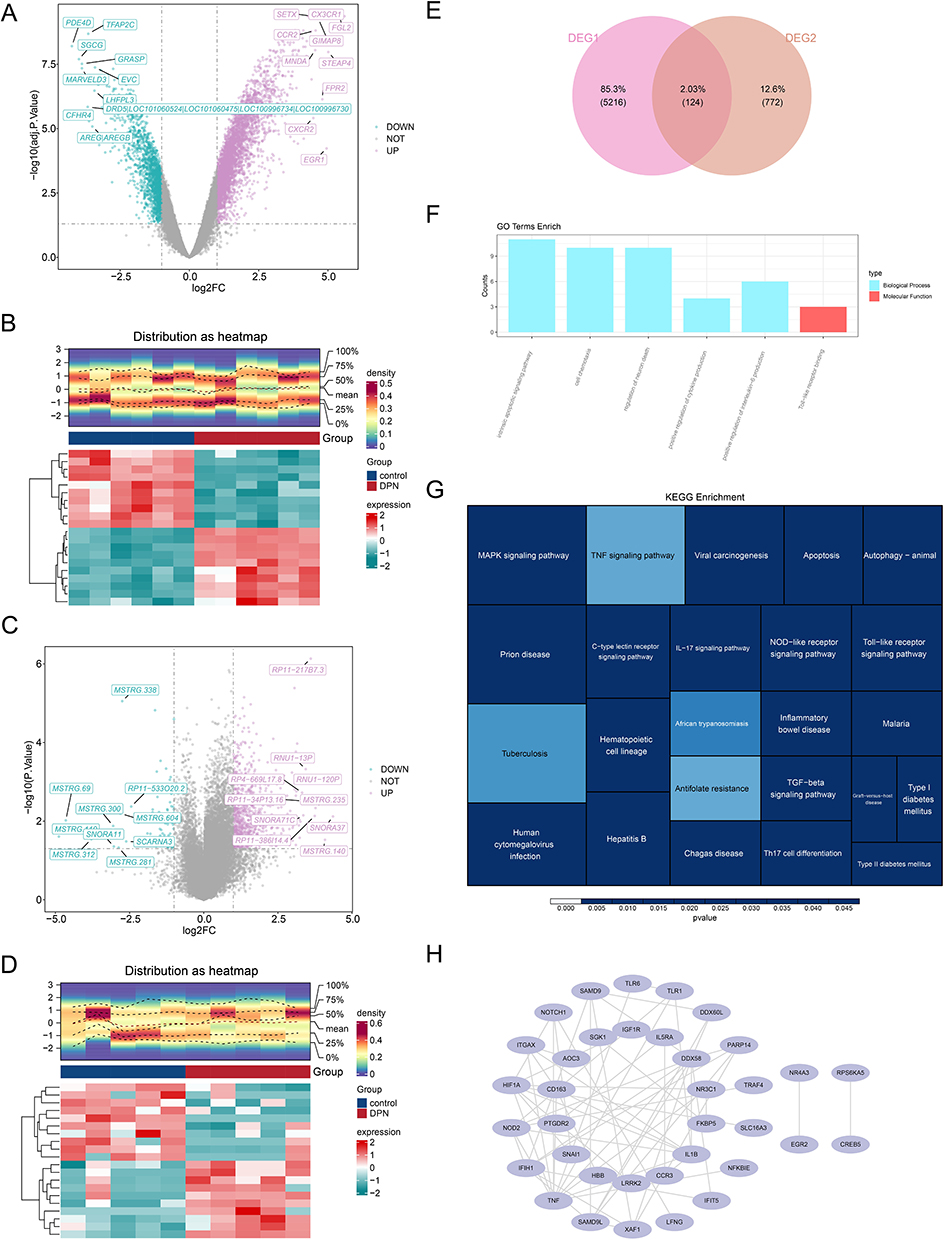 |
Figure 1 Results of differential expression analysis. (A) The volcano plot of differential genes in the GSE95849 dataset, with blue representing down-regulated genes and purple representing up-regulated genes; (B) The heatmap plot of differential genes in the GSE95849 dataset; (C)The volcano plot of differential gene expression in the GSE185011 dataset; (D) The heatmap plot of differential genes in the GSE185011 dataset; (E) The Venn diagrams for DEG1 and DEG2; (F) Results of GO enrichment analysis (P < 0.05); (G) Results of KEGG enrichment analysis (P < 0.005); (H) Results of PPI network. |
TNF, OSBPL8, IER3, SLC16A3, CREB5, and LRWD1 Were Significantly and Causally Associated with DPN
A total of six DE-DPN-RGs causally associated with DPN were screened as candidate biomarkers for DPN. Among them, TNF was a protective factor for DPN (OR < 1, P < 0.05). OSBPL8, IER3, SLC16A3, CREB5, and LRWD1 were risk factors for DPN (OR > 1, P < 0.05) (Figure 2A). The scatter plot further demonstrated this result. TNF had a negative slope and was a protective factor for DPN, whereas OSBPL8, IER3, SLC16A3, CREB5, and LRWD1 had positive slopes and were risk factors for DPN (Figure S1). The results based on the IVW algorithm showed that the distribution of SNP loci for the diagnostic efficacy of DPN in the data of TNF was all less than zero in the forest plot, which further suggested that TNF was protective factor for DPN. In contrast, the distribution of SNP loci diagnostic of DPN efficacy in the OSBPL8, IER3, SLC16A3, CREB5, and LRWD1 data were all greater than zero, which further suggested that all of these genes were risk factors for DPN (Figure S2). SNPs were uniformly and randomly distributed on both sides of the IVW line, suggesting that the analyses followed Mendel’s second law (Figure S3).
 |
Figure 2 The forest map of candidate biomarkers. (A) Six DE-DPN-RGs exhibit causal associations with DPN; (B) Results of multifactorial Mendelian randomisation analysis. |
The results of the heterogeneity test indicated that there was no heterogeneity between the DE-DPN-RGs (OSBPL8, SLC16A3, CREB5, LRWD1, and TNF) dataset and the DPN dataset (p > 0.05). Although the p-value of IER3 was less than zero, the heterogeneity did not affect the results too much due to the IVW algorithm used (Table 1). Moreover, the results of the horizontal polytropy test proved that there was no influence of confounding factors in the analysis of this study (p > 0.05) (Table 2). Also, MR-PRESSO results confirmed the absence of horizontal pleiotropy between them (Table 3). Then, in the causal relationship between these six candidate biomarkers and DPN did not change significantly by excluding a SNP, which confirmed the stability of the result (Figure S4). Additionally, the six candidate biomarkers passed the Steiger test (p < 0.0001), confirming the reliability of the forward analysis of causality (Table 4). Finally, the results of the MVMR analysis showed that TNF remained a protective factor for DPN, and OSBPL8, IER3, SLC16A3, CREB5, and LRWD1 remained risk factors for DPN (Figure 2B).
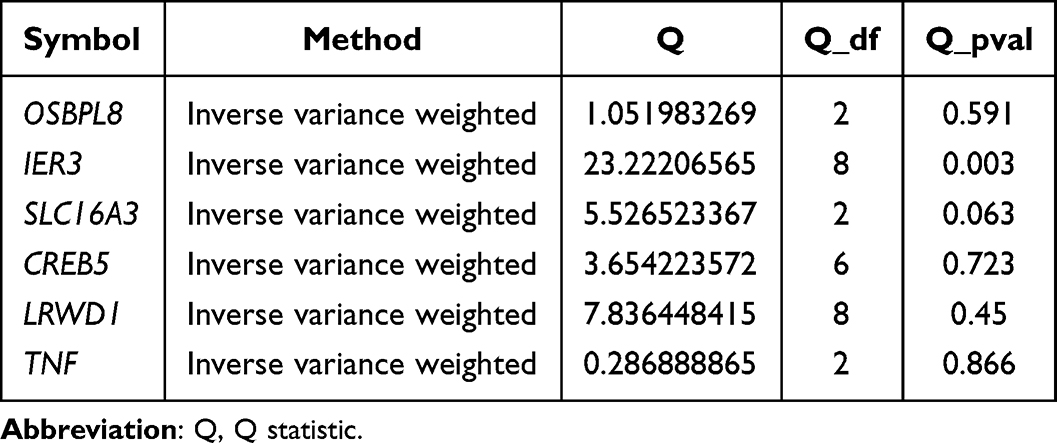 |
Table 1 Results of MR Heterogeneity Test Analysis |
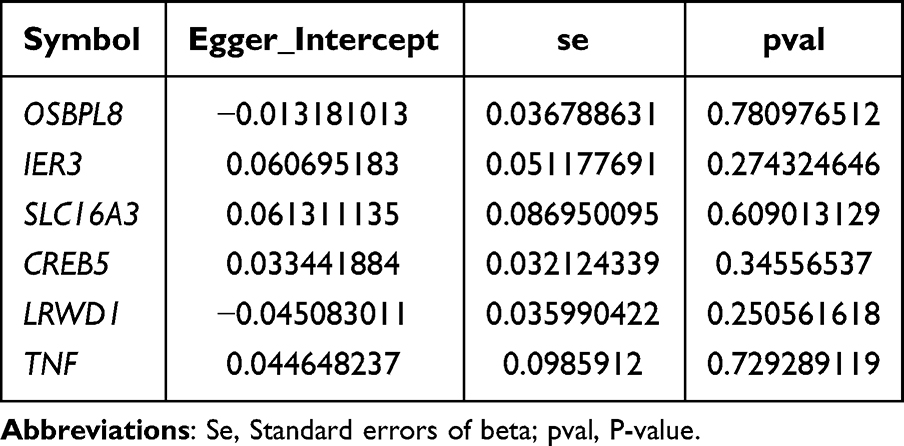 |
Table 2 Results of MR Level Multiple Validity Test Analysis |
 |
Table 3 Results of the Analysis of the MR-PRESSO Horizontal Multiple Validity Test |
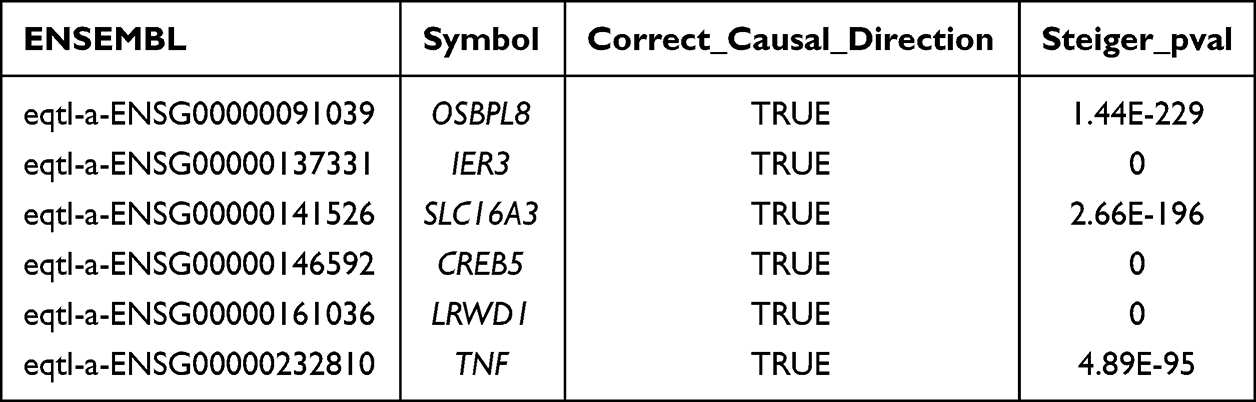 |
Table 4 Reverse Causality Analysis |
CREB5, LRWD1, OSBPL8, and SLC16A3 Were Biomarkers of DPN
Validation in the GSE185011 dataset showed that the expression levels of CREB5, LRWD1, OSBPL8, and SLC16A3 were significantly different between DPN and controls, with consistent trends in the GSE95849 dataset, and that they were upregulated in DPN (Figure 3A and B). Therefore, these four genes were credited as biomarkers of DPN. Subsequently, the GSEA results demonstrated the signaling pathways in which the biomarkers were involved. GSEA results showed that the signaling pathways co-enriched by these four biomarkers were “metabolic reaction groups of amino acids and derivatives”, “rRNA processing”, and “translation” (Figure 3C–F).
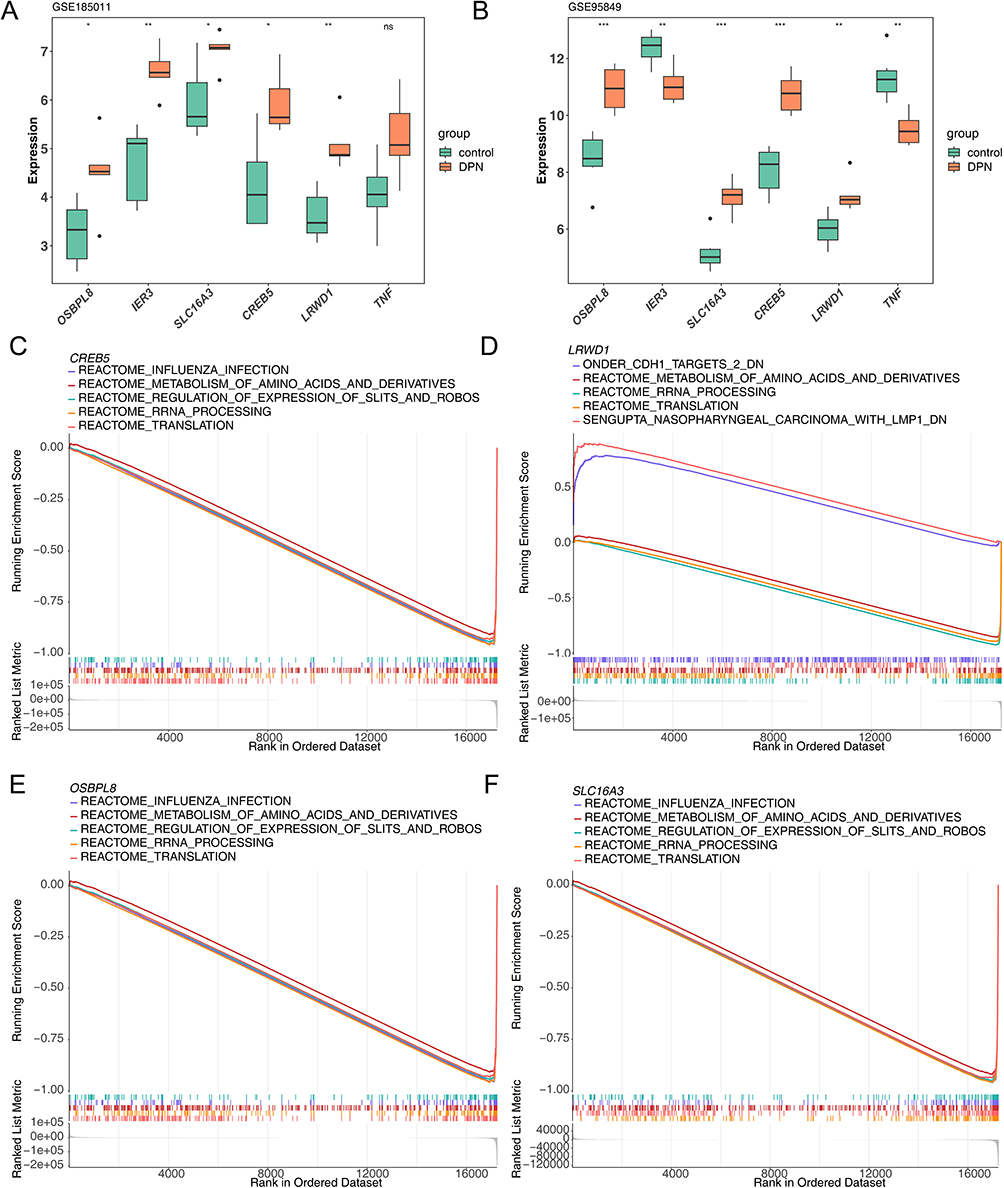 |
Figure 3 The results of expression validation analyses and GSEA enrichment analyses. The expression results of biomarkers in GSE185011 dataset (A) andGSE95849 (B); *: P < 0.05, **: P < 0.01, ***: P < 0.001, ns, no significance. The results of GSEA analysis of four biomarkers (C–F). |
Functions and Functional Associations of Biomarkers
GSVA results showed significantly different biological pathways. Among them, “reactive protein NF-κb activation through fadd rip 1 pathway bmediated by caspase 8 and 10”, “biocarta sppa pathway” and “reactome clec7a dectin 1 induces nfat activation” were significantly highly expressed in the high expression group. For example, signaling pathways such as “reactome phospholipase c mediated cascade FGFR4”, and “NF-κb is activated and signals survival”, “PI3K cascade FGFR3”, were significantly highly expressed in the low expression group (Figure 4A–D). The GeneMANIA results showed that there were various relationships between biomarkers and other genes such as co-expression, the same location, physical interactions, genetic interactions, sharing protein structural domains, or participating in the same pathway. Among them, LRWD1 interacted most closely with ORC5 and ORC2 (Figure 4E). Furthermore, the results of the Friends analysis demonstrated a low functional similarity between the four biomarkers (functional similarity score < 0.5) (Figure 4F).
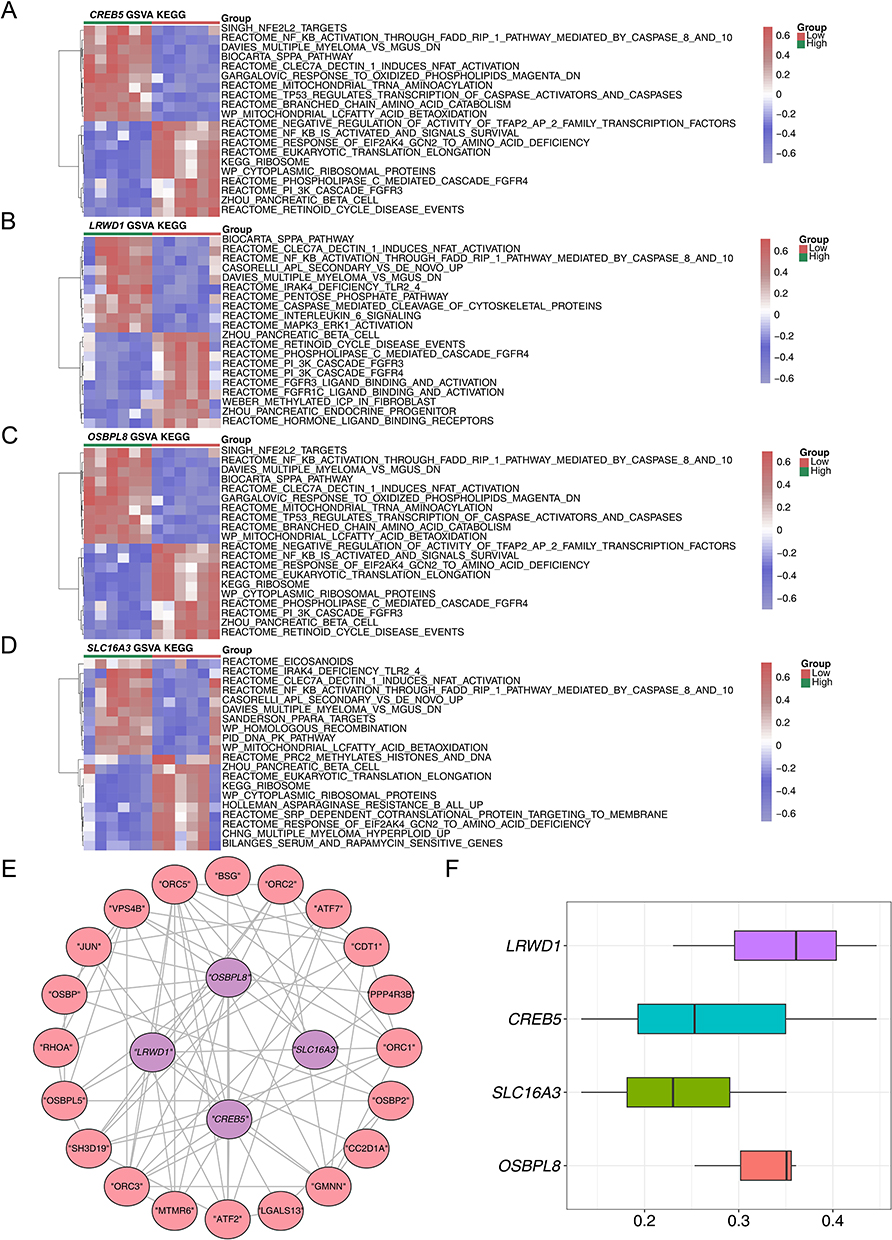 |
Figure 4 The GSVA enrichment analysis and GeneMANIA database analysis. (A–D) The Heatmap of GSVA analysis of four biomarkers; (E) The GeneMANIA analysis results; (F) The Results of Fhorends analysis. |
Subcellular Localization of Biomarkers and Where Biomarkers Undergo m6A Methylation
SLC16A3, CREB5 and LRWD1 were detected in the cytoplasmic region, whereas OSBPL8 was detected as up-regulated in the extracellular region. SLC16A3 was also detected in the endoplasmic reticulum (Figure 5A). Meanwhile, the predicted locations of biomarkers susceptible to m6A methylation showed that CREB5 was more susceptible to m6A methylation at positions 0 to 1000 of the base (Figure 5B). LRWD1 was prone to m6A methylation at about 1000,1500, and 2000 base positions (Figure 5C). SLC16A3 was found to be susceptible to m6A methylation at around 1500 to 2000 base positions (Figure 5D). OSBPL8 was susceptible to m6A methylation at around 60 base positions (Figure 5E).
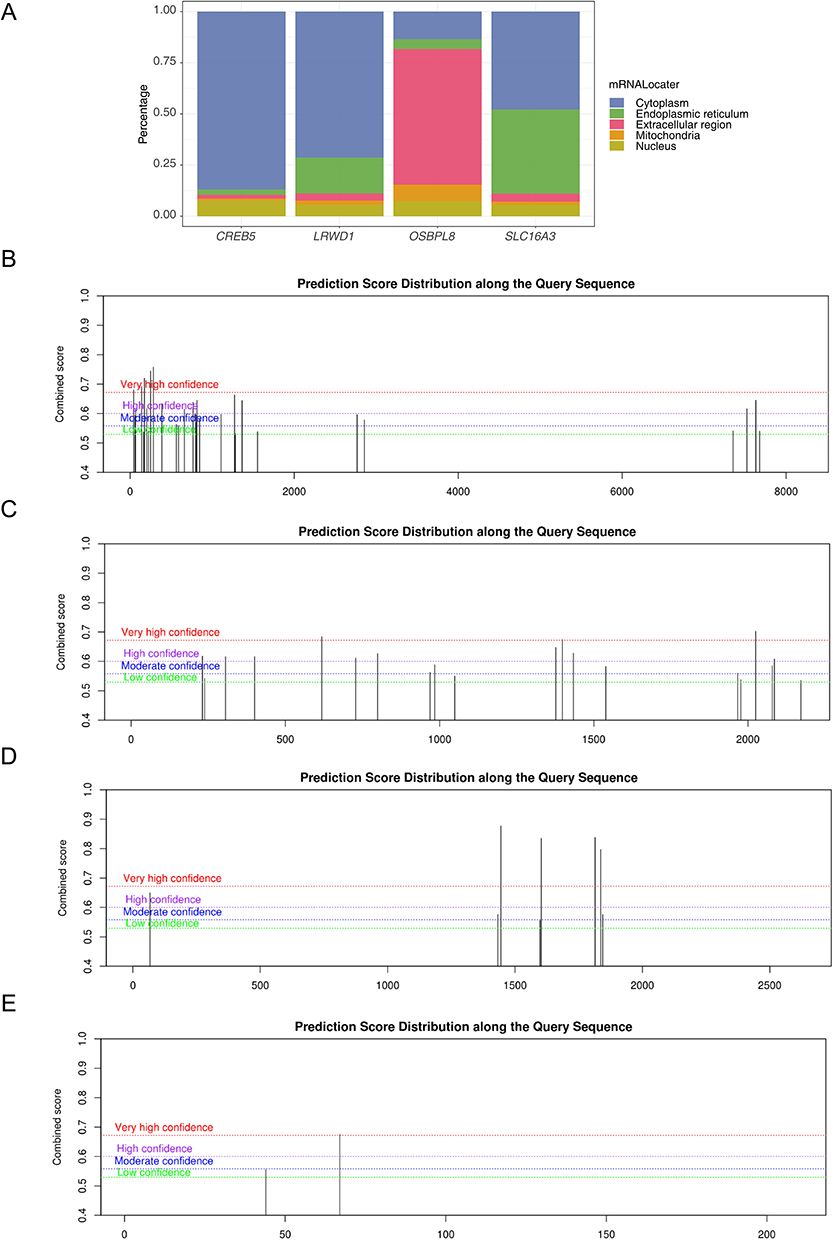 |
Figure 5 The results of subcellular localisation and m6A binding site prediction of key genes. (A) Subcellular localisation results for biomarkers; The results of methylation analysis of four biomarkers, (B) CREB5 (C) LRWD1 (D) SLC16A3 (E) OSBPL8. |
Molecular Regulatory Network of DPN and Its Potential Target Drugs
A total of 54 miRNAs were obtained by taking the intersection of the two database predictions. A total of 759 lncRNAs were predicted based on 54 miRNAs. Based on this, a ceRNA network was constructed with OSBPL8 and CREB5 (Figure 6A). Meanwhile, CREB5 and OSBPL8 predicted 28 TFs and 20 TFs, respectively, and a TF-mRNA-miRNA regulatory network was constructed by combining the predicted miRNAs (Figure 6B). Where PBX3, ETS1, EP300, CREBBP, and BRD4 were TFs predicted by CREB5 and OSBPL8. In addition, there are 43 targeted drugs available for DPN treatment (Figure 6C). Examples included rosuvastatin, nitrofurfurylhydrazine, and neostigmine bromide.
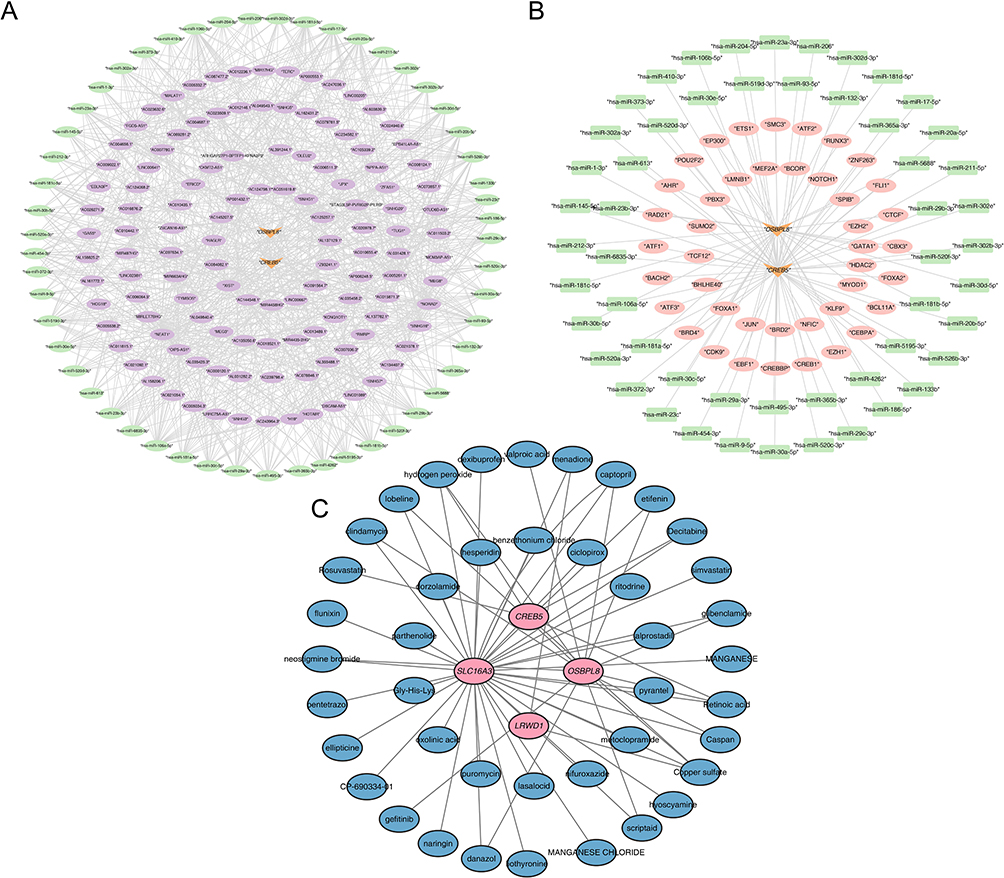 |
Figure 6 The ceRNA regulatory network analysis, TF-mRNA-miRNA network construction and drug prediction results. (A) A Map of a ceRNA network constructed by OSBPL8 and CREB5; (B) TF-mRNA-miRNA regulatory network; (C) A targeted drug prediction map for DPN treatment based on OSBPL8 and CREB5. |
All Four Biomarkers Were Highly Expressed in the DPN Group by RT-qPCR
As verified by RT-qPCR, the expression levels of CREB5, LRWD1, OSBPL8, and SLC16A3 were higher in the DPN group, which was consistent with the trend in the GSE185011 and GSE95849 datasets, with only OSBPL8 showing a non-significant difference between groups (Figure 7).
 |
Figure 7 The expression results verified by RT-qPCR. *: P < 0.05, **: P < 0.01, ns, no significance. |
Discussion
As one of the most prevalent complications of diabetes, DPN significantly impairs patients’ quality of life.43 The therapeutic efficacy of DPN is often suboptimal, and the treatment duration is typically prolonged. Therefore, early diagnosis plays a pivotal role in facilitating timely treatment initiation, which in turn contributes to achieving favorable treatment outcomes, and alleviating the associated economic burden. However, the absence of precise indicators for early DPN detection has hindered the development of accurate diagnostic modalities.8 In this study, we identified six candidate biomarkers, TNF, OSBPL8, IER3, SLC16A3, CREB5, LRWD1 through transcriptomics and MR techniques. We found that TNF is a protective factor for DPN. Conversely, the remaining five genes were identified as risk factors for the development of DPN. To enhance the stability and reliability of our findings, we conducted expression validation analyses for these six candidate biomarkers. Among them, the four candidate biomarkers with significant expression and the same trend between the training and validation sets were recorded as the biomarkers: OSBPL8, SLC16A3, CREB5, and LRWD1. Additionally, elucidating the molecular mechanisms holds paramount importance for advancing clinical research on DPN and enhancing our understanding of its pathogenesis.
OSBPL8, belonging to the oxysterol-binding protein-like (OSBPL) family, serves as a crucial intracellular lipid binding and transport protein involved in lipid transportation and cholesterol level regulation.44 OSBP-related protein 8 (ORP8), encoded by OSBPL8, is targeted for silencing by miR-143, a micro-RNA associated with obesity, diabetes and cancer.45 Decreased expression of ORP8 in cultured hepatocytes has been shown to impairaffects insulin-induced AKT activation. Furthermore, induced transgenic overexpression of miR-143 impairs insulin-stimulated AKT activation and glucose homeostasis, suggesting that the miR-143-ORP8 pathway may represent a potential target for obesity-associated diabetes mellitus.46 Specifically, this study demonstrates a causal relationship between OSBPL8 and DPN. We speculate that OSBPL8 may affect DPN through the miR-143-ORP8 pathway.
SLC16A3 (MCT4) belongs to the monocarboxylate transporter (MCT) family, facilitating the transport of pH-dependent monocarboxylates such as lactic acid and pyruvic acid.47 Recent investigations indicate that lactic acid enhances neuronal mitochondrial metabolism and energy generation in peripheral nerves.48 DPN apparently involves metabolic dysfunction and energy depletion of multiple cells within the peripheral nervous system, implying a robust association between SLC16A3 and DPN. Moreover, the spatial distribution of MCT within the peripheral nervous system (PNS) hints at its potential involvement in lactic acid transport and myelination.49 Notably, a study revealed that the experimental exacerbation of DPN was associated with a reduction in monocarboxylate transporter-1 (MCT1).50
CREB5 is a member of the cAMP-response element binding (CREB) protein gene family and is classified under the ATF2 subfamily. This subgroup demonstrates a heightened affinity for cAMP-response elements (CREs) and participates in diverse cellular functions such as survival, proliferation, and glucose metabolism.51 Recent studies have suggested a potential protective role for activated CREB5 in shielding diabetic proximal renal tubule cells from apoptosis.52 Additionally, CREB5 has been associated with the AMPK signaling pathway,53 which is speculated to be pivotal in the pathogenesis of DPN. AMPK-mediated mitochondrial impairment in Schwann cells may instigate demyelination and axonal atrophy, both implicated in the development of the disease.54
LRWD1 is an origin recognition complex (ORC)-associated protein that plays a key role in heterochromatin replication in mammalian cells by recruiting promoter ORCs.55 Few previous studies have associated it with diabetes-related diseases, and this study is the first to find an association between LRWD1 and DPN.
Based on our differential analysis, four candidate biomarkers, CREB5, LRWD1, OSBPL8, and SLC16A3, exhibited significant differential upregulation. Moreover, beyond the the causal relationships found by MR, the consistency of their expression trends was verified in both the training and validation sets. Given these insights, these genes emerge as promising targets for therapeutic intervention in DPN. Further investigation into their molecular mechanisms is imperative to enhance our understanding and unlock their therapeutic potential.
Of particular interest in our GO analysis was toll-like receptor binding. Toll-like receptors (TLRs) are pivotal proteins in the innate immune response, initiating a signaling cascade upon interaction with microbial pathogen-expressed TLR ligands. This cascade leads to the production of cytokine and the initiation of adaptive immune responses. Dysregulated immune mechanisms play a crucial role in the pathogenesis of DPN.56 Among the TLR, TLR4 plays a crucial role in inflammatory diseases.57 DPN is increasingly recognized as a chronic inflammatory condition wherein TLR4 expression in dorsal root ganglia can be induced by high glucose, free fatty acids, and angiotensin II. This induction activates downstream signaling pathways of inflammation, leading to the activation of NF-κB and the subsequent production of inflammatory factors such as TNF-α, prostaglandins, and activated cyclooxygenase (COX), thereby instigating neuroinflammation in DPN.58 Notably, the Toll-like receptor signaling pathway was similarly enriched in our KEGG results. Moreover, TLR4 has been identified as a potentially sensitive diagnostic biomarker for DPN in patients with type 2 diabetes.57 This evidence underscores the significant role of Toll-like receptors in the progression of DPN and suggests that DEGs may influence DPN through the Toll-like receptor signaling pathway.
Our biomarkers underwent further analysis using GSEA to elucidate their molecular mechanisms. They were notably enriched in pathways related to metabolic reactions of amino acids and derivatives, rRNA processing, and translation. While the metabolism of amino acids and their derivatives in DPN has been scarcely described, studies have highlighted their significance in relevant pathways in diabetic foot ulcers (DFU). Furthermore, literature has underscored a significant association between DPN and DFU,59 with DPN serving as a significant initiating risk factor for DFU development.60 Although a causal relationship between the two variables was not established in our study, it’s worth noting their interconnectedness. Moreover, GSVA analyses revealed enrichment of the NF-κB pathway, consistent with the potential for neuroinflammation in DPN via the production of inflammatory factors. This further underscores the importance of the signaling pathways involving key genes in DPN progression. Additionally, CREB5 is markedly activated in proximal renal tubular epithelial cells of diabetic patients52 and has been found to regulate the MET signaling pathway crucial for colorectal cancer metastasis.61 OSBPL8 overexpression has been observed in cholangiocarcinomas.62 SLC16A3 is abnormally upregulated at the plasma membrane of cardiomyocytes from patients with type 2 diabetes63 and its role in intracellular pH regulation and lactate-based metabolism has been explored in various cancers, including colorectal, breast, and lung cancers.64 In summary, these biomarkers are not only implicated in the pathogenesis of DPN and diabetes-related diseases but also play roles in cancer, providing potential avenues for the treatment of related cancers.
In order to delve into the genes linked with biomarkers functions and elucidate the functional correlations among different genes, we conducted GeneMANIA analysis alongside functional correlation analysis. GeneMANIA analysis revealed that LRWD1 interacts most closely with ORC5 and ORC2. LRWD1 interacts directly with the N-terminus of ORC2, and the stability of LRWD1 depends on its binding to ORC2.65 The interaction of LRWD1 with ORC5 has been rarely mentioned in previous studies. Notably, the functional similarity among these four biomarkers was observed to be modest. Furthermore, we undertook subcellular localization analysis and predicted m6A binding sites for the biomarkers to gain deeper insights into their roles. The subcellular localization provides important information about the function and activity of biomarkers in the cell. DNA methylation of the SLC16A3 promoter regulates MCT4 expression and affects clinical outcomes in renal cancer.66 Hypomethylation of CREB5 upregulates CREB5, thereby altering trophoblast cell function.67 Thus, m6A binding site prediction results indicate that m6A methylation of these genes at different base positions may have an impact on their function and regulation. It provides important guidance and insights for further studies in the future.
To delve deeper into the functions and regulatory mechanisms of the biomarkers, we analyzed competing endogenous RNA (ceRNA) regulatory networks. In this regard, we identified 54 miRNA target genes and predicted 759 lncRNA target genes based on these miRNAs to construct a lncRNA-miRNA-key gene regulatory network. Notably, HSA-miR-23a-3p, a member of a major miRNA family involved in regulating T-cell immune responses, exhibited significant reduction in diabetic patients. Inhibition of the NF-κB pathway by HSA-miR-23a-3p has been shown to suppress the expression of pro-inflammatory molecules and angiogenic potential, potentially ameliorating neuroinflammation in DPN.68 Additionally, miR-23a has been implicated in inhibiting high glucose-induced inflammation in microglia by down-regulating PDE4B, attenuating DPN.69 Moreover, in individuals with type 1 diabetes and long-term metabolic syndrome, HSA-miR-495-3p is downregulated, and previous studies have linked this miRNA to immune and inflammatory responses.70 Notably, in patients with DFU, tissue-specific expression of miR-23a and miR-23b was low, while miR-23c was elevated.71 Considering the association of DPN with DFU, we posit that HSA-miR-23a-3p, HSA-miR-495-3p, HSA-miR-23b-3p and HSA-miR-23c could potentially be ceRNA pathways implicated in DPN regulation. However, further experiments are warranted to confirm this hypothesis.
Additionally, we constructed a transcription factor (TF) regulatory network of key genes to explore the relationships between transcription factors, miRNAs, and key genes. Predicted TFs by OSBPL8 and CREB5 included PBX3, ETS1, EP300, CREBBP, and BRD4. Among them, CREBBP and EP300 have been found to be significant for DPN diagnosis, potentially affecting DPN by influencing lipid metabolism toxicity or inflammatory processes triggered by inflammatory stimuli.72 Furthermore, BRD4 plays a pivotal role in the pathogenesis of high glucose-induced cardiomyocyte hypertrophy through the AKT pathway.73 Based on existing studies, it’s evident that some predicted transcription factors are indeed involved in DPN regulation, shedding light on the pathogenesis of DPN. This offers new perspectives and clues for a comprehensive understanding of DPN pathogenesis.
In addition, we conducted drug predictions for the four biomarkers, yielding a total of 43 potential drugs. Among these, examples include Rosuvastatin and Neostigmine Bromide. Studies have recognized that Rosuvastatin may alleviate DPN through its anti-fibrotic synergy.74 Neostigmine bromide functions by inhibiting the enzymatic cleavage of acetylcholine, thereby reversibly inhibiting acetylcholinesterase. Consequently, it can persist in cholinergic nerve endings for an extended period, eliciting an excitatory effect on smooth and skeletal muscles. Furthermore, we substantiated biomarker expression through RT-qPCR, with outcomes aligning consistently with the observed trends across the two datasets employed in our study. Four biomarkers were highly expressed in the DPN group, with only OSBPL8 showing a non-significant difference between groups. This observation may be attributed to the constrained sample size utilized for RT-qPCR validation.
It is noteworthy that the present study has certain limitations that warrant attention in subsequent research. Our analysis was conducted using retrospective data derived from public datasets, which may introduce case selection bias and limit the generalizability of our findings. Consequently, the diagnostic and predictive utility of biomarkers in DPN requires further validation through large-scale clinical trials. Additionally, the regulatory mechanisms of these biomarkers in DPN need to be further elucidated through functional and mechanistic studies.
Conclusion
In conclusion, our study leveraged transcriptomic analysis to pinpoint genes exhibiting significant differential expression between disease and control groups. Subsequently, we employed both univariate and multivariate MR studies. This allowed us to elucidate the causal relationships between DE-DPN-RGs and DPN, yielding more reliable findings and and the identification of four potential biomarkers related to DPN: SLC16A3, CREB5, OSBPL8 and LRWD1. Moving forward, we intend to closely monitor the progress of these biomarkers and targeted drugs. Our study possesses several noteworthy limitations that warrant consideration. First, the clinical utility of biomarkers necessitates validation across diverse patient populations. Moreover, the targeted drugs identified in our study require thorough validation through extensive clinical trials before obtaining approval for clinical application. Ultimately, our findings offer new insights into the prevention and treatment of DPN, paving the way for novel strategies and directions in early diagnosis.
Abbreviations
DPN, diabetic peripheral neuropathy; MR, mendelian randomization; DEGs, differentially expressed genes; DE-DPN-RGs, DPN-related differentially expressed genes; RT-qPCR, reverse transcription quantitative polymerase chain reaction; LS, least squares; NE, not estimable; IVs, instrumental variables; NCS, nerve conduction studies; GEO, gene expression omnibus; eQTL, expression quantitative trait locus; SNPs, single nucleotide polymorphisms; FC, fold-change; GO, gene ontology; KEGG, kyoto encyclopedia of genes and genomes; PPI, protein-protein interaction; LD, linkage disequilibrium; MVMR, multivariable mendelian randomization; WM, weighted median; MR Egger, mendelian randomization egger regression; OR, odds ratio; GSEA, gene set enrichment analysis; SRAMP, sequence-based RNA adenosine methylation site predictor database; miRDB, a database for microRNA target prediction; TargetScan, a computational tool for predicting microRNA targets; Starbase, a database for analyzing noncoding RNA interactions; ceRNA, competing endogenous RNA; TF, transcription factor; DsigDB, drug signatures database; FADD, fas-associated protein with death domain; RIP1, receptor-interacting protein kinase 1; CLEC7A, c-type lectin domain family 7 member A; NFAT, nuclear factor of activated T-cells; FGFR4, fibroblast growth factor receptor 4; PI3K, phosphatidylinositol 3-kinase; ORC5 and ORC2, origin recognition complex subunits 5 and 2; CREB5, cAMP response element binding protein 5; LRWD1, leucine rich WD repeat containing 1; OSBPL8, oxysterol binding protein like 8.
Data Sharing Statement
The datasets [GSE95849 and GSE185011] for this study can be found in [the Gene Expression Ontology (GEO)] [https://www.ncbi.nlm.nih.gov/geo]. The datasets [finn-b-DM_NEUROPATHY] for this study can be found in [IEU OpenGWAS] [https://gwas.mrcieu.ac.uk/].
Ethics Approval and Informed Consent
The study was conducted in accordance with the Declaration of Helsinki, and approved by the Medical Ethics Committee of Zunyi Medical University (protocol code [2022] 1-063 and date of approval: March 7, 2022).
Consent to Participate
Participants in this study were given a detailed and clear explanation of the research aims, methods, potential risks, and benefits. They were informed that their participation was entirely voluntary and that they could withdraw from the study at any time. They were also offered the opportunity to ask questions and provided written informed consent before joining the study.
Acknowledgments
We would like to express our sincere gratitude to all individuals and organizations who supported and assisted us throughout this research.
Funding
This research was funded by the National Natural Science Foundation of China, grant number 82260167 and 82460167; Guizhou Science and Technology Association Youth Science and Technology Talent Promotion Project (No. GASTYESS202434); Science and Technology Planning Project of Guizhou Province, grant number Guizhou department combine basics-ZK[2022] General 639; Kweichow Moutai Hospital science and technology innovation project by MTyk2022-42.
Disclosure
The authors declare that they have no competing interests in this work.
References
1. Zimmet P, Alberti KG, Magliano DJ, Bennett PH. Diabetes mellitus statistics on prevalence and mortality: facts and fallacies. Nat Rev Endocrinol. 2016;12(10):616–622. doi:10.1038/nrendo.2016.105
2. Magliano DJ, Boyko EJ. IDF Diabetes Atlas. 2021.
3. Hicks CW, Selvin E. Epidemiology of Peripheral Neuropathy and Lower Extremity Disease in Diabetes. Curr Diab Rep. 2019;19(10):86. doi:10.1007/s11892-019-1212-8
4. Singh R, Kishore L, Kaur N. Diabetic peripheral neuropathy: current perspective and future directions. Pharmacol Res. 2014;80:21–35. doi:10.1016/j.phrs.2013.12.005
5. Edwards JL, Vincent AM, Cheng HT, Feldman EL. Diabetic neuropathy: mechanisms to management. Pharmacol Ther. 2008;120(1):1–34. doi:10.1016/j.pharmthera.2008.05.005
6. Elafros MA, Andersen H, Bennett DL, et al. Towards prevention of diabetic peripheral neuropathy: clinical presentation, pathogenesis, and new treatments. Lancet Neurol. 2022;21(10):922–936. doi:10.1016/S1474-4422(22)00188-0
7. Yu Y. Gold Standard for Diagnosis of DPN. Front Endocrinol. 2021;12:719356. doi:10.3389/fendo.2021.719356
8. Selvarajah D, Kar D, Khunti K, et al. Diabetic peripheral neuropathy: advances in diagnosis and strategies for screening and early intervention. Lancet Diabetes Endocrinol. 2019;7(12):938–948. doi:10.1016/S2213-8587(19)30081-6
9. Li W, Wang R, Wang W. Exploring the causality and pathogenesis of systemic lupus erythematosus in breast cancer based on Mendelian randomization and transcriptome data analyses. Front Immunol. 2022;13:1029884. doi:10.3389/fimmu.2022.1029884
10. Smith GD, Lawlor DA, Harbord R, Timpson N, Day I, Ebrahim S. Clustered environments and randomized genes: a fundamental distinction between conventional and genetic epidemiology. PLoS Med. 2007;4(12):e352. doi:10.1371/journal.pmed.0040352
11. Zhang Y, Tang Z, Tong L, Wang Y, Li L. Serum uric acid and risk of diabetic neuropathy: a genetic correlation and mendelian randomization study. Front Endocrinol. 2023;14:1277984. doi:10.3389/fendo.2023.1277984
12. Zou L, Zhu D, Gong M, Yu J. The influence of genetic predisposition to oxidative stress on painful diabetic peripheral neuropathy: a mendelian randomization study. Cell Mol Bio. 2024;70(3):168–173.
13. Soares L, Villalba Silva GC, Kubaski F, Giugliani R, Matte U. MPSBase: comprehensive repository of differentially expressed genes for mucopolysaccharidoses. Mol Genet Metab. 2021;133(4):372–377. doi:10.1016/j.ymgme.2021.06.004
14. Luo L, Zhou WH, Cai JJ, et al. Gene Expression Profiling Identifies Downregulation of the Neurotrophin-MAPK Signaling Pathway in Female Diabetic Peripheral Neuropathy Patients. J Diabetes Res. 2017;2017:8103904. doi:10.1155/2017/8103904
15. Hui Z, Chen YM, Gong WK, et al. Shared and specific biological signalling pathways for diabetic retinopathy, peripheral neuropathy and nephropathy by high-throughput sequencing analysis. Diab Vasc Dis Res. 2022;19(4):14791641221122918. doi:10.1177/14791641221122918
16. Yuan JX, Jiang Q, Yu SJ. Diabetes mellitus and prostate cancer risk: a mendelian randomization analysis. World J Diabetes. 2023;14(12):1839–1848. doi:10.4239/wjd.v14.i12.1839
17. Ritchie ME, Phipson B, Wu D, et al. limma powers differential expression analyses for RNA-sequencing and microarray studies. Nucleic Acids Res. 2015;43(7):e47. doi:10.1093/nar/gkv007
18. He Z, Jiang Q, Li F, Chen M. Crosstalk between Venous Thromboembolism and Periodontal Diseases: a Bioinformatics Analysis. Dis Markers. 2021;2021:1776567. doi:10.1155/2021/1776567
19. Karobari MI, Batul R, Khan M, et al. Micro computed tomography (Micro-CT) characterization of root and root canal morphology of mandibular first premolars: a systematic review and meta-analysis. BMC Oral Health. 2024;24(1):1. doi:10.1186/s12903-023-03624-5
20. Wang M, Fu L, Tian J, Zhang Y, Rossi L, Wang K. Function and prognosis analysis of nucleolus protein DCAF13 in breast cancer. Transl Cancer Res. 2023;12(12):3744–3751. doi:10.21037/tcr-23-1923
21. Yu G, Wang LG, Han Y, He QY. clusterProfiler: an R package for comparing biological themes among gene clusters. OMICS. 2012;16(5):284–287. doi:10.1089/omi.2011.0118
22. Beckman MF, Brennan EJ, Igba CK, Brennan MT, Mougeot FB, Mougeot JC. A Computational Text Mining-Guided Meta-Analysis Approach to Identify Potential Xerostomia Drug Targets. J Clin Med. 2022;11(5):1442. doi:10.3390/jcm11051442
23. Shannon P, Markiel A, Ozier O, et al. Cytoscape: a software environment for integrated models of biomolecular interaction networks. Genome Res. 2003;13(11):2498–2504. doi:10.1101/gr.1239303
24. Burgess S, Thompson SG. Interpreting findings from Mendelian randomization using the MR-Egger method. Eur J Epidemiol. 2017;32(5):377–389. doi:10.1007/s10654-017-0255-x
25. Hemani G, Tilling K, Davey Smith G. Orienting the causal relationship between imprecisely measured traits using GWAS summary data. PLoS Genet. 2017;13(11):e1007081. doi:10.1371/journal.pgen.1007081
26. Burgess S, Scott RA, Timpson NJ, Davey Smith G, Thompson SG. Using published data in Mendelian randomization: a blueprint for efficient identification of causal risk factors. Eur J Epidemiol. 2015;30(7):543–552. doi:10.1007/s10654-015-0011-z
27. Bowden J, Davey Smith G, Haycock PC, Burgess S. Consistent Estimation in Mendelian Randomization with Some Invalid Instruments Using a Weighted Median Estimator. Genet Epidemiol. 2016;40(4):304–314. doi:10.1002/gepi.21965
28. Bowden J, Davey Smith G, Burgess S. Mendelian randomization with invalid instruments: effect estimation and bias detection through Egger regression. Int J Epidemiol. 2015;44(2):512–525. doi:10.1093/ije/dyv080
29. Hemani G, Zheng J, Elsworth B, et al. The MR-Base platform supports systematic causal inference across the human phenome. Elife. 2018;7:e34408. doi:10.7554/eLife.34408
30. Hartwig FP, Davey Smith G, Bowden J. Robust inference in summary data Mendelian randomization via the zero modal pleiotropy assumption. Int J Epidemiol. 2017;46(6):1985–1998. doi:10.1093/ije/dyx102
31. Duan X, Xing F, Zhang J, et al. Bioinformatic analysis of related immune cell infiltration and key genes in the progression of osteonecrosis of the femoral head. Front Immunol. 2023;14:1340446. doi:10.3389/fimmu.2023.1340446
32. Wu T, Hu E, Xu S, et al. clusterProfiler 4.0: a universal enrichment tool for interpreting omics data. Innovation. 2021;2(3):100141. doi:10.1016/j.xinn.2021.100141
33. Guo L, Yuan M, Jiang S, Jin G, Li P. Expression of pyroptosis-associated genes and construction of prognostic model for thyroid cancer. Transl Cancer Res. 2023;12(12):3360–3383. doi:10.21037/tcr-23-810
34. Hu Y, Wu Y, Gan F, et al. Identification of Potential Therapeutic Target Genes in Osteoarthritis. Evid Based Complement Alternat Med. 2022;2022:8027987. doi:10.1155/2022/8027987
35. Tang Q, Nie F, Kang J, Chen W. mRNALocater: enhance the prediction accuracy of eukaryotic mRNA subcellular localization by using model fusion strategy. Mol Ther. 2021;29(8):2617–2623. doi:10.1016/j.ymthe.2021.04.004
36. Hu A, Nussbaum YI, Mitchem J, Yoo J. Colorectal Cancer-Associated Myofibroblasts Exhibit Enhanced Angiogenin Expression and Signaling via the PLXNB2 Receptor. J Surg Res. 2024;296:273–280. doi:10.1016/j.jss.2023.12.036
37. Yan BR, Wang P, Li YS, et al. Roles and mechanisms of m(6)A modification regulating RP11-426A6.5 in laryngeal squamous cell carcinoma. Zhonghua Er Bi Yan Hou Tou Jing Wai Ke Za Zhi. 2022;57(12):1470–1478. doi:10.3760/cma.j.cn115330-20220313-00111
38. Wong N, Wang X. miRDB: an online resource for microRNA target prediction and functional annotations. Nucleic Acids Res. 2015;43(Database issue):D146–52. doi:10.1093/nar/gku1104
39. Li H, Liang J, Wang J, et al. Mex3a promotes oncogenesis through the RAP1/MAPK signaling pathway in colorectal cancer and is inhibited by hsa-miR-6887-3p. Cancer Commun. 2021;41(6):472–491. doi:10.1002/cac2.12149
40. Liu J, Fan Y, Song R, et al. Prostatitis No.1 traditional Chinese medicine significantly exhibited anti-inflammation role on prostatitis through miR-205-5p/YES1. Cell Mol Bio. 2023;69(15):270–276. doi:10.14715/cmb/2023.69.15.45
41. Tram V, Khoa Ta HD, Anuraga G, et al. Dysbindin Domain-Containing 1 in Prostate Cancer: new Insights into Bioinformatic Validation of Molecular and Immunological Features. Int J Mol Sci. 2023;24(15):11930. doi:10.3390/ijms241511930
42. Zhang GZ, Li L, Luo ZB, Zhang CY, Wang YG, Kang XW. Identification and experimental validation of key extracellular proteins as potential targets in intervertebral disc degeneration. Bone Joint Res. 2023;12(9):522–535. doi:10.1302/2046-3758.129.BJR-2022-0369.R2
43. Yang K, Wang Y, Li YW, et al. Progress in the treatment of diabetic peripheral neuropathy. Biomed Pharmacother. 2022;148:112717. doi:10.1016/j.biopha.2022.112717
44. Olkkonen VM. OSBP-Related Protein Family in Lipid Transport Over Membrane Contact Sites. Lipid Insights. 2015;8(Suppl 1):1–9. doi:10.4137/LPI.S31726
45. Santos NC, Girik V, Nunes-Hasler P. ORP5 and ORP8: sterol Sensors and Phospholipid Transfer Proteins at Membrane Contact Sites. Biomolecules. 2020;10(6):928. doi:10.3390/biom10060928
46. Jordan SD, Krüger M, Willmes DM, et al. Obesity-induced overexpression of miRNA-143 inhibits insulin-stimulated AKT activation and impairs glucose metabolism. Nat Cell Biol. 2011;13(4):434–446. doi:10.1038/ncb2211
47. Pinheiro C, Longatto-Filho A, Azevedo-Silva J, Casal M, Schmitt FC, Baltazar F. Role of monocarboxylate transporters in human cancers: state of the art. J Bioenerg Biomembr. 2012;44(1):127–139. doi:10.1007/s10863-012-9428-1
48. Jia L, Liao M, Mou A, et al. Rheb-regulated mitochondrial pyruvate metabolism of Schwann cells linked to axon stability. Dev Cell. 2021;56(21):2980–2994.e6. doi:10.1016/j.devcel.2021.09.013
49. Domènech-Estévez E, Baloui H, Repond C, et al. Distribution of monocarboxylate transporters in the peripheral nervous system suggests putative roles in lactate shuttling and myelination. J Neurosci. 2015;35(10):4151–4156. doi:10.1523/JNEUROSCI.3534-14.2015
50. Jha MK, Ament XH, Yang F, et al. Reducing monocarboxylate transporter MCT1 worsens experimental diabetic peripheral neuropathy. Exp Neurol. 2020;333:113415. doi:10.1016/j.expneurol.2020.113415
51. Conkright MD, Montminy M. CREB: the unindicted cancer co-conspirator. Trends Cell Biol. 2005;15(9):457–459. doi:10.1016/j.tcb.2005.07.007
52. Shi W, Le W, Tang Q, Shi S, Shi J. Regulon analysis identifies protective FXR and CREB5 in proximal tubules in early diabetic kidney disease. BMC Nephrol. 2023;24(1):180. doi:10.1186/s12882-023-03239-6
53. Hong EH, Yeom H, Yu HS, et al. Genome-wide association study of the response of patients with diabetic macular edema to intravitreal Anti-VEGF injection. Sci Rep. 2022;12(1):22527. doi:10.1038/s41598-022-26048-7
54. Zhang Q, Song W, Zhao B, et al. Quercetin Attenuates Diabetic Peripheral Neuropathy by Correcting Mitochondrial Abnormality via Activation of AMPK/PGC-1α Pathway in vivo and in vitro. Front Neurosci. 2021;15:636172. doi:10.3389/fnins.2021.636172
55. Bartke T, Vermeulen M, Xhemalce B, Robson SC, Mann M, Kouzarides T. Nucleosome-interacting proteins regulated by DNA and histone methylation. Cell. 2010;143(3):470–484. doi:10.1016/j.cell.2010.10.012
56. Mu ZP, Wang YG, Li CQ, et al. Association Between Tumor Necrosis Factor-α and Diabetic Peripheral Neuropathy in Patients with Type 2 Diabetes: a Meta-Analysis. Mol Neurobiol. 2017;54(2):983–996. doi:10.1007/s12035-016-9702-z
57. Zhu T, Meng Q, Ji J, Lou X, Zhang L. Toll-like receptor 4 and tumor necrosis factor-alpha as diagnostic biomarkers for diabetic peripheral neuropathy. Neurosci Lett. 2015;585:28–32. doi:10.1016/j.neulet.2014.11.020
58. Aghamiri SH, Komlakh K, Ghaffari M. The crosstalk among TLR2, TLR4 and pathogenic pathways; a treasure trove for treatment of diabetic neuropathy. Inflammopharmacology. 2022;30(1):51–60. doi:10.1007/s10787-021-00919-3
59. Nowak NC, Menichella DM, Miller R, Paller AS. Cutaneous innervation in impaired diabetic wound healing. Transl Res. 2021;236:87–108. doi:10.1016/j.trsl.2021.05.003
60. Boulton AJ, Vileikyte L, Ragnarson-Tennvall G, Apelqvist J. The global burden of diabetic foot disease. Lancet. 2005;366(9498):1719–1724. doi:10.1016/S0140-6736(05)67698-2
61. Wang S, Qiu J, Liu L, et al. CREB5 promotes invasiveness and metastasis in colorectal cancer by directly activating MET. J Exp Clin Cancer Res. 2020;39(1):168. doi:10.1186/s13046-020-01673-0
62. Loilome W, Wechagama P, Namwat N, et al. Expression of oxysterol binding protein isoforms in opisthorchiasis-associated cholangiocarcinoma: a potential molecular marker for tumor metastasis. Parasitol Int. 2012;61(1):136–139. doi:10.1016/j.parint.2011.07.003
63. Ma XM, Geng K, Wang P, Jiang Z, Law BY, Xu Y. MCT4-dependent lactate transport: a novel mechanism for cardiac energy metabolism injury and inflammation in type 2 diabetes mellitus. Cardiovasc Diabetol. 2024;23(1):96. doi:10.1186/s12933-024-02178-2
64. Baek G, Tse YF, Hu Z, et al. MCT4 defines a glycolytic subtype of pancreatic cancer with poor prognosis and unique metabolic dependencies. Cell Rep. 2014;9(6):2233–2249. doi:10.1016/j.celrep.2014.11.025
65. Shen Z, Chakraborty A, Jain A, et al. Dynamic association of ORCA with prereplicative complex components regulates DNA replication initiation. Mol Cell Biol. 2012;32(15):3107–3120. doi:10.1128/MCB.00362-12
66. Fisel P, Kruck S, Winter S, et al. DNA methylation of the SLC16A3 promoter regulates expression of the human lactate transporter MCT4 in renal cancer with consequences for clinical outcome. Clin Cancer Res. 2013;19(18):5170–5181. doi:10.1158/1078-0432.CCR-13-1180
67. Yu M, Du G, Xu Q, et al. Integrated analysis of DNA methylome and transcriptome identified CREB5 as a novel risk gene contributing to recurrent pregnancy loss. EBioMedicine. 2018;35:334–344. doi:10.1016/j.ebiom.2018.07.042
68. Markopoulos GS, Roupakia E, Tokamani M, et al. Roles of NF-κB Signaling in the Regulation of miRNAs Impacting on Inflammation in Cancer. Biomedicines. 2018;6(2):40. doi:10.3390/biomedicines6020040
69. Zhang X, Xia L, Xie A, Liao O, Ju F, Zhou Y. Low concentration of Bupivacaine ameliorates painful diabetic neuropathy by mediating miR-23a/PDE4B axis in microglia. Eur J Pharmacol. 2021;891:173719. doi:10.1016/j.ejphar.2020.173719
70. Swolin-Eide D, Forsander G, Pundziute Lyckå A, et al. Circulating microRNAs in young individuals with long-duration type 1 diabetes in comparison with healthy controls. Sci Rep. 2023;13(1):11634. doi:10.1038/s41598-023-38615-7
71. Amin KN, Umapathy D, Anandharaj A, et al. miR-23c regulates wound healing by targeting stromal cell-derived factor-1α (SDF-1α/CXCL12) among patients with diabetic foot ulcer. Microvasc Res. 2020;127:103924. doi:10.1016/j.mvr.2019.103924
72. Yang Y, Wang Q. Three genes expressed in relation to lipid metabolism considered as potential biomarkers for the diagnosis and treatment of diabetic peripheral neuropathy. Sci Rep. 2023;13(1):8679. doi:10.1038/s41598-023-35908-9
73. Wang Q, Sun Y, Li T, et al. Function of BRD4 in the pathogenesis of high glucose‑induced cardiac hypertrophy. Mol Med Rep. 2019;19(1):499–507. doi:10.3892/mmr.2018.9681
74. El-Sawaf ES, Saleh S, Abdallah DM, Ahmed KA, El-Abhar HS. Vitamin D and rosuvastatin obliterate peripheral neuropathy in a type-2 diabetes model through modulating Notch1, Wnt-10α, TGF-β and NRF-1 crosstalk. Life Sci. 2021;279:119697. doi:10.1016/j.lfs.2021.119697
 © 2025 The Author(s). This work is published and licensed by Dove Medical Press Limited. The
full terms of this license are available at https://www.dovepress.com/terms
and incorporate the Creative Commons Attribution
- Non Commercial (unported, 4.0) License.
By accessing the work you hereby accept the Terms. Non-commercial uses of the work are permitted
without any further permission from Dove Medical Press Limited, provided the work is properly
attributed. For permission for commercial use of this work, please see paragraphs 4.2 and 5 of our Terms.
© 2025 The Author(s). This work is published and licensed by Dove Medical Press Limited. The
full terms of this license are available at https://www.dovepress.com/terms
and incorporate the Creative Commons Attribution
- Non Commercial (unported, 4.0) License.
By accessing the work you hereby accept the Terms. Non-commercial uses of the work are permitted
without any further permission from Dove Medical Press Limited, provided the work is properly
attributed. For permission for commercial use of this work, please see paragraphs 4.2 and 5 of our Terms.
Recommended articles
Screening and Validation of Potential Biomarkers of Immune Cells in Childhood Asthma Patients via Mendelian Randomization and Machine Learning
Zhang Y, Hai Y, Song B, Xu J, Cao L, Yasen R, Xu W, Zhang J, Hu J
Journal of Inflammation Research 2025, 18:2583-2600
Published Date: 21 February 2025
The Intestinal Immune Network for IgA Production is Involved in the Development and Progression of Sepsis: A Multi-Omics Study
Wang YF, Gao S, Gao F, Wu ML, Yang L, Zhang JY, Wang YN, Xu HY
Journal of Inflammation Research 2025, 18:15887-15910
Published Date: 13 November 2025
Identification of Novel Biomarkers and Potential Therapeutic Targets for Systemic Sclerosis: An Integrated Analysis of Plasma Proteome-Wide Mendelian Randomization and Transcriptome
Li H, Li Q, Chen X, Mo L, Wang Y, Liu X, Wang X, Qu Z, Wang J, Li Y
Journal of Inflammation Research 2025, 18:17561-17588
Published Date: 17 December 2025
Dissecting the Causal Pathway from Herpes Zoster to Postherpetic Neuralgia: A Multi-Stage Mendelian Randomization Study Implicating VZV-Specific IgE and Cerebrospinal Fluid Metabolites
Zhang J, Chen Y, Li X, Feng C, Li J, Hu Z, Fan G, Liao X
Journal of Pain Research 2026, 19:581884
Published Date: 1 May 2026