Back to Journals » Breast Cancer: Targets and Therapy » Volume 17
Comprehensive Analysis and Experimental Validation of Single-Cell and Transcriptome Sequencing Reveal SGO2 as a Novel Biomarker for Breast Cancer
Authors Li YF, Yuan Y, Chen C, Zhu ML, Xu SY, Wu SQ, Gao Y, Meng LW
Received 18 August 2025
Accepted for publication 11 November 2025
Published 24 November 2025 Volume 2025:17 Pages 1083—1100
DOI https://doi.org/10.2147/BCTT.S561588
Checked for plagiarism Yes
Review by Single anonymous peer review
Peer reviewer comments 2
Editor who approved publication: Professor Pranela Rameshwar
Yu-Fan Li,1,2 Ying Yuan,1,2 Cheng Chen,2,3 Ming-Liao Zhu,1,2 Shuo-Yang Xu,2,4 Shou-Qian Wu,1 Yuan Gao,2 Li-Wei Meng2
1Medical School of Shaoxing University, Shaoxing, Zhejiang, People’s Republic of China; 2Department of Breast and Thyroid Surgery, Shaoxing People’s Hospital, The First Affiliated Hospital of Shaoxing University, Shaoxing, Zhejiang, People’s Republic of China; 3State Key Laboratory for Diagnosis and Treatment of Infectious Diseases, National Clinical Research Center for Infectious Diseases, The First Affiliated Hospital, Zhejiang University School of Medicine, Hangzhou, Zhejiang, People’s Republic of China; 4The Second Affiliated Hospital, Zhejiang University School of Medicine, Hangzhou, Zhejiang, People’s Republic of China
Correspondence: Li-Wei Meng, Email [email protected]
Purpose: SGO2 maintains the binding of sisters chromatids by protecting the adhesive complex at the centromere, thus ensuring the correct separation of chromosomes during mitosis and meiosis. And this study explored its role in breast cancer (BC) progression.
Methods: SGO2 expression in breast cancer was analyzed utilizing data from TCGA, GTEX, and HPA databases. Our study leveraged clinical data to predict outcomes. Subsequently, we conducted a GSEA enrichment analysis, dove into co-expression profiling, explored immune cell infiltration patterns, examined drug sensitivity, and analyzed single-cell data. To delve deeper, we validated the functional role of SGO2 through in vitro cellular experiments.
Results: Survival analysis demonstrated a notable correlation between heightened SGO2 expression and unfavorable cancer survival rates. Gene set enrichment analysis (GSEA) highlighted the participation of SGO2 in DNA replication. Immunoinfiltration analysis indicated a connection between SGO2 and several immune cell types, with single-cell analysis verifying SGO2 expression across diverse cell populations.
Conclusion: SGO2 may serve as a valuable prognostic biomarker and a potential therapeutic target in breast cancer.
Keywords: SGO2, BRCA, prognosis, immunity
Introduction
Breast cancer represents a prevalent malignancy among women globally, with escalating incidence rates posing significant threats to women’s well-being.1–3 Breast cancer is divided into different molecular types-including Luminal A, Luminal B, HER2-enriched, and triple-negative breast cancer (TNBC)-and these types are determined based on hormone receptors and HER2. Each type has unique biological characteristics, responds differently to treatment, and has different health effects on patients.4 However, simple molecular typing is no longer sufficient for precise treatment of all breast cancers. Consequently, pinpointing new molecular markers, unraveling the intricate molecular processes at play in breast cancer, and crafting specialized treatments have become pivotal focuses in the realm of breast cancer translational research. These endeavors lay the foundation for achieving highly precise therapeutic approaches to combat the disease.5
Shugoshin 2 (SGO2), or SGOL2 as it’s also known, is a key player in the Shugoshin protein family. SGO2 plays a crucial role in ensuring accurate chromosome segregation during eukaryotic cell division, primarily localizing to the centromeric regions where it safeguards proper cohesion and separation of sister chromatids.6 During meiosis I, SGO2 recruits protein phosphatase PP2A to the centromere, where PP2A dephosphorylates cohesin subunits such as Rec8. This protects centromeric cohesin from premature cleavage by separase, thereby maintaining sister chromatid cohesion until homologous chromosomes are properly segregated.7,8 Because aberrant mitotic regulation and genomic instability are hallmarks of breast cancer, dysregulation of SGO2, a centromere-associated protein essential for proper chromosome segregation, may contribute significantly to breast cancer development.
Previous research has highlighted the prognostic relevance of SGO2 across various tumor types, playing a role in cancer advancement. In lung adenocarcinoma, SGO2 correlates with promoting tumor growth, infiltration, dissemination, and the epithelial-to-mesenchymal transformation.9,10 In hepatocellular carcinoma, high SGO2 correlates with poor outcomes, its oncogenic role affecting MAD2 and thus cell cycle regulation.11,12 In prostate cancer, SGO2 contributes to disease progression by upholding RAB1A expression and potentially impacting the tumor microenvironment.13 Moreover, in gliomas, heightened SGO2 expression aligns with diminished survival rates among individuals with high-grade gliomas.14 The comprehensive understanding of SGO2’s function in breast cancer is still incomplete, and further investigation is imperative.
Our analysis of SGO2 expression in breast cancer involved numerous databases. Our investigation encompassed prognostic, functional, immunological, and single-cell analyses, along with in vitro experiments for biological function validation. Through these comprehensive assessments, we infer that SGO2 potentially contributes to the advancement of breast cancer.
Materials and Methods
Data Acquisition
The Cancer Genome Atlas (TCGA) serves as one of the most comprehensive repositories for cancer-related genomic data, encompassing mRNA expression, copy number variation, and SNP information. In this study, we obtained precise mRNA expression data on breast cancer, including 1231 clinical specimens, of which 1118 were tumor samples and 113 were normal controls. Single-cell transcriptomic data was obtained from the NCBI’s Gene Expression Omnibus (GEO). Specifically, dataset GSE228499 was retrieved, and nine samples with complete single-cell expression profiles were included for subsequent single-cell analyses.
Expression and Prognostic Analysis of SGO2 in Breast Cancer
SGO2 expression across multiple tumor types was analyzed using the TIMER database (https://cistrome.shinyapps.io/timer/).15 The GEPIA2,16 BEST,17 and Human Protein Atlas18 platforms were applied to evaluate SGO2 mRNA and protein expression levels, as well as their association with clinicopathological characteristics in breast cancer. The Bc-GenExMiner19 database was used to assess the relationship between SGO2 expression and survival outcomes, including overall survival (OS), disease-free survival (DFS), and distant metastasis-free survival (DMFS).
Co-Expression Analysis
We employed Pearson correlation analysis (r > 0.4, p < 0.05) to identify genes co-expressed with SGO2 in breast cancer, focusing on those with the strongest correlations. The correlation patterns among these genes were visualized using the R packages corrplot and circlize, which respectively generated heatmaps and circular plots to illustrate co-expression networks.
Immune Cell Infiltration Analysis
The CIBERSORT algorithm, which is a deconvolution technique relying on support vector regression, was utilized to evaluate immune infiltration. This method is capable of deducing the make-up of various immune cell subsets by analyzing comprehensive transcriptomic data. The method utilizes a unique 547-gene matrix to differentiate 22 human immune cell types, including T, B cells, plasma cells, and various myeloid groups. We employed the CIBERSORT algorithm to sift through RNA-seq data garnered from breast cancer patients. Our aim was to gauge the proportion of various immune cell subsets and to delve into the potential link between SGO2 expression and the calculated immune cell makeup. We considered statistical significance at the threshold of p < 0.05.
Gene Set Variation Analysis (GSVA)
GSVA is a nonparametric, unsupervised approach for evaluating transcriptome-level gene set enrichment. GSVA takes the small picture of gene expression and blows it up to the grand scheme of pathways by assigning points to sets of genes. This process gives us a clear picture of how biology shifts from one sample to the next. Gene sets for this study were sourced from MSigDB. Then, we let the GSVA algorithm crunch the numbers to give us rich insights into the unique functions at play across our sample set.
Gene Set Enrichment Analysis (GSEA)
Samples were stratified into high and low SGO2 expression groups using the median. Genetic clusters sourced from the Gene Ontology and KEGG repositories within MSigDB, version 7.0. ClusterProfiler analyzed gene set enrichment using normalized enrichment scores and p-values to validate the findings.
Drug Sensitivity Prediction
Drug sensitivity, specifically IC50 values for chemotherapeutic agents in breast cancer samples, was estimated using the GDSC database and the oncoPredict R package. Ridge regression models trained on the GDSC reference data were applied, and model performance was validated via 10-fold cross-validation. Batch effect correction was conducted using the “combat” method, and technical replicate expression values were averaged to ensure measurement consistency.
Single-Cell Clustering and Cell Type Annotation
The researchers utilized the Seurat R package to standardize the preprocessing of individual cell RNA-Seq data. This involved meticulous quality checks, data normalization, dimensionality shrinking, and cluster organization. To map out the clusters spatially, they followed PCA with the powerful Uniform Manifold Approximation and Projection technique (UMAP). For cell type annotation, we utilized a combination of manual curation and automated tools. Canonical marker genes were identified through reference to established cell type databases such as CellMarker and PanglaoDB, as well as relevant published literature. In addition, automated annotation was performed using the SingleR package, which assigns cell identities by correlating query profiles with reference transcriptomes. Marker gene expression was cross-validated across multiple resources to ensure annotation accuracy.
Cell Culture and Transfection
MCF-7, MDA-MB-231, HCC1806, and MCF-10A cell lines (ATCC) were used. The MCF-7, MDA-MB-231, and MCF-10A lines were nurtured in DMEM with high glucose (from Gibco, CT11995500BT), whereas the HCC1806 cells were kept in RPMI-1640 medium (also from Gibco, 11875101). All media were supplemented with 10% fetal bovine serum (Biological Industries, 04-001-1C) and 1% penicillin–streptomycin (Gibco, 15140122). The cells were incubated at 37 °C in a humidified atmosphere containing 5% CO2. For SGO2 silencing, chemically synthesized siRNAs (Hangzhou RuipuTe Biotechnology Co., Ltd.) were transfected using Lipofectamine™ RNAiMAX Transfection Reagent (Invitrogen™, 13778100), following the instructions provided by the manufacturer. Negative control siRNAs were transfected in parallel and served as controls. All experiments were independently repeated at least three times to ensure reproducibility.
Quantitative Reverse Transcription PCR (RT-qPCR)
Following the manufacturer’s protocol to the letter, we extracted total RNA from the designated cell lines using TRIzol Reagent (Ambion, cat. no. 391510, TX, USA). We then whipped up cDNA using the Evo M-MLV RT Master Mix (Accurate Biotechnology, cat. no. AG11706, Changsha, China) for reverse transcription. We then ran RT-qPCR with SYBR® Green Pro Taq HS Premix (Accurate Biotechnology, cat. no. AG11701, Changsha, China). The PCR process was conducted under these conditions: a 30-second blast at 95 °C to denature the DNA, then 40 rounds of amplification, each involving a 5-second high-heat step at 95 °C to unravel the strands, and a 30-second cool-down period at 60 °C for the DNA to bind and extend. The primers used were: SGO2 forward, 5′-TAAAGCACAACAACAGGGCAT-3′, and reverse, 5′-AGGCGAAGAAATGTGTTCTCAAA-3′. Relative expression was then figured out using the trusty 2−ΔΔCt method. GAPDH served as an internal reference control, and all reactions were performed in triplicate.
Cell Proliferation Assay (CCK-8)
Cells were seeded in 96-well plates (2000/well) and incubated for a 72-hour period. CCK-8 solution was added at specific intervals and then incubated. The absorbance at 450 nm was measured using a Tecan Infinite M200 microplate reader. Each experimental condition included at least five replicate wells and was independently repeated three times.
Colony Formation Experiments
To test the colony-forming prowess of breast cancer cells with the SGO2 gene knocked down, we set up colony formation assays. We worked with MCF-7 and MDA-MB-231 cells, which we had treated with siRNAs designed to silence SGO2 or with negative control siRNAs instead. These cells were then planted into 6-well plates, with about 600 of them per well. The cells were allowed to grow for about a week at 37 degrees Celsius in a CO2 incubator with 5% CO2, using the right growth medium for each cell type. Following incubation, the medium was discarded, and the cells were fixed with paraformaldehyde. Colonies were then stained with crystal violet to facilitate visualization and quantification. Representative images of the stained colonies were captured using a digital camera with high resolution. Colonies containing more than 30 cells were counted as positive, and the experiments were performed in triplicate.
Wound Healing Experiment
Cells were seeded in 6-well plates, grown to near confluence, and scratch-wounded using a 10μL pipette tip. Debris was then removed by washing twice with sterile PBS. Plates were incubated under standard humidified conditions. Wound images were captured at 0 and 24 hours. Migration distance was measured across five random regions per sample. Migration rate was calculated as (initial width – final width)/initial width × 100%. Each group was analyzed in triplicate.
Transwell Invasion Assay
Genetically modified cells were placed in Transwell insert upper chambers (Corning, USA), with lower chambers receiving 500 μL complete medium, 5% FBS. Following a daylong culture period, non-adherent cells on the membrane’s top layer were carefully eliminated. After fixing the membrane with paraformaldehyde, we stained it with crystal violet for 20 minutes. A common light microscope was then used to observe and take pictures of the cells that had passed through the membrane to the other side. Invasive cells were counted in five random microscopic fields per membrane, and all experiments were performed in triplicate.
Statistical Analysis
R (v4.4.1) and GraphPad Prism (v9.0) facilitated data processing, statistical analysis, and figure generation, selected according to analytical requirements. Group comparisons and hypothesis testing were performed in accordance with the requirements of each analysis module. Unless otherwise stated, a two-tailed p-value < 0.05 was considered statistically significant. Data are presented as mean ± standard deviation (SD). Comparisons between two groups were analyzed using Student’s t-test, and multiple-group comparisons were conducted using one-way ANOVA followed by Tukey’s post hoc test.
Results
SGO2 Expression Upregulated in Breast Cancer
Examination of SGO2 expression in various cancer types through the TIMER database indicated its upregulation across multiple cancers (Figure 1A). A thorough evaluation of SGO2 expression in breast cancer was conducted by amalgamating data from the TCGA, GTEX, and GEO databases. This meticulous analysis consistently demonstrated a notable increase in SGO2 mRNA expression in breast cancer tissue in contrast to normal breast tissue (Figure 1B–D). Upregulation of SGO2 in breast cancer was further verified by immunohistochemical staining data from the HPA database. Representative staining images from this database (Figure 1E) reveal weak SGO2 expression in tumor tissue and no detectable expression in normal breast tissue. Collectively, results from multiple databases indicate that SGO2 is overexpressed in breast cancer and across a broad range of tumors, suggesting its potential as an indicator of cancer progression.
 |
Figure 1 SGO2 expression is upregulated in multiple cancers and breast cancer subtypes. (A) SGO2 mRNA expression across various cancer types, sourced from the TIMER database. (B) Comparison of SGO2 expression between normal and tumor samples in the GEPIA2 dataset. (C) SGO2 expression among BRCA molecular subtypes, including Basal-like, HER2+, Luminal A, and Luminal B, compared with normal tissues. (D) Validation of SGO2 expression across BRCA subtypes using the GSE21653 dataset. (E) Immunohistochemical analysis of SGO2 protein levels in normal and tumor breast tissues, retrieved from the Human Protein Atlas (HPA) database. (*p < 0.05, **p < 0.01, ***p < 0.001). |
Association of SGO2 Expression with Clinicopathological Features in Breast Cancer Patients
Through analysis of TCGA and GEO database data, a significant correlation emerged between SGO2 expression and various breast cancer pathological traits. These characteristics include tumor size (T stage), lymph node metastasis (N stage), overall pathological stage, cancer cell differentiation (histological grade), and the status of P53 and Ki67 markers (all p < 0.05) (Figure 2A–F). However, associations between SGO2 expression and other clinicopathological factors (eg, M stage, patient age) did not achieve statistical significance (Figure 2G and H).
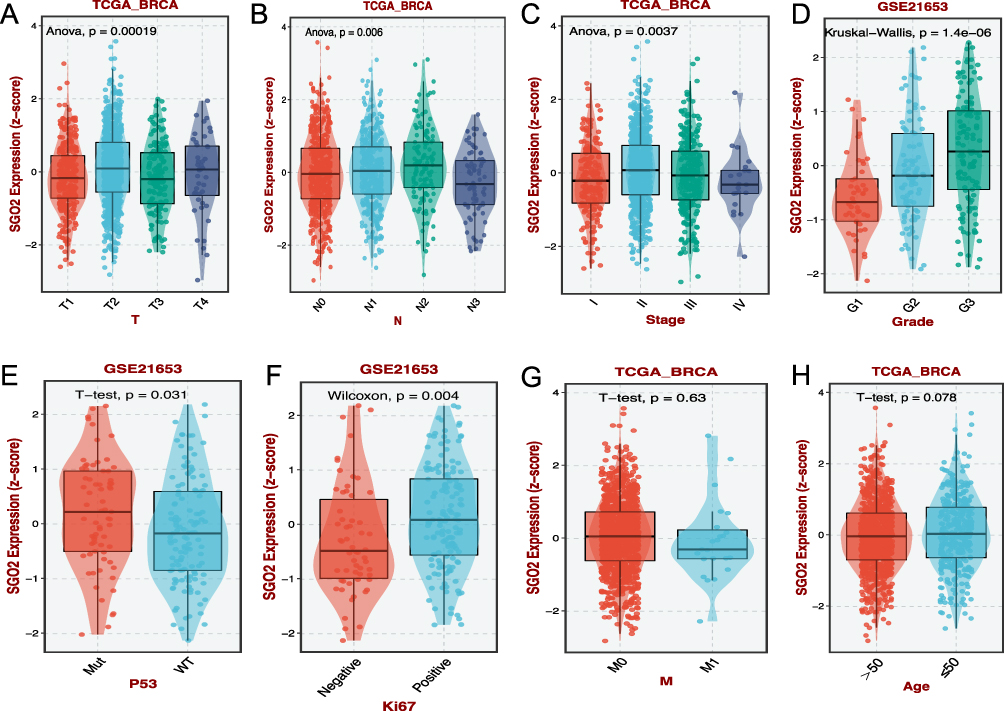 |
Figure 2 Correlation between SGO2 expression and key clinicopathological parameters in breast cancer. (A) SGO2 expression levels across different tumor (T) stages in TCGA-BRCA. (B) SGO2 expression stratified by lymph node involvement (N stage) in TCGA-BRCA. (C) Comparison of SGO2 expression among pathological stages (Stage I–IV) in TCGA-BRCA. (D) SGO2 expression among histological grades (G1–G3) in the GSE21653 dataset. (E) SGO2 expression levels in P53-mutant versus wild-type breast cancer patients (GSE21653). (F) Differential expression of SGO2 according to Ki67 proliferation status in GSE21653. (G) Comparison of SGO2 expression in M0 versus M1 stage breast cancer (TCGA-BRCA). (H) SGO2 expression in patients aged ≤50 versus >50 years (TCGA-BRCA). |
Elevated SGO2 Levels are Associated with a Poor Prognosis in People Diagnosed with Breast Carcinoma
To determine SGO2’s predictive capacity in breast cancer, patient survival rates were analyzed. Analysis via the bcGenExMiner platform indicated that elevated SGO2 expression correlates with adverse clinical outcomes, evidenced by reduced overall survival (Figure 3A), distant metastasis-free survival (Figure 3B), and disease-free survival (Figure 3C). Furthermore, we constructed a prognostic nomogram utilizing TCGA samples with comprehensive clinicopathological data. This integrative model incorporates age, gender, SGO2 expression levels, N-stage, T-stage, and overall pathological stage to predict survival probabilities in breast carcinoma patients (Figure 3D). The nomogram provides individualized survival projections at 1-, 3-, and 5-year intervals.
 |
Figure 3 Prognostic significance of SGO2 expression and construction of a predictive nomogram in breast cancer. (A) Kaplan–Meier analysis of overall survival (OS) based on SGO2 expression in breast cancer patients using the bcGenExMiner platform. (B) Distant metastasis-free survival (DMFS) curves comparing high versus low SGO2 expression groups. (C) Disease-free survival (DFS) analysis of breast cancer patients stratified by SGO2 expression. (D) Prognostic nomogram integrating age, gender, T stage, N stage, pathological stage, and SGO2 expression to estimate 1-, 3-, and 5-year survival probabilities in TCGA breast cancer patients. (*p < 0.05, **p < 0.01, ***p < 0.001). |
Analysis of SGO2 Expression Networks in Breast Cancer Context
Analyzing TCGA breast cancer data, we identified 1,027 genes significantly co-expressed with SGO2 using Pearson correlation (r > 0.4, p ≤ 0.05). A correlation circle plot was constructed to illustrate the overall co-expression relationships with SGO2 (Figure 4A). Among these genes, the top 10 with the strongest positive and negative correlations were visualized in a heatmap (Figure 4B). Additionally, scatter plots were generated to display representative gene correlations with SGO2, including CKAP2L, BUB1, and ASPM (Figure 4C).
 |
Figure 4 Top co-expressed genes with SGO2 in breast cancer. (A) Correlation circle plot displaying the top 10 positively correlated and top 10 negatively correlated genes with SGO2. (B) Heatmap visualizing the same top 10 positively correlated (upper section) and top 10 negatively correlated (lower section) genes. (C) Scatter plots demonstrating representative correlations between SGO2 and three key genes: CKAP2L, BUB1, and ASPM. |
Pathway Analysis of SGO2 in Breast Cancer via GSEA and GSVA
In our quest to delve deeper into the molecular machinations behind SGO2’s role in cancer growth, we took a closer look at the signaling channels tied to its activity. Gene Set Enrichment Analysis was used to analyze KEGG pathways and refine Gene Ontology terms for improved functional understanding. Our analysis revealed that SGO2 is a key player in cell division, and its involvement in pathways such as oocyte maturation and DNA duplication was evident (Figure 5A and B). Further insights gleaned from the GO enrichment confirmed its essential role in basic biological processes such as chromosome regions, segregation, and division within the nucleus (Figure 5C and D). GSVA revealed elevated SGO2 expression within key processes including G2M_CHECKPOINT, E2F_TARGETS, MTORC1_SIGNALING, and SPERMATOGENESIS (Figure 5E). All told, these results point to the intriguing possibility that SGO2 might have a significant impact on tumor biology, especially in the contexts of cell division and genomic integrity.
 |
Figure 5 Functional enrichment analyses based on GSEA of SGO2-associated DEGs and GSVA of SGO2 expression groups. (A) GSEA enrichment plot of KEGG pathways derived from differentially expressed genes (DEGs) between high and low SGO2 expression groups. (B) KEGG pathway enrichment bubble plot based on GSEA of SGO2-associated DEGs. (C) GSEA enrichment plot of Gene Ontology (GO) terms (including BP, CC, MF) from DEGs between high and low SGO2 expression groups. (D) GO enrichment bubble plot based on GSEA of the same DEG set. (E) GSVA pathway activity comparison between high and low SGO2 expression groups, showing differential enrichment in hallmark gene sets. |
Differences in Mutation Characteristics Based on SGO2 Expression Levels
In our analysis, we leveraged SNPs from breast cancer patients post-treatment, segmented the cohort into groups with high and low SGO2 expression, and pinpointed the top 30 mutated genes for mapping purposes (Figure 6A and B). A mutation heat map was made using the ComplexHeatmap R package so that gene changes could be compared between different groups expressing SGO2 (Figure 6C). Analysis found that TP53 and other commonly mutated genes were more mutated in the high-expression group. Higher SGO2 concentrations could indicate a link to genetic instability; further investigation is crucial to establish the underlying cause and process.
 |
Figure 6 Somatic SNP mutation landscape in high and low SGO2 expression groups in breast cancer. (A) Mutation profile of the high SGO2 expression group. (B) Mutation profile of the low SGO2 expression group. (C) Comparative view of mutational patterns between high and low SGO2 expression groups. |
Correlation of SGO2 Expression and Immune Cell Composition in Tumors
Employing CIBERSORT, we performed a comprehensive evaluation of 22 immune cell type fractions within the TCGA-BRCA dataset. In order to understand how SGO2 levels affect the immune environment, we divided breast cancer patients into two groups according to the level of SGO2 expression, and then compared the immune cell penetration of the two groups (Figure 7A). The findings showed that those with increased SGO2 expression had notably higher numbers of activated CD4 memory T cells, M1 macrophages, and T follicular helper cells. Meanwhile, the presence of quiescent mast cells, memory B cells, and active NK cells was notably decreased (all p values below 0.05) (Figure 7B).
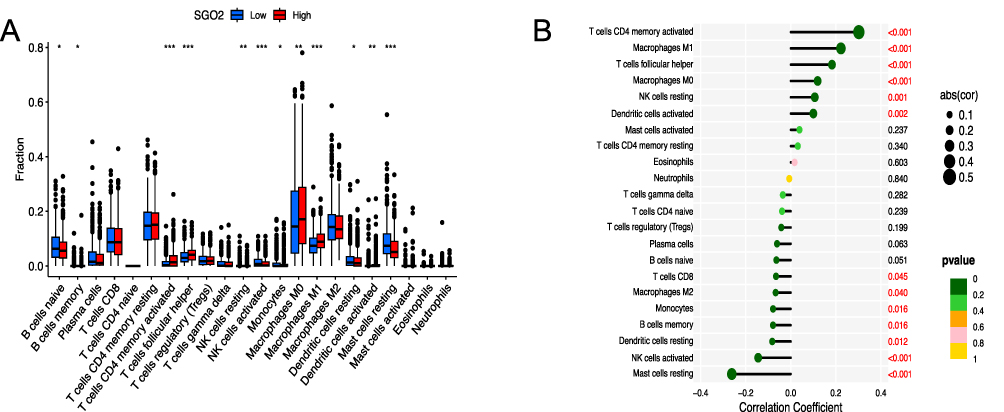 |
Figure 7 Association between SGO2 expression and tumor-infiltrating immune cell profiles in breast cancer. (A) Box plots illustrating differences in immune cell infiltration between high and low SGO2 expression groups. (B) Lollipop plot showing the correlation between SGO2 expression and the abundance of 22 tumor-infiltrating immune cell types. (*p < 0.05, **p < 0.01, ***p < 0.001). |
SGO2 Expression is Associated with Differential Drug Sensitivity Across Multiple Therapeutic Classes
Employing the “OncoPredict” R package, we ascertained IC50 values for various chemotherapies and targeted treatments across patient subgroups exhibiting varying SGO2 expression. Notably, significant differences in predicted drug sensitivity were identified between the high and low SGO2 expression groups (all p<0.01). The evaluated compounds included CDK4/6 inhibitors (Palbociclib, Ribociclib), an mTOR inhibitor (Rapamycin), a PI3K inhibitor (Pictilisib), a Chk1 inhibitor (MK-8776), an EGFR inhibitor (Gefitinib), a proteasome inhibitor (Bortezomib), and a platinum-based chemotherapeutic (Cisplatin) (Figure 8A–H). These results imply that SGO2 may influence cellular susceptibility to a broad spectrum of anti-cancer drugs.
 |
Figure 8 Association between SGO2 expression and predicted drug sensitivity in breast cancer. (A–H) Estimated half-maximal inhibitory concentrations (IC50) for eight anticancer drugs in high and low SGO2 expression groups, calculated using the OncoPredict R package. The analyzed compounds include Palbociclib (A), Ribociclib (B), Rapamycin (C), Pictilisib (D), MK-8776 (E), Gefitinib (F), Bortezomib (G), and Cisplatin (H). |
Single-Cell Analysis Reveals Cell-Type–Specific Expression Patterns of SGO2
The UMAP algorithm, used here for data dimensionality and single-cell clustering, yielded 12 discrete cell clusters (Figure 9A). Subsequent annotation of these clusters revealed that they corresponded to six cell types: epithelial cells, T cells, fibroblasts, macrophages, endothelial cells, and B cells (Figure 9B). To validate the classification, we generated a bubble plot highlighting representative marker genes for each cell type, along with a corresponding cell proportion diagram showing the relative abundance of each cell population (Figure 9C and D). Further analysis of SGO2 gene expression across these identified cell types demonstrated that SGO2 was predominantly expressed in T cells, epithelial cells, and fibroblasts (Figure 9E and F).
 |
Figure 9 Single-cell analysis of SGO2 expression across breast cancer cell types. (A) UMAP plot showing 12 clusters identified by dimensionality reduction of single-cell RNA-seq data. (B) UMAP plot of annotated cell types, including epithelial cells, T cells, fibroblasts, macrophages, endothelial cells, and B cells. (C) Bubble plot of representative marker genes for each identified cell type. (D) Diagram showing the corresponding proportion of each identified cell type. (E) UMAP plot displaying SGO2 expression patterns across annotated cell types. (F) Dot Plot showing SGO2 expression levels within each cell type. |
Knockdown of SGO2 Inhibits Proliferation, Migration and Invasion of Breast Cancer Cells
Initially, we analyzed the content of SGO2 mRNA in breast cancer cell lines. SGO2 levels were notably elevated in MCF-7 and MDA-MB-231 cells compared to MCF-10A. (Figure 10A). Subsequently, SGO2 was silenced in these two breast cancer cells using siRNA vectors, and changes in cell viability were measured by CCK-8. The results showed that 72 hours after SGO2 knockdown, MCF-7 and MDA-MB-231 proliferation was significantly inhibited (Figure 10B and C). Experiments demonstrating colony formation showed a notable decrease in colonies from SGO2-depleted cells. (Figure 10D and E). Next, we did a scratch assay to measure cell mobility and found that when SGO2 expression was suppressed, cell migration was significantly slower than that of the control group (Figure 10F and G). Further research using the transwell assay found that reducing SGO2 levels greatly reduced the ability of breast cancer cells to invade (Figure 10H and I). Ultimately, all data suggest that SGO2 may promote tumor growth and deterioration in breast cancer.
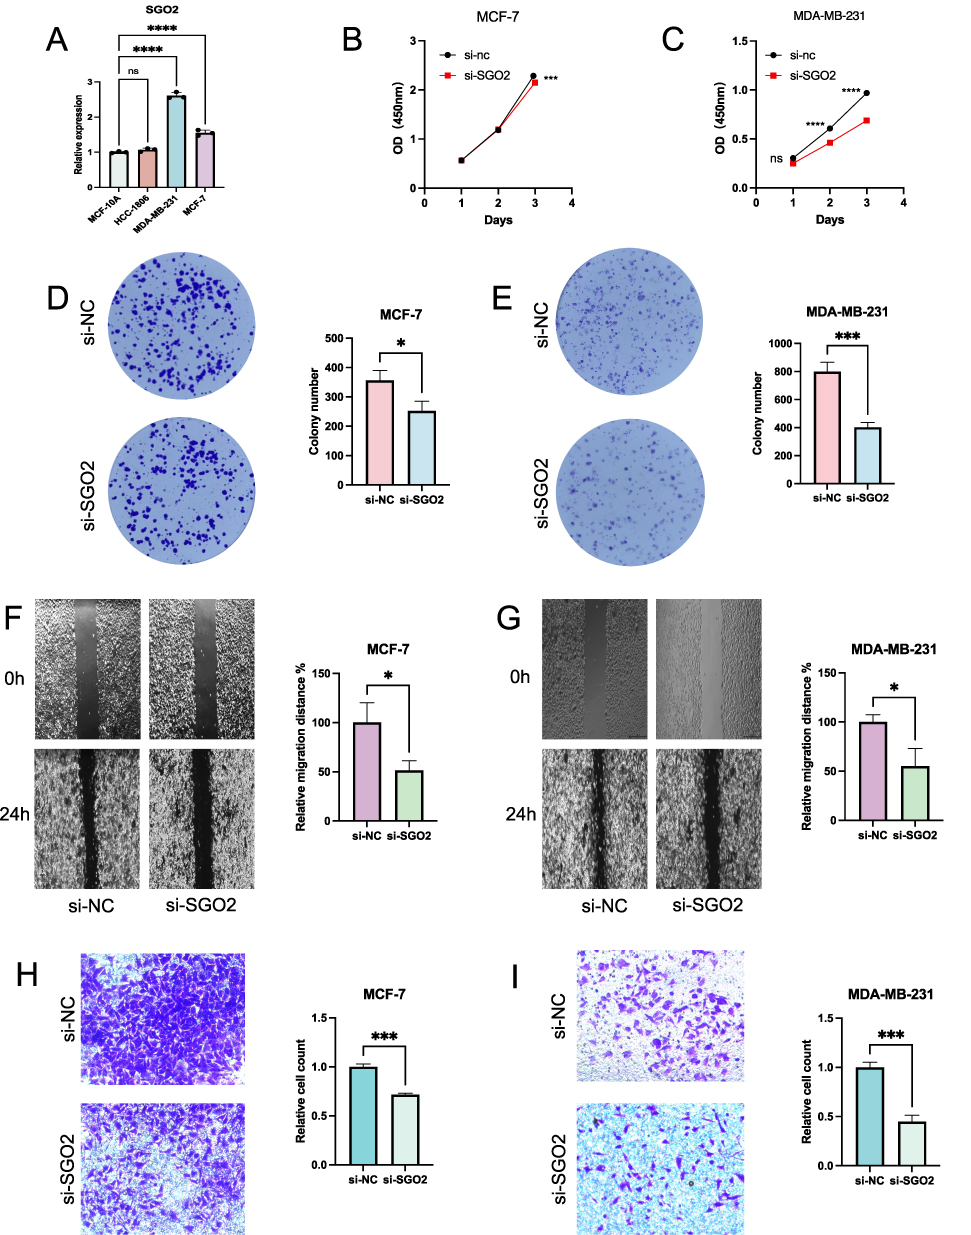 |
Figure 10 Knockdown of SGO2 suppressed the proliferation, migration, and invasion of breast cancer cell lines. (A) Relative SGO2 mRNA expression in HCC-1806, MDA-MB-231, MCF-7, and MCF-10A cells. (B–E) CCK-8 and colony formation assays were performed on MCF-7 and MDA-MB-231 cells with and without SGO2 knockdown to evaluate its effect on cell proliferation. (F–I) Wound healing and Transwell assays were conducted to assess the effect of SGO2 knockdown on the migratory and invasive capacities of breast cancer cells (*p < 0.05; ***p < 0.001; ****p < 0.0001). Abbreviation: ns, not significant. |
Discussion
Breast cancer is the most commonly diagnosed cancer in women and a major cause of cancer-related illness, posing a major public health risk.20–22 Consequently, understanding the underlying mechanisms of breast cancer development, along with improving its diagnosis, treatment, and prognosis, remains critically important.23 SGO1 shows irregular expression in cancers like triple-negative breast, prostate, liver, and colon cancers, acting as a marker for disease progression and a possible treatment target.24–31 Given the functional similarity between SGO1 and Shugoshin-2 (SGO2), our study focused on investigating the role of SGO2 in breast cancer. Incorporating detailed assessments of various public data sets alongside cellular studies in the lab, we discovered elevated expression of SGO2 in breast cancer tissue specimens. Turns out, souped-up SGO2 levels were a real red flag, heavily linked to a bunch of nasty tumor characteristics. We are talking tumor size – the T stage, whether it had spread to the lymph nodes – the N stage, the overall pathological stage, how gnarly the cells looked under the microscope – the histological grade, and even the P53 and Ki67 markers were all tied to higher SGO2. In contrast, no significant correlations were observed between SGO2 expression and metastasis (M stage) or patient age. These findings suggest that high SGO2 expression correlates with poor clinical outcomes in breast cancer. Supporting this, survival analyses using the bc-GenExMiner database confirmed that increased SGO2 levels predict unfavorable prognosis. Taken together, our results indicate that SGO2 holds promise as a novel prognostic biomarker and may serve as a valuable screening tool in breast cancer management.
SGO2 is a key chromosomal segregation regulator, and its abnormal expression in breast cancer may be not only a single event, but a sign of activation of the entire mitotic regulatory network. In this study, we found that the high expression of SGO2 was accompanied by significant co-expression of a series of mitosis-related genes. This close co-expression relationship suggested that SGO2 may be at the core of this functional module. It is particularly noteworthy that most of these up-regulated genes (such as CKAP2L, BUB1, and ASPM) have been shown to promote breast cancer development,32–34 while most of the downregulated genes (such as NOP53 and TNFSF12) have decreased expression in breast cancer,35,36 suggesting that SGO2 and these genes with synchronous up-regulation may jointly drive tumor cell proliferation. However, this does not directly reveal the specific role of SGO2 in breast cancer, so we grouped samples according to median SGO2 expression to generate differential genes for GSEA enrichment analysis and GSVA analysis. Functional analysis using GO terms showed that SGO2 may play a role in cell division, chromosome allocation and regulation of related cellular structures, which is consistent with the known functions of the SGO2 protein. Analysis of the KEGG pathway found that it is particularly active in DNA replication and cell cycle pathways, indicating that SGO2 may be involved in cell cycle and division, and may even promote cell growth and tumor development. GSVA analysis revealed significant upregulation of cell cycle-related pathways such as G2M_checkpoint and E2F_targets in the SGO2-overexpressing group, suggesting enhanced mitotic activity and proliferative potential in these tumor samples. At the same time, changes in the TP53 gene were significantly more common in this set of tumor samples, suggesting a potential pathogenic process. As a classical tumor suppressor gene, TP53 plays a central role in maintaining G1/S and G2/M checkpoint homeostasis, and mutations in TP53 usually indicate cell cycle regulatory disorders and disruption of genome stability. Overall, high SGO2 expression is not only consistent with activation of cell cycle pathways, but may also represent a marker of genomic instability driven by TP53 mutations, providing clues for further exploration of its role in tumor progression and treatment.
We further explored the association between SGO2 expression and the immune microenvironment. Our analysis indicated that elevated SGO2 levels were closely related to altered immune infiltration patterns. Specifically, tumors with higher SGO2 expression exhibited an enrichment of CD4⁺ memory T lymphocytes, T follicular helper cells, classically activated (M1) and undifferentiated (M0) macrophages, quiescent NK cells, as well as dendritic cells in an activated state. While several of these subsets enhance immune activity, certain populations may exert more complex functions within the tumor context. Conversely, high SGO2 expression was linked to reduced infiltration of cytotoxic CD8⁺ T cells, alternatively activated (M2) macrophages, circulating monocytes, memory B lymphocytes, immature/resting dendritic cells, activated NK cells, and mast cells in a resting phenotype. Considering that effector CD8⁺ T cells and activated NK cells are pivotal in tumor eradication, their decline may reflect compromised anti-tumor immunity. Collectively, these findings suggest that SGO2 is deeply involved in remodeling immune cell composition, thereby potentially shaping the tumor immune landscape and influencing therapeutic outcomes.
We then performed a predictive drug sensitivity analysis using the OncoPredict R package for BRCA patients with different SGO2 expression levels. The study revealed marked disparities in the effectiveness of various chemotherapy and targeted medications among the high SGO2 expression group, hinting that SGO2 could play a pivotal role in modulating how cancer cells react to therapy. Notably, the Chk1 inhibitor MK-8776 showed higher sensitivity in samples with low SGO2 expression, and the drug showed potential to synergistically enhance doxorubicin anticancer activity in p53-deficient breast cancer by blocking DNA damage repair pathways.37 In addition, cisplatin, as a commonly used DNA crosslinking agent, has reduced sensitivity in patients with high SGO2 expression, further suggesting that SGO2 may affect the response of tumor cells to cisplatin by regulating DNA damage response mechanisms. Also noteworthy is the cell cycle inhibitor Palbociclib, which blocks cells from G1 to S by targeting CDK4/6 and is widely used in the treatment of hormone receptor-positive breast cancer.38 The potential difference in efficacy of Palbociclib in the group with high SGO2 expression suggests that SGO2 may be closely related to cell cycle pathways. In conclusion, SGO2 expression level may affect the sensitivity of many drugs, including Chk1 inhibitors, cytotoxic drugs and cell cycle regulatory drugs, suggesting that SGO2 may be a potential biomarker for individualized treatment of breast cancer. Looking ahead, a deeper understanding of how SGO2 functions in chemotherapy, targeted therapy, and even immunotherapy could really revolutionize breast cancer treatment. This knowledge could help us fine-tune treatment plans and speed up the application of precision medicine in a clinical setting, ultimately leading to better management of the disease.
We studied the expression characteristics of SGO2 in specific cell populations by combining typical tumor transcriptome data with single-cell transcriptome information. This allows us to look at the biological roles SGO2 may play in different cell types. The results showed that SGO2 was expressed in various cell types, with the highest average expression level in T cells, followed by tumor epithelial cells. Although T cells represent a low proportion of the overall cellular makeup, their high expression levels suggest that SGO2 may play a specific regulatory role in T cell activation, functional maintenance, or differentiation. In epithelial cells, SGO2 is widely expressed, and its basic function as a cell cycle-related regulator suggests that SGO2 may be involved in regulating tumor cell proliferation or genome stability. SGO2 is also present, but less obvious, and is present in fibroblasts, macrophages and similar cell types. This suggests that it may play a role in the construction and management of the environment around tumors. The pattern observed across various cell types hints that SGO2 could play a dual role, not just in the aggressive behavior of tumor cells but also in the intricate management of the tumor’s environment. This is due to its involvement in processes like modulating the immune response and reshaping the extracellular matrix. In conclusion, SGO2 showed significant cell-type specific expression in tumor tissues, especially in T cells and epithelial cells, which provided new clues for its multi-layered role in breast cancer.
In this study, SGO2 was significantly overexpressed in breast cancer tissues and closely correlated with poor prognosis. To further investigate the biological function of SGO2 in breast cancer, we performed in vitro functional experiments in two breast cancer cell lines (MCF-7 and MDA-MB-231). The results showed that SGO2 knockdown could significantly inhibit the proliferation, migration and invasion of breast cancer cells, suggesting that SGO2 may play a role in promoting tumor progression. These results further support the possibility of SGO2 as a key regulator of breast cancer. Future studies will focus on its specific molecular mechanisms in order to provide new theoretical basis and potential strategies for early diagnosis and targeted therapy of breast cancer.
While this research elucidated SGO2’s traits and roles in mammary carcinoma, certain constraints persist. First, although we have preliminarily verified the role of SGO2 in breast cancer progression through public database analysis and in vitro experiments, there is still a lack of functional verification at the animal level, which cannot fully reflect its biological behavior in the complex microenvironment in vivo. Second, single-cell analysis revealed the expression characteristics of SGO2 in different cell types, but it has not been combined with spatial transcriptome or multi-omics data to further analyze its specific regulatory network in tumor microenvironment. Furthermore, the expression of SGO2 in immune cells and its potential impact on immune response have not been thoroughly explored, and further studies are needed to determine whether SGO2 is involved in tumor immune escape or affects immunotherapy sensitivity. Additionally, the current work mainly relies on publicly available datasets and limited in vitro validation, lacking patient-level or large-scale clinical evidence that could provide a more comprehensive biological context. Moreover, the proposed association between SGO2’s function in chromosome segregation and its influence on immune modulation or drug sensitivity remains speculative and requires deeper mechanistic investigation to establish a causal link.
Acknowledging these limitations, our findings nevertheless provide a solid foundation for understanding the biological and translational significance of SGO2 in breast cancer. Further research should probe the molecular pathways of SGO2 in breast cancer advancement, notably its influence on cell division, genomic integrity, and anti-tumor response. At the same time, it is necessary to carry out in vivo experimental verification through animal models, and further evaluate the clinical application value of SGO2 as a prognostic marker and therapeutic target in combination with clinical large sample cohort. Although the multi-omics approach provides a comprehensive perspective, the translational potential of SGO2 should be further validated in large clinical cohorts or patient-derived models. In addition, exploring the synergistic effect of SGO2 with existing therapeutic strategies such as CDK4/6 inhibitors or immune checkpoint inhibitors will also provide new directions for individualized treatment of breast cancer. In the future, integrating multi-omics data and spatial transcriptomic analyses may help to elucidate the tumor microenvironmental context of SGO2 activity, thereby advancing its translation from molecular discovery to clinical application.
Conclusion
SGO2 may serve as a valuable prognostic biomarker and a potential therapeutic target in breast cancer. Our integrated analysis combining transcriptomic profiling and experimental validation revealed that aberrant SGO2 expression is closely associated with tumor progression, cell cycle dysregulation, and poor clinical outcomes. Targeting SGO2 could therefore provide new opportunities for improving individualized treatment strategies in breast cancer. Future studies involving large clinical cohorts and mechanistic experiments are warranted to further elucidate its biological functions and therapeutic potential.
Data Sharing Statement
The research datasets, both those created and those evaluated, can be accessed upon request from the study’s corresponding author.
Ethics Statement
The TCGA, HPA and GEO databases used in this study are publicly available bioinformatics resources, and the included patient data have passed ethical review and approval. Researchers are free to download and use it for scientific research and publication. Since this study is based solely on publicly available data from the open source databases mentioned above, no patient privacy or additional intervention is involved, and therefore no additional ethical approval issues are involved.
All human data used in this study were obtained entirely from publicly available databases and contain only anonymized information. According to Items 1 and 2 of Article 32 of the Measures for the Ethical Review of Life Science and Medical Research Involving Human Subjects (issued in China on February 18, 2023), this study is exempt from institutional ethics approval.
Funding
This study was supported by the National Natural Science Foundation of China (Grant No. 32400658), the Nonprofit Science and Technology Project of Zhejiang Medical and Health (Grant No. 2024KY1712), and the Shaoxing Basic Public Welfare Research Program (Grant No. 2024A14009).
Disclosure
The researchers declare that there are no conflicting interests associated with the present study.
References
1. Yi M, Li T, Niu M, Luo S, Chu Q, Wu K. Epidemiological trends of women’s cancers from 1990 to 2019 at the global, regional, and national levels: a population-based study. Biomark Res. 2021;9(1):55. doi:10.1186/s40364-021-00310-y
2. Sung H, Ferlay J, Siegel RL, et al. Global cancer statistics 2020: GLOBOCAN estimates of incidence and mortality worldwide for 36 cancers in 185 countries. CA Cancer J Clin. 2021;71(3):209–249. doi:10.3322/caac.21660
3. Liu X, Zhang X, Shao Z, et al. Pyrotinib and chrysin synergistically potentiate autophagy in HER2-positive breast cancer. Signal Transduct Target Ther. 2023;8(1):463. doi:10.1038/s41392-023-01689-w
4. Mitchell D, Hruska CB, Boughey JC, et al. 99mTc-sestamibi using a direct conversion molecular breast imaging system to assess tumor response to neoadjuvant chemotherapy in women with locally advanced breast cancer. Clin Nucl Med. 2013;38(12):949–956. doi:10.1097/rlu.0000000000000248
5. Zeng J, Sauter ER, Li B. FABP4: a new player in obesity-associated breast cancer. Trends Mol Med. 2020;26(5):437–440. doi:10.1016/j.molmed.2020.03.004
6. McGuinness BE, Hirota T, Kudo NR, Peters JM, Nasmyth K. Shugoshin prevents dissociation of cohesin from centromeres during mitosis in vertebrate cells. PLoS Biol. 2005;3(3):e86. doi:10.1371/journal.pbio.0030086
7. Riedel CG, Katis VL, Katou Y, et al. Protein phosphatase 2A protects centromeric sister chromatid cohesion during meiosis I. Nature. 2006;441(7089):53–61. doi:10.1038/nature04664
8. Llano E, Gómez R, Gutiérrez-Caballero C, et al. Shugoshin-2 is essential for the completion of meiosis but not for mitotic cell division in mice. Genes Dev. 2008;22(17):2400–2413. doi:10.1101/gad.475308
9. Chen Y, Xiang T. SGO2 as a prognostic biomarker correlated with cell proliferation, migration, invasion, and epithelial-mesenchymal transition in lung adenocarcinoma. Front Biosci. 2024;29(9):314. doi:10.31083/j.fbl2909314
10. Wu Z, Zhuo T, Li Z, et al. High SGO2 predicted poor prognosis and high therapeutic value of lung adenocarcinoma and promoted cell proliferation, migration, invasion, and epithelial-to-mesenchymal transformation. J Cancer. 2023;14(12):2301–2314. doi:10.7150/jca.86285
11. Jiang SS, Ke SJ, Ke ZL, Li J, Li X, Xie XW. Cell division cycle associated genes as diagnostic and prognostic biomarkers in hepatocellular carcinoma. Front Mol Biosci. 2021;8:657161. doi:10.3389/fmolb.2021.657161
12. Hu Q, Liu Q, Zhao Y, Zhang L, Li L. SGOL2 is a novel prognostic marker and fosters disease progression via a MAD2-mediated pathway in hepatocellular carcinoma. Biomark Res. 2022;10(1):82. doi:10.1186/s40364-022-00422-z
13. Lv T, He D, Zhang X, et al. SGOL2 promotes prostate cancer progression by inhibiting RAB1A ubiquitination. Aging. 2022;14(24):10050–10066. doi:10.18632/aging.204443
14. Kao Y, Tsai WC, Chen SH, et al. Shugosin 2 is a biomarker for pathological grading and survival prediction in patients with gliomas. Sci Rep. 2021;11(1):18541. doi:10.1038/s41598-021-97119-4
15. Li T, Fan J, Wang B, et al. TIMER: a web server for comprehensive analysis of tumor-infiltrating immune cells. Cancer Res. 2017;77(21):e108–e110. doi:10.1158/0008-5472.Can-17-0307
16. Tang Z, Kang B, Li C, Chen T, Zhang Z. GEPIA2: an enhanced web server for large-scale expression profiling and interactive analysis. Nucleic Acids Res. 2019;47(W1):W556–w560. doi:10.1093/nar/gkz430
17. Liu Z, Liu L, Weng S, et al. BEST: a web application for comprehensive biomarker exploration on large-scale data in solid tumors. J Big Data. 2023;10(1):165. doi:10.1186/s40537-023-00844-y
18. Uhlén M, Fagerberg L, Hallström BM, et al. Proteomics. Tissue-based map of the human proteome. Science. 2015;347(6220):1260419. doi:10.1126/science.1260419
19. Jézéquel P, Campone M, Gouraud W, et al. bc-GenExMiner: an easy-to-use online platform for gene prognostic analyses in breast cancer. Breast Cancer Res Treat. 2012;131(3):765–775. doi:10.1007/s10549-011-1457-7
20. Sancho-Garnier H, Colonna M. Épidémiologie des cancers du sein [Breast cancer epidemiology]. Presse Med. 2019;48(10):1076–1084. doi:10.1016/j.lpm.2019.09.022
21. Joko-Fru WY, Griesel M, Mezger NCS, et al. Breast cancer diagnostics, therapy, and outcomes in Sub-Saharan Africa: a population-based registry study. J Natl Compr Canc Netw. 2021;20(13):7011. doi:10.6004/jnccn.2021.7011
22. Kamangar F, Dores GM, Anderson WF. Patterns of cancer incidence, mortality, and prevalence across five continents: defining priorities to reduce cancer disparities in different geographic regions of the world. J Clin Oncol. 2023;41(34):5209–5224. doi:10.1200/jco.23.00864
23. Liang Y, Zhang H, Song X, Yang Q. Metastatic heterogeneity of breast cancer: molecular mechanism and potential therapeutic targets. Semin Cancer Biol. 2020;60:14–27. doi:10.1016/j.semcancer.2019.08.012
24. Chen Q, Wan X, Chen Y, Liu C, Gu M, Wang Z. SGO1 induces proliferation and metastasis of prostate cancer through AKT-mediated signaling pathway. Am J Cancer Res. 2019;9(12):2693–2705.
25. Iwaizumi M, Shinmura K, Mori H, et al. Human Sgo1 downregulation leads to chromosomal instability in colorectal cancer. Gut. 2009;58(2):249–260. doi:10.1136/gut.2008.149468
26. Jusino S, Rivera-Rivera Y, Chardón-Colón C, et al. Sustained Shugoshin 1 downregulation reduces tumor growth and metastasis in a mouse xenograft tumor model of triple-negative breast cancer. Cell Div. 2023;18(1):6. doi:10.1186/s13008-023-00088-5
27. Murakami-Tonami Y, Ikeda H, Yamagishi R, et al. SGO1 is involved in the DNA damage response in MYCN-amplified neuroblastoma cells. Sci Rep. 2016;6:31615. doi:10.1038/srep31615
28. Ricke RM, van Deursen JM. Sgo1 as a “guardian spirit” for preventing colon tumorigenesis. Cell Cycle. 2012;11(4):649. doi:10.4161/cc.11.4.19360
29. Sun Q, Liu F, Mo X, et al. Shugoshin regulates cohesin, kinetochore-microtubule attachments, and chromosomal instability. Cytogenet Genome Res. 2022;162(6):283–296. doi:10.1159/000528141
30. Wang LH, Yen CJ, Li TN, Elowe S, Wang WC, Wang LH. Sgo1 is a potential therapeutic target for hepatocellular carcinoma. Oncotarget. 2015;6(4):2023–2033. doi:10.18632/oncotarget.2764
31. Zhang Q, Liu H. Functioning mechanisms of Shugoshin-1 in centromeric cohesion during mitosis. Essays Biochem. 2020;64(2):289–297. doi:10.1042/ebc20190077
32. Chi F, Chen L, Jin X, He G, Liu Z, Han S. CKAP2L, transcriptionally inhibited by FOXP3, promotes breast carcinogenesis through the AKT/mTOR pathway. Exp Cell Res. 2022;412(2):113035. doi:10.1016/j.yexcr.2022.113035
33. Sriramulu S, Thoidingjam S, Chen WM, et al. BUB1 regulates non-homologous end joining pathway to mediate radioresistance in triple-negative breast cancer. J Exp Clin Cancer Res. 2024;43(1):163. doi:10.1186/s13046-024-03086-9
34. Ibrahim A, Atallah NM, Makhlouf S, Toss MS, Green A, Rakha E. Deciphering the role of ASPM in breast cancer: a comprehensive multicohort study. Cancers. 2024;16(22):3814. doi:10.3390/cancers16223814
35. Moon A, Lim SJ, Jo YH, et al. Downregulation of GLTSCR2 expression is correlated with breast cancer progression. Pathol Res Pract. 2013;209(11):700–704. doi:10.1016/j.prp.2013.07.010
36. Chen J, She Y, Feng C, et al. TNFSF12 is associated with breast cancer prognosis and immune cell infiltration. Am J Transl Res. 2024;16(8):4120–4133. doi:10.62347/idtk3218
37. Chung SW, Kim GC, Kweon S, et al. Metronomic oral doxorubicin in combination of Chk1 inhibitor MK-8776 for p53-deficient breast cancer treatment. Biomaterials. 2018;182:35–43. doi:10.1016/j.biomaterials.2018.08.007
38. Turner NC, Ro J, André F, et al. Palbociclib in hormone-receptor-positive advanced breast cancer. N Engl J Med. 2015;373(3):209–219. doi:10.1056/NEJMoa1505270
 © 2025 The Author(s). This work is published and licensed by Dove Medical Press Limited. The
full terms of this license are available at https://www.dovepress.com/terms
and incorporate the Creative Commons Attribution
- Non Commercial (unported, 4.0) License.
By accessing the work you hereby accept the Terms. Non-commercial uses of the work are permitted
without any further permission from Dove Medical Press Limited, provided the work is properly
attributed. For permission for commercial use of this work, please see paragraphs 4.2 and 5 of our Terms.
© 2025 The Author(s). This work is published and licensed by Dove Medical Press Limited. The
full terms of this license are available at https://www.dovepress.com/terms
and incorporate the Creative Commons Attribution
- Non Commercial (unported, 4.0) License.
By accessing the work you hereby accept the Terms. Non-commercial uses of the work are permitted
without any further permission from Dove Medical Press Limited, provided the work is properly
attributed. For permission for commercial use of this work, please see paragraphs 4.2 and 5 of our Terms.
Recommended articles
Significance of Immunogenic Cell Death-Related Prognostic Gene Signature in Cervical Cancer Prognosis and Anti-Tumor Immunity
Jiang S, Cui Z, Zheng J, Wu Q, Yu H, You Y, Zheng C, Sun Y
Journal of Inflammation Research 2023, 16:2189-2207
Published Date: 22 May 2023
Comprehensive Analysis Reveals the Potential Roles of CDKN3 in Pancancer and Verification in Endometrial Cancer
Gao C, Fan X, Liu Y, Han Y, Liu S, Li H, Zhang Q, Wang Y, Xue F
International Journal of General Medicine 2023, 16:5817-5839
Published Date: 11 December 2023
Paired Box 5 (PAX5) Gene Has Diagnostic and Prognostic Potential in Nasopharyngeal Carcinoma
Ye J, Huang X, Qin W, Liang P, Zhao J, Ye Y, Ji H, Peng X, Liang Y, Cai Y
International Journal of General Medicine 2024, 17:487-501
Published Date: 8 February 2024
Bioinformatics-Based Construction of Immune-Related microRNA and mRNA Prognostic Models for Hepatocellular Carcinoma
Chen Y, Yin D, Feng X, He S, Zhang L, Chen D
Cancer Management and Research 2024, 16:1793-1811
Published Date: 27 December 2024
Novel Identification of CD74 as a Biomarker for Diagnosing and Prognosing Sepsis Patients

Hu K, Shi A, Shu Y, Sudesh S, Ling J, Chen Y, Hua F, Yu S, Zhang J, Yu P
Journal of Inflammation Research 2025, 18:3829-3842
Published Date: 15 March 2025