")
Back to Journals » International Journal of General Medicine » Volume 17
Paired Box 5 (PAX5) Gene Has Diagnostic and Prognostic Potential in Nasopharyngeal Carcinoma
Authors Ye J, Huang X, Qin W, Liang P, Zhao J, Ye Y, Ji H, Peng X, Liang Y, Cai Y
Received 2 October 2023
Accepted for publication 24 January 2024
Published 8 February 2024 Volume 2024:17 Pages 487—501
DOI https://doi.org/10.2147/IJGM.S442835
Checked for plagiarism Yes
Review by Single anonymous peer review
Peer reviewer comments 2
Editor who approved publication: Dr Scott Fraser
Jiemei Ye,1,2,* Xiaoying Huang,3,4,* Weiling Qin,1,2,* Pan Liang,3,4 Jun Zhao,4 Yinxin Ye,1,2 Huojin Ji,1,2 Xinyun Peng,1,2 Yushan Liang,3,4 Yonglin Cai1,5
1Guangxi Health Commission Key Laboratory of Molecular Epidemiology of Nasopharyngeal Carcinoma, Wuzhou Red Cross Hospital, Wuzhou, Guangxi, People’s Republic of China; 2Department of Clinical Laboratory, Wuzhou Red Cross Hospital, Wuzhou, Guangxi, People’s Republic of China; 3Department of Otolaryngology-Head and Neck Surgery, First Affiliated Hospital of Guangxi Medical University, Nanning, Guangxi, People’s Republic of China; 4Guangxi Key Laboratory of Early Prevention and Treatment for Regional High Frequency Tumor, Guangxi Medical University, Nanning, Guangxi, People’s Republic of China; 5Department of Preventive Medicine, Wuzhou Cancer Center, Wuzhou, Guangxi, People’s Republic of China
*These authors contributed equally to this work
Correspondence: Yonglin Cai, Guangxi Health Commission Key Laboratory of Molecular Epidemiology of Nasopharyngeal Carcinoma, Wuzhou Red Cross Hospital, Wuzhou, Guangxi, 543002, People’s Republic of China, Email [email protected] Yushan Liang, Department of Otolaryngology-Head and Neck Surgery, First Affiliated Hospital of Guangxi Medical University, Nanning, Guangxi, 530021, People’s Republic of China, Email [email protected]
Purpose: Paired Box 5 (PAX5) is a transcription factor that is widely associated with carcinogenesis. PAX5 can maintain Epstein-Barr virus (EBV) latency in B cells, while a close association exists between EBV infection and nasopharyngeal carcinoma (NPC). However, there are very few reports on the correlation between PAX5 and NPC development. The aim of this study was to investigate the role of PAX5 in NPC.
Patients and Methods: The clinical value and prognostic significance of PAX5 in NPC and the association with PAX5 expression and immune cell infiltration were analyzed by multiple GEO datasets. In vivo and in vitro experiments including real-time PCR, Western blot, CCK-8 assay, and methylation sequencing were used to validate the results of bioinformatics analysis.
Results: The expression of PAX5 was significantly reduced in NPC tissues, with the low expression being correlated with advanced clinical stage, low tumor mutation burden and immune activation, high relative expression of EBV, poor survival for NPC patients. PAX5 exhibited excellent diagnostic performance and had potential as a predictive factor for response to the immune checkpoint inhibitors therapy. Enrichment analysis suggested that the low expression of PAX5 was associated with the dysregulation of Hippo and Wnt signaling pathways. The promoter of PAX5 gene was hypermethylated in NPC tissues. Furthermore, the in vitro and in vivo experiments revealed that NPC tissue and cell lines had low mRNA expression levels of PAX5, the PAX5 promoter was hypermethylated in NPC cell lines, and PAX5 overexpression inhibited NPC cell proliferation and tumor growth in nude mice.
Conclusion: PAX5 may be a tumor suppressor and serve as a novel potential diagnostic and prognostic marker for NPC.
Keywords: nasopharyngeal carcinoma, transcription factor, PAX5, prognosis, immunity, Epstein-Barr virus
Introduction
In southern China and Southeast Asia, nasopharyngeal carcinoma (NPC) is one of the most common head and neck malignant cancers. The formulation and development of NPC is not fully understood but is a complex multi-step and multi-factorial process involving genetics, environmental factors, and Epstein-Barr virus (EBV) infection.1 Luo2 proposed that NPC exhibits ecological and evolutionary coherence as a disease. Within an ecosystem characterized by extensive genetic and phenotypic diversity, the various subtypes of NPC cells engage in cooperative and competitive interactions, spatially and temporally, within their respective habitats. Consequently, these interactions collectively contribute to the malignant progression of the disease. Gene expression is frequently regulated by transcription, with transcription factors (TFs) being the primary and direct regulators. TFs control transcription and gene expression by recognizing specific DNA sequences to form complex systems that guide genome expression.3 Therefore, it is important to understand the gene expression regulation by TFs and their role in NPC carcinogenesis, with the aim of identifying more effective predictive markers and therapeutic targets.
The Paired Box (PAX) human gene family consists of nine TFs (PAX1 - PAX9) divided into four groups. PAX genes play roles in cell differentiation, renewal, and apoptosis during embryonic development.4 PAX2/5/8 in group II and PAX3/7 in group III have recently been associated with carcinogenesis. PAX2 can promote the proliferation and invasion of ovarian cancer by reprogramming fatty acid metabolism or inducing the formation of vascular-like structures.5,6 PAX8 is expressed in thyroid,7 kidney,8 ovarian,9 and breast10 tumors. PAX5 is essential for the normal differentiation and maturation of B cells. Abnormal expression of PAX5 has been found in various B-cell carcinoma lesions and solid tumors. The effect of PAX5 on carcinogenesis differs among different types of cancer. PAX5 may be a potential tumor suppressor gene in some non-hematological cancers such as esophageal squamous cell carcinoma,11 breast cancer,12 and hepatocellular carcinoma,13 but may be an oncogene in colorectal cancer14 and prostate cancer.15 However, there are very few reports on the correlation between PAX genes and NPC development. In our study, we used data from the Gene Expression Omnibus (GEO) database, tissue samples, and cell lines to explore the possible role of PAX gene family in NPC.
Materials and Methods
Data Sources
Publicly available transcriptome and clinicopathological data of NPC patients were obtained from the GEO database (http://www.ncbi.nlm.nih.gov/geo/). The details of the GEO datasets are summarized in Table 1. As an external cohort, the IMvigor21016 dataset was used to validate PAX5’s predictive role in immunotherapy.
 |
Table 1 Details of GEO Datasets Included in This Study |
Differential Expression Analysis
The differential expression genes (DEGs) between case and control groups were identified by using the limma R package.17 The GSE12452, GSE180272, GSE53819, GSE61218, and GSE64634 datasets were merged using the sva R package, while batch effects were removed using the ComBat function. Receivers operating characteristic (ROC) curve was used to evaluate the diagnostic value of PAX5 for NPC in the merged dataset using the pROC R package.
Prognostic Analysis
The Kaplan-Meier curves were generated using the survminer and survival18 R packages, while the ideal cutoff point was determined using the surv_cutpoint function. Time-dependent ROC curves were applied to estimate the discriminative accuracy of the case using the timeROC R package. The rms R package was applied to develop a nomogram for evaluating the progression-free survival (PFS) in NPC patients.
Analysis of Immune Infiltration and Its Correlation with PAX5 Expression
We divided NPC patients into high- and low-expression groups according to the median level of PAX5 expression. The level of immune cell infiltration was then compared between the two groups. The immune, stromal and estimate scores of each patient were calculated by using the ESTIMATE algorithm.19 The single-sample gene set enrichment analysis (ssGSEA) was then used to analyze the infiltration level of 23 and 24 immune cell types based on published immunocyte signature genes20,21 by using GSVA R package.22 We also analyzed the correlation among the expressions of PAX5 and 16 immune checkpoint-related genes (PDCD1, CD274, CTLA4, CD80, CD86, LAG3, LMTK3, TIGIT, BTLA, CD40, CD27, CD28, CD47, SIRPA, IDO1, and IDO2).
Gene Set Enrichment Analysis
The clusterProfiler23 and ReactomePA24 R packages was used to perform Gene Ontology (GO), Kyoto Encyclopedia of Genes and Genomes (KEGG), and Reactome analyses. Comparing gene enrichment patterns between PAX5 high- and low-expression groups, we investigated the potential role of PAX5 and the pathways that it is associated with in NPC.
Non-Negative Matrix Factorization (NMF) Clustering
NPC tissues were classified into cold or hot tumors using NMF algorithm25 with the parameters of the “brunet” method and the nrun of 10.
Cell Lines
The human NPC cell lines, including CNE1, CNE2, CNE2-EBV, and 5–8F, were stored at the Guangxi Key Laboratory of Early Prevention and Treatment for Regional High-Frequency Tumor, Guangxi Medical University, (Nanning, China). All cells were cultured in DMEM medium (Gibco, USA) supplemented with 10% fetal bovine serum (Gibco, USA). All cells were maintained at 37°C in a humidified incubator with 5% CO2.
Quantitative Real-Time PCR
Twenty-one NPC and twenty-seven rhinitis tissues were collected from Wuzhou Red Cross Hospital. DMEM medium supplemented with 10% fetal bovine serum was used to culture the NPC cell lines (CNE1, CNE2, CNE2-EBV, and 5–8F). The Ethics Committee of Wuzhou Red Cross Hospital approved this study’s ethical approval (No. LL2021-53), and informed consent was waived due to its retrospective design.
Trizol reagent (Thermo, K0731) was used to extract total RNA from tissues and cultured cells, and cDNA was reversely transcribed using a reverse transcriptase kit (Thermo, M16325). Quantitative real-time PCR was carried out on a LightCycle 480 instrument (Roche, Germany). Using the 2−ΔΔCt method, we calculated the relative expression level of PAX5, with GAPDH as the internal standard. The PAX5 forward primer was 5’- AAACCAAAGGTCGCCACAC-3’, and reverse was 5’- GTTGATGGAACTGACGCTAGG-3’. The GAPDH forward primer was 5’- GGAGCGAGATCCCTCCAAAAT-3’, and reverse was 5’- GGCTGTTGTCATACTTCTCATGG-3’.
Methylation Analysis by Bisulfite Sequencing
The MethylTarget® method (Genesky Biotechnologies Inc., Shanghai, China) was applied to detect the ratio of DNA methylation. For bisulfite sodium transformation, genomic DNA isolated from cell lines and tissues was conducted by using EZ DNA Methylation™-GOLD Kit (Zymo Research, Irvine, CA, USA). The standard protocols were performed as previously described.26 The primers used for PAX5 amplification were shown as followed: forward primer was 5’-GGGAGGGAAGGAAGGTTTTAG-3’, and reverse was 5’- TCAAAAACAAAAACCCRACCTAC-3’.
Treatment with 5-Aza-2’-Deoxycytidine (5-Aza-dC)
CNE1, CNE2 and 5–8F cells were seeded into six-well plates and incubated with 5 µM 5-Aza-dC (Sigma-Aldrich, A3656) and DMSO (Solarbio, D8370) for five days. We changed the fresh medium with 5-Aza-dC and DMSO every 24 hours. The cells were harvested for total RNA extraction after five days.
Plasmids and Transfection
The plasmids pCMV6-Entry-PAX5 and pCMV6-Entry were purchased from the Origene Company. NPC cell lines (5–8F and CNE2) were transferred with the plasmid by Lipofectamine 3000 (Invitrogen, Carlsbad, CA, USA), respectively. The cell medium was replaced after 24 h. The expression of PAX5 was confirmed by qRT-PCR and Western blotting.
Western Blot
Cells with RIPA buffer added were lysed on ice for 40 min. BCA Protein Assay kit (Beyotime, Shanghai, China) was used to determine total protein concentration. The proteins were separated in electrophoresis solution at 200 V and transferred to PVDF membrane (Thermo Fisher Scientific, Waltham, MA, USA). PVDF membranes were incubated with PAX5 antibody (1:1000, ab109443, Abcam, USA) and GAPDH antibody (1:1000 #5174P) in refrigerator overnight. Then, the cells were incubated with secondary antibody (LICOR, Nebraska, USA) for 1.5 h at room temperature. Next, the PVDF membrane results were obtained through the Odyssey system (Thermo Scientific, Waltham, MA, USA). The protein expression was analyzed by Image J software.
CCK8 Assay
Transfected cells (1.5×10³) were seeded into 96-well plates. After cell adherence, cell viability was measured using CCK-8 kit (CK04, Dojindo, Japan). The cell proliferation assay was tested every 24 hours for 4 days. Absorbance (OD 450 nm) was determined by plate absorptiometry (iMark, Bio-Rad, Hercules, CA, USA).
Colony-Formation Assay
Cells were seeded in six-well plates at a density of 200 cells per well. After 14 days, the colonies formed were stained with Giemsa, photographed, and counted using Quantity One v4.4.0 (Bio-Rad, USA).
In vivo Tumorigenicity Assay
The animal experiments were conducted according to the Guide for the Care and Use of Laboratory Animals and were approved by the Ethics Committee of the Wuzhou Red Cross Hospital (approval no. LL2021-53). Five 5-week-old male BALB/c-nu nude mice (Vital River Laboratory Animal Technology, China) were injected with 1.0 × 10⁶ pCMV6-Entry-5–8F cells and an equal number of PAX5- overexpressed–5–8F cells into the right flank by subcutaneous injection. All mice were raised by professional breeders from Laboratory Animal Center of Guangxi Medical University in a barrier system with certain temperature and humidity in the SPF animal lab and were randomly divided into two groups. Tumor volume was assessed by 2D measurements at 0, 3, 5, 8, 11 and 14 days. Tumor volume was calculated using the formula: volume (mm3) = length × width2 × 0.5. Subsequently, the mice were euthanized by cervical dislocation, and tumors were excised and weighed.
Statistical Analysis
The bioinformatics analysis workflow is presented in Figure 1. Statistical analysis was performed by using R software (R Foundations for Statistical Computing, version 4.2.1). Three groups were compared using Kruskal–Wallis test, while two groups were compared using Wilcoxon test. COX regression analysis was used to determine the correlation between gene expression and PFS in NPC patients, and the hazard ratio (HR) with a 95% confidence interval (CI). A p value of 0.05 was considered statistically significant.
 |
Figure 1 The workflow of this study. * p < 0.05; ** p < 0.01; *** p < 0.001; ns, no statistical significance. Abbreviations: NPC: nasopharyngeal carcinoma; PAX5: paired box 5. |
Results
Correlation Between PAX5 Expression and Clinical Characteristics of NPC Patients
Among the nine PAX genes, PAX5 results were consistent in GSE12452, GSE180272, GSE53819, GSE61218, and GSE64634, and was significantly downregulated in the NPC tissues (Figure 2A). ROC curve analysis showed that the sensitivity and specificity of PAX5 in detecting NPC when the threshold was set as 7.424 were 85.7% and 78.7%, respectively; while the area under curve (AUC) was 0.864 (95% CI: 0.801–0.926) (Figure 2B). Low PAX5 expression was significantly correlated with a high overall clinical stage in GSE102349 (Figure 2C). Zhang et al27 reported that the patients with tumor microenvironment (TME) subtype I had the worst PFS compared to those with TME subtype II or III. Consistently, our findings showed that the patients with TME subtype I had lower PAX5 expression than those with TME subtype II or III (Figure 2D), while no significant difference was found in the different morphology in NPC (Figure 2E). PAX5 expression was negatively associated with the expression of relevant EBV genes including EBNA1, RPMS1, and A73 (Figure 2F). DNA methylation analysis in GSE62336 and GSE52068 showed that the methylation levels for the transcription start sites (TSS) and body of PAX5 gene were higher in NPC samples than in normal samples (Figure 2G).
 |
Figure 2 Correlation between PAX5 expression and clinical characteristics of NPC patients. (A) Differential expression of the PAX gene family between NPC samples and control samples in GSE12452, GSE180272, GSE53819, GSE61218, and GSE64634 datasets. (B) ROC curve of PAX5 for NPC diagnosis. (C) Differential expression of PAX5 between stage I/II and stage III/IV NPC tissues. (D) Differential expression of PAX5 among the three TME subtypes. (E) Differential expression of PAX5 among the three types of morphology. (F) Correlation between PAX5 and EBV genes expression. (G) Differences in DNA methylation levels of PAX5 between NPC and normal tissues in GSE62336 and GSE52068 datasets. * p < 0.05; ** p < 0.01; *** p < 0.001; **** p < 0.0001; ns: no statistical significance. Abbreviations: AUC, area under curve; NPC, nasopharyngeal carcinoma; logFC, log fold change; PAX5, paired box 5; ROC, receiver-operating characteristic; TME, tumor microenvironment; TSS, transcription start site. |
Prognostic Value of PAX5 in NPC
NPC patients in the GSE102349 dataset were divided into two groups according to the optimal cutoff value of PAX5 expression. Kaplan-Meier curve showed that the low PAX5 expression was significantly correlated with poor PFS in NPC patients (Figure 3A). The areas under time-dependent ROC curve (AUC) at 1- and 2-year were 0.619 and 0.688, respectively (Figure 3B). Multivariable COX analysis revealed that PAX5 was an independent predictor of PFS (HR: 0.251, 95% CI: 0.0754–0.835) (Figure 3C). A prognostic nomogram was constructed based on the result of multivariable COX analysis (Figure 3D), which generated calibration curves for predicting the 1- and 2-year PFS with good discrimination (Figure 3E and F). The concordance index of the nomogram was 0.819 (95% CI: 0.716–0.922), indicating that PAX5 had good prognostic ability.
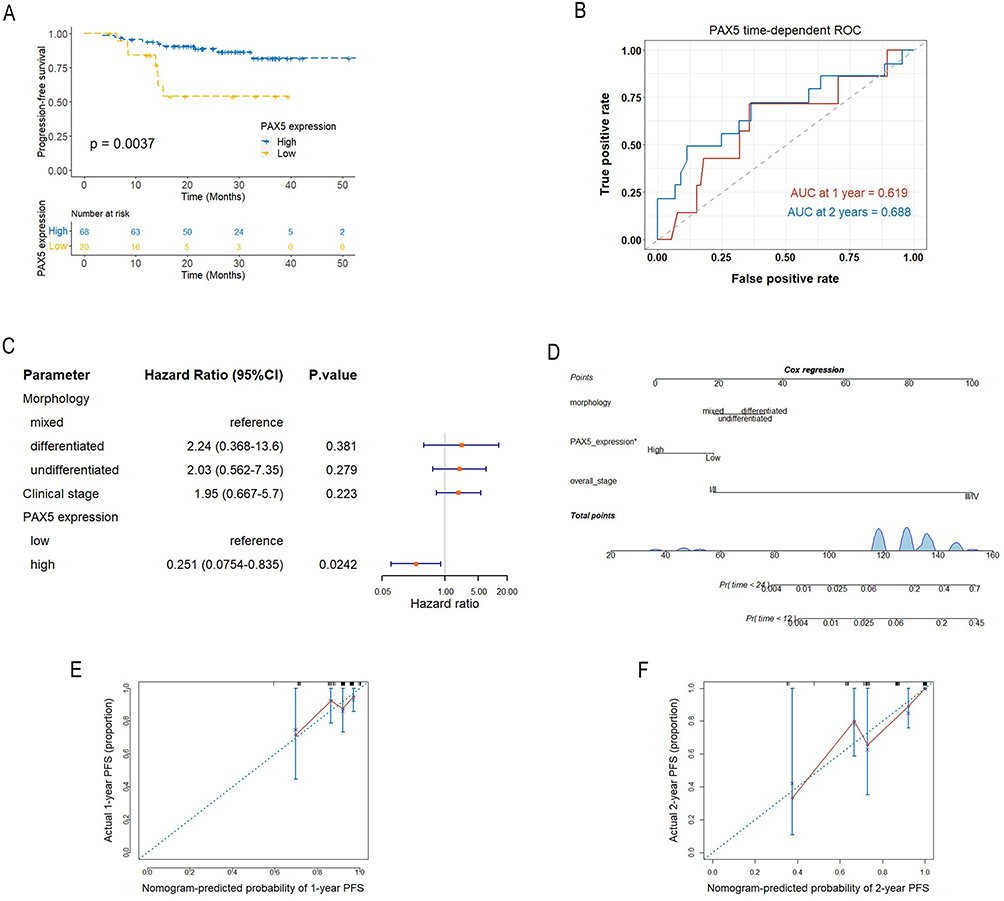 |
Figure 3 Analysis of prognostic potential of PAX5 in NPC. (A) Kaplan-Meier curve comparing PFS between high and low PAX5 expression groups. (B) Time-dependent ROC curve for PAX5 at 1- and 2-year PFS. (C) Multivariate COX regression model of morphology, clinical stage and PAX5 expression. (D) Nomogram plot predicting the 1- and 2-year PFS. (E, F) Calibration plot of the nomogram predicting the 1- and 2-year PFS. Abbreviations: AUC, area under curve; NPC, nasopharyngeal carcinoma; PAX5, paired box 5; ROC, receiver-operating characteristic; PFS, progression-free survival. |
Identification of Related Genes and Biological Function of PAX5 in NPC
The ssGSEA analysis identified a total of 443 DEGs with the adjusted p value < 0.05 and |logFC| > 1 between the high and low PAX5 expression groups, of which 32 genes were downregulated and 411 were upregulated in the high expression group (Figure 4A). The results of GO (Figure 4B), KEGG (Figure 4C), and Reactome (Figure 4D) analyses showed that the immune-related terms including B cell receptor signal pathways, NK cell mediated cytotoxicity, and chemokine signalling pathway were mainly enriched in the high PAX5 expression group. In addition, cell cycle, small cell lung cancer, Hippo signalling pathway, Wnt signalling pathway, and ECM-receptor interaction were enriched in NPC with low PAX5 expression.
 |
Figure 4 Analysis of biological function of PAX5 in NPC. (A) Volcano plot of differentially expressed PAX5-related genes. GO (B), KEGG (C), and Reactome (D) between the high and low PAX5 expression groups. Abbreviations: adj.P.Val, adjusted P value; GO, Gene ontology; KEGG, Kyoto encyclopedia of genes and genomes; log2FC, log2 fold change; NPC, nasopharyngeal carcinoma; PAX5, paired box 5. |
Association of PAX5 Expression with Immune Cell Infiltration in NPC
The results of ssGSEA analysis suggested that high expression of PAX5 was associated with immune-related pathways. We subsequently performed differential analyses of the expression of 23 and 24 immune cell subtypes. The results showed that the infiltration levels of T cells, B cells, NK cells and DC cells were significantly upregulated in the high PAX5 expression group (Figure 5A and B). Correlation analyses showed that PAX5 expression was positively associated with immune, stromal and ESTIMATE scores (Figure 5C-E).
 |
Figure 5 Correlation between expression of PAX5 and immune cell infiltration in NPC. Infiltration levels of 23 (A) and 24 (B) immune cell subtypes between the high and low PAX5 expression groups. Correlation between PAX5 expression and immune score (C), stromal score (D), and ESTIMATE score (E). * p < 0.05; ** p < 0.01; *** p < 0.001. Abbreviations: ESTIMATE, Estimation of STromal and Immune cells in MAlignant Tumours using Expression data; NPC, nasopharyngeal carcinoma; PAX5, paired box 5; ns, no statistical significance. |
Hot tumors with high levels of immune cell infiltration in TME are reported to be responsive to immune checkpoint inhibitors (ICIs), unlike cold tumors that are reported to be in the immunosuppressive state.28 Based on the 11 hot tumor genes signature (CCL5, CD3E, CD4, CD8A, CD8B, CXCL9, CXCL10, CXCL11, CXCR3, PDCD1, and SOD3) and 3 cold tumor genes signature (CCL20, CXCL1, and CXCL2), we classified 113 NPC samples from GSE102349 into cold tumor and hot tumor groups using NMF algorithm (Figure 6A and B). Patients in the hot tumor group had better PFS and higher expression of PAX5 than patients in the cold tumor group (Figure 6C and D).
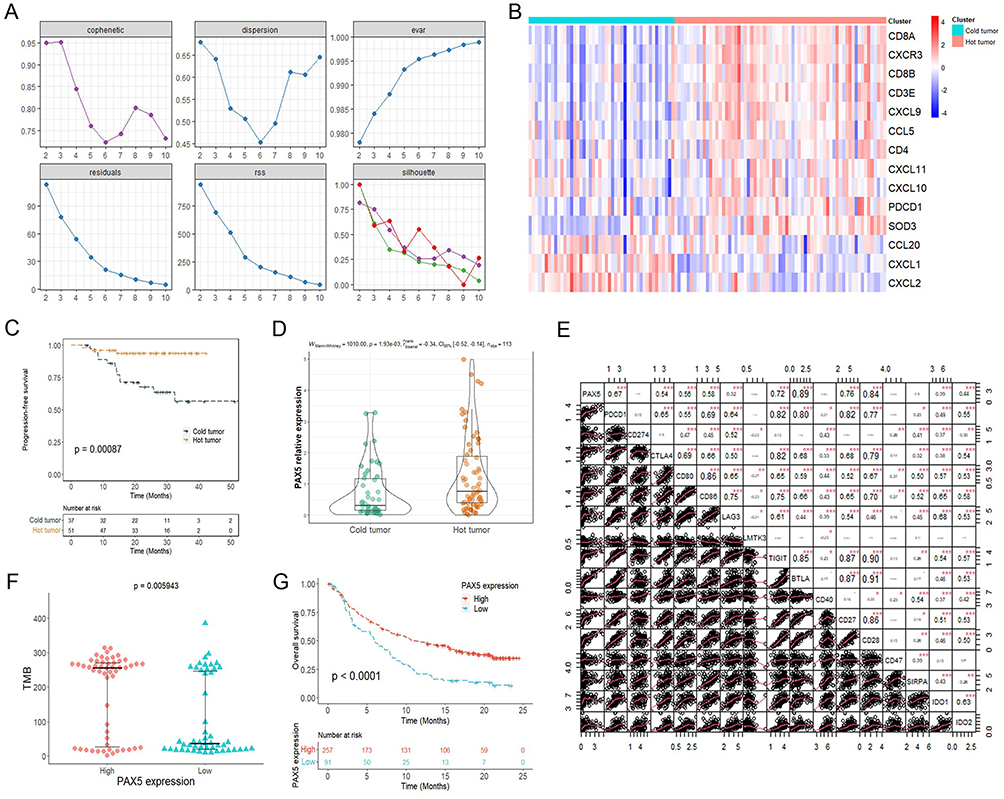 |
Figure 6 PAX5 improved response to immunotherapy. (A) The cophenetic, dispersion, evar, residuals, rss, and silhouette plots in non-negative matrix factorization clustering analysis. (B) Expression of gene signatures in hot and cold tumor samples. (C) Kaplan-Meier curve of progression-free survival for hot and cold tumor groups. (D) Comparison of PAX5 expression between the cold and hot tumor groups. (E) Correlation between PAX5 expression and immune checkpoint genes expression. (F) Correlation between PAX5 expression and TMB. (G) Kaplan-Meier curve of overall survival for the high and low PAX5 expression groups in IMvigor210 cohort. *p < 0.05; ** p < 0.01; *** p < 0.001. Abbreviations: TMB, tumor mutation burden; NPC, nasopharyngeal carcinoma; PAX5, paired box 5. |
Further analysis displayed that PAX5 expression was positively correlated with most of the immune checkpoint-related genes (PDCD1, CTLA4, CD80, CD86, LAG3, TIGIT, BTLA, CD27, CD28, IDO1, and IDO2) (Figure 6E). Tumor mutation burden (TMB) is one of the main biomarkers for predicting the efficacy of ICIs therapy. We found that TMB was elevated in the high PAX5 expression group (Figure 6F). Due to lack of public data on NPC patients treated with anti-PD-L1 therapy, we utilized the IMvigor210 dataset to investigate the potential of PAX5 in predicting response to ICI therapy in NPC patients. Kaplan-Meier curve showed that patients in the high PAX5 expression group had better response to anti-PD-L1 than patients in the low expression group (Figure 6G). These results strongly suggested that PAX5 might enhance the therapeutic effect of ICIs.
Verification of Findings from Bioinformatics Analysis Using Clinical Samples and NPC Cell Lines
The qPCR results showed that PAX5 mRNA expression was significantly lower in NPC tissues than in rhinitis samples (Figure 7A and B) and was absent in NPC cells (Figure 7C), which was stent with the results from GEO data analysis. Then, the methylation status of the promoter region of PAX5, from −469 bp ~ −248 bp, containing 19 CpG sites were detected by bisulfite sequencing. In compared with normal nasopharyngeal epithelial cell line NP69, NPC cell lines CNE1, CNE2, and 5–8F showed a higher methylation ratio (Figure 8A and B). The similar finding was observed in tissue level, which contained 16 NPC tissues and 3 non-cancerous nasopharyngeal epitheliums (Figure 8C). A significant increase in PAX5 expression was found in CNE1 and CNE2 after 5-Aza-dC treatment (Figure 8D), indicating that PAX5 was hypermethylated in NPC.
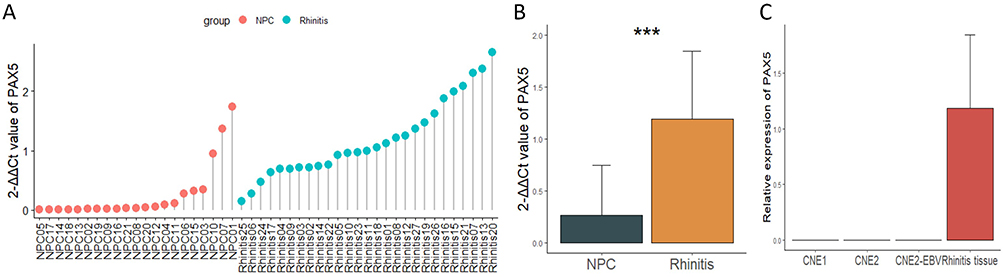 |
Figure 7 The expression of PAX5 in NPC tissues and cell lines. (A) Expression in NPC tissues and rhinitis tissues was analyzed using qRT-PCR. (B) Differential mRNA expression of PAX5 between NPC and rhinitis tissues. (C) The mRNA expression of PAX5 in NPC cell lines. *** p < 0.001. Abbreviations: NPC, nasopharyngeal carcinoma; PAX5, paired box 5. |
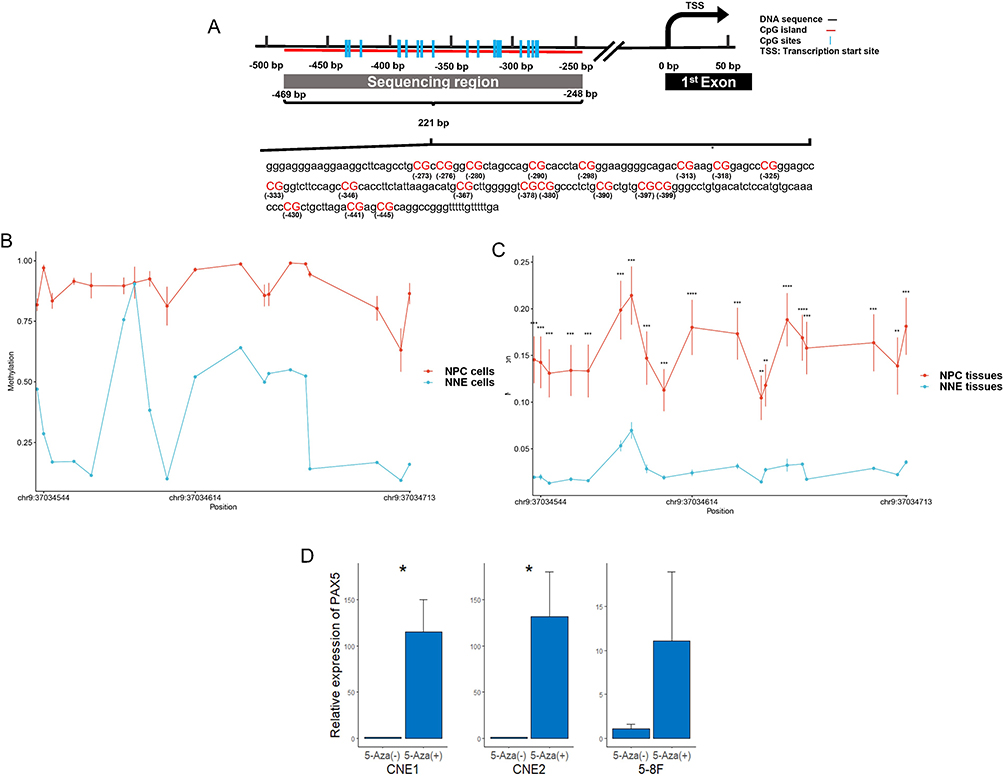 |
Figure 8 DNA promoter of PAX5 is hypermethylated in NPC cell lines and primary tumor tissues. (A) The bisulfite sequencing region contained 19 CG sites, in the CpG island located in the promoter of PAX5. The methylation level of 19 CG sites methylation was detected in cell lines including 3 NPC cell lines (CNE1, CNE2 and 5–8F) and a normal nasopharyngeal epithelial cell line NP69 (B), and 19 cases of NPC tissues and 3 cases of normal nasopharyngeal epitheliums (C). (D) Differential PAX5 expression between untreated and 5-Aza-dC-treated NPC cell lines. * p < 0.05. Abbreviations: NNE, normal nasopharyngeal epitheliums; NPC, nasopharyngeal carcinoma; PAX5, paired box 5; TSS, transcription start site. |
Restored PAX5 Suppresses the Proliferation of NPC Cells
To further address the biological role of PAX5, we established NPC cell lines (5–8F and CNE2) with PAX5 transiently expression (Figure 9A and B). CCK-8 assay was used to detect the growth of cells in the following four days after seeded in 96-well plate. As shown in Figure 9C and 5-8F and CNE2 cell lines with PAX5 overexpression growth slower than those with less PAX5. Additionally, compared with control group, less colonies were formed in 5–8F cell line with PAX5 overexpression (Figure 9D). Both CCK-8 and colony formation assays showed that overexpression of PAX5 inhibited NPC cell proliferation. Therefore, DNA hypermethylation of PAX5 that leaded to inactivation of PAX5 in NPC might contribute to accelerating the proliferation of NPC cells.
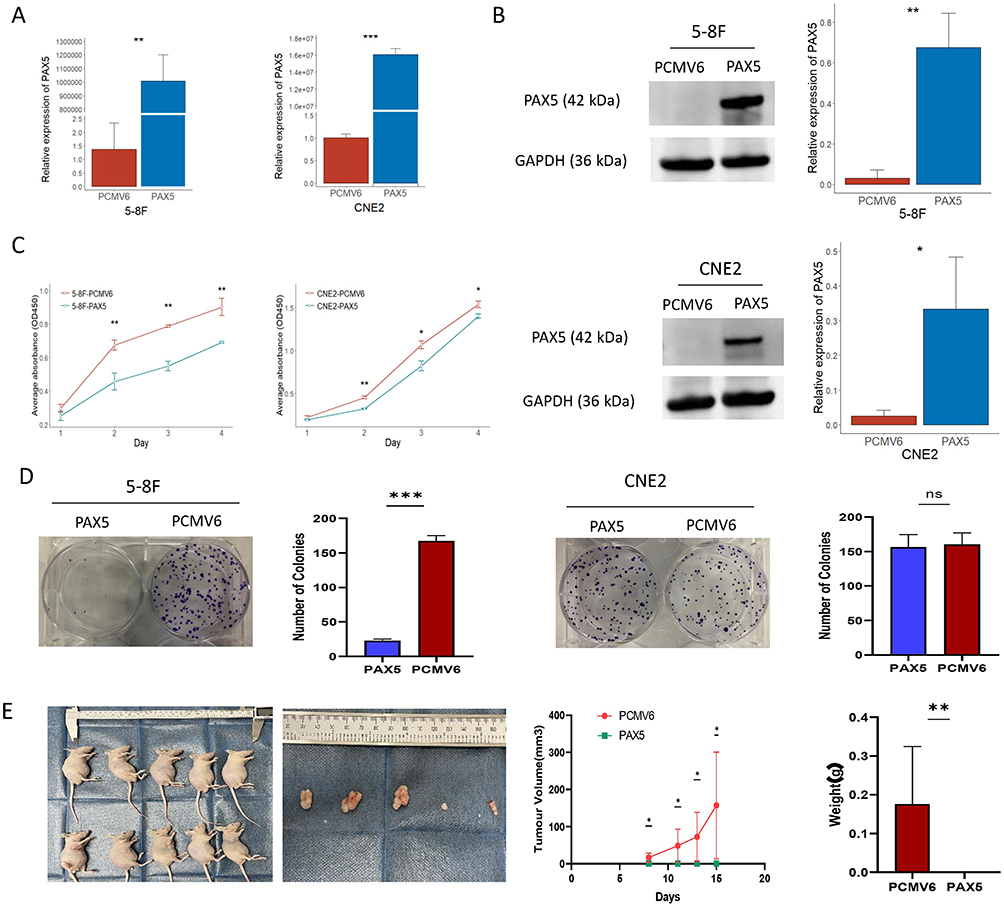 |
Figure 9 The effect of PAX5 in the proliferation of NPC cells. (A-B) Transient transfection of PAX5 plasmid and empty vector (PCMV6-Entry) into NPC cell lines 5–8F and CNE2. Real-time quantitative RT-PCR and Western blot assays were applied to confirm the transcription and translation of PAX5. (C) The proliferation ability of NPC cell lines was analyzed by CCK-8 assay. (D) Colony formation assays. (E). Subcutaneous tumor formation in nude mice at were excised 15 days after inoculation. Mice were injected with 5–8F-PAX5 and 5–8F-PCMV6-Entry. Tumor volumes and tumor weights were measured for each group (n =5 per group). * p < 0.05; ** p < 0.01; *** p < 0.001; ns: no statistical significance. Abbreviations: NPC, nasopharyngeal carcinoma; PAX5, paired box 5. |
PAX5 Suppressed NPC Tumor Growth in vivo
In the subcutaneous tumorigenesis experiments, we observed a striking absence of tumor growth in nude mice injected with 5–8F cells overexpressing PAX5, while the control group presented large subcutaneous tumors (Figure 9E).
Discussion
PAX5 is a TF that regulates B cell development and tumor progression. PAX5 can either have oncogenic or tumor suppressor function depending on different genetic backgrounds and intracellular environments of cancer. Wei Li et al reported that lncRNA XIST increased PAX5 levels by downregulating miR-338-3p expression, which promoted colorectal cancer cell proliferation, migration, and invasion.14 In prostate cancer, PAX5-induced activation of lncRNA FOXP4-AS1 through sequestration of miR-3184-5p, is correlated with decreased cell apoptosis and increased cell proliferation,15 while PAX5-induced transcription of LINC01194 has been reported to exert oncogenic effects.29 PAX5-induced upregulation of PTGS2 expression leads to cisplatin resistance in bladder cancer,30 while PAX5-induced upregulation of miR-215 or suppression of NF-κB activity inhibits the proliferation of breast cancer.12,31 MiR-1254-induced inactivation of PAX5 suppresses Hippo-YAP signaling pathway to promote proliferation, migration, and invasion of hepatocellular carcinoma cells.13
In the present study, our findings suggested that PAX5 might play a potential role as a tumor suppressor in NPC. We found that PAX5 expression was significantly lower in NPC tissues compared to normal tissues and exhibited excellent diagnostic performance with AUC of 0.864. In addition, NPC patients with low PAX5 expression were related to advanced clinical stage and poor prognosis. Pathway enrichment analysis suggested that downregulation of PAX5 might be involved in a series of pathways including cell cycle and tumor-related processes. PAX5 was associated with the dysregulation of Hippo and Wnt signalling pathways, which promoted the transcription of multiple oncogenes. Additionally, PAX5 was significantly correlated with immune infiltration, and had potential as a predictive factor for response to ICI therapy just like TMB. Results of the in vitro and in vivo experiments confirmed low mRNA expression of PAX5 in NPC tissues and cell lines, and PAX5 overexpression inhibited NPC cell proliferation and tumor growth in nude mice.
Aberrant DNA methylation may contribute to the dysregulation of gene expression in human tumors. PAX5 gene promoter has been found to be hypermethylated and its expression downregulated in esophageal squamous cell carcinoma, head and neck squamous cell carcinoma, breast cancer, and adrenocortical carcinoma.11,32–34 Analysis based on the GEO datasets revealed that PAX5 was hypermethylated in NPC samples, and this result was verified in vitro. Moreover, PAX5 overexpression inhibited the proliferation of NPC cell lines. These findings suggested that DNA hypermethylation may be responsible for the inactivation of PAX5 in NPC, which may result in accelerating the proliferation of NPC cells.
EBV has a high affinity for B lymphocytes, infects over 90% of adults worldwide and is associated with many human diseases, such as Burkitt’s lymphoma, Hodgkin’s lymphoma, and NPC.35 Since PAX5 is a B cell-specific activator, it can activate the Wp promoter on the EBV genome to stimulate B cell proliferation and transformation.36 Meanwhile, PAX5 inhibits the lytic phase in EBV by binding BZLF1 and promotes transcription of EBNA1 to maintain viral latency in B cells.37,38 However, the mechanism of establishing EBV latent infection in non-B cells remains unknown. EBV establishes type II latent infection in NPC. In this study, PAX5 expression was negatively associated with EBV genes expression in NPC. Therefore, there is need for in depth analysis of the interaction between EBV and PAX5 and to determine the effect of this interaction on NPC initiation and progression.
There are some limitations in the present study. Since we evaluated the diagnostic and prognostic value of PAX5 in NPC based on the retrospective data from the GEO cohorts, we need to verify the clinical application value of PAX5 in a prospective cohort. A further limitation of the study is the lack of in vitro and in vivo experiments to validate the correlation with PAX5 expression and immune infiltration. In addition, mechanistic experiments are required to verify the role and function of PAX5 in NPC.
Conclusion
Our findings suggested that PAX5 might be a tumor suppressor as low expression of PAX5 in NPC was associated with unfavorable outcomes. Our findings also indicated that PAX5 can act as a novel potential diagnostic and prognostic marker for NPC. Further studies are required to determine if PAX5 regulates EBV and to identify the mechanism of PAX5-mediated regulation of NPC-related genes.
Data Sharing Statement
The raw data that support the findings of this study are available on online databases, as described in the Materials and Methods section. The data are available from the corresponding author upon reasonable request.
Ethics Approval and Informed Consent
This study’s ethical approval (No. LL2021-53) was granted by the Ethics Committee of Wuzhou Red Cross Hospital. The patients’ consents were previously obtained in a separate study, and due to objective circumstances, it is not feasible to obtain consent again for this particular study. Informed consent for this research was waived as it poses minimal risk beyond that encountered in daily life. We affirm our commitment to maintaining patient data confidentiality, and the study was conducted in adherence to the principles outlined in the Declaration of Helsinki.
Funding
This research was funded by National Natural Science Foundation of China (grant number 81860601) and Natural Science Foundation of Guangxi Province (grant number 2020GXNSFAA297105) grant to Y.Cai.
Disclosure
The authors report no conflicts of interest in this work.
References
1. Chang ET, Ye W, Zeng YX, Adami HO. The Evolving Epidemiology of Nasopharyngeal Carcinoma. Cancer Epidemiol Biomarkers Prev. 2021;30(6):1035–1047. doi:10.1158/1055-9965.EPI-20-1702
2. Luo W. Nasopharyngeal carcinoma ecology theory: cancer as multidimensional spatiotemporal “unity of ecology and evolution” pathological ecosystem. Theranostics. 2023;13(5):1607–1631. doi:10.7150/thno.82690
3. Lambert SA, Jolma A, Campitelli LF, et al. The Human Transcription Factors. Cell. 2018;172(4):650–665. doi:10.1016/j.cell.2018.01.029
4. Thompson B, Davidson EA, Liu W, et al. Overview of PAX gene family: analysis of human tissue-specific variant expression and involvement in human disease. Hum Genet. 2021;140(3):381–400. doi:10.1007/s00439-020-02212-9
5. Alwosaibai K, Al-Hujaily EM, Alamri S, et al. PAX2 induces vascular-like structures in normal ovarian cells and ovarian cancer. Exp Ther Med. 2022;23(6):412. doi:10.3892/etm.2022.11339
6. Feng Y, Tang Y, Mao Y, et al. PAX2 promotes epithelial ovarian cancer progression involving fatty acid metabolic reprogramming. Int J Oncol. 2020;56(3):697–708. doi:10.3892/ijo.2020.4958
7. Fan T, Zhu W, Kong M, et al. The Significance of PAX8-PPARgamma Expression in Thyroid Cancer and the Application of a PAX8-PPARgamma-Targeted Ultrasound Contrast Agent in the Early Diagnosis of Thyroid Cancer. Contrast Media Mol Imaging. 2022;2022:3265342. doi:10.1155/2022/3265342
8. Patel SA, Hirosue S, Rodrigues P, et al. The renal lineage factor PAX8 controls oncogenic signalling in kidney cancer. Nature. 2022;606(7916):999–1006. doi:10.1038/s41586-022-04809-8
9. Chaves-Moreira D, Mitchell MA, Arruza C, et al. The transcription factor PAX8 promotes angiogenesis in ovarian cancer through interaction with SOX17. Sci Signal. 2022;15(728):eabm2496. doi:10.1126/scisignal.abm2496
10. Lu S, Yakirevich E, Hart J, Wang L, Wang Y. PAX8 Expression in Breast Cancer. Appl Immunohistochem Mol Morphol. 2021;29(4):293–298. doi:10.1097/PAI.0000000000000883
11. Kurimoto K, Hayashi M, Guerrero-Preston R, et al. PAX5 gene as a novel methylation marker that predicts both clinical outcome and cisplatin sensitivity in esophageal squamous cell carcinoma. Epigenetics. 2017;12(10):865–874. doi:10.1080/15592294.2017.1365207
12. Leblanc N, Harquail J, Crapoulet N, Ouellette RJ, Robichaud GA. Pax-5 Inhibits Breast Cancer Proliferation Through MiR-215 Up-regulation. Anticancer Res. 2018;38(9):5013–5026. doi:10.21873/anticanres.12820
13. Lu X, Yang C, Hu Y, et al. Upregulation of miR-1254 promotes Hepatocellular Carcinoma Cell Proliferation, Migration, and Invasion via Inactivation of the Hippo-YAP signaling pathway by decreasing PAX5. J Cancer. 2021;12(3):771–789. doi:10.7150/jca.49680
14. Li W, He Y, Cheng Z. Long noncoding RNA XIST knockdown suppresses the growth of colorectal cancer cells via regulating microRNA-338-3p/PAX5 axis. Eur J Cancer Prev. 2021;30(2):132–142. doi:10.1097/CEJ.0000000000000596
15. Wu X, Xiao Y, Zhou Y, Zhou Z, Yan W. LncRNA FOXP4-AS1 is activated by PAX5 and promotes the growth of prostate cancer by sequestering miR-3184-5p to upregulate FOXP4. Cell Death Dis. 2019;10(7):472. doi:10.1038/s41419-019-1699-6
16. Mariathasan S, Turley SJ, Nickles D, et al. TGFbeta attenuates tumour response to PD-L1 blockade by contributing to exclusion of T cells. Nature. 2018;554(7693):544–548. doi:10.1038/nature25501
17. Ritchie ME, Phipson B, Wu D, et al. limma powers differential expression analyses for RNA-sequencing and microarray studies. Nucleic Acids Res. 2015;43(7):e47. doi:10.1093/nar/gkv007
18. Simon N, Friedman J, Hastie T, Tibshirani R. Regularization Paths for Cox’s Proportional Hazards Model via Coordinate Descent. J Stat Softw. 2011;39(5):1–13. doi:10.18637/jss.v039.i05
19. Yoshihara K, Shahmoradgoli M, Martinez E, et al. Inferring tumour purity and stromal and immune cell admixture from expression data. Nat Commun. 2013;4(1):2612. doi:10.1038/ncomms3612
20. Bindea G, Mlecnik B, Tosolini M, et al. Spatiotemporal dynamics of intratumoral immune cells reveal the immune landscape in human cancer. Immunity. 2013;39(4):782–795. doi:10.1016/j.immuni.2013.10.003
21. Charoentong P, Finotello F, Angelova M, et al. Pan-cancer Immunogenomic Analyses Reveal Genotype-Immunophenotype Relationships and Predictors of Response to Checkpoint Blockade. Cell Rep. 2017;18(1):248–262. doi:10.1016/j.celrep.2016.12.019
22. Hanzelmann S, Castelo R, Guinney J. GSVA: gene set variation analysis for microarray and RNA-seq data. BMC Bioinf. 2013;14(1):7. doi:10.1186/1471-2105-14-7
23. Wu T, Hu E, Xu S, et al. clusterProfiler 4.0: a universal enrichment tool for interpreting omics data. Innovation. 2021;2(3):100141. doi:10.1016/j.xinn.2021.100141
24. Yu G, He QY. ReactomePA: an R/Bioconductor package for reactome pathway analysis and visualization. Mol Biosyst. 2016;12(2):477–479. doi:10.1039/C5MB00663E
25. Gaujoux R, Seoighe C. A flexible R package for nonnegative matrix factorization. BMC Bioinf. 2010;11(1):367. doi:10.1186/1471-2105-11-367
26. Lu Y, Zhou X, Zhao W, et al. Epigenetic Inactivation of Acetyl-CoA Acetyltransferase 1 Promotes the Proliferation and Metastasis in Nasopharyngeal Carcinoma by Blocking Ketogenesis. Front Oncol. 2021;11:667673. doi:10.3389/fonc.2021.667673
27. Zhang L, MacIsaac KD, Zhou T, et al. Genomic Analysis of Nasopharyngeal Carcinoma Reveals TME-Based Subtypes. Mol Cancer Res. 2017;15(12):1722–1732. doi:10.1158/1541-7786.MCR-17-0134
28. Zhang J, Huang D, Saw PE, Song E. Turning cold tumors hot: from molecular mechanisms to clinical applications. Trends Immunol. 2022;43(7):523–545. doi:10.1016/j.it.2022.04.010
29. Song HR, Guo XB, Duan Y, Meng HY, Wang ZY. PAX5-induced upregulation of LINC01194 exerts oncogenic properties by regulating GOLPH3 expression via miR-486-5p in prostate cancer. Eur Rev Med Pharmacol Sci. 2021;25(6):2528–2541. doi:10.26355/eurrev_202103_25416
30. Dong BW, Zhang WB, Qi SM, Yan CY, Gao J. Transactivation of PTGS2 by PAX5 signaling potentiates cisplatin resistance in muscle-invasive bladder cancer cells. Biochem Biophys Res Commun. 2018;503(4):2293–2300. doi:10.1016/j.bbrc.2018.06.151
31. Harquail J, LeBlanc N, Landry C, Crapoulet N, Robichaud GA. Pax-5 Inhibits NF-kappaB Activity in Breast Cancer Cells Through IKKepsilon and miRNA-155 Effectors. J Mammary Gland Biol Neoplasia. 2018;23(3):177–187. doi:10.1007/s10911-018-9404-4
32. Guerrero-Preston R, Michailidi C, Marchionni L, et al. Key tumor suppressor genes inactivated by “greater promoter” methylation and somatic mutations in head and neck cancer. Epigenetics. 2014;9(7):1031–1046. doi:10.4161/epi.29025
33. Li X, Huang J, Luo X, et al. Paired box 5 is a novel marker of breast cancers that is frequently downregulated by methylation. Int J Biol Sci. 2018;14(12):1686–1695. doi:10.7150/ijbs.27599
34. Lippert J, Altieri B, Morrison B, et al. Prognostic Role of Targeted Methylation Analysis in Paraffin-embedded Samples of Adrenocortical Carcinoma. J Clin Endocrinol Metab. 2022;107(10):2892–2899. doi:10.1210/clinem/dgac470
35. Damania B, Kenney SC, Raab-Traub N. Epstein-Barr virus: biology and clinical disease. Cell. 2022;185(20):3652–3670. doi:10.1016/j.cell.2022.08.026
36. Tierney R, Nagra J, Hutchings I, et al. Epstein-Barr virus exploits BSAP/Pax5 to achieve the B-cell specificity of its growth-transforming program. J Virol. 2007;81(18):10092–10100. doi:10.1128/JVI.00358-07
37. Liu CD, Lee HL, Peng CW. B Cell-Specific Transcription Activator PAX5 Recruits p300 To Support EBNA1-Driven Transcription. J Virol. 2020;94(7):e0202819. doi:10.1128/JVI.02028-19
38. Raver RM, Panfil AR, Hagemeier SR, Kenney SC. The B-cell-specific transcription factor and master regulator Pax5 promotes Epstein-Barr virus latency by negatively regulating the viral immediate early protein BZLF1. J Virol. 2013;87(14):8053–8063. doi:10.1128/JVI.00546-13
 © 2024 The Author(s). This work is published and licensed by Dove Medical Press Limited. The full terms of this license are available at https://www.dovepress.com/terms.php and incorporate the Creative Commons Attribution - Non Commercial (unported, v3.0) License.
By accessing the work you hereby accept the Terms. Non-commercial uses of the work are permitted without any further permission from Dove Medical Press Limited, provided the work is properly attributed. For permission for commercial use of this work, please see paragraphs 4.2 and 5 of our Terms.
© 2024 The Author(s). This work is published and licensed by Dove Medical Press Limited. The full terms of this license are available at https://www.dovepress.com/terms.php and incorporate the Creative Commons Attribution - Non Commercial (unported, v3.0) License.
By accessing the work you hereby accept the Terms. Non-commercial uses of the work are permitted without any further permission from Dove Medical Press Limited, provided the work is properly attributed. For permission for commercial use of this work, please see paragraphs 4.2 and 5 of our Terms.