Back to Journals » Clinical Epidemiology » Volume 14
Cholesterol and Hypertension Treatment Improve Coronary Risk Prediction but Not Time-Dependent Covariates or Competing Risks
Authors Subirana I, Camps-Vilaró A ![]() , Elosua R
, Elosua R ![]() , Marrugat J
, Marrugat J ![]() , Tizón-Marcos H, Palomo I, Dégano IR
, Tizón-Marcos H, Palomo I, Dégano IR ![]()
Received 23 May 2022
Accepted for publication 12 August 2022
Published 11 October 2022 Volume 2022:14 Pages 1145—1154
DOI https://doi.org/10.2147/CLEP.S374581
Checked for plagiarism Yes
Review by Single anonymous peer review
Peer reviewer comments 2
Editor who approved publication: Professor Irene Petersen
Isaac Subirana,1,2 Anna Camps-Vilaró,1,2 Roberto Elosua,2– 4 Jaume Marrugat,1,2 Helena Tizón-Marcos,2,5,6 Ivan Palomo,7 Irene R Dégano1– 3
1REGICOR Study Group, Department of Epidemiology and Public Health, Hospital del Mar Medical Research Institute (IMIM), Barcelona, Spain; 2Consorcio de Investigación Biomédica en Red, Cardiovascular Diseases, Instituto de Salud Carlos III (ISCIII), Madrid, Spain; 3Department of Medicine, University of Vic-Central University of Catalonia (Uvic-UCC), Vic, Spain; 4Cardiovascular Epidemiology and Genetics Group, Department of Epidemiology and Public Health, IMIM, Barcelona, Spain; 5Cardiology Department, Hospital del Mar, Barcelona, Spain; 6Biomedical Research in Heart Diseases Group, Department of Translational Clinical Research, IMIM, Barcelona, Spain; 7Department of Clinical Biochemistry and Immunohematology, Thrombosis Research Center, Faculty of Health Sciences, Medical Technology School, Talca, Chile
Correspondence: Irene R Dégano, Department of Epidemiology and Public Health, Hospital del Mar Medical Research Institute, Dr. Aiguader 88, 1 st Floor office 122.10, Barcelona, 08003, Spain, Email [email protected]
Background and Aims: Cardiovascular (CV) risk functions are the recommended tool to identify high-risk individuals. However, their discrimination ability is not optimal. While the effect of biomarkers in CV risk prediction has been extensively studied, there are no data on CV risk functions including time-dependent covariates together with other variables. Our aim was to examine the effect of including time-dependent covariates, competing risks, and treatments in coronary risk prediction.
Methods: Participants from the REGICOR population cohorts (North-Eastern Spain) aged 35– 74 years without previous history of cardiovascular disease were included (n = 8470). Coronary and stroke events and mortality due to other CV causes or to cancer were recorded during follow-up (median = 12.6 years). A multi-state Markov model was constructed to include competing risks and time-dependent classical risk factors and treatments (2 measurements). This model was compared to Cox models with basal measurement of classical risk factors, treatments, or competing risks. Models were cross-validated and compared for discrimination (area under ROC curve), calibration (Hosmer–Lemeshow test), and reclassification (categorical net reclassification index).
Results: Cancer mortality was the highest cumulative-incidence event. Adding cholesterol and hypertension treatment to classical risk factors improved discrimination of coronary events by 2% and reclassification by 7– 9%. The inclusion of competing risks and/or 2 measurements of risk factors provided similar coronary event prediction, compared to a single measurement of risk factors.
Conclusion: Coronary risk prediction improves when cholesterol and hypertension treatment are included in risk functions. Coronary risk prediction does not improve with 2 measurements of covariates or inclusion of competing risks.
Keywords: risk assessment, coronary disease, risk factors, longitudinal studies
Introduction
Cardiovascular diseases (CVD) are the leading causes of mortality, morbidity, and healthcare cost worldwide. Trends in population aging, obesity, and diabetes predict an increased CVD burden over time.1 If we seek to reduce CVD, we need to strengthen CVD prevention. Improved CVD prevention can be achieved by interventions targeted to general population and to high-risk individuals, with both approaches aimed at controlling modifiable risk factors.
Identification of high-risk individuals usually relies on cardiovascular (CV) risk functions2 to predict the risk of developing a CVD event in a period of time, taking into account the presence of known risk factors. Current CV risk functions include, among others, the Framingham risk score,3 the Pooled Cohort equations,4 SCORE5,6 and QRISK.7 These risk functions can be used across populations after a calibration process considering the incidence of CVD and the prevalence of CV risk factors. For example, Framingham-REGICOR calibrated the Framingham risk score to the Spanish population.8–10
A CV risk function allows the categorization of individuals according to their risk, from low to very high. The next step is to establish the appropriate intensity of preventive strategies, such as lipid-lowering and hypertension treatments.2
Unfortunately, identification of high-risk individuals is not entirely straightforward. In a recent study of 1.8 million subjects, 3 commonly used CV risk functions did not accurately identify high-risk individuals.11 In addition, the Spanish Framingham-REGICOR function has shown that more than 60% of coronary events occur in individuals identified as having low or moderate risk.10
Risk functions necessarily apply baseline values of population risk factors, and most do not consider competing risks of death or the overall effect of increasing age and its unknown influence on risk factors. This neglects individual trends related to risk factors and treatments. It seems logical that including all this information could increase accuracy of risk prediction.7,12,13 Unfortunately, recent publications show contradictory results when competing risks are included in the models.5,14,15 There is a need to more thoroughly test what appears to be a promising option and focus the efforts of further research on the most promising findings.
In this study, we aimed to develop expanded risk functions to predict coronary events, modeling various combinations of competing risks and longitudinal data of risk factors and treatments in the REGICOR population cohorts from northeastern Spain. We also compared the calibration, discrimination, and reclassification achieved by the resulting functions with the coronary risk function currently used in clinical practice in the region (Framingham-REGICOR).
Materials and Methods
Study Population
This was a cohort study in Girona Heart Registry (REGICOR) data from 3 population-based cohorts recruited in Girona province in 1995, 2000, and 2005.16 Data from an interview, a physical examination, and several questionnaires, completed at baseline and at 2 re-examinations in 2010 and 2018, were available for all participants.17 Follow-up for CV events and cause-specific mortality was available through December 2016. Median follow-up was 12.6 years. The present study included risk factor data from baseline and the 2010 re-examination, and follow-up data for CV events and mortality. We did not consider the 2018 data, given the lack of corresponding follow-up data. From all REGICOR cohorts, we included 8470 participants aged 35–74 years, without previous cardiovascular events, and with data in the variables of interest and consent for research use of anonymized data (Supplemental Figure 1).
Ethics
The REGICOR population cohorts protocol was approved by the Parc de Salut Mar ethics committee (#2011/4309/I) and informed consent was obtained from all participants. All procedures were performed according to the Helsinki Declaration and Spain’s guidelines and regulations.
Exposure Variables and Outcomes of Interest
We included the following variables, obtained at baseline, as potential predictors: age, sex, and education level attained (primary or lower, secondary, university). Additional predictive variables, recorded at baseline and at re-examination, included lipid profile (triglycerides, total cholesterol, and high and low density lipoprotein cholesterol [HDL and LDL, respectively]), systolic and diastolic blood pressure, diabetes status, smoking status (smokers and ex-smokers <1 year, non-smokers and ex-smokers ≥1 year), body mass index, and treatment for hypercholesterolemia, hypertension, and diabetes, defined as diagnosis, current treatment or fasting glucose ≥126 mg/dL.
Outcomes of interest during the follow-up were coronary heart disease (acute myocardial infarction –AMI– or angina). We considered stroke events, cancer mortality, and other CV death as competing events. CVD events were identified by linkage with the REGICOR AMI Registry,18 and with the Program of Analytical Data for Research and Innovation in health (PADRIS) of the Government of Catalonia, which includes all hospital admissions and the official mortality register. Events were identified using ICD-9/-10 codes and cases were classified in an event committee as previously reported.19
Statistical Analysis
Descriptive Statistics
Continuous variables were described with the mean and standard deviation, if normality distributed; otherwise, with the median and interquartile range. Categorical variables were reported as absolute and relative frequencies. Means were compared between groups with the t-test or with ANOVA for two or more groups, medians with the Kruskal–Wallis test, and proportions with the Chi-square or Fisher exact test, as appropriate. Incidence curves were estimated for each outcome, taking into account other events such as competing outcomes, using the “mstate” R package.
Modeling
We examined the inclusion of potential predictors and of interactions in the models. Interactions between age and risk factors and between treatments and the corresponding risk factor were tested. A backward stepwise process based on the Akaike Information Criteria informed the selection of independent variables to be included in the models.
Four models were developed: 1) the basic model included the basal values of the 8 variables in the Framingham-REGICOR function (age, sex, total cholesterol, HDL cholesterol, systolic blood pressure, diastolic blood pressure, diabetes, and smoking status); 2) the basic model plus the treatments identified as significant (control of cholesterol and hypertension); 3) the basic model with time-dependent covariates; 4) the basic model plus the significant treatments and time-dependent covariates. No interactions were retained in the models.
These models were duplicated to enable analysis with and without competing risks. For each variable in all 8 models, we reported Hazard Ratios (HR), 95% confidence intervals (CI) and p-values.
The four models without competing risks were fitted with Cox Proportional Hazard regression. In the models that took competing risks into account, a more complex statistical design was required. When these models did not include time-dependent covariates (models 1 and 2), a modification of the Cox Proportional Hazards regression adapted for competing risks (“cmprsk” R package) was applied. When time-dependent covariates were included (models 3 and 4), we used a multi-state Markov model described in Supplemental Figure 2 (“msm” R package). To test the proportional hazards assumption of Cox models, we analyzed weighted residuals (“cox.zph” R function).
Validation
Models were validated using a 5-fold strategy. Models were derived in 4/5 folds and then the derived models were fitted in the remaining fold. This process was repeated 5 times to obtain the predictions for all participants. Predictions were computed at 15 years. In models not including time-dependent covariates, baseline values were used.
In models with competing risks, discrimination was assessed with the area under the receiver operating characteristic curve (“timeROC” R package); otherwise, with the Somer D index. A competing risk estimate was calculated using the “mstate” R package. Calibration was determined with the Hosmer–Lemeshow test using an adapted version of the Nam-D’Agostino statistic.20
Reclassification was examined with the categorical Net Reclassification Index (NRI).21,22 We used the published cut-off points of the Framingham-REGICOR function, translated to 15 years of follow-up (7.5% and 15%). The NRI was adapted for competing events as the Hosmer–Lemeshow test. To calculate discrimination, calibration, and reclassification of models with time-dependent covariates, we used the betas of the fitted models and the mean value of the two risk factor measurements.
Analyses were done for the whole cohort, and separately for women and men. Tests were declared statistically significant when p-value <0.05. All analyses were performed with the R software (version 4.0.5) [R Core Team (2021). R: A language and environment for statistical computing. R Foundation for Statistical Computing, Vienna, Austria. URL https://www.R-project.org/].
Data Availability
Data supporting the results reported in this manuscript are available from the corresponding author.
Results
Descriptive Analysis
Participants with no events during the follow-up were younger at baseline (52 years), more frequently women (56%), and had some university studies (46%) (Table 1, Panel A). Participants who had a coronary event during the follow-up showed, at baseline, the highest levels of triglycerides (115 mg/dl), total and LDL cholesterol (226 and 155 mg/dl, respectively), the lowest HDL cholesterol (45 mg/dl) levels, and greater prevalence of smoking (27%) and cholesterol treatment (23%), compared to those with no events. Participants who had a coronary event or a stroke during the follow-up had the highest diastolic blood pressure levels (82 mmHg) at baseline. Participants who died from other CV causes showed, at baseline, the highest systolic blood pressure levels (144 mmHg), body mass index (29 Kg/m2), prevalence of diabetes (30%), and treated hypertension and diabetes (37% and 20%, respectively). Descriptive analyses at re-examination are presented in Supplemental Table 1.
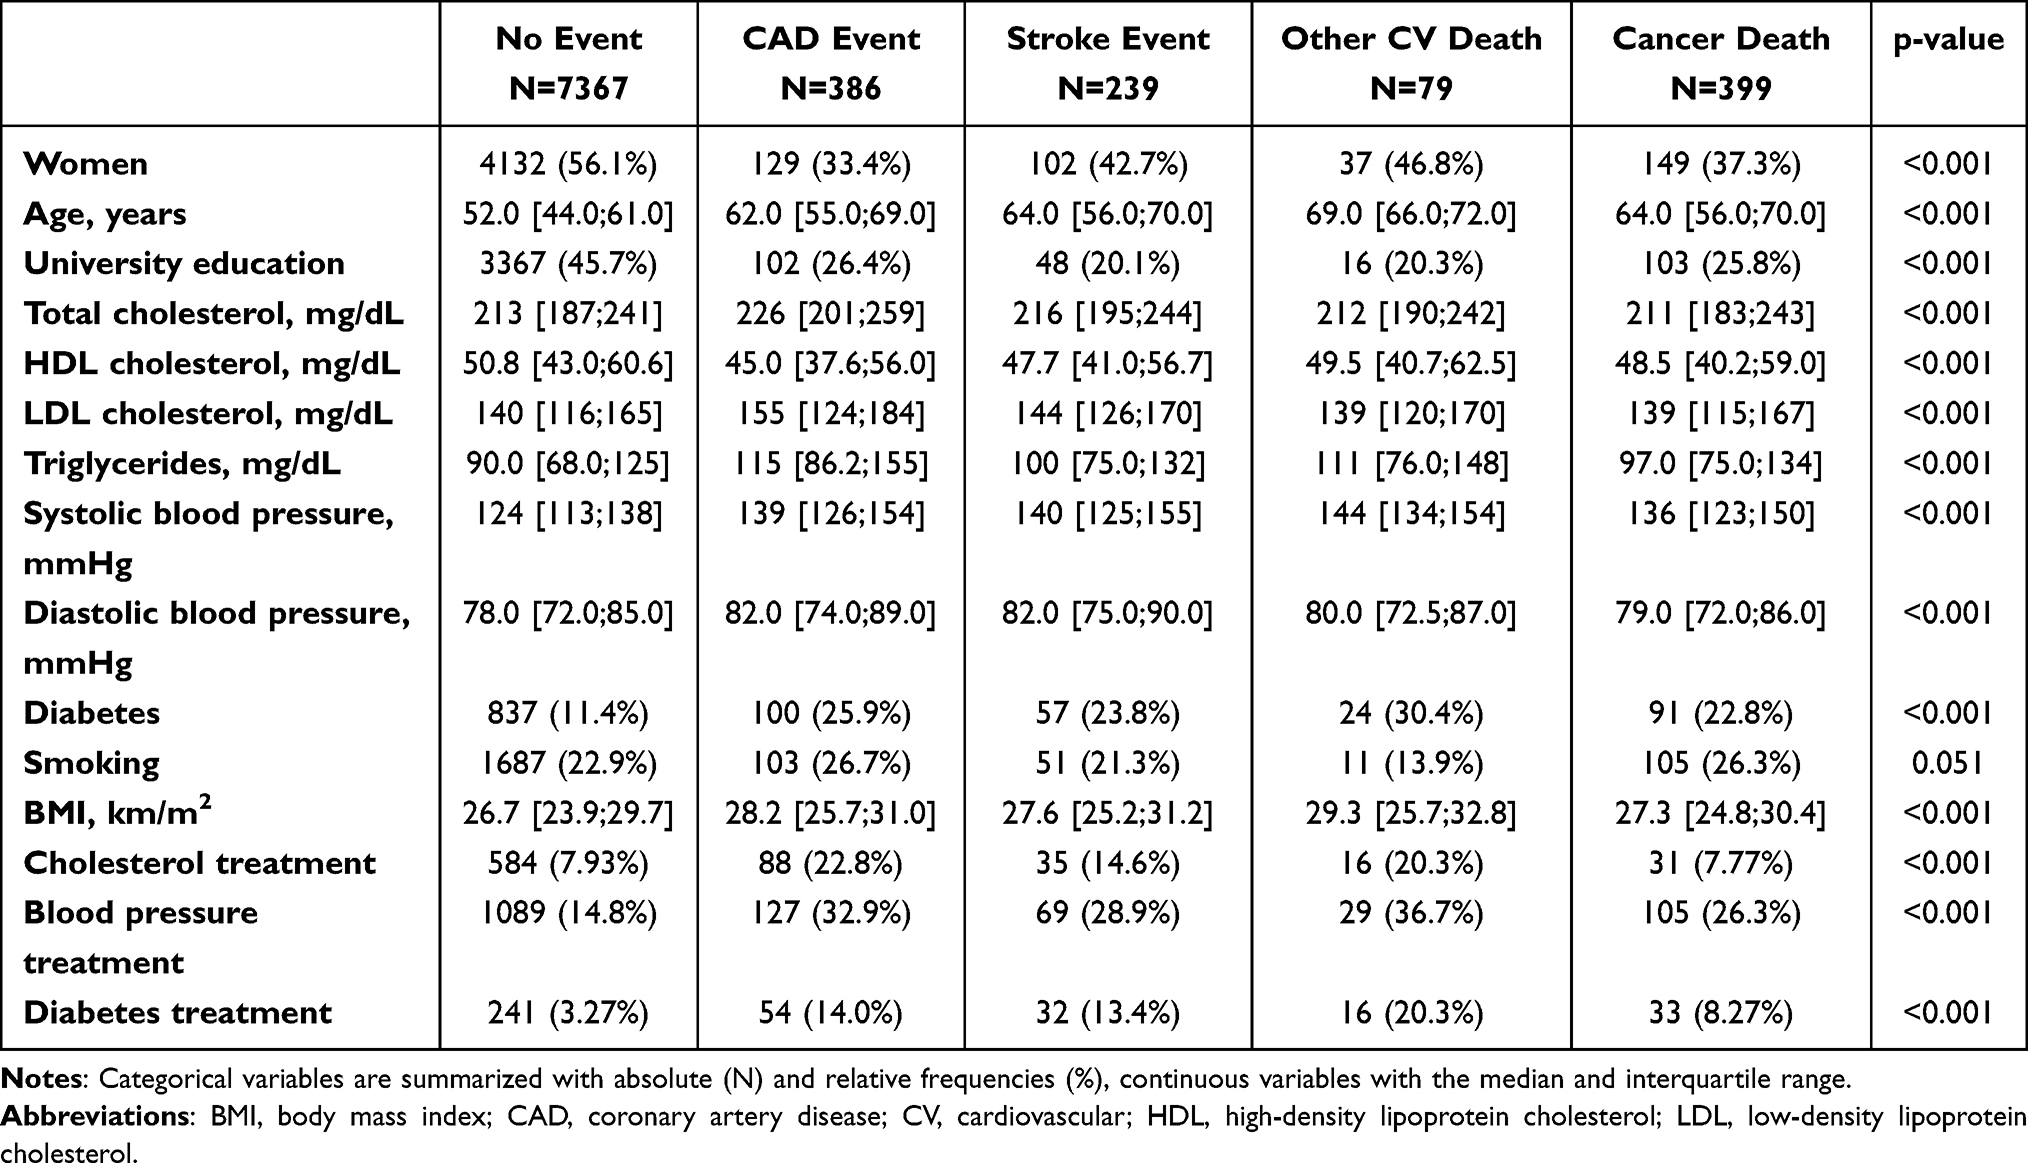 |
Table 1 Baseline Demographic Characteristics and Cardiovascular Risk Factors of the Included Participants by Groups Depending on the Event That Occurred in the Follow-Up |
Event Incidence
There were 1103 events during the follow-up: 386 coronary events (35%), 239 stroke events (22%), 79 other CV deaths (7%), and 399 cancer deaths (36%). At 10-year follow-up, coronary events were the most frequent, but at the end of follow-up, the most frequent event was cancer mortality (Figure 1). Overall, women had greater cancer mortality than incidence of coronary events, while both incidences were very similar in men (Supplemental Figure 3).
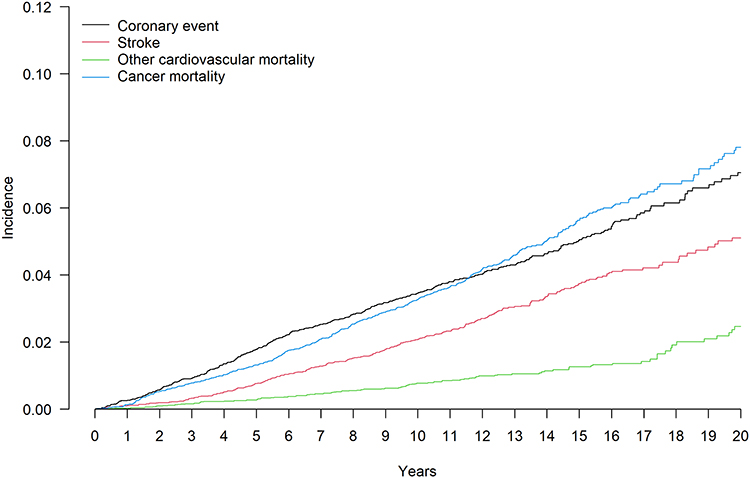 |
Figure 1 Cumulative incidence of coronary events, stroke, other cardiovascular mortality, and cancer mortality during the follow-up. Incidence units are 1/100 inhabitants. Abbreviation: CV, cardiovascular. |
Model Description
Variable estimates for the best discrimination models are presented in Table 2. When competing risks were taken into account, the best model to predict coronary events included baseline values of the Framingham-REGICOR coronary risk function variables (age, sex, total and HDL cholesterol, blood pressure, and presence of diabetes and smoking), together with treatment of cholesterol and hypertension (Table 2).
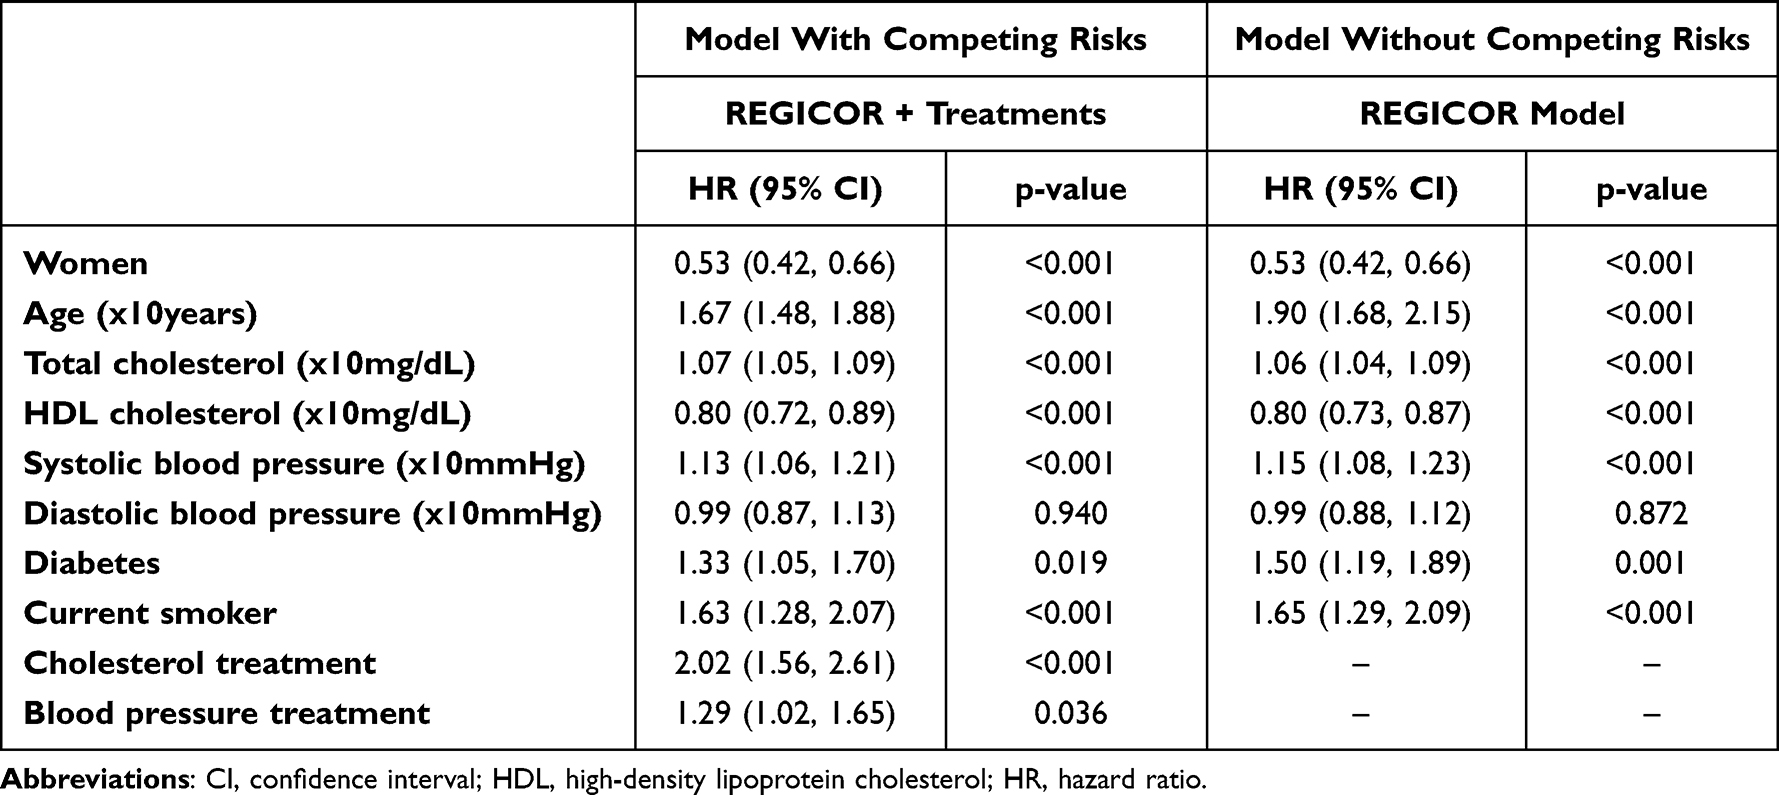 |
Table 2 Variable Estimates in the Models with Best Discrimination |
When competing risks were not included, the best model was the Framingham-REGICOR function, either with baseline or with time-dependent covariates. In the model with competing risks, cholesterol and hypertension treatment doubled the risk of coronary events and increased the risk by 29%, respectively. Model estimates were similar in women and men (Supplemental Table 2).
Model Performance
Models predicting coronary events that included competing risks showed better discrimination when cholesterol and hypertension treatment were considered (Figure 2). The use of baseline or time-dependent covariates did not modify model discrimination significantly. Models without competing risks showed similar discrimination regardless of the inclusion of treatments and time-dependent covariates.
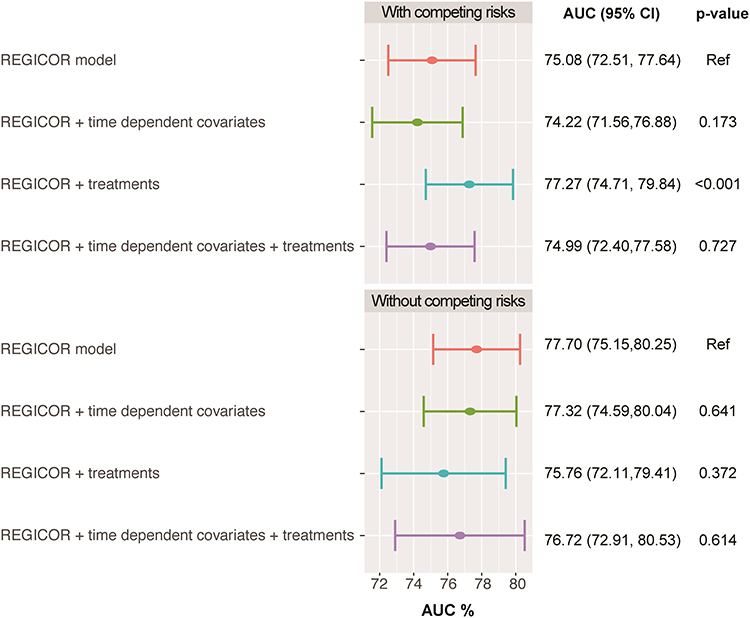 |
Figure 2 Discrimination of the models. Abbreviations: AUC, area under the receiver operating characteristic curve; CI, confidence interval; Ref, reference; REGICOR, Girona Heart Registry. |
Calibration was acceptable in models predicting coronary events (Supplemental Table 3). Even in the models showing a significant lack of calibration, only a slight overestimation of risk was observed in the highest risk decile (Supplemental Figure 4). With or without competing risks, reclassification improved when cholesterol and hypertension treatment was included (Table 3).
 |
Table 3 Reclassification by the Categorical Net Reclassification Index Between the Basic Model with the Variables from the Framingham-REGICOR Function and the Models with and without Treatments, Time-Dependent Covariates and Competing Risks |
Discussion
In this study, we observed an improvement in modeling the prediction of coronary events when cholesterol and hypertension treatments were added to classical CV risk factors. Also, categorical reclassification of models was improved when treatment information was included. Calibration of models was acceptable. On the other hand, including 2 measurements of risk factors or competing risks, as has been suggested by some authors,6,23–26 did not improve predictive capacity in our cohort.
The improved discrimination in coronary risk prediction we observed when treatment information was included affirms previous reports. For example, two equations that estimate both coronary and cerebrovascular events include some treatment data: the QRISK3 function,7 which predicts CV events and is the recommended algorithm in UK, includes treatment for hypertension; the ACSVD risk calculator for CV events, based on Pooled Cohort Equations4 and currently recommended in the US, includes statin use and hypertension treatment.27 However, treatment information is neither included in the SCORE2 risk functions recommended by the European Society of Cardiology nor in any other European risk function except for the QRISK3. In Spain, FRESCO28 is the most recent CV risk prediction study using representative cohorts of the population in Spain, and developed separate risk functions for coronary and cerebrovascular events. The FRESCO Study found a significant interaction between systolic blood pressure and hypertension treatment only for coronary risk prediction, not for cerebrovascular events.
Based on the current literature,23–26 we anticipated that models with more than one measurement of CV risk factors and treatments would discriminate better than models with the basal measurement only, in the context of coronary event prediction. However, in models including time-dependent covariates, we observed no effect.
While there is no prior information on the effect of time-dependent covariates in the prediction of coronary events, some studies have analyzed the effect of mean values of longitudinal data of risk factors on CV risk prediction. In a recent international study, discrimination and reclassification slightly improved in CV event prediction when algorithms included mean values of repeated measurements of systolic blood pressure and total and HDL cholesterol values.23 Other studies also found small improvements in CV risk prediction with the addition of summary information of more than one measurement of blood pressure and lipids.24–26
Our study is the first to model more than one measurement of classical risk factors (systolic and diastolic blood pressure, total and HDL cholesterol, smoking, diabetes) together with cholesterol and hypertension treatment in the prediction of coronary events. We observed no improvements with the additional measurement. It is possible that adding only one more measurement is not enough to improve model discrimination. In addition, currently available methods may not be adequate to assess performance of models with time-dependent covariates.
Most of the models we developed showed lower discrimination when competing risks were included, compared to those without competing risks, regardless of the use of time-dependent or basal covariates. The exception was the coronary model with competing risks and treatment information. The recent SCORE2 risk function,6 which incorporates competing risks and is based on data from more than 1 million participants, reported better discrimination than the SCORE risk function29 without competing risks. However, the SCORE2 function also incorporates non-fatal events, a large number of contemporary cohorts, and a recalibration of risk models with updated incidence and risk factor data. Given that the individual effect of competing risk information on discrimination is not reported for the SCORE2 function, and that the improvements mentioned likely contributed to the improvement in model discrimination, it is not possible to know whether competing risks improved discrimination in the SCORE2 function.
On the other hand, recent large studies focused on the impact of competing risks have shown similar discrimination in the prediction of CV events by models with and without competing risks.14,15 There are several possible explanations for the differences in results between these studies and ours, including differences in sample size, analysis of CV versus coronary risk prediction, and the number of competing risk events considered (only one, non-CV mortality, versus 3 competing events in our models). Altogether, our results and previous studies on the role of competing risk in CV risk prediction suggest that competing risk information may not improve model discrimination. However, it could be useful to focus our analysis on specific subgroups, such as the elderly. In addition, models including competing risks could be helpful to public health implementation of chronic disease prevention programs, as they provide risk prediction for more than one disease.
In the ongoing quest to improve coronary risk prediction, this study contributes a complex analysis that included time-dependent covariates, competing risks, treatments, and interactions. A strength of the study is the data from more than 8000 participants in 3 population-based cohorts, which have been extensively used in the study of risk factor prevalence and coronary risk prediction. These population cohorts used validated instruments to obtain basal and re-examination data and obtained follow-up information through verified sources. In addition, the statistical methods used in this study, which include cross-validation, support the robustness of the obtained results.
This study has also some limitations to be considered. The REGICOR population cohorts included in this study were recruited in 1995–2000–2005, and the incidence of CV events varied slightly between these cohorts, which could hamper the validity of our results. However, in recent decades, the trend in AMI in the study region has shown a slowly decreasing trend, with no evidence of a major shift in recent years.30 Secondly, the number of events included in this study is low, particularly the competing risk event classified as “other CV mortality”; a rate typical of northeastern Spain but lower than in other European regions.30 While the results obtained could have been affected by this factor, their validity is supported by the robust analysis performed.
Conclusions
Coronary risk prediction in northeastern Spain improved when cholesterol and hypertension treatment were considered together with classical CV risk factors. Contributing to the discussion of multiple risk factor measurements and consideration of competing risks in risk prediction models, our data suggest that two measurements over time are not enough to improve CV risk prediction, compared to a basal measurement only and that including competing risks may not improve CV risk prediction in a general population.
Abbreviations
AMI, Acute myocardial infarction; CV, Cardiovascular; CVD, Cardiovascular disease; HDL, High-density lipoprotein cholesterol; LDL, Low-density lipoprotein cholesterol; NRI, Net reclassification index; REGICOR, Girona Heart Registry.
Acknowledgments
The authors want to thank all REGICOR investigators and participants. The abstract of this paper was presented at the ESC Preventive Cardiology Congress 2022 as a poster presentation with interim findings. The poster’s abstract was published in a Supplement Issue of the European Journal of Preventive Cardiology in May 2022.
Funding
This study was funded by the Carlos III Health Institute and the European Regional Development Fund (FIS PI12/00232, FIS PI15/00051, FIS PI18/00030, PI21/00163 and CB16/11/00229, CB16/11/00246 from CIBERCV), by the Government of Catalonia through the Agency for Management of University and Research Grants (PERIS SLT002/16/00088, 2017SGR222), and by the Spanish Society of Cardiology (Proyectos de la SEC para Investigación Clínica 2019). The sponsors were not involved in any of the stages from study design to submission of the paper.
Disclosure
The authors report no conflicts of interest in this work.
References
1. Bhupathiraju SN, Hu FB. Epidemiology of obesity and diabetes and their cardiovascular complications. Circ Res. 2016;118(11):1723–1735. doi:10.1161/CIRCRESAHA.115.306825
2. Visseren FLJ, Mach F, Smulders YM, et al. 2021 ESC guidelines on cardiovascular disease prevention in clinical practice. Eur J Prev Cardiol. 2022;29(1):5–115. doi:10.1093/eurjpc/zwab154
3. D’Agostino RB Sr, Vasan RS, Pencina MJ, et al. General cardiovascular risk profile for use in primary care: the Framingham Heart Study. Circulation. 2008;117(6):743–753. doi:10.1161/CIRCULATIONAHA.107.699579
4. Goff DC Jr, Lloyd-Jones DM, Bennett G, et al. 2013 ACC/AHA guideline on the assessment of cardiovascular risk: a report of the American College of Cardiology/American Heart Association task force on practice guidelines. J Am Coll Cardiol. 2014;63(25Pt B):2935–2959. doi:10.1016/j.jacc.2013.11.005
5. Hageman S, Pennells L, Ojeda F; SCORE2 working group and ESC Cardiovascular risk collaboration. SCORE2 risk prediction algorithms: new models to estimate 10-year risk of cardiovascular disease in Europe. Eur Heart J. 2021;42(25):2439–2454. doi:10.1093/eurheartj/ehab309
6. de Vries TI, Cooney MT, Selmer RM; SCORE2 working group and ESC Cardiovascular risk collaboration. SCORE2-OP risk prediction algorithms: estimating incident cardiovascular event risk in older persons in four geographical risk regions. Eur Heart J. 2021;42(25):2455–2467. doi:10.1093/eurheartj/ehab312
7. Hippisley-Cox J, Coupland C, Brindle P. Development and validation of QRISK3 risk prediction algorithms to estimate future risk of cardiovascular disease: prospective cohort study. BMJ. 2017;357:j2099. doi:10.1136/bmj.j2099
8. Marrugat J, D’Agostino R, Sullivan L, et al. An adaptation of the Framingham coronary heart disease risk function to European Mediterranean areas. J Epidemiol Community Health. 2003;57(8):634–638. doi:10.1136/jech.57.8.634
9. Marrugat J, Subirana I, Comín E, et al.; VERIFICA Investigators. Validity of an adaptation of the Framingham cardiovascular risk function: the VERIFICA Study. J Epidemiol Community Health. 2007;61(1):40–47. doi:10.1136/jech.2005.038505
10. Marrugat J, Vila J, Baena-Díez JM, et al. Validez relativa de la estimación del riesgo cardiovascular a 10 años en una cohorte poblacional del estudio REGICOR. [Relative validity of the 10-year cardiovascular risk estimate in a population cohort of the REGICOR study]. Rev Esp Cardiol. 2011;64(5):385–394. Spanish. doi:10.1016/j.recesp.2010.12.011
11. van Staa TP, Gulliford M, Ng ES, Goldacre B, Smeeth L. Prediction of cardiovascular risk using Framingham, ASSIGN and QRISK2: how well do they predict individual rather than population risk? PLoS One. 2014;9(10):e106455. doi:10.1371/journal.pone.0106455
12. Veronesi G, Tunstall-Pedoe H, Ferrario MM, et al.; MORGAM Project. Combined effect of educational status and cardiovascular risk factors on the incidence of coronary heart disease and stroke in European cohorts: implications for prevention. Eur J Prev Cardiol. 2017;24(4):437–445. doi:10.1177/2047487316679521
13. Karp I, Abrahamowicz M, Bartlett G, Pilote L. Updated risk factor values and the ability of the multivariable risk score to predict coronary heart disease. Am J Epidemiol. 2004;160(7):707–716. doi:10.1093/aje/kwh258
14. Livingstone S, Morales DR, Donnan PT, et al. Effect of competing mortality risks on predictive performance of the QRISK3 cardiovascular risk prediction tool in older people and those with comorbidity: external validation population cohort study. Lancet Healthy Longev. 2021;2(6):e352–e361. doi:10.1016/S2666-7568(21)00088-X
15. Cooper H, Wells S, Mehta S. Are competing-risk models superior to standard Cox models for predicting cardiovascular risk in older adults? Analysis of a whole-of-country primary prevention cohort aged 65 years. Int J Epidemiol. 2022;51(2):604–614. doi:10.1093/ije/dyab116
16. Grau M, Subirana I, Elosua R, et al. Trends in cardiovascular risk factor prevalence (1995–2000–2005) in northeastern Spain. Eur J Cardiovasc Prev Rehabil. 2007;14(5):653–659. doi:10.1097/HJR.0b013e3281764429
17. Redondo A, Benach J, Subirana I, et al. Trends in the prevalence, awareness, treatment, and control of cardiovascular risk factors across educational level in the 1995–2005 period. Ann Epidemiol. 2011;21(8):555–563. doi:10.1016/j.annepidem.2011.02.008
18. Marrugat J, Sala J, Manresa JM, et al.; REGICOR Investigators. Acute myocardial infarction population incidence and in-hospital management factors associated to 28-day case-fatality in the 65 year and older. Eur J Epidemiol. 2004;19(3):231–237. doi:10.1023/B:EJEP.0000020446.57845.b0
19. Dégano IR, Marrugat J, Grau M, et al. The association between education and cardiovascular disease incidence is mediated by hypertension, diabetes, and body mass index. Sci Rep. 2017;7(1):12370. doi:10.1038/s41598-017-10775-3
20. D’Agostino RB, Byung-Ho N. Evaluation of the performance of survival analysis models: discrimination and calibration measures. Handb Stat. 2004;23:1–25.
21. Pencina MJ, D’Agostino RB, Steyerberg EW. Extensions of net reclassification improvement calculations to measure usefulness of new biomarkers. Stat Med. 2011;30(1):11–21. doi:10.1002/sim.4085
22. Uno H, Tian L, Cai T, Kohane IS, Wei LJ. A unified inference procedure for a class of measures to assess improvement in risk prediction systems with survival data. Stat Med. 2013;32(14):2430–2442. doi:10.1002/sim.5647
23. Paige E, Barrett J, Pennells L, et al. Use of repeated blood pressure and cholesterol measurements to improve cardiovascular disease risk prediction: an individual-participant-data meta-analysis. Am J Epidemiol. 2017;186(8):899–907. doi:10.1093/aje/kwx149
24. Bell K, Hayen A, McGeechan K, Neal B, Irwig L. Effects of additional blood pressure and lipid measurements on the prediction of cardiovascular risk. Eur J Prev Cardiol. 2012;19(6):1474–1485. doi:10.1177/1741826711424494
25. Pool LR, Ning H, Wilkins J, Lloyd-Jones DM, Allen NB. Use of long-term cumulative blood pressure in cardiovascular risk prediction models. JAMA Cardiol. 2018;3(11):1096–1100. doi:10.1001/jamacardio.2018.2763
26. Cho IJ, Sung JM, Chang HJ, Chung N, Kim HC. Incremental value of repeated risk factor measurements for cardiovascular disease prediction in middle-aged Korean adults: results from the NHIS-HEALS (National Health Insurance System-National Health Screening Cohort). Circ Cardiovasc Qual Outcomes. 2017;10(11):e004197. doi:10.1161/CIRCOUTCOMES.117.004197
27. 2018 prevention guidelines tool risk calculator [homepage on the internet]. American Heart Association. Available from: http://static.heart.org/riskcalc/app/index.html#!/baseline-risk.
28. Marrugat J, Subirana I, Ramos R, et al.; FRESCO Investigators. Derivation and validation of a set of 10-year cardiovascular risk predictive functions in Spain: the FRESCO Study. Prev Med. 2014;61:66–74. doi:10.1016/j.ypmed.2013.12.031
29. Conroy RM, Pyörälä K, Fitzgerald AP, et al.; SCORE project group. Estimation of ten-year risk of fatal cardiovascular disease in Europe: the SCORE project. Eur Heart J. 2003;24(11):987–1003. doi:10.1016/S0195-668X(03)00114-3
30. Dégano IR, Salomaa V, Veronesi G, et al.; Acute Myocardial Infarction Trends in Europe (AMITIE) Study Investigators. Twenty-five-year trends in myocardial infarction attack and mortality rates, and case-fatality, in six European populations. Heart. 2015;101(17):1413–1421. doi:10.1136/heartjnl-2014-307310
 © 2022 The Author(s). This work is published and licensed by Dove Medical Press Limited. The
full terms of this license are available at https://www.dovepress.com/terms
and incorporate the Creative Commons Attribution
- Non Commercial (unported, 3.0) License.
By accessing the work you hereby accept the Terms. Non-commercial uses of the work are permitted
without any further permission from Dove Medical Press Limited, provided the work is properly
attributed. For permission for commercial use of this work, please see paragraphs 4.2 and 5 of our Terms.
© 2022 The Author(s). This work is published and licensed by Dove Medical Press Limited. The
full terms of this license are available at https://www.dovepress.com/terms
and incorporate the Creative Commons Attribution
- Non Commercial (unported, 3.0) License.
By accessing the work you hereby accept the Terms. Non-commercial uses of the work are permitted
without any further permission from Dove Medical Press Limited, provided the work is properly
attributed. For permission for commercial use of this work, please see paragraphs 4.2 and 5 of our Terms.
Recommended articles
Development and Validation of Questionnaires to Assess Workplace Violence Risk Factors (QAWRF): A Tripartite Perspective of Worksite-Specific Determinants in Healthcare Settings
Mohd Hatta FH, Samsudin EZ, Aimran N, Ismail Z
Risk Management and Healthcare Policy 2023, 16:1229-1240
Published Date: 5 July 2023
Discrepancies in Cardiovascular Disease Risk Perception Among African American Emerging Adults
Smith SB, Magwood GS, Abshire DA, Tavakoli AS, McCutcheon GS, Jenerette C
Nursing: Research and Reviews 2025, 15:57-77
Published Date: 17 May 2025
Study on Risk Factors and Treatment Strategies for Deep Vein Thrombosis in Patients with Multiple Myeloma
Guo Y, Yan L, Yang X, Fan C, Reaila J, Jia Y, Hao X, Ju F, Shi Z
Cancer Management and Research 2025, 17:1667-1677
Published Date: 15 August 2025
Effects of Health Action Process Approach (HAPA)-Guided Exercise Rehabilitation on Cardiovascular Risk Factors in Perimenopausal Women with CHD: A Randomized Controlled Trial
Guo J, Huang P, Wu L, Meng X
International Journal of Women's Health 2026, 18:601762
Published Date: 16 May 2026