Back to Journals » Risk Management and Healthcare Policy » Volume 19
Associations Between Longitudinal Changes in Frailty and Incident Arthritis: A Multi-Cohort Study
Authors Han Z, Qu H ![]() , Wang X
, Wang X ![]() , Ma H
, Ma H ![]() , Song S
, Song S
Received 25 December 2025
Accepted for publication 7 March 2026
Published 17 March 2026 Volume 2026:19 591789
DOI https://doi.org/10.2147/RMHP.S591789
Checked for plagiarism Yes
Review by Single anonymous peer review
Peer reviewer comments 2
Editor who approved publication: Dr Gulsum Kaya
Zhiyan Han,1 Haiyan Qu,2 Xinping Wang,3 Huifen Ma,4 Suhang Song5
1School of Healthcare Security, Shandong First Medical University, Jinan, People’s Republic of China; 2School of Health Professions, University of Alabama at Birmingham, Birmingham, AL, USA; 3Teachers College, Columbia University, New York, NY, USA; 4School of Medical Management, Shandong First Medical University, Tai’an, People’s Republic of China; 5Department of Health Policy and Management, College of Public Health, University of Georgia, Athens, GA, USA
Correspondence: Huifen Ma, School of Medical Management, Shandong First Medical University, 619 Changcheng Road, Tai’an, Shandong, 271016, People’s Republic of China, Email [email protected]
Purpose: To examine the associations between baseline frailty, longitudinal changes in frailty status, and the risk of incident arthritis in older adults across diverse international populations.
Methods: We analyzed harmonized longitudinal data from four large ageing cohorts: CHARLS (China), ELSA (England), SHARE (Europe), and MHAS (Mexico). A total of 48,480 participants aged 45 years and older were included in the baseline analysis, among whom 18,820 were included in the longitudinal frailty change analysis. Frailty was assessed using a standardized frailty index. We employed Cox proportional hazards models to estimate the associations of baseline frailty and frailty transitions over two years with subsequent incident arthritis, adjusting for sociodemographic and lifestyle covariates.
Results: Higher baseline frailty levels were prospectively associated with an increased risk of incident arthritis, with Hazard Ratios (HRs) for the highest versus lowest frailty tertiles ranging from 1.26 (95% CI 1.10– 1.44) to 1.71 (95% CI 1.31– 2.23) across the cohorts. Regarding dynamic changes, worsening frailty was associated with a significantly elevated risk; specifically, transitioning from pre-frail to frail was associated with HRs ranging from 1.45 (95% CI 1.08– 1.95) in SHARE to 2.06 (95% CI 1.42– 2.98) in MHAS. In contrast, improvement in frailty status was not associated with a significant reduction in arthritis risk in any cohort.
Conclusion: The relationship between frailty and arthritis risk is markedly asymmetric. While frailty progression significantly elevates risk, restoring a robust state does not immediately reverse this vulnerability. This suggests that preventing decline is far more effective than attempting to reverse risk once damage has occurred.
Keywords: frailty, arthritis, longitudinal study, cohort study, risk factors
Introduction
Population ageing is a defining global trend of the 21st century, accompanied by a rapidly rising burden of chronic, disabling conditions, particularly musculoskeletal disorders. Arthritis has emerged as a leading cause of disability among older adults and a major public health challenge worldwide. Recent findings from the Global Burden of Disease analyses indicate that approximately 600 million people, roughly 7% to 8% of the global population, are living with arthritis. Both the prevalence and disability associated with arthritis continue to rise in most regions, especially low and middle-income countries.1,2
Against this background, there is growing interest in identifying upstream age-related vulnerability states that may help diagnose individuals at high risk of arthritis. Frailty has emerged as a key construct and a major research focus in gerontology over the past decade. It is conceptualized as a multisystem syndrome resulting from the cumulative decline in physiological reserves, which compromises the ability to maintain homeostasis and increases susceptibility to adverse health outcomes even after minor stressors.3,4 Current evidence suggests that frailty is associated with markedly increased risks of falls, hospitalization, disability, and all-cause mortality, and thus represents a major and increasingly recognized public health burden.5–7
In clinical practice, frailty and arthritis are frequently observed in the same individual, and a growing number of observational studies indicate that both frailty and pre-frailty are associated with an increased prevalence and severity of osteoarthritis and joint pain.8–11 However, the mechanism of this association remains poorly understood. Potential pathways may involve chronic low-grade systemic inflammation, a decline in musculoskeletal reserve such as sarcopenia, and metabolic disturbances such as obesity and insulin resistance, which together may accelerate joint degeneration and increase susceptibility to arthritis.5,12 Consistent with these proposed mechanisms, recent cross-sectional and mechanistic studies have explored frailty-related biological dysregulation at the molecular level and its relevance to inflammatory and musculoskeletal processes.13,14 Because arthritis was self-reported, it may include both osteoarthritis and inflammatory arthritis; nevertheless, frailty represents a common vulnerability state relevant to both conditions.
However, existing studies on the association of frailty and arthritis have predominantly relied on single-timepoint assessments of baseline frailty, providing only a static view of a fundamentally dynamic process. Capturing transitions in frailty status over time may provide a more informative reflection of underlying biological processes and offer support for predicting the risk of arthritis earlier. Furthermore, a growing body of evidence suggests that frailty is not an irreversible state itself but may be mitigated or even reversed through targeted interventions, such as engaging in physical activity and receiving nutritional support.15–17 However, it remains a critical and unresolved clinical question whether measurable improvement or reversal of frailty translates into a significantly reduced risk of incident arthritis. While frailty scores are reversible, it is unknown if the physiological damage leading to arthritis is equally reversible. We specifically tested whether the risk relationship is bidirectional (risk drops as frailty improves) or asymmetric (risk remains elevated despite improvement).
To address these gaps and inform strategies for the primary prevention of arthritis and related musculoskeletal conditions, we conducted a multi-cohort study using longitudinal data from four large and internationally diverse ageing studies: the China Health and Retirement Longitudinal Study (CHARLS), the English Longitudinal Study of Ageing (ELSA), the Survey of Health, Ageing and Retirement in Europe (SHARE), and the Mexican Health and Aging Study (MHAS). By leveraging harmonized data across these cohorts, we aimed to disentangle the separate and joint contributions of baseline frailty status and subsequent frailty transitions to the risk of incident arthritis. By clarifying whether frailty trajectories are prospectively associated with arthritis onset and whether frailty improvement confers a measurable risk reduction, this study provides empirical evidence on frailty as a potentially modifiable upstream target for preventing disabling musculoskeletal conditions.
We hypothesized that: 1) higher baseline frailty would be positively associated with a higher risk of incident arthritis; and 2) worsening frailty over time would be associated with an increased risk of incident arthritis, whereas improvement in frailty would be associated with a reduced risk.
Methods
Study Design
This study used longitudinal data from four internationally recognized ageing cohorts: CHARLS, ELSA, SHARE, and MHAS. These studies collectively included 97,743 community-dwelling adult participants aged 45 to 50 years at baseline, with follow-up interviews conducted every two to three years.18–21 A multi-cohort design was adopted to examine frailty dynamics and arthritis risk across diverse socioeconomic and healthcare contexts, leveraging harmonized and comparable health metrics across these populations. Wave 1 of CHARLS and MHAS, wave 2 of ELSA, and wave 4 of SHARE were regarded as the baseline. Changes in frailty status (ΔFI) were assessed between baseline and the subsequent survey wave. Participants were then followed for incident arthritis until the latest available wave in each cohort (Figure 1).
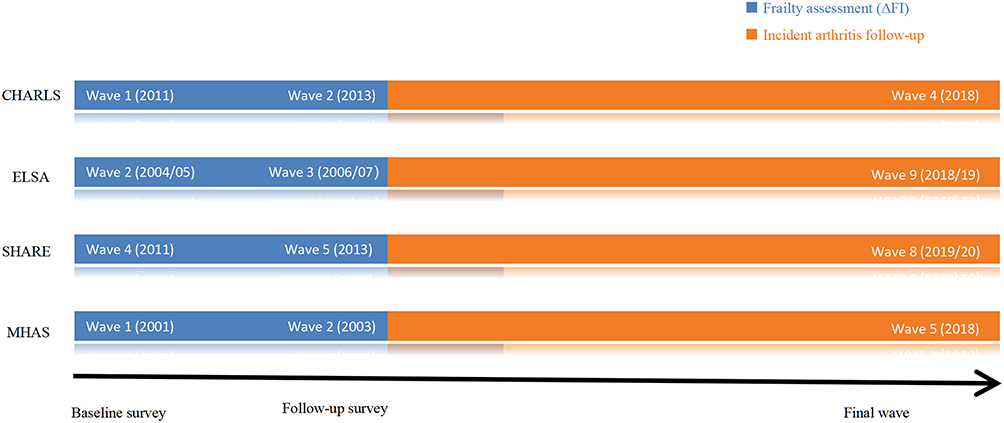 |
Figure 1 Timeline of frailty index assessments and incident arthritis follow-up in the four cohorts. |
Ethics Approval and Consent to Participate
This study is a secondary analysis of de-identified data from four ongoing longitudinal cohort studies (CHARLS, ELSA, SHARE, and MHAS). All original studies obtained ethical approval from their institutional review boards or ethics committees, and written informed consent was obtained from all participants.
The present study received ethical approval from the Medical Ethics Review Committee of Shandong First Medical University (Approval No. R202311060190). The current analysis involved no direct contact with participants and used only anonymized data. All procedures were conducted in accordance with the 1964 Declaration of Helsinki and its later amendments or comparable ethical standards.
Study Population
At baseline, a total of 97,743 participants were enrolled across the four cohorts, with 16,931 from CHARLS, 10,749 from ELSA, 56,600 from SHARE, and 13,463 from MHAS. We first excluded 30,215 individuals with missing data on the frailty index (FI) calculation at baseline. Moreover, 19,048 participants with arthritis at baseline or who were lost to follow-up were also excluded. Finally, 48,480 eligible individuals were included in baseline frailty status analyses. The participant selection process was summarized in Figure 2.
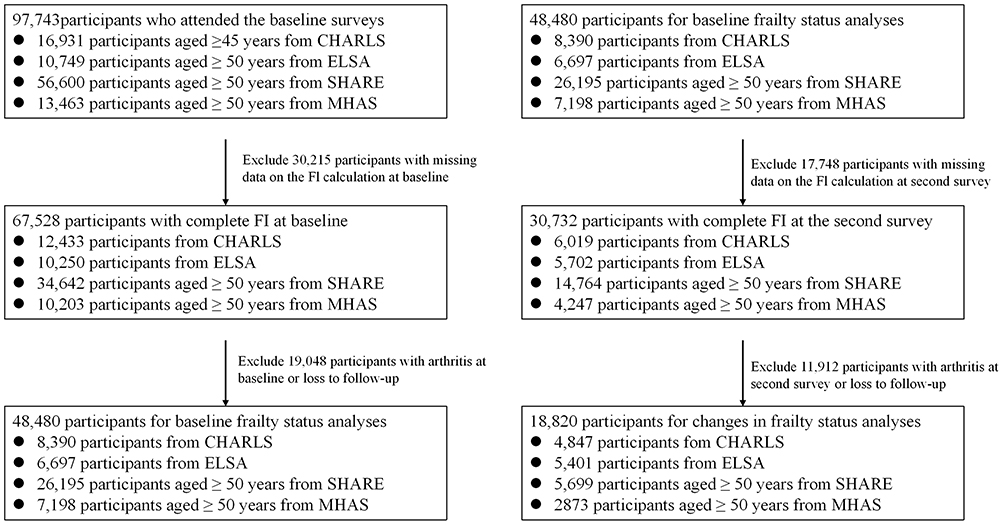 |
Figure 2 Flowchart of participant selection across four ageing cohorts (CHARLS, ELSA, SHARE, and MHAS). |
To assess changes in FI, we further excluded: 1) participants with missing FI assessments at the follow-up wave (n = 17,748), and 2) participants who were diagnosed with arthritis at the follow-up visit or lost to subsequent follow-up (n=11,912). The remaining 18,820 participants were included in the final analysis.
Assessment of Frailty
Frailty was assessed using the FI, which was calculated by the accumulation of age-related health deficits present in everyone, following established standard procedures.22,23 In CHARLS, ELSA, and SHARE, the FI was constructed from 20 items, including diseases (excluding frailty itself), symptoms, disabilities, physical function, depression, and cognition. In MHAS, the FI was calculated based on 17 deficits, as items related to chronic lung disease, psychiatric problems, and memory-related diseases were not available. (see Appendix Table A1). Although the number of deficits and specific items varied slightly across cohorts, this approach aligns with recent methodological consensus that the FI is a robust and flexible measure, where the proportion of deficit accumulation remains a consistent indicator of health status across diverse datasets.24
For the first 19 items, each deficit was scored as 1 if present and 0 if absent. Depression was measured using cohort-specific CESD or EURO-D scales and dichotomized based on validated cut-off values: CESD-10 ≥ 10 in CHARLS, CESD-8 ≥ 4 in ELSA, EURO-D ≥ 4 in SHARE, and CESD-9 ≥ 5 in MHAS. The 20th item, cognition, was represented as a continuous score ranging from 0 to 1, with a higher score indicating poorer cognition. The cognitive score was calculated as the sum of memory test scores and orientation test scores divided by 14. For each participant, the FI was calculated as the total number of deficits present divided by the total number of items. Participants were classified into three categories: robust (FI ≤ 0.10), pre-frail (0.10 < FI < 0.25), or frail (FI ≥ 0.25). To capture the dynamic nature of frailty, two continuous measures were computed: total FI (the sum of baseline and follow-up FI scores) and changes in FI (ΔFI, defined as follow-up FI scores minus baseline FI scores).
Covariates
The covariates included in this analysis comprised age, sex, marital status, educational attainment, smoking status, alcohol consumption, and physical activity. Marital status was dichotomized as married/partnered versus other (separated, divorced, unmarried, or widowed). Educational attainment was harmonized into three categories: below high school, high school, and college or above. Physical activity was defined as engaging in moderate or vigorous activity at least once per week, and physical inactivity as less frequent activity.25 Smoking and drinking states were each classified as never versus ever. Notably, information on physical activity was not available in MHAS, and data on educational attainment were largely missing in this cohort; therefore, these variables were excluded from the MHAS analyses. All covariates were included in the multivariable Cox regression models. Adjusted hazard ratios (HRs) were reported in the main tables, while unadjusted HRs were provided in the. Supplementary Tables 1–6.
Outcome Ascertainment and Follow-Up
The primary outcome was incident arthritis, identified through self-reported physician diagnosis. In CHARLS, ELSA, and SHARE, participants were asked whether they had ever been diagnosed with arthritis by a doctor. In MHAS, participants were asked, “Has a doctor or medical personnel ever told you that you have arthritis?”; affirmative responses were classified as incident arthritis. Although the exact wording differed slightly across cohorts, all items captured a physician-diagnosed condition and thus provided. Participants were followed from baseline (or from the second survey in analyses of frailty changes) until the first occurrence of any of the following events: self-reported arthritis diagnosis, death, or the end of follow-up (censoring at the most recent available wave in each cohort: 2018 for CHARLS and MHAS, 2018–2019 for ELSA, and 2019–2020 for SHARE).
Statistical Analysis
Descriptive statistics were presented as mean (standard deviation, SD) or median (interquartile range, IQR) for continuous variables and as frequencies (percentages) for categorical variables. Cox proportional hazards regression models were employed to estimate hazard ratios (HRs) and 95% confidence intervals (CIs) for the association between frailty and incident arthritis. Robust participants served as the reference group in all models. Two models were fitted: a crude model (Model 1) and a multivariable-adjusted model (Model 2) that included all covariates.
Missing covariate data were handled using multiple imputations by chained equations, with the imputation model including the frailty index, incident arthritis outcome, and all covariates used in the main analyses. Complete case (CC) analyses were conducted as a sensitivity check.
To examine the impact of frailty transitions on incident arthritis, we defined mutually exclusive transition categories between baseline and the second survey wave (stable robust, robust to pre-frail/frail, stable pre-frail, pre-frail to robust, pre-frail to frail, stable frail, frail to robust/pre-frail). Given that these transitions are conditional on baseline status, stratified Cox models were fitted with each baseline frailty stratum (robust, pre-frail, frail) with the corresponding stable group in each stratum (stable robust, stable pre-frail, stable frail) serving as the reference category.
We further examined the association between changes in frailty status and incident arthritis. Both total FI and ΔFI were categorized into tertiles for analysis. In ΔFI analyses, baseline FI was additionally included as a covariate. Linear trends across tertiles were tested by treating the median value of each tertile as a continuous variable. The proportional hazards assumption was verified using Schoenfeld residuals. Several sensitivity analyses were conducted to assess the robustness of the findings. First, we applied two alternative FI cut-off schemes commonly used in previous studies: 1) frail ≥0.21, pre-frail 0.10–0.21, robust ≤0.10; and 2) frail ≥0.25, pre-frail 0.08–0.24, robust ≤0.08. Second, we repeated the primary analyses using complete-case data (excluding participants with missing covariates) and compared the results with those from the multiply imputed datasets. All analyses were conducted using R version 4.1.2 (R Foundation for Statistical Computing, Vienna, Austria). A two-sided p-value < 0.05 was considered statistically significant.
Results
Baseline Characteristics
Following the application of inclusion and exclusion criteria, 8390 participants from CHARLS (47.1% female; mean age 58.1 years), 6697 from ELSA (49.8% female; mean age 64.0 years), 26,195 from SHARE (52.6% female; mean age 63.7 years), and 7198 from MHAS (53.3% female; mean age 63.3 years) were included in the baseline frailty status analyses. Baseline characteristics of the included participants are presented in Table 1. Across all the cohorts, frail participants were generally older and less likely to be married or partnered compared to their robust Counterparts. The prevalence of frailty was higher among women in CHARLS, SHARE, and MHAS. In ELSA, however, the proportion of women was slightly lower in the frail group (46.5%) than in the robust group (49.5%). Educational disparities were evidently observed in CHARLS and SHARE, with frail participants being more concentrated in lower educational categories; a similar, though less pronounced, trend was also observed in ELSA. With respect to physical activity, frail participants in CHARLS, ELSA, and SHARE reported lower levels of vigorous activity and higher levels of light physical activity, reflecting a graded decline in physical engagement with worsening frailty.
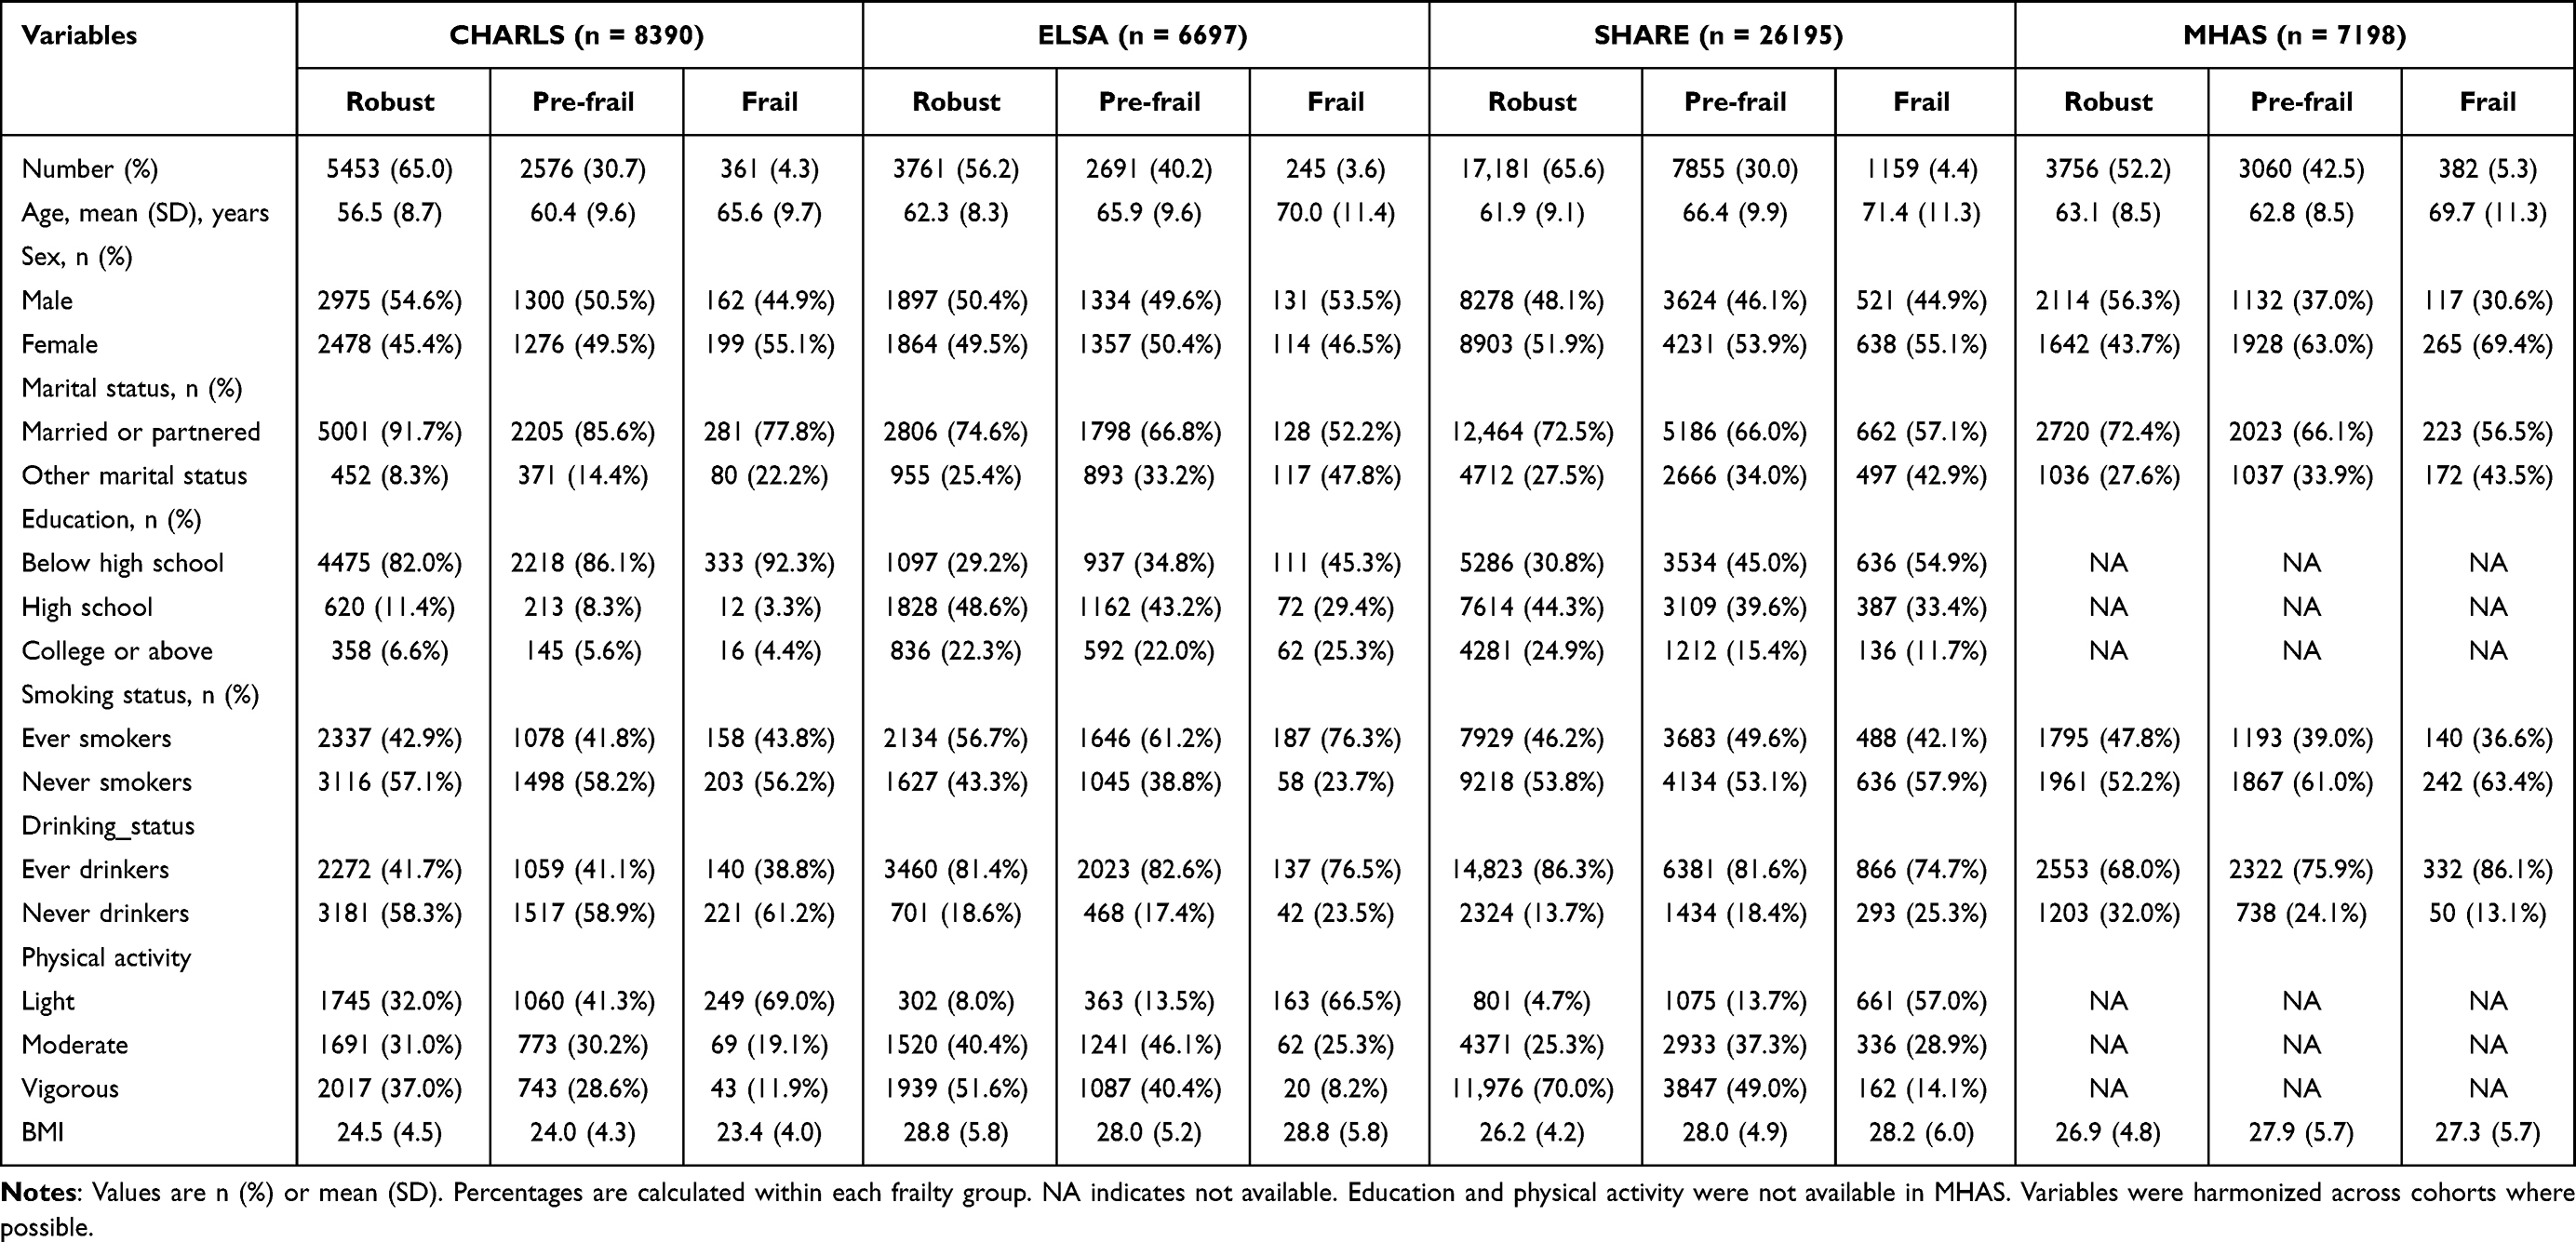 |
Table 1 Baseline Characteristics of Participants According to Frailty Status Across Four Cohorts (CHARLS, ELSA, SHARE, MHAS) |
The baseline characteristics of participants included in the two-wave analysis of frailty change were largely consistent with those observed in the full baseline sample. Frail participants were again older, more likely to be female, less frequently married or partnered, and less physically active than robust participants across all cohorts (Supplementary Table S1).
Frailty Transitions Between Baseline and Follow-Up
Table 2 summarizes the changes in frailty status between baseline and the second survey across the four cohorts. Frailty status was moderately dynamic over approximately two years of follow-up. Among participants who were robust at baseline, 18.0% in CHARLS, 20.1% in ELSA, 22.5% in SHARE, and 44.5% in MHAS progressed to pre-frail or frail states. In contrast, 59.8% of frail participants in CHARLS, 37.2% in ELSA, 46.1% in SHARE, and 41.1% in MHAS transitioned to pre-frail or robust states. Among those who were pre-frail at baseline, the proportion progressing to frailty ranged from 5.1% in ELSA to 14.4% in MHAS, while reversion to robust status ranged from 14.3% in SHARE to 33.1% in CHARLS, indicating substantial bidirectional transitions across all the cohorts during the follow-up period.
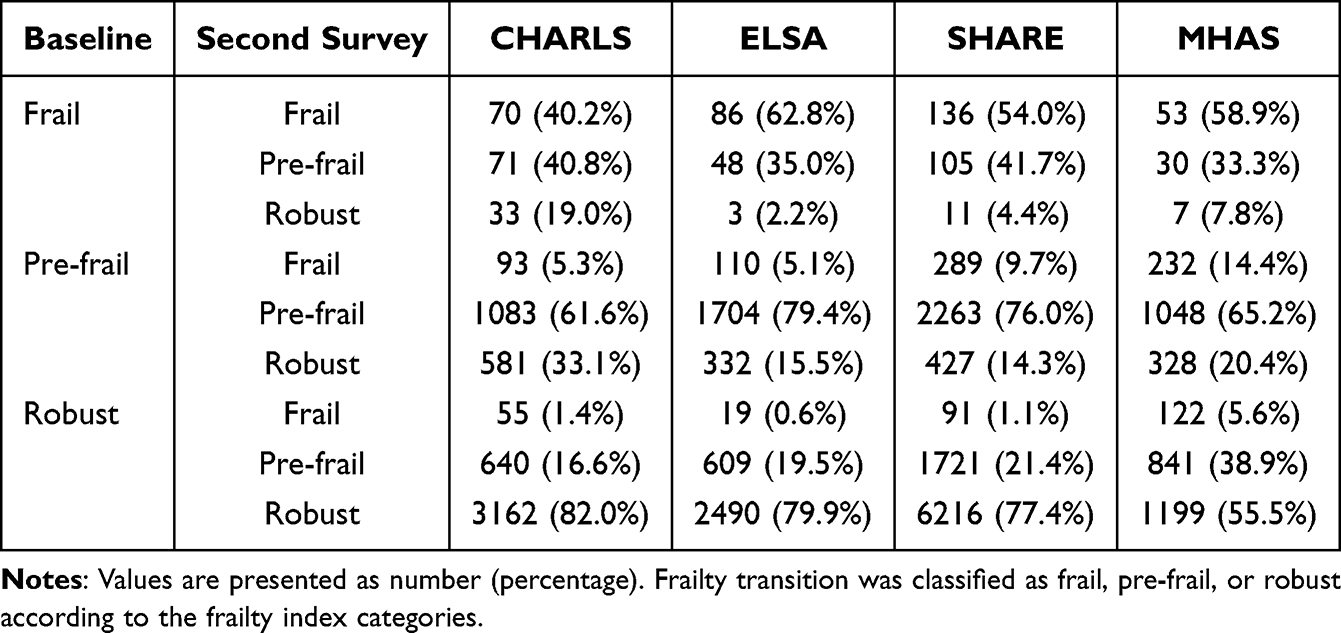 |
Table 2 Transitions in Frailty Status Between Baseline and the second Survey Across Four Cohorts (CHARLS, ELSA, SHARE, MHAS) |
Association Between Baseline Frailty Index Tertiles and Incident Arthritis
Table 3 presents the multivariable-adjusted associations between total FI tertiles and incident arthritis. Compared with participants in the lowest tertile, those in the highest tertile had significantly increased risks of developing arthritis in CHARLS (HR = 1.26, 95% CI 1.10–1.44; P < 0.001), SHARE (HR = 1.36, 95% CI 1.18–1.57; P < 0.001), and MHAS (HR = 1.71, 95% CI 1.31–2.23; P < 0.001), but not in ELSA (HR = 1.12, 95% CI 0.95–1.32; P = 0.178). Tests for linear trend across FI tertiles were significant in CHARLS, SHARE, and MHAS, but not in ELSA (P = 0.177). The direction of these associations was consistent in unadjusted analyses (Supplementary Table S2), although the associations were generally stronger and larger before covariate adjustment.
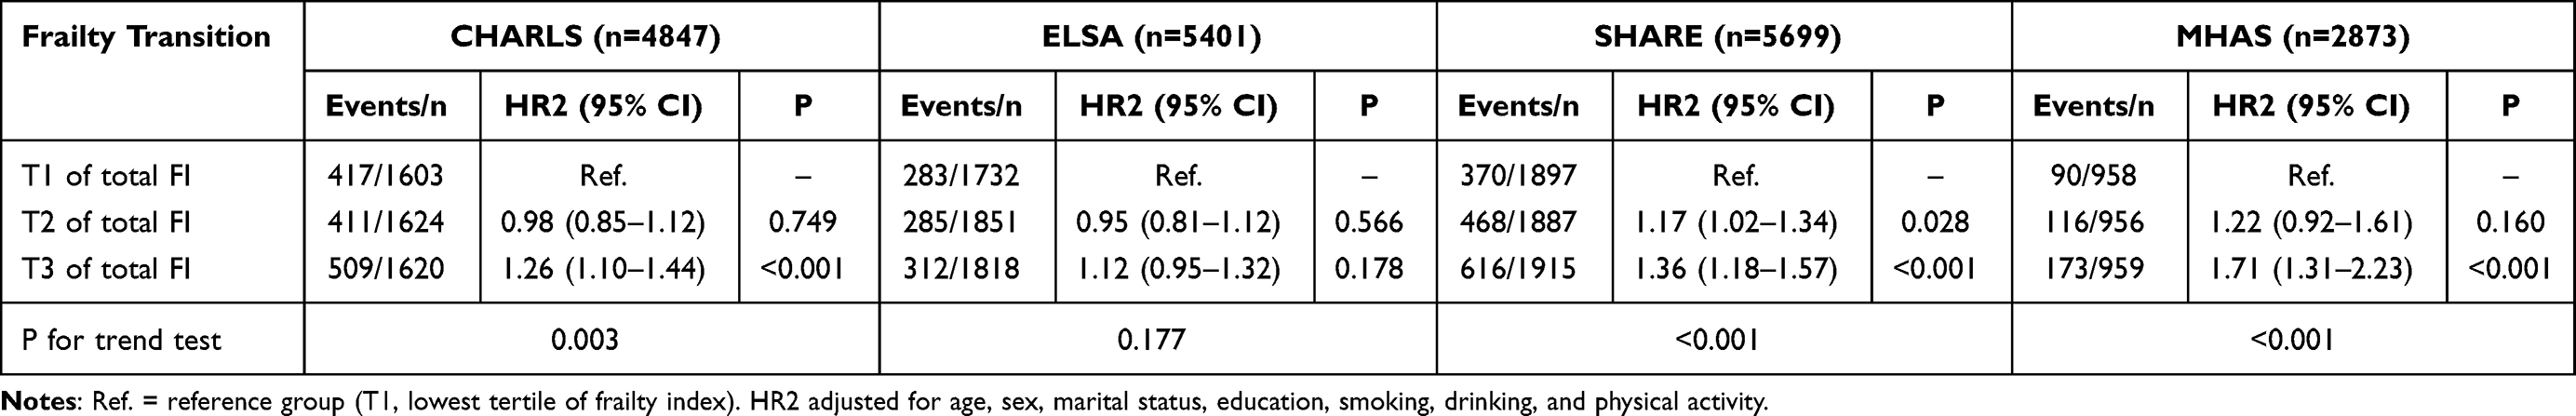 |
Table 3 Association Between Total Frailty Index Tertiles and Incident Arthritis Across Four Cohorts (CHARLS, ELSA, SHARE, MHAS) |
Association Between Changes in Frailty Status and Incident Arthritis
Table 4 presents the multivariable-adjusted associations between changes in frailty status and incident arthritis across the four cohorts. Among participants who were robust at baseline, progression to pre-frail or frail status was associated with a significantly increased risk of incident arthritis in CHARLS (HR = 1.23, 95% CI 1.03–1.46) and SHARE (HR = 1.26, 95% CI 1.09–1.46). For those who were pre-frail at baseline, transition to frailty was associated with increased arthritis risk in ELSA (HR = 1.73, 95% CI 1.07–2.81), SHARE (HR = 1.45, 95% CI 1.08–1.95), and MHAS (HR = 2.06, 95% CI 1.42–2.98). In contrast, improvements in frailty status, either from pre-frail to robust or from frail to pre-frail or robust, were not associated with a significant reduction in arthritis risk in any cohort. A similar pattern of associations was observed in the crude models (Supplementary Table S3).
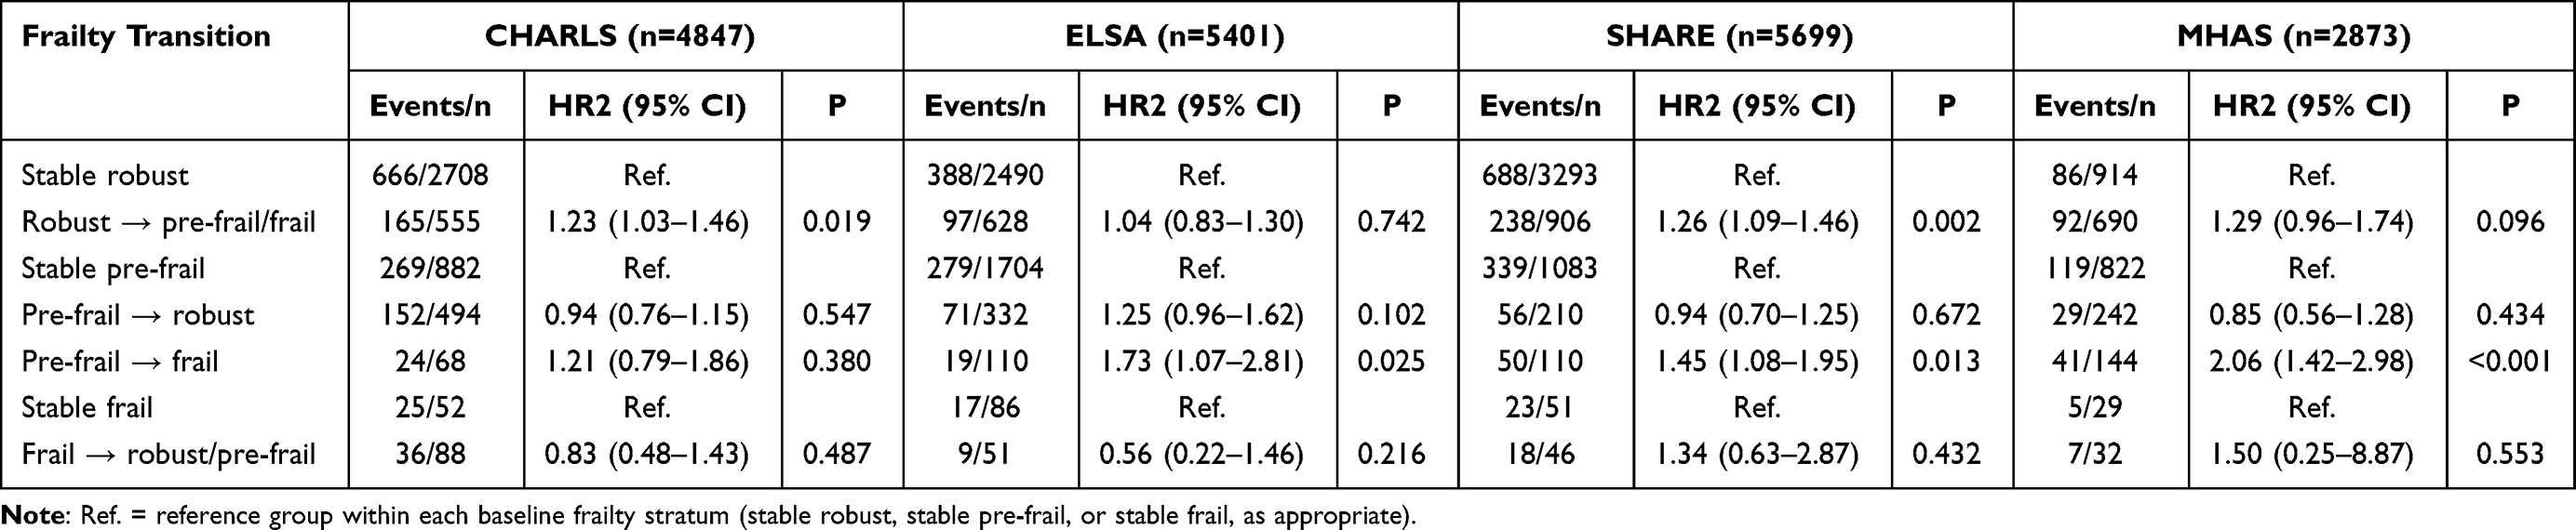 |
Table 4 Association Between Changes in Frailty Status and Incident Arthritis Across Four Cohorts (CHARLS, ELSA, SHARE, MHAS) |
Association Between ΔFI Tertiles and Incident Arthritis
Table 5 shows the multivariable-adjusted associations between cohort-specific tertiles of change in the frailty index (ΔFI) and incident arthritis. Within each cohort, ΔFI was divided into cohort-specific tertiles with the lowest tertile (T1) representing the most favorable trajectory (greatest improvement or least worsening) and serving as the reference group. The highest tertile (T3) represented the upper end of the distribution, comprising participants with the greatest increase in the frailty index (indicating the greatest worsening of frailty). Across most cohorts, compared to T1, larger increases in ΔFI were not significantly associated with higher arthritis risk in most cohorts. An exception was observed in the SHARE cohort, where T3 was marginally associated with increased risk (HR = 1.13, 95% CI 1.00–1.28; P = 0.058), with a significant linear trend across tertiles (P 0.045). Conversely, participants in the intermediate tertile (T2) of ΔFI showed a significantly reduced risk of arthritis in CHARLS (HR=0.83, 95% CI 0.73–0.95; P=0.008). The direction of these associations between ΔFI tertiles and incident arthritis was consistent with that in the unadjusted analyses (Supplementary Table S4), with generally stronger associations before covariate adjustment.
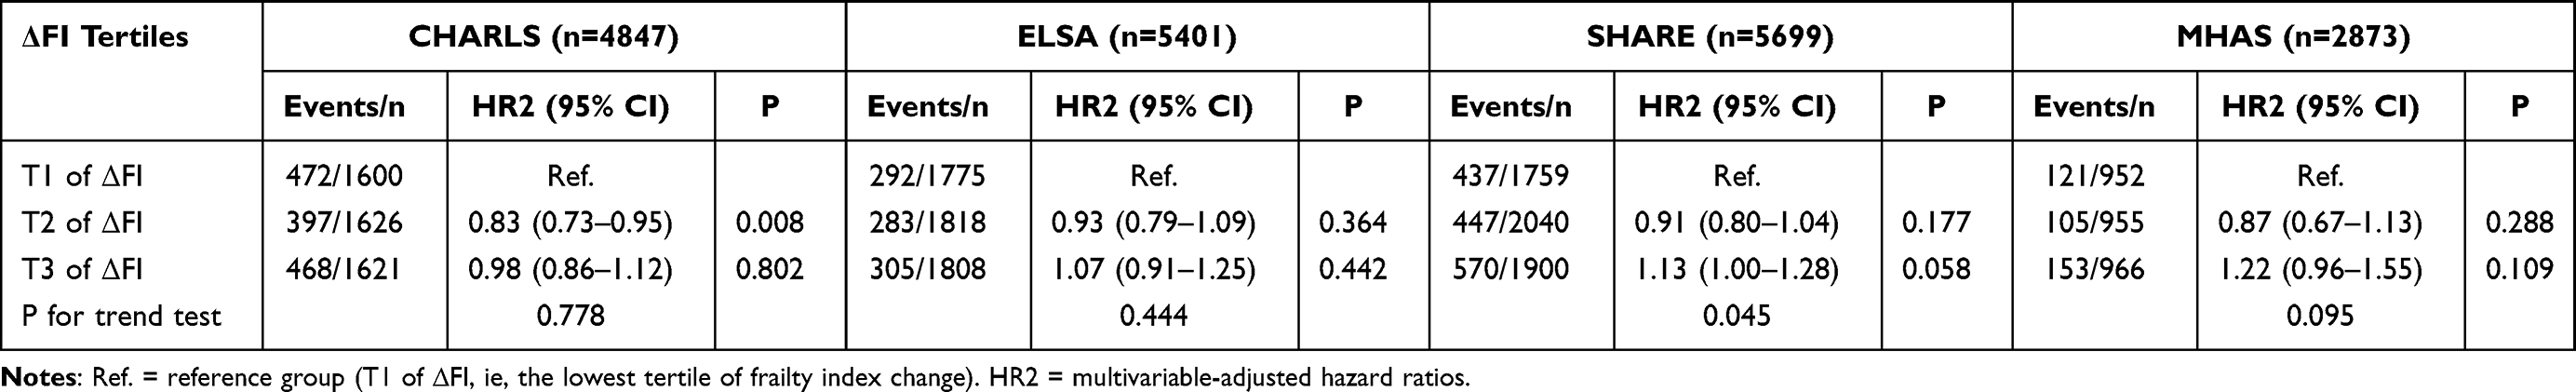 |
Table 5 Association Between Tertiles of Changes in Frailty Index (ΔFI) and Incident Arthritis Across Four Cohorts (CHARLS, ELSA, SHARE, MHAS) |
Sensitivity Analyses
Overall, the associations were robust across sensitivity analyses. Using two alternative FI cut-off schemes to define baseline frailty (cut-off 1: frail ≥ 0.21; cut-off 2: frail ≥ 0.25), we repeated the analyses of the associations between baseline frailty status and incident arthritis (Supplementary Table S5). The pattern of associations was broadly consistent with the main analysis based on FI tertiles (Table 3). Across all the cohorts, participants classified as frail exhibited consistently higher risks of incident arthritis than those classified as robust under both alternative definitions, although the magnitude of the hazard ratios and confidence intervals varied by cohort. Wider confidence intervals in SHARE and MHAS reflected smaller frail group sizes. Complete case (CC) analyses yielded estimates that were consistent in direction and similar in magnitude to those obtained from the multiply imputed datasets (Supplementary Table S6).
Discussion
In this large, multi-cohort study comprising more than 45,000 older adults from China, England, continental Europe, and Mexico, we demonstrated that both baseline frailty and subsequent progression in frailty status were prospectively associated with an increased risk of incident arthritis. Specifically, a higher frailty level at baseline predicted a greater risk of developing arthritis, and those whose frailty status worsened during follow-up faced the highest risk. In contrast, transitions indicating improvement in frailty status were not consistently associated with a reduced risk of arthritis. Overall, the direction of association was generally consistent across cohorts, although the magnitude of effects and statistical significance of the estimates varied in different population contexts.
Previous research has consistently reported an association between frailty and a higher prevalence of arthritis and other musculoskeletal disorders. However, the majority of this evidence stems from cross-sectional designs or is limited to single national cohorts.10,26 For instance, cross-sectional analyses from population-based studies in China and Europe have shown that both frailty and pre-frailty were significantly associated with osteoarthritis and joint pain burden, supporting the view that frailty may represent a state of systemic vulnerability to musculoskeletal decline.8,9 Our findings reinforce this evidence by showing that higher frailty levels at baseline were prospectively associated with a greater risk of developing arthritis.
A key contribution of this study lies in its longitudinal examination of frailty transitions across four internationally diverse ageing cohorts, advancing our understanding beyond static associations to a dynamic perspective on the relationship between frailty progression and arthritis development. Unlike previous cross-sectional studies and single-cohort longitudinal analyses, this design allows us to disentangle the differential effects of frailty worsening versus improvement on subsequent arthritis risk. Importantly, the multi-cohort framework enables assessment of whether these dynamic associations are consistent across populations with distinct healthcare systems and sociocultural contexts, thereby strengthening the generalizability of the findings. Consistent with this dynamic framework, our analyses revealed that participants whose frailty status worsened during follow-up, particularly those progressing from robust or pre-frail to frail, had the highest risk of developing arthritis, whereas recovery from frailty did not confer statistically significant protection within the observed follow-up period. This asymmetry suggests that frailty progression may exert faster or more sustained adverse effects on joint health than can be reversed by short-term improvement.
In addition to categorical frailty transitions, we examined tertiles of continuous change in the frailty index (ΔFI) to provide a complementary perspective. The non-linear associations observed in some ΔFI tertile analyses, exemplified by the intermediate tertile (T2) in CHARLS, likely represent a stability benefit among individuals who avoided rapid progression, rather than a protective effect of active frailty reversal. Unlike frailty transition analyses, which are explicitly conditioned on baseline frailty status and capture clinically meaningful threshold crossings, ΔFI tertiles aggregate heterogeneous patterns of change and do not account for initial frailty level. Consequently, associations across ΔFI tertiles may appear attenuated or non-monotonic and should be interpreted as descriptive and supportive rather than as primary estimates of risk.
Although the overall direction of associations between frailty and incident arthritis was broadly consistent across cohorts, the magnitude and statistical significance of the effect varied by population. Such cross-cohort heterogeneity is not unexpected given differences in cohort composition, disease detection practices, and measurement characteristics across studies. Importantly, however, the observed heterogeneity was largely quantitative rather than qualitative: higher baseline frailty and frailty worsening were consistently associated with increased arthritis risk across cohorts, even when effect sizes differed.
One potential source of heterogeneity relates to differences in the underlying composition of arthritis captured by self-reported physician diagnosis across countries. Although the available data did not permit differentiation between osteoarthritis and inflammatory arthritis, variation in the relative prevalence of these conditions across populations may partly contribute to cross-cohort differences in effect magnitude. Nevertheless, frailty represents a global vulnerability state characterized by reduced physiological reserve, systemic inflammation, and musculoskeletal decline, which is biologically relevant to both degenerative and inflammatory joint diseases.27–30 Therefore, such variation is unlikely to alter the direction of the observed associations.
Notably, a higher proportion of participants classified as frail at baseline in the MHAS cohort transitioned to pre-frail or robust states compared with other cohorts. This pattern may reflect methodological and cohort-specific factors rather than a true biological difference in frailty reversibility. Possible explanations include selective attrition of the most severely frail individuals between waves, cultural differences in self-reported health deficits, and the use of a frailty index constructed from fewer items, which may increase the likelihood of category transitions near threshold values. Despite these differences, the association between frailty progression and increased arthritis risk in MHAS was directionally consistent with that observed in other cohorts, supporting the robustness of the main findings.
Beyond biological mechanisms, behavioral and functional pathways may further reinforce the frailty–arthritis association. Frailty is closely associated with sarcopenia, reduced muscle strength, and metabolic dysregulation.31–36 In turn, frailty is linked to physical inactivity, fatigue, balance impairment, and an increased risk of falls, all of which may contribute to altered joint loading, cumulative microtrauma, and accelerated musculoskeletal decline.37–40 In addition, individuals with frailty are more likely to experience multimorbidity and socioeconomic disadvantage, which may limit access to timely diagnosis and optimal management of joint conditions, thereby amplifying observed associations across populations.41,42
The Asymmetry of Risk and the Legacy Effect
Our most novel finding is that arthritis risk increased with worsening frailty but did not decline following short-term improvement in frailty status. This asymmetric pattern may in part reflect a legacy effect of accumulated physiological vulnerability, although alternative and complementary explanations should also be considered. First, the transition into a frail state marks a period of sustained systemic inflammation, sarcopenia, and metabolic dysregulation that produces cumulative damage to cartilage and periarticular tissues. Once such changes have occurred, modest short-term improvements in the frailty status observed over the relatively brief follow-up period may not be sufficient to alter the subsequent trajectory toward clinical arthritis.5,12,43 In this context, the absence of a protective association for frailty improvement may reflect a latency or induction period rather than irreversible damage. Second, measured improvement in the frailty status may not coincide with full recovery of the specific components of musculoskeletal reserve and behavior that protect joints. Individuals whose frailty improves may experience better symptom control or fewer deficits without regaining muscle strength, neuromuscular control, or habitual physical activity to levels that meaningfully reduce joint loading. Third, early pain and mobility limitation can trigger a rapid downward spiral of inactivity, muscle loss, and further frailty. Conversely, short-term improvements in frailty scores may not be sufficient on their own to drive the sustained engagement in exercise and rehabilitation required to protect joints.44–46
Our most novel finding is that arthritis risk increased with worsening frailty but did not decline with short-term frailty improvement. This asymmetric pattern may reflect a legacy effect of accumulated physiological vulnerability, but alternative explanations should also be considered.
Strengths and Limitations
This study has several strengths. First, our analyses draw on large, well-characterized samples from four internationally established ageing cohorts across China, England, continental Europe, and Mexico, representing diverse socioeconomic and healthcare contexts and enabling an assessment of the consistency of associations across different populations. Second, frailty was operationalized using a harmonized frailty index based on a comprehensive set of age-related health deficits that excluded arthritis-related items, thereby minimizing diagnostic circularity between the exposure and outcome and allowing a clearer assessment of the prospective association. Third, by incorporating both baseline frailty status and subsequent frailty transitions, our analyses provide a dynamic perspective on the frailty arthritis relationship, distinguishing the effects of initial vulnerability from those of subsequent deterioration. Finally, multiple sensitivity analyses, including alternative frailty index cut-off schemes and complete-case analyses, yielded results that were largely consistent with the primary findings, supporting the robustness of the observed associations.
Several limitations should be considered when interpreting these results. First, incident arthritis was based on self-reported physician diagnosis in follow-up surveys, without validation against clinical records or imaging data, and without detailed information on arthritis subtype, such as osteoarthritis vs inflammatory arthritis, joint site, disease severity, or treatments, which limits mechanistic insight. In addition, differences in healthcare access, health-seeking behavior, and diagnostic practices across countries may have led to differential ascertainment of arthritis. Second, the frailty index in MHAS was constructed from 17 items rather than the 20 used in other cohorts. While this difference may affect frailty classification near threshold values, prior methodological work and recent reviews suggest that frailty indices constructed using a moderate number of items (≥15), provided that they span multiple physiological systems, retain comparable validity.22,25 Nevertheless, these factors may have introduced outcome misclassification or measurement heterogeneity, potentially influencing effect estimates and contributing to observed cross-cohort variation. Third, although we adjusted for a range of demographic and behavioral covariates, residual confounding remains possible due to the lack of detailed data on specific dimensions of physical activity, occupational joint loading, dietary patterns, and use of analgesic or anti-inflammatory medications. Fourth, although the overall sample size was large, the subgroup of participants demonstrating frailty improvement was relatively small after stratification by cohort and baseline frailty category. Finally, the observational design precludes firm causal inference. Future studies with larger intervention cohorts, more frequent frailty assessments, and complementary study designs are needed to determine whether sustained reversal of frailty can reduce the risk of incident arthritis.
Implications and Future Directions
The present findings have several implications for clinical practice and public health.
First, our findings support the incorporation of frailty assessment into routine primary care, geriatric evaluation, and rheumatology practice to identify older adults at increased risk for developing arthritis. Both baseline frailty status and its changes over time appear prognostically informative, suggesting that serial assessments could help clinicians identify patients whose worsening frailty signals heightened vulnerability to subsequent joint disease.
Second, interventions aimed at preventing or slowing deterioration in frailty may help reduce vulnerability to arthritis in older adults. Multicomponent strategies that combine resistance and balance training, weight management, optimization of comorbidities, and support for regular physical activity may help preserve musculoskeletal reserve and reduce joint loading in older adults. Taken together, these findings highlight the importance of early and sustained efforts to prevent frailty progression.
Finally, future research should employ randomized or quasi-experimental designs to examine whether targeted frailty interventions can effectively reduce the incidence of arthritis or delay its onset. Studies with more frequent frailty measurements, extended follow-up periods, and detailed characterization of joint outcomes, including imaging and biomarkers, are needed to clarify temporal relationships and potential causal pathways. Additional work should also explore how sex, obesity, multimorbidity, socioeconomic disadvantage, and healthcare utilization patterns modify the frailty-arthritis association and identify which components of frailty are most amenable to intervention for preserving joint health.
Conclusion
In this large, multi-cohort study of more than 45,000 older adults from China, England, continental Europe, and Mexico, we found that frailty was prospectively associated with an increased risk of incident arthritis across diverse ageing populations. Higher baseline frailty levels predicted a greater subsequent risk of incident arthritis, while individuals whose frailty worsened over time had the highest risk, indicating that frailty progression is a particularly salient marker of vulnerability. In contrast, improvement in frailty status was not clearly associated with a lower risk of developing arthritis within the observed follow-up period. Taken together, these findings suggest that serial monitoring of frailty, with attention to both initial status and subsequent deterioration, helps to identify older adults at elevated risk of arthritis. They further highlight the importance of preventing or slowing frailty progression as an integral component of strategies to preserve joint health in later life.
Funding
This work was supported by the Research Project “Research on the Unified Provincial Medical Consumables Medical Insurance Payment Catalog“ (Grant No. SDGPPS37000000042000120240014).
Disclosure
The authors report no conflicts of interest in this work.
References
1. Global Burden of Disease Study 2021 Collaborators. Global, regional, and national burden of osteoarthritis, 1990–2020 and projections to 2050. Lancet Rheumatol. 2023;5(9):e497–15. doi:10.1016/S2665-9913(23)00163-7
2. Safiri S, Kolahi AA, Smith E, et al. Global, regional, and national burden of osteoarthritis 1990–2017: results from the Global Burden of Disease Study 2017. Ann Rheum Dis. 2020;79(6):819–828. doi:10.1136/annrheumdis-2019-216515
3. Kim DH, Rockwood K, Hardin CC. Frailty in older adults. N Engl J Med. 2024;391(6):538–548. doi:10.1056/NEJMra2301292
4. Dent E, Martin FC, Bergman H, et al. Management of frailty: opportunities, challenges, and future directions. Lancet. 2019;394(10206):1376–1386. doi:10.1016/S0140-6736(19)31785-4
5. Ferrucci L, Fabbri E. Inflammageing: chronic inflammation in ageing, cardiovascular disease, and frailty. Nat Rev Cardiol. 2018;15(9):505–522. doi:10.1038/s41569-018-0064-2
6. Chu W, Chang SF, Ho HY. Adverse health effects of frailty: systematic review and meta-analysis of middle-aged and older adults with implications for evidence-based practice. Worldviews Evid Based Nurs. 2021;18(4):282–289. doi:10.1111/wvn.12508
7. Hoogendijk EO, Afilalo J, Ensrud KE, et al. Frailty: implications for clinical practice and public health. Lancet. 2019;394(10206):1365–1375. doi:10.1016/S0140-6736(19)31786-6
8. Gao RC, Wu ZG, Wu ZZ, et al. Frailty in rheumatoid arthritis: a systematic review and meta-analysis. Joint Bone Spine. 2022;89(4):105343. doi:10.1016/j.jbspin.2022.105343
9. Germonpré S, Mulier S, Falzon L, et al. Prevalence of frailty and pre-frailty in patients with rheumatoid arthritis: a systematic literature review and meta-analysis. Clin Exp Rheumatol. 2023;41(7):1443–1450. doi:10.55563/clinexprheumatol/1kr7bs
10. Castell MV, van der Pas S, Otero A, et al. Osteoarthritis and frailty in elderly individuals across six European countries: results from the European Project on OSteoArthritis (EPOSA). BMC Musculoskelet Disord. 2015;16(1):359. doi:10.1186/s12891-015-0807-8
11. Waghorn J, Maxwell SP, Rayner SE, et al. Association of frailty with risk of osteoarthritis development, progression and worse clinical outcomes in older adults. J Rheumatol. 2025:
12. Motta F, Barone E, Sica A, et al. Inflammaging and osteoarthritis. Clin Rev Allergy Immunol. 2023;64(2):222–238. doi:10.1007/s12016-022-08941-1
13. Huang L, Qiu S, Liu Z, et al. Proximity hybridization induced DNA assembly for label-free surface-enhanced Raman spectroscopic detection of carcinoembryonic antigen. Anal Chim Acta. 2022;1191:339314. doi:10.1016/j.aca.2021.339314
14. Ang YS, Yung LYL. Label-free electrochemical homogeneous detection of the inflammatory biomarker using a novel probe. Int J Biol Macromol. 2021;183:2305–2313. doi:10.1016/j.ijbiomac.2021.06.027
15. Travers J, Romero-Ortuno R, Bailey J, et al. Delaying and reversing frailty: a systematic review of primary care interventions. Br J Gen Pract. 2019;69(678):e61–e69. doi:10.3399/bjgp18X700241
16. Oliveira JS, Pinheiro MB, Fairhall N, et al. Evidence on physical activity and the prevention of frailty and sarcopenia among older people: a systematic review to inform the World Health Organization physical activity guidelines. J Phys Act Health. 2020;17(12):1247–1258. doi:10.1123/jpah.2020-0323
17. Racey M, Ali MU, Sherifali D, et al. Effectiveness of physical activity interventions in older adults with frailty or prefrailty: a systematic review and meta-analysis. CMAJ Open. 2021;9(3):E728–E743. doi:10.9778/cmajo.20200222
18. Zhao Y, Hu Y, Smith JP, et al. Cohort profile: the China Health and Retirement Longitudinal Study (CHARLS). Int J Epidemiol. 2014;43(1):61–68. doi:10.1093/ije/dys203
19. Steptoe A, Breeze E, Banks J, et al. Cohort profile: the English longitudinal study of ageing. Int J Epidemiol. 2013;42:1640–1648. doi:10.1093/ije/dys168
20. Börsch-Supan A, Brandt M, Hunkler C, et al. Data resource profile: the Survey of Health, Ageing and Retirement in Europe (SHARE). Int J Epidemiol. 2013;42(4):992–1001. doi:10.1093/ije/dyt088
21. Wong R, Michaels-Obregon A, Palloni A. Cohort profile: the Mexican Health and Aging Study (MHAS). Int J Epidemiol. 2017;46(2):e2. doi:10.1093/ije/dyu263
22. Searle SD, Mitnitski A, Gahbauer EA, et al. A standard procedure for creating a frailty index. BMC Geriatr. 2008;8(1):24. doi:10.1186/1471-2318-8-24
23. He D, Wang Z, Li J, et al. Changes in frailty and incident cardiovascular disease in three prospective cohorts. Eur Heart J. 2024;45(12):1058–1068. doi:10.1093/eurheartj/ehad885
24. Dent E, Hanlon P, Kowal P, et al. Frailty measurement in research and clinical practice: an updated review. Eur J Intern Med. 2026;144:106595. doi:10.1016/j.ejim.2025.106595
25. Germain CM, Vasquez E, Batsis JA. Physical activity, central adiposity, and functional limitations in community-dwelling older adults. J Geriatr Phys Ther. 2016;39(2):71–76. doi:10.1519/JPT.0000000000000051
26. Huang G, Qian D, Liu Y, et al. The association between frailty and osteoarthritis based on the NHANES and Mendelian randomization study. Arch Med Sci. 2023;19(5):1545–1550. doi:10.5114/aoms/171270
27. Soysal P, Stubbs B, Lucato P, et al. Inflammation and frailty in the elderly: a systematic review and meta-analysis. Ageing Res Rev. 2016;31:1–8. doi:10.1016/j.arr.2016.08.006
28. Walston J, McBurnie MA, Newman A, et al. Frailty and activation of the inflammation and coagulation systems with and without clinical comorbidities: results from the cardiovascular health study. Arch Intern Med. 2002;162(20):2333–2341. doi:10.1001/archinte.162.20.2333
29. Knights AJ, Redding SJ, Maerz T. Inflammation in osteoarthritis: the latest progress and ongoing challenges. Curr Opin Rheumatol. 2023;35(2):128–134. doi:10.1097/BOR.0000000000000923
30. van Sleen Y, Shetty SA, van der Heiden M, et al. Frailty is related to serum inflammageing markers: results from the VITAL study. Immun Ageing. 2023;20(1):68. doi:10.1186/s12979-023-00391-3
31. Gao J, Yesihati M, Cheng H, et al. Association of sarcopenia and its prognostic value in symptomatic knee osteoarthritis among older people in China: the first longitudinal evidence from CHARLS. BMC Geriatr. 2024;24(1):977. doi:10.1186/s12877-024-05556-3
32. Jin Z, Wang R, Jin L, et al. Causal relationship between sarcopenia with osteoarthritis and the mediating role of obesity: a univariate, multivariate, two-step Mendelian randomization study. BMC Geriatr. 2024;24(1):469. doi:10.1186/s12877-024-05098-8
33. Peng P, Wu J, Fang W, et al. Association between sarcopenia and osteoarthritis among the US adults: a cross-sectional study. Sci Rep. 2024;14(1):296. doi:10.1038/s41598-023-50528-z
34. Veronese N, Stefanac S, Koyanagi A, et al. Lower limb muscle strength and muscle mass are associated with incident symptomatic knee osteoarthritis: a longitudinal cohort study. Front Endocrinol. 2021;12:804560. doi:10.3389/fendo.2021.804560
35. Collins KH, Herzog W, MacDonald GZ, et al. Obesity, metabolic syndrome, and musculoskeletal disease: common inflammatory pathways suggest a central role for loss of muscle integrity. Front Physiol. 2018;9:112. doi:10.3389/fphys.2018.00112
36. Dao HHH, Burns MJ, Kha R, et al. The relationship between metabolic syndrome and frailty in older people: a systematic review and meta-analysis. Geriatrics. 2022;7(4):76. doi:10.3390/geriatrics7040076
37. Nicklen B, Delbaere K, Ellmers TJ. Is frailty associated with increased concerns about falling and activity restriction in community-dwelling older adults? A systematic review. J Frailty Aging. 2025;14(1):100002. doi:10.1016/j.tjfa.2024.100002
38. Hämäläinen O, Tirkkonen A, Savikangas T, et al. Low physical activity is a risk factor for sarcopenia: a cross-sectional analysis of two exercise trials on community-dwelling older adults. BMC Geriatr. 2024;24(1):212. doi:10.1186/s12877-024-04764-1
39. Yang ZC, Lin H, Jiang GH, et al. Frailty is a risk factor for falls in the older adults: a systematic review and meta-analysis. J Nutr Health Aging. 2023;27(6):487–595. doi:10.1007/s12603-023-1935-8
40. He Y, Zhang H, Song M, et al. Association between fatigue and falls risk among the elderly aged over 75 years in China: the chain mediating role of falls efficacy and lower limb function. Front Public Health. 2022;10:850533. doi:10.3389/fpubh.2022.850533
41. Mangin D, Lawson J, Risdon C, et al. Association between frailty, chronic conditions and socioeconomic status in community-dwelling older adults attending primary care: a cross-sectional study using practice-based research network data. BMJ Open. 2023;13(2):e066269. doi:10.1136/bmjopen-2022-066269
42. Palladino R, Tayu Lee J, Ashworth M, et al. Associations between multimorbidity, healthcare utilisation and health status: evidence from 16 European countries. Age Ageing. 2016;45(3):431–435. doi:10.1093/ageing/afw044
43. Bleve A, Motta F, Durante B, et al. Immunosenescence, inflammaging, and frailty: role of myeloid cells in age-related diseases. Clin Rev Allergy Immunol. 2023;64(2):123–144. doi:10.1007/s12016-021-08909-7
44. Fried LP, Tangen CM, Walston J, et al. Frailty in older adults: evidence for a phenotype. J Gerontol a Biol Sci Med Sci. 2001;56(3):M146–M156. doi:10.1093/gerona/56.3.m146
45. Vincent HK, Raiser SN, Vincent KR. The aging musculoskeletal system and obesity-related considerations with exercise. Ageing Res Rev. 2012;11(3):361–373. doi:10.1016/j.arr.2012.03.002
46. Lyw H, Cheung DSK, Kwan RYC, et al. Factors associated with frailty transition at different follow-up intervals: a scoping review. Geriatr Nurs. 2021;42(2):555–565. doi:10.1016/j.gerinurse.2020.10.005
 © 2026 The Author(s). This work is published and licensed by Dove Medical Press Limited. The
full terms of this license are available at https://www.dovepress.com/terms
and incorporate the Creative Commons Attribution
- Non Commercial (unported, 4.0) License.
By accessing the work you hereby accept the Terms. Non-commercial uses of the work are permitted
without any further permission from Dove Medical Press Limited, provided the work is properly
attributed. For permission for commercial use of this work, please see paragraphs 4.2 and 5 of our Terms.
© 2026 The Author(s). This work is published and licensed by Dove Medical Press Limited. The
full terms of this license are available at https://www.dovepress.com/terms
and incorporate the Creative Commons Attribution
- Non Commercial (unported, 4.0) License.
By accessing the work you hereby accept the Terms. Non-commercial uses of the work are permitted
without any further permission from Dove Medical Press Limited, provided the work is properly
attributed. For permission for commercial use of this work, please see paragraphs 4.2 and 5 of our Terms.
Recommended articles
Risk Factors of Readmission Within 90 Days for Chronic Obstructive Pulmonary Disease Patients with Frailty and Construction of an Early Warning Model
Li J, Ma X, Zeng X, Zhou C, Zhu T
International Journal of Chronic Obstructive Pulmonary Disease 2023, 18:975-984
Published Date: 23 May 2023
Effect of Frailty on the Long-Term Prognosis of Elderly Patients with Acute Myocardial Infarction
Zong M, Guan X, Huang W, Chang J, Zhang J
Clinical Interventions in Aging 2023, 18:2021-2029
Published Date: 1 December 2023
Comprehensive Geriatric Assessment in the Emergency Department: A Prospective Cohort Study of Process, Clinical, and Patient-Reported Outcomes
O'Shaughnessy Í, Robinson K, Whiston A, Barry L, Corey G, Devlin C, Hartigan D, Synnott A, McCarthy A, Moriarty E, Jones B, Carroll I, Shchetkovsky D, O'Connor M, Steed F, Carey L, Conneely M, Leahy A, Quinn C, Shanahan E, Ryan D, Galvin R
Clinical Interventions in Aging 2024, 19:189-201
Published Date: 7 February 2024
Assessment of the Risk of Malnutrition or Frailty Among Patients Undergoing Liver Transplantation: A Hospital-Based Prospective Study
Liu G, Yi Y, Wang Y, Feng Y, Lin M, Yan X, Wang J, Ning X, Ma N
International Journal of General Medicine 2024, 17:2347-2354
Published Date: 22 May 2024
A Preliminary Screening Tool for High-Risk Frailty in Older Adults Patients with Pulmonary Tuberculosis
Li HJ, Zhou YY, Yu HH, Jiang J, Cai YW
Clinical Interventions in Aging 2025, 20:57-68
Published Date: 22 January 2025