Back to Journals » Journal of Inflammation Research » Volume 16
Associations Between Inflammatory Mediators and Bone Outcomes in Postmenopausal Women: A Cross-Sectional Analysis of Baseline Data from the Prune Study
Authors Damani JJ ![]() , De Souza MJ, Strock NCA, Koltun KJ, Williams NI, Weaver C, Rogers CJ
, De Souza MJ, Strock NCA, Koltun KJ, Williams NI, Weaver C, Rogers CJ ![]()
Received 16 November 2022
Accepted for publication 27 January 2023
Published 15 February 2023 Volume 2023:16 Pages 639—663
DOI https://doi.org/10.2147/JIR.S397837
Checked for plagiarism Yes
Review by Single anonymous peer review
Peer reviewer comments 2
Editor who approved publication: Professor Ning Quan
Janhavi J Damani,1 Mary Jane De Souza,2 Nicole CA Strock,2 Kristen J Koltun,2,3 Nancy I Williams,2 Connie Weaver,4 Connie J Rogers5– 7
1The Intercollege Graduate Degree Program in Integrative and Biomedical Physiology, Huck Institutes of the Life Sciences, The Pennsylvania State University, University Park, PA, USA; 2Department of Kinesiology, The Pennsylvania State University, University Park, PA, USA; 3Department of Sports Medicine and Nutrition, University of Pittsburgh, Pittsburgh, PA, USA; 4Department of Exercise and Nutritional Sciences, San Diego State University, San Diego, CA, USA; 5Department of Nutritional Sciences, The Pennsylvania State University, University Park, PA, USA; 6Center for Molecular Immunology and Infectious Disease, The Pennsylvania State University, University Park, PA, USA; 7Department of Nutritional Sciences, University of Georgia, Athens, GA, USA
Correspondence: Connie J Rogers, 280 Dawson Hall, University of Georgia, Athens, GA, 30602, USA, Tel +1 706-542-4869, Email [email protected]
Purpose: Hypoestrogenism triggers increased production of inflammatory mediators, which contribute to bone loss during postmenopausal osteoporosis. This study aimed to investigate the association between circulating inflammatory markers and bone outcomes in postmenopausal women.
Materials and methods: We conducted a cross-sectional, secondary analysis of baseline data from participants who completed a 12-month randomized controlled trial, The Prune Study (NCT02822378), which included healthy postmenopausal women (n=183, 55– 75 years old) with bone mineral density (BMD) T-score between 0.0 and – 3.0 at any site. BMD was measured using dual-energy X-ray absorptiometry, and bone geometry and strength were measured using peripheral quantitative computed tomography. Blood was collected at baseline to measure (1) serum biomarkers of bone turnover, including procollagen type 1 N-terminal propeptide (P1NP) and C-terminal telopeptide and (2) inflammatory markers, including serum high-sensitivity C-reactive protein (hs-CRP) and plasma pro-inflammatory cytokines, tumor necrosis factor (TNF)-α, interleukin (IL)-1β, IL-6, IL-8, and monocyte chemoattractant protein (MCP)-1, using enzyme-linked immunosorbent assay. The associations between bone and inflammatory outcomes at baseline were analyzed using correlation and regression analyses.
Results: Serum hs-CRP negatively correlated with P1NP (r=– 0.197, p=0.042). Plasma IL-1β, IL-6, IL-8, and TNF-α negatively correlated with trabecular bone score at the lumbar spine (all p< 0.05). In normal-weight women, plasma IL-1β, IL-6, and IL-8 negatively correlated (p< 0.05) with trabecular and cortical bone area, content, and density at various sites in the tibia and radius. Serum hs-CRP positively predicted lumbar spine BMD (β=0.078, p=0.028). Plasma IL-6 negatively predicted BMD at the total body (β=– 0.131, p=0.027) and lumbar spine (β=– 0.151, p=0.036), whereas plasma TNF-α negatively predicted total hip BMD (β=– 0.114, p=0.028).
Conclusion: At baseline, inflammatory markers were inversely associated with various estimates of bone density, geometry, and strength in postmenopausal women. These findings suggest that inflammatory markers may be an important mediator for postmenopausal bone loss.
Keywords: inflammation, pro-inflammatory cytokines, immunity, osteoporosis, menopause
A Letter to the Editor has been published for this article.
Introduction
Osteoporosis is a progressive, silent disease of the bone characterized by significant reduction in bone mineral density (BMD),1 deterioration of bone microarchitecture, and increased risk of fractures.2–4 According to the World Health Organization (WHO) classification,5 the global prevalence of osteoporosis and osteopenia are 19.7% and 40.4%, respectively.6 In the United States, among adults aged over 50 years, osteoporosis was almost four times higher in women (19.6%) than in men (4.4%)7 and is projected to affect 13.6 million postmenopausal women by 2030.8,9 Between 2000 and 2011, in American women aged 55 years and older, osteoporotic fractures accounted for more hospitalizations (>40%) than breast cancer, stroke, and myocardial infarction combined.10 Hip fractures had the highest incidence for hospitalization [602.3 per 100,000 person-years; 95% confidence interval (CI), 600.9 to 603.7]10 and were responsible for increased risk for mortality within the first year post fracture in older men and women.11–14 The high prevalence rate, mortality, and economic burden8 underscore osteoporosis as a significant public health burden and the need to find preventative treatment strategies.15
During the menopausal transition, the rate of bone resorption exceeds that of bone formation, resulting in an accelerated transient phase of bone loss, followed by continuous gradual bone loss.16,17 Thus, postmenopausal women are at a greater risk for developing osteoporosis, mainly due to decline in the production of estrogen, which is an important regulator of bone metabolism.18 Chronic inflammation is an additional contributing factor in the etiology of postmenopausal osteoporosis.19–23 Estrogen inhibits the production of pro-inflammatory cytokines, including tumor necrosis factor (TNF)-α, interleukin (IL)-1β, IL-6, IL-8, and IL-17, by immune cells.21 Advancing age and hypoestrogenism after menopause trigger an upregulation of pro-inflammatory cytokines IL-1β, IL-6, and TNF-α and promote the formation and activation of osteoclasts,22,24,25 resulting in postmenopausal bone loss. Additionally, obesity is associated with an elevation of inflammatory mediators,26 which may secondarily impact bone resorption.27
Several studies have sought to determine whether inflammatory markers are associated with low BMD across the menopause transition. In premenopausal women from the Framingham Offspring Study, serum IL-6 and CRP were inversely associated with trochanter BMD,28 while a cross-sectional analysis of data from the Study of Women’s Health Across the Nation29 demonstrated no association between CRP and BMD in premenopausal women. However, in a recent longitudinal analysis of 1431 middle-aged women (aged 42–52 years at study outset) across various stages of the menopausal transition,30 increased hs-CRP levels were associated with an increased BMD loss at the femoral neck in premenopausal and early perimenopausal women; and in postmenopausal women, increased hs-CRP levels predicted BMD loss at both the lumbar spine and femoral neck. Collectively, these epidemiological findings suggest that inflammatory mediators are negatively associated with BMD and may be important risk factors for osteoporotic fractures in postmenopausal women.
Most observational studies investigating the relationship between inflammation and bone in postmenopausal women focus on clinical diagnostic criteria such as fractures and its surrogate marker, areal BMD measured by dual-energy X-ray absorptiometry (DXA). However, BMD is a partial measure of bone strength as it only provides two-dimensional imaging of bone.31–33 Peripheral quantitative computed tomography (pQCT) and hip structural analysis (HSA) from DXA allow for the measurement of bone strength and geometry at various sites within the appendicular skeleton,32–35 including the radius, tibia, and femur, which are common sites of osteoporotic fractures.36 In observational studies, there is limited data on the relationship between inflammatory markers and measures of bone geometry and strength in trabecular and cortical bones in postmenopausal women, warranting further investigation to discern the strength of the relationship between these bone outcomes.
Thus, the purpose of this cross-sectional study is to explore the relationships between circulating inflammatory mediators [hs-CRP, monocyte chemoattractant protein (MCP)-1, IL-1β, IL-6, IL-8, TNF-α)] and various measures of bone health, including bone density, geometry, and strength and bone biomarkers, in postmenopausal women. We hypothesize that inflammatory mediators will be inversely associated with measures of bone health in postmenopausal women, such that elevated cytokines will be related to lower BMD and bone quality outcomes.
Materials and Methods
Participants and Eligibility
The current investigation is a cross-sectional, secondary analysis of baseline data collected within the single-center, parallel-arm, 12-month randomized controlled trial (RCT): The Prune Study (Clinical Trial NCT02822378). The parent RCT was designed to investigate the effect of a 12-month dietary supplementation of prunes (ie, dried plums) at two doses (50 g/day and 100 g/day) compared to a no-prune control group on BMD, bone geometry, and bone strength in postmenopausal women. Detailed study protocols37 and results of the primary endpoints38 have been previously reported. Participants were healthy postmenopausal women (aged 55–75 years) and were deemed eligible for the study if they met the following inclusion criteria: healthy, as determined by a screening questionnaire and complete metabolic panel; non-smoking and ambulatory; BMD values from DXA assessments at the lumbar spine, total hip, and/or femoral neck corresponded to T-scores between 0.0 and –3.0; willing to include prunes in their daily diet; and not taking any natural dietary supplement containing phenolics, <1 cup/day of blueberries or apples for at least 2 months prior to study entry. Exclusion criteria have been previously described in detail.37 Briefly, participants were excluded if they had a history of chronic disease and were taking any medications that would interfere with the analysis of study outcomes. A total of 235 postmenopausal women were randomly allocated for treatment at baseline. However, the current analysis included baseline data from only 183 postmenopausal women who completed the 12-month intervention in the parent RCT and had complete measurements for both bone and inflammatory outcomes. Participants included in this cross-sectional study (n=183) were grouped according to their baseline BMD status as women with normal BMD (n=24), osteopenia (n=126), and osteoporosis (n=33).
Recruitment and Screening
Participants were recruited between June 2016 and February 2021 in The Women’s Health and Exercise Laboratory at The Pennsylvania State University in University Park, PA, USA, using fliers, e-mail announcements, information sessions, and advertisements. Potential participants interested in the study (through call/emails) underwent preliminary screening through a telephone interview involving a medical history and lifestyle questionnaire. After passing the preliminary telephone screening, women were scheduled for an in-person screening visit. Upon provision of signed, written informed consent by the participant, a physical examination and evaluation of medical health history, BMD, and results from a fasting blood draw were reviewed to determine eligibility. All study procedures, informed consent, and experiments were performed with the approval of the Institutional Review Board of The Pennsylvania State University (University Park, PA, USA; STUDY00004252), and the parent RCT was registered at Clinicaltrials.gov (NCT02822378).
Anthropometric Measurements
At screening and baseline visits, height was measured to the nearest 0.1 cm using a calibrated stadiometer, and total body weight was measured to the nearest 0.5 kg on a physician’s scale (Seca, Model 770, Hamburg, Germany). Body mass index (BMI) (kg/m2) was calculated as total body weight divided by height squared. BMI classification39 was scored as follows: normal-weight, 18.5 to <25.0; overweight, 25.0 to <30.0; and obese, 30.0 or higher.
Questionnaires
Demographic, medical, and reproductive histories were evaluated using in-house questionnaires, which included questions regarding use of medications and menstrual history. Dietary intake of the participants was obtained via dietary recall using a 3-day diet diary (one weekend day and two weekdays). Briefly, participants were asked to recall their intake of all food and beverages using standard measuring cups/tools. Daily intake of total kilocalories, macronutrients, vitamins, and minerals was analyzed based on diet records using Nutritionist Pro software (Axxya Systems, Redmond, WA, USA). Physical activity levels of participants were ascertained using a 7-day record of daily purposeful exercise duration and mode. A brief validated, calcium assessment tool (BCAT)40 was administered to evaluate the dietary intake of calcium.
Blood Sample Collection
At screening and baseline visits, fasting blood samples (10 mL; after an overnight fast of at least 12 hours) were drawn by venipuncture into different blood collection tubes (BD Biosciences, San Jose, CA, USA), depending on the outcomes measured, details of which have been previously described in the parent study protocol.37 Briefly, blood samples collected in sterile EDTA (K2)-coated blood tubes were centrifuged (Eppendorf 5804 R, Hamburg, Germany) at 1800×g for 15 minutes at room temperature (20–24°C) to obtain plasma. Blood samples collected in sterile clot activator/separator gel-coated blood tubes were allowed to clot for 30 minutes at room temperature and then centrifuged for 15 minutes at 4°C to obtain serum. Plasma and serum samples were aliquoted into 2-mL polyethylene storage tubes and frozen at –80°C until analysis.
Inflammatory Marker Measurements
C-reactive protein (CRP, mg/L) in serum was quantified using an Immulite high-sensitivity CRP kit (Siemens Healthcare, Munich, Germany) according to manufacturer’s instructions [intra-assay coefficient of variation (CV) of 5.0–6.0% and inter-assay CV of 7.3–10%]. The sensitivity of the CRP kit was 0.3 mg/L. Plasma levels of pro-inflammatory cytokines and chemokines (MCP-1, IL-1β, IL-6, IL-8, TNF-α, and pg/mL) were measured using the V-PLEX Proinflammatory Panel 1 Human Kit and V-PLEX Human MCP-1 kit (MesoScale Diagnostics, LLC, Rockville, MD, USA) as per manufacturer’s instructions (intra-assay CVs of 6.6–11.2%, 3.3–4.1%, 3.6–4.5%, 2.7–3.0%, and 2.7–3.4%, respectively, for MCP-1, IL-1β, IL-6, IL-8, and TNF-α; inter-assay CVs of 5.0–8.9%, 5.5–7.7%, 5.2–7.3%, 5.0–7.1%, and 6.1–10.1, respectively, for MCP-1, IL-1β, IL-6, IL-8, and TNF-α). If a data point fell below the range of detection, half of the lower limit of detection was used as the value for data analysis. Each assay was performed in duplicate.
Biomarkers of Bone Turnover
Serum was used to measure several biomarkers of bone turnover and hormones regulating bone metabolism:37 procollagen type 1 N-terminal propeptide (P1NP; bone formation), C-terminal telopeptide (CTx; bone resorption), insulin-like growth factor 1 (IGF-1), and 25-hydroxyvitamin D3 [25(OH)D3] (ng/mL). P1NP was measured using a radioimmunoassay (Orion Diagnostica, Oslo, Finland) (intra-assay and inter-assay CVs of 10% each). CTx, IGF-1, and vitamin D [25(OH)D3] were measured using an automated chemiluminescent immunoassay (iSYS, Immunodiagnostic Systems, United Kingdom) [intra-assay and inter-assay CVs of 3% and 10%, respectively, for CTx; 1.9% and 3.9%, respectively, for IGF-1; and 5% and 7.4%, respectively, for 25(OH)D3].
DXA Measurements
At the screening visit, all participants underwent DXA scans on a Hologic QDR4500 system (Hologic, Bedford, MA, USA) by an International Society for Clinical Densitometry certified bone densitometry technologist. Body composition was assessed using whole-body scans, including measurements of percent body fat, fat mass, lean mass, and fat-free mass (laboratory precision of ≤1.1% CV for body composition). Areal BMD (g/cm2) was measured using DXA scans of the total body, lumbar spine, and hip region (laboratory precision of <0.8% CV at all three BMD sites). The results from DXA scans were expressed as a “T-score” to indicate the standard deviation (SD) of each participant from the young adult mean. The WHO classification5 was used to define BMD categories, wherein participants were classified as osteopenic if T-scores were below –1.0 but greater than –2.5 at any site; or osteoporotic if T-scores were less than –2.5 at any site. The 10-year probability of major osteoporotic fracture or hip fracture was calculated using the trabecular bone score-adjusted fracture risk assessment tool (FRAX) (www.shef.ac.uk/FRAX).41,42 Additionally, bone geometry and strength from DXA scans at the femur were estimated by HSA.43,44
pQCT Measurements
At the baseline visit, all participants underwent pQCT scans [Stratec XCT3000 (Orthometrix, White Plains, NY, USA)] to measure volumetric BMD (mg/cm3) and estimates of bone geometry and strength at two weight-bearing sites of the appendicular skeleton: radius and tibia. Measurements were taken along the length of the radius (in the non-dominant arm) at the 4%, 33%, and 66% sites and tibia (of the opposite leg) at the 4%, 14%, 38%, and 66% sites from the distal endplate. The 4% site of long bones represents the metaphyseal region near the distal endplate of the bone, and the 14%, 33%, 38%, and 66% sites of long bones represent the diaphyseal regions located in the shaft at the proximal ends of the bone. In-depth descriptions of all pQCT variables are outlined in the study protocol of the parent RCT.37 The manufacturer’s hydroxyapatite phantom was scanned daily for quality control.
Statistical Analysis
The distribution of all data was assessed for normality using the Shapiro–Wilk test, and a natural logarithm or square root transformation was applied, when necessary. If data transformations were unsuccessful at normalizing the distribution of the data, non-parametric tests were used. Differences in the mean levels of serum hs-CRP and plasma pro-inflammatory cytokines (MCP-1, IL-1β, IL-6, IL-8, and TNF-α) at baseline among the three groups (normal BMD, osteopenia, and osteoporosis) were compared using one-way ANOVA (linear mixed-effect model) or Kruskal–Wallis test, depending on data distribution. Multiple comparisons were corrected with the Tukey-Kramer or Dunn’s post-hoc test. Baseline BMI was used as a covariate in the linear mixed-effects model. For linear mixed-effects models, model selection was based on optimizing fit statistics (evaluated as the lowest Bayesian Information Criterion).
BMI is positively associated with bone density and inflammatory mediators and may thus act as a potential mediator of the relationships between inflammatory markers and bone health. To this end, we performed stratification of the study population into two sub-groups based on BMI cutoffs for normal-weight and overweight/obesity. Differences in the mean levels of serum hs-CRP and plasma pro-inflammatory cytokines at baseline between normal-weight women and women with overweight/obesity were compared using independent t-tests or Mann–Whitney U-Tests depending on data distribution. Spearman’s rank correlation was used to determine the degree of potential relationships between baseline outcomes, including demographic and anthropometric variables, circulating inflammatory markers, and bone health outcomes. For all correlations between inflammatory markers and bone health outcomes, two sub-analyses were performed in addition to the primary analysis in all women: (1) correlations in normal-weight women and (2) correlations in women with overweight/obesity to determine whether the strength or directionality of these correlations differed according to the BMI status at baseline.
Multiple linear regression was conducted to determine the contribution of inflammatory markers to BMD at the total body, lumbar spine, total hip, and femoral neck in postmenopausal women at baseline. The unadjusted regression models included each inflammatory marker as an independent predictor of BMD. In fully adjusted regression models, age, BMI, age at menopause, minutes of high-magnitude-loading exercise, and dietary intake of alcohol, fiber, vitamin D, and calcium were used as confounding variables, based on previous studies demonstrating a relationship with bone outcomes.16,32,45,46 In the multiple linear regression model, independent variables that exhibited multicollinearity (as indicated by a variance inflation factor greater than 10) were removed from the model. Stepwise selection was used for fully adjusted models, which included all inflammatory markers, to determine which variables remained in the final regression model. Statistical significance was accepted at P < 0.05 for all outcomes. Descriptive data of baseline characteristics across all three groups are reported as mean ± SD. Values in the tables are reported as mean ± SEM, unless stated otherwise. Statistical analyses were performed using SAS (Statistical Analysis System, version 9.4, Cary, NC, USA).
Results
Baseline Characteristics of Participants
A total of 638 postmenopausal women were screened through telephone interview, of which 322 women entered in-person screening. Of these 322 women, 235 participants entered baseline and 183 completed the 12-month RCT. Detailed flow of participants is outlined in the primary paper.38 Baseline characteristics of participants who completed the trial (n=183) are summarized in Table 1. The average age was 62.16 ± 4.94 years (range: 55–75 years), and the average age at menopause was 50.34 ± 4.88 years (range: 30–61 years). Among the 183 postmenopausal women, 24 (13.1%) had normal BMD, 126 (68.9%) had osteopenia, and 33 (18.0%) had osteoporosis at any site (lumbar spine, total hip, or femoral neck), defined using the WHO classification.5 The number of years since menopause did not differ significantly among the three groups, with an average of 11.72 ± 6.84 years since menopause (range: 1–33 years). The majority of women were Caucasian (>98%) and in late postmenopausal stage (80.4%), that is, greater than 8 years since their final menstrual period47 (data not shown). Approximately half of the participants had overweight/obesity (n=95, 51.9%). Postmenopausal women with osteoporosis had significantly lower height (p=0.049), body weight (p<0.001), BMI (p<0.001), fat mass (p<0.001), and lean body mass (p<0.001) compared to women with normal BMD or osteopenia (Table 1). Furthermore, BMD at the total body, lumbar spine, total hip, and femoral neck, as well as their corresponding T-scores, were the lowest in the osteoporosis group (all p<0.001). The mean levels of serum hs-CRP and plasma pro-inflammatory cytokines (MCP-1, IL-1β, IL-6, IL-8, and TNF-α) were not significantly different among women with normal BMD, osteopenia, or osteoporosis. However, postmenopausal women with overweight/obesity had significantly higher levels of hs-CRP (p<0.001), IL-1β (p=0.001), IL-6 (p<0.001), IL-8 (p=0.001), and TNF-α (p=0.001) compared to normal-weight women (Supplemental Table 1). In addition, BMD at the lumbar spine, total hip, and femoral neck, as well as their corresponding T-scores, were significantly higher in postmenopausal women with overweight/obesity compared to normal-weight women (Supplemental Table 1; all p<0.001). Serum hs-CRP and plasma IL-1β, IL-6, IL-8, and TNF-α were positively correlated with BMI, body fat percentage, and android fat percentage in all postmenopausal women at baseline (Supplemental Table 2). Plasma IL-1β positively correlated with age at menopause (Supplemental Table 2; r=0.197, p<0.01).
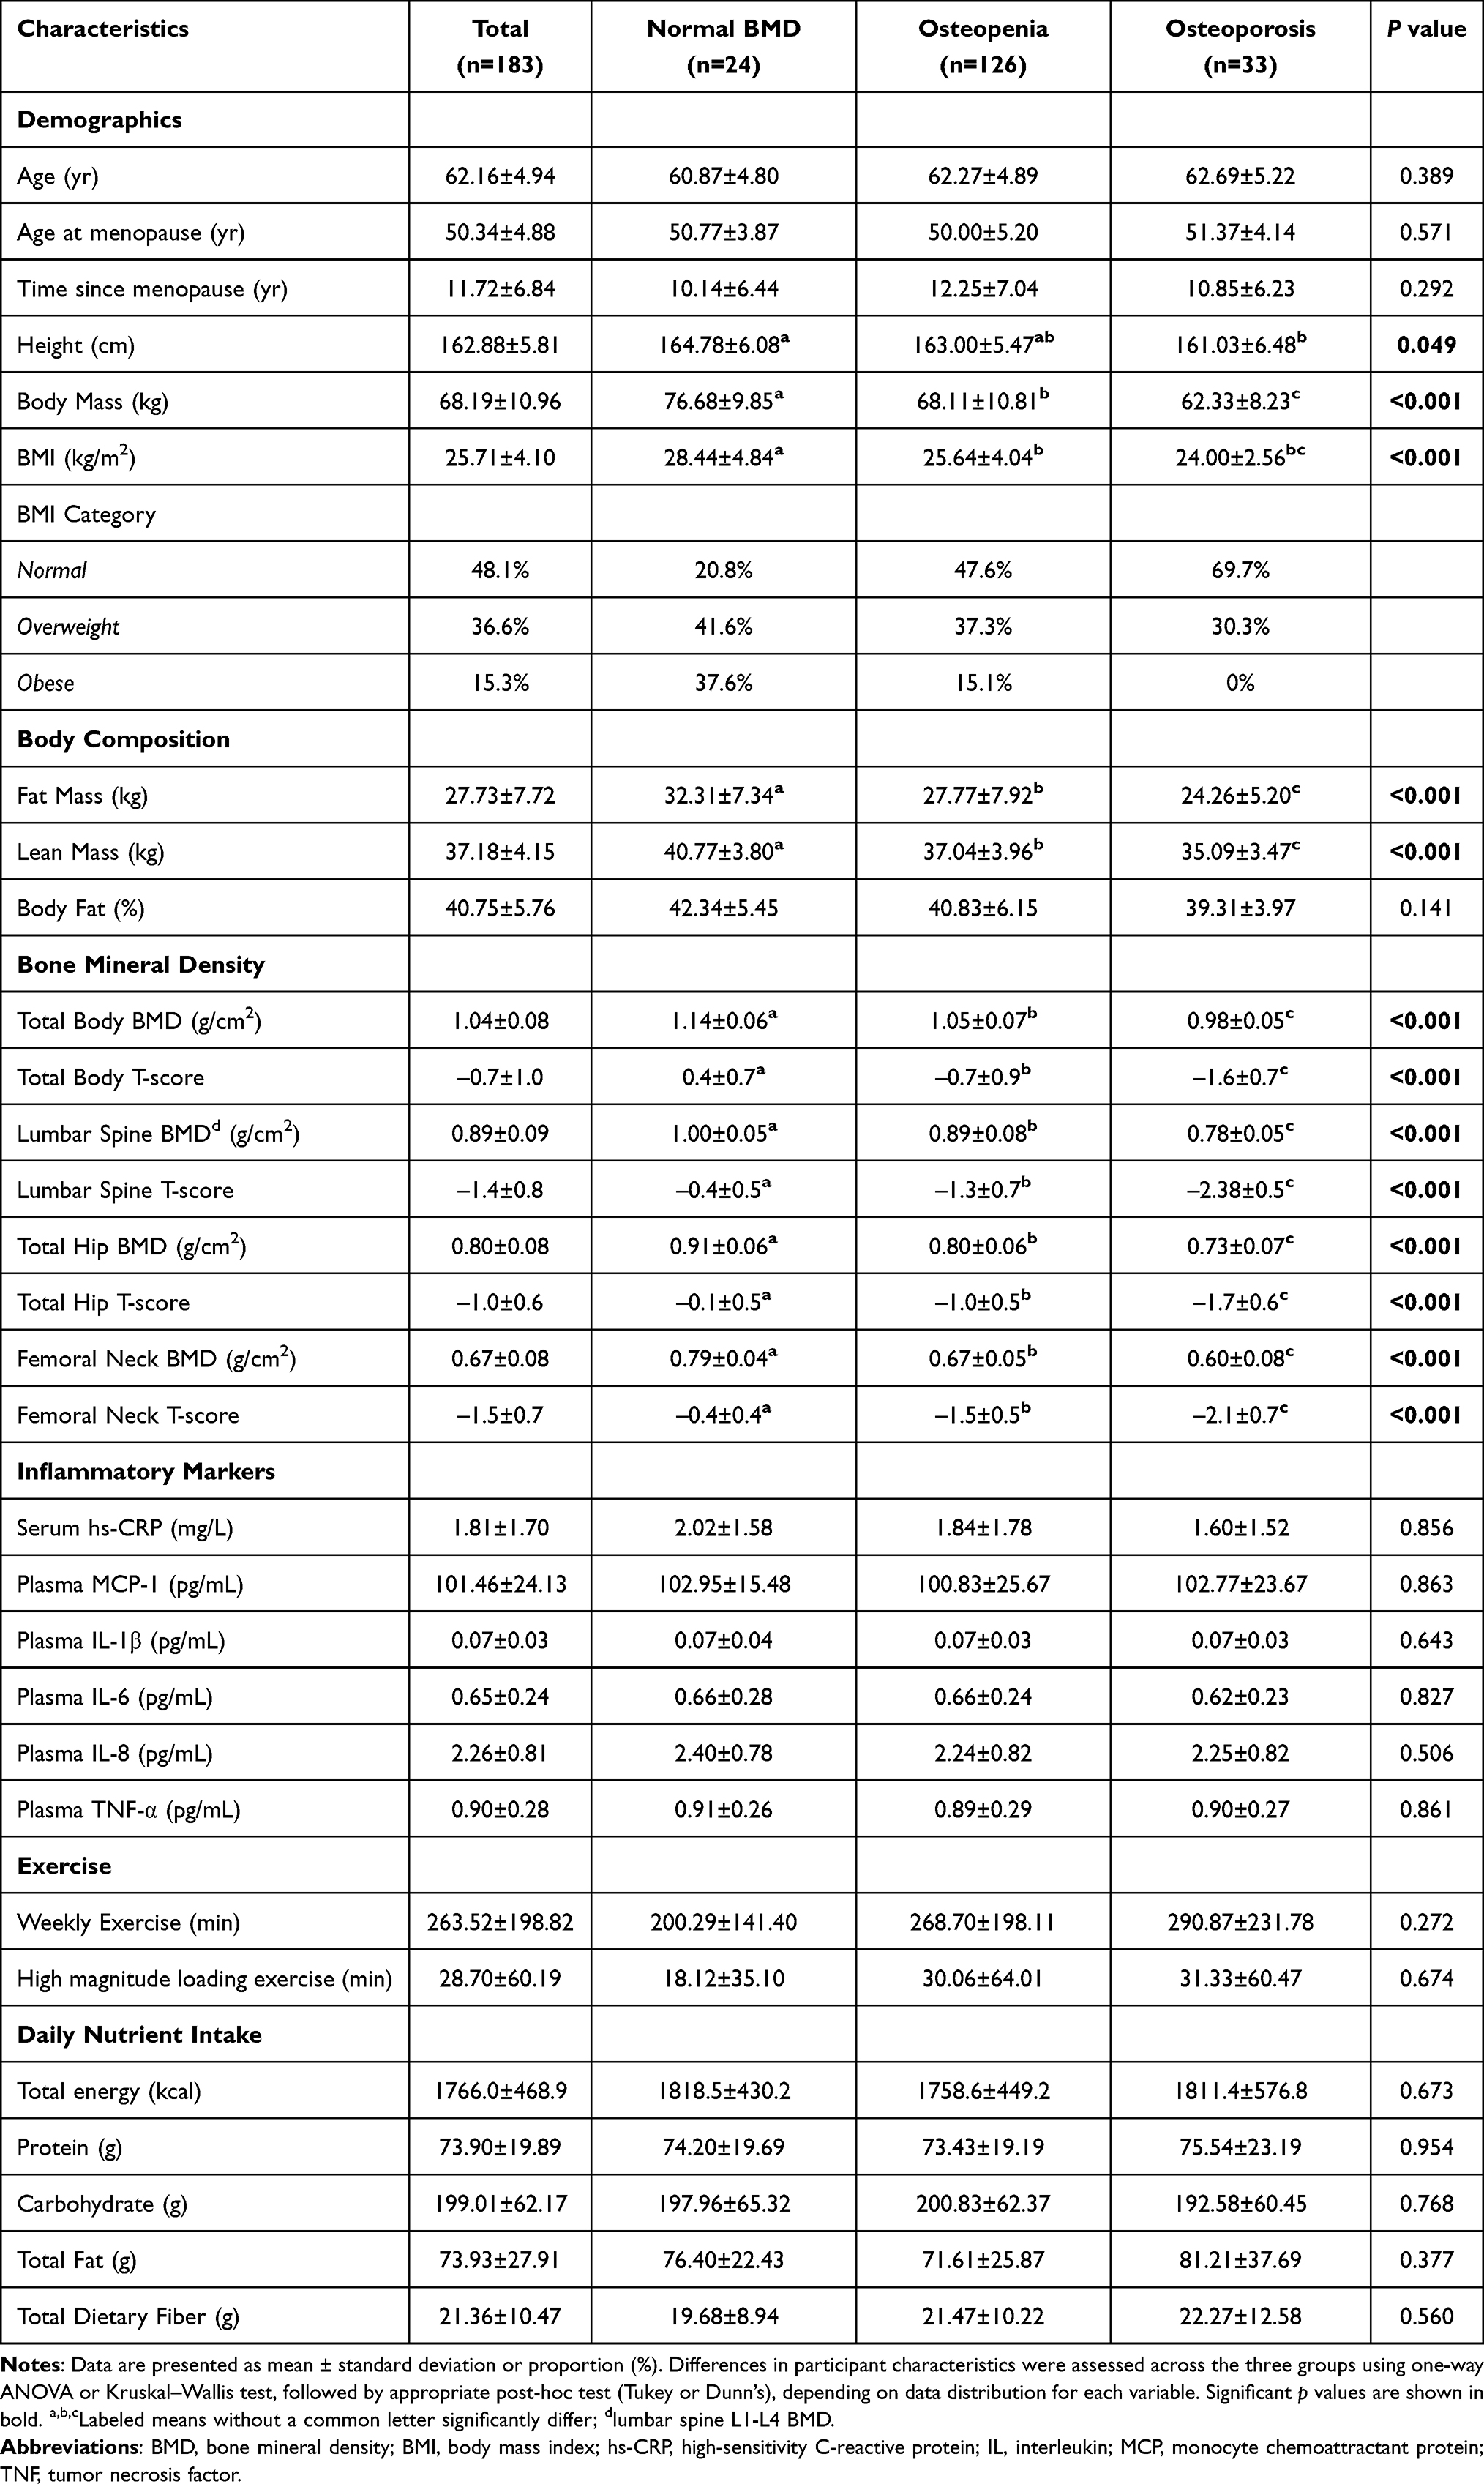 |
Table 1 Baseline Characteristics of Participants |
Correlations Between Circulating Markers of Inflammation and Bone Biomarkers
A significant negative correlation was observed between hs-CRP and bone formation marker P1NP (Table 2; r=–0.197, p<0.05) in all postmenopausal women. IGF-1 was negatively correlated with IL-6 in all women (r=–0.186, p<0.05), and in women with overweight/obesity (r=–0.270, p<0.01). Serum 25-hydroxy vitamin D3 was positively correlated with IL-6 in women with overweight/obesity (r=0.240, p<0.05) and with IL-8 in normal-weight women (r=0.232, p<0.05).
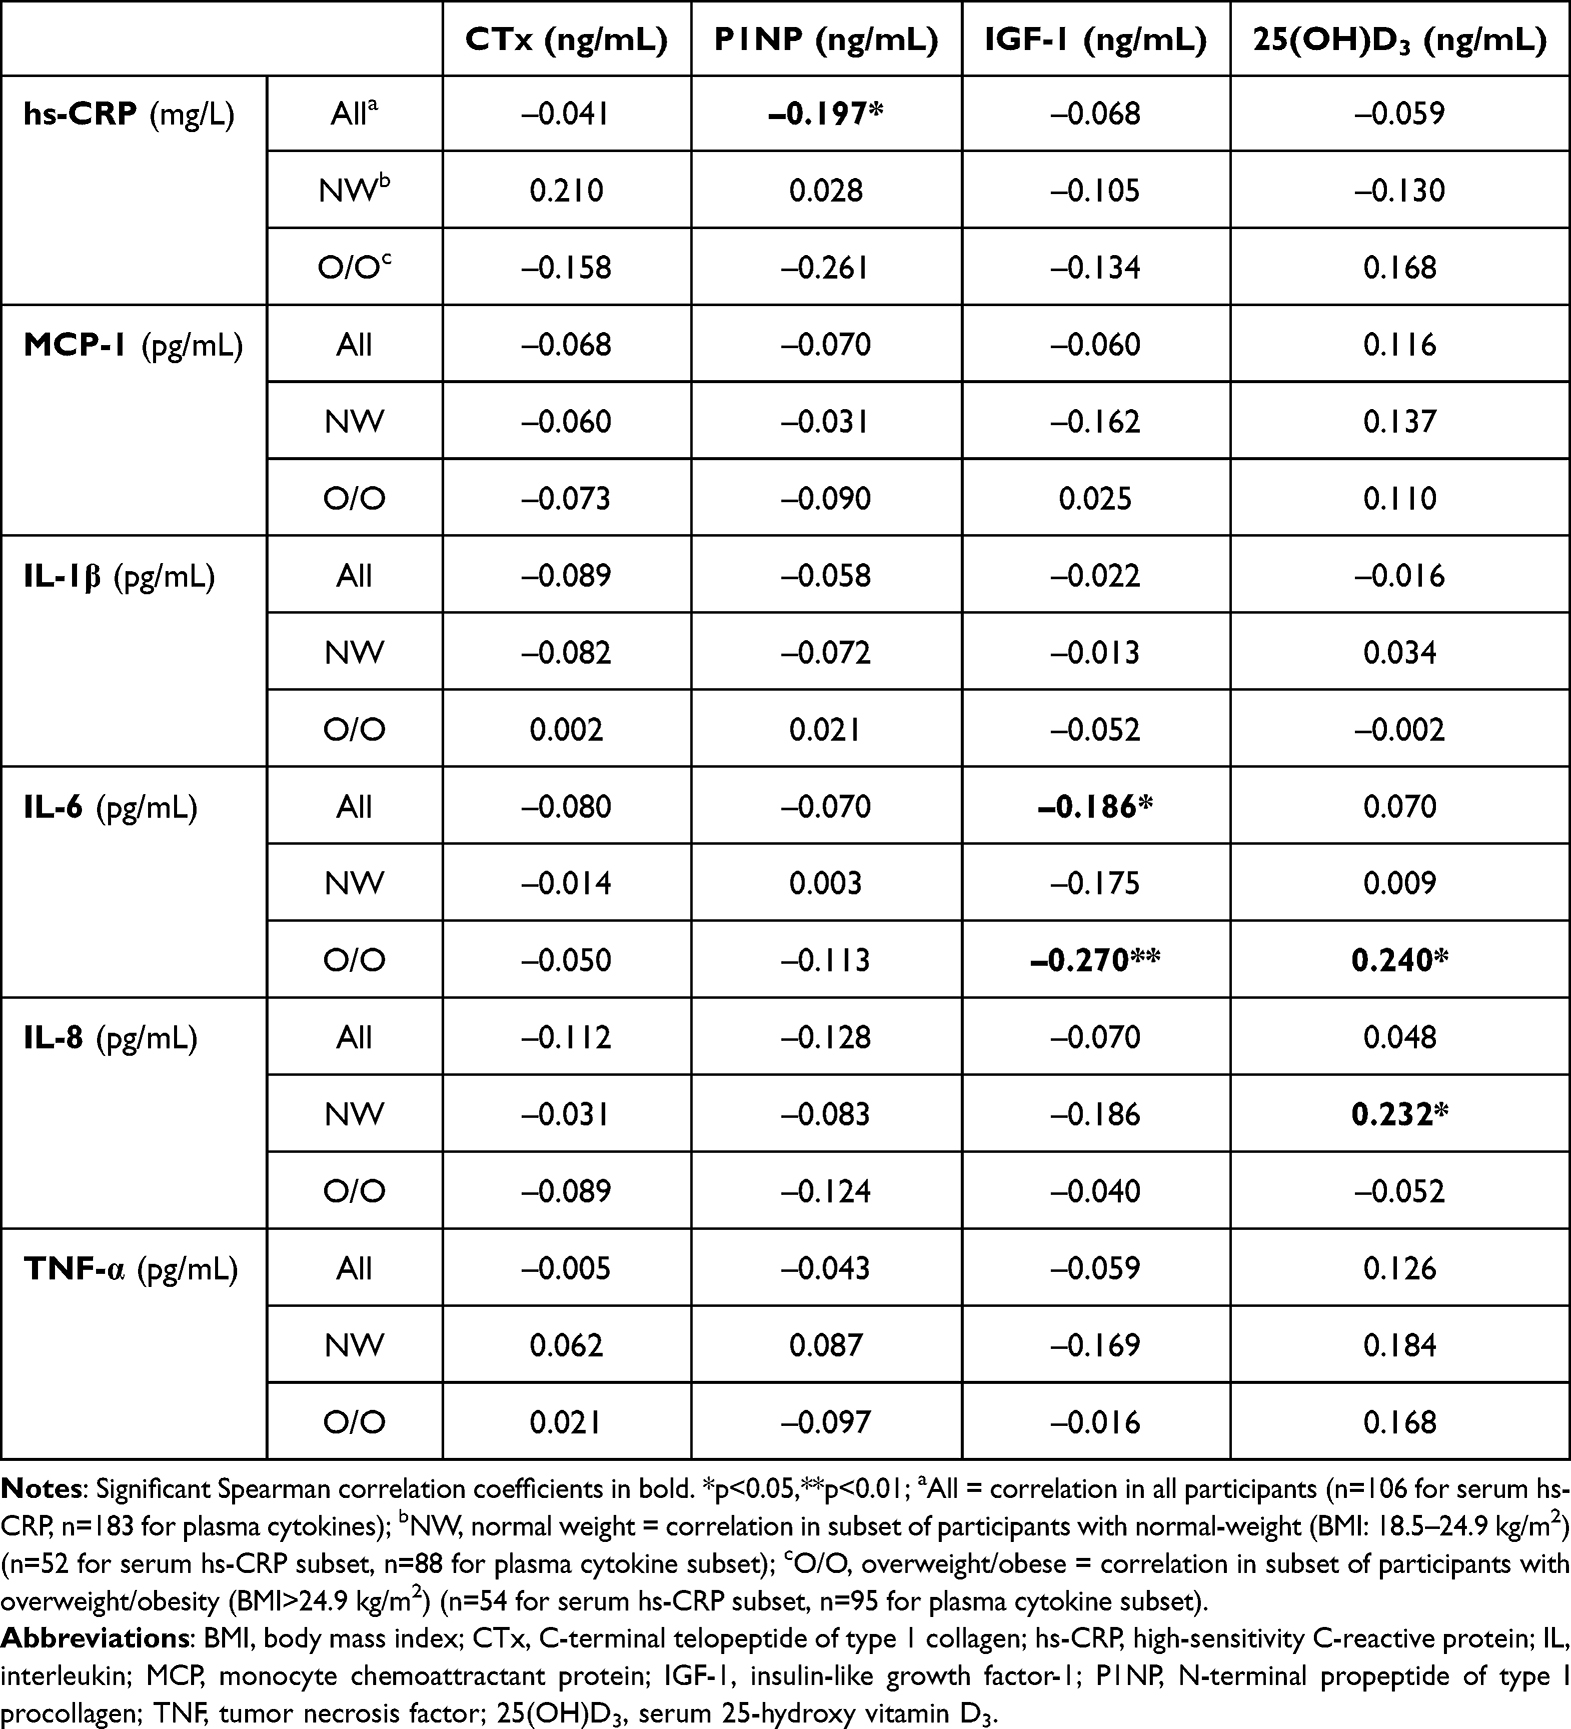 |
Table 2 Correlation Between Inflammatory Markers and Serum Markers of Bone Biomarkers |
Correlations Between Inflammatory Markers and BMD
hs-CRP was positively correlated with BMD at the lumbar spine (r=0.251, p<0.01) and total hip (r=0.247, p<0.05) in all postmenopausal women (Table 3). In normal-weight women, BMD at the lumbar spine was negatively correlated with plasma IL-1β (r=–0.224, p<0.05) and plasma IL-6 (r=–0.212, p<0.05). In all women, trabecular bone score at the lumbar spine was negatively correlated with plasma TNF-α (r=–0.163, p<0.05), IL-1β (r=–0.172, p<0.05), IL-6 (r=–0.219, p<0.01), and IL-8 (r=–0.155, p<0.05) (Table 3). In normal-weight women, plasma IL-1β was negatively correlated with cross-sectional moment of inertia and Z-section modulus at the narrow neck (r=–0.234, –0.277, respectively; p<0.05), intertrochanteric region (r=–0.319, –0.290, respectively; p<0.01), and femoral shaft (r=–0.266, –0.277, respectively; p<0.05) of the femur (Supplemental Table 3). In normal-weight women, plasma IL-6 was negatively correlated with cross-sectional area at the intertrochanteric region (r=–0.231, p<0.05) and femoral shaft (r=–0.224, p<0.05) of the femur (Supplemental Table 3). In women with overweight/obesity, plasma TNF-α was negatively correlated with cortical thickness at the femoral shaft (r=–0.261, p<0.05) and was positively correlated with buckling ratio at the intertrochanteric region (r=0.210, p<0.05) and femoral shaft (r=0.278, p<0.01) of the femur (Supplemental Table 3).
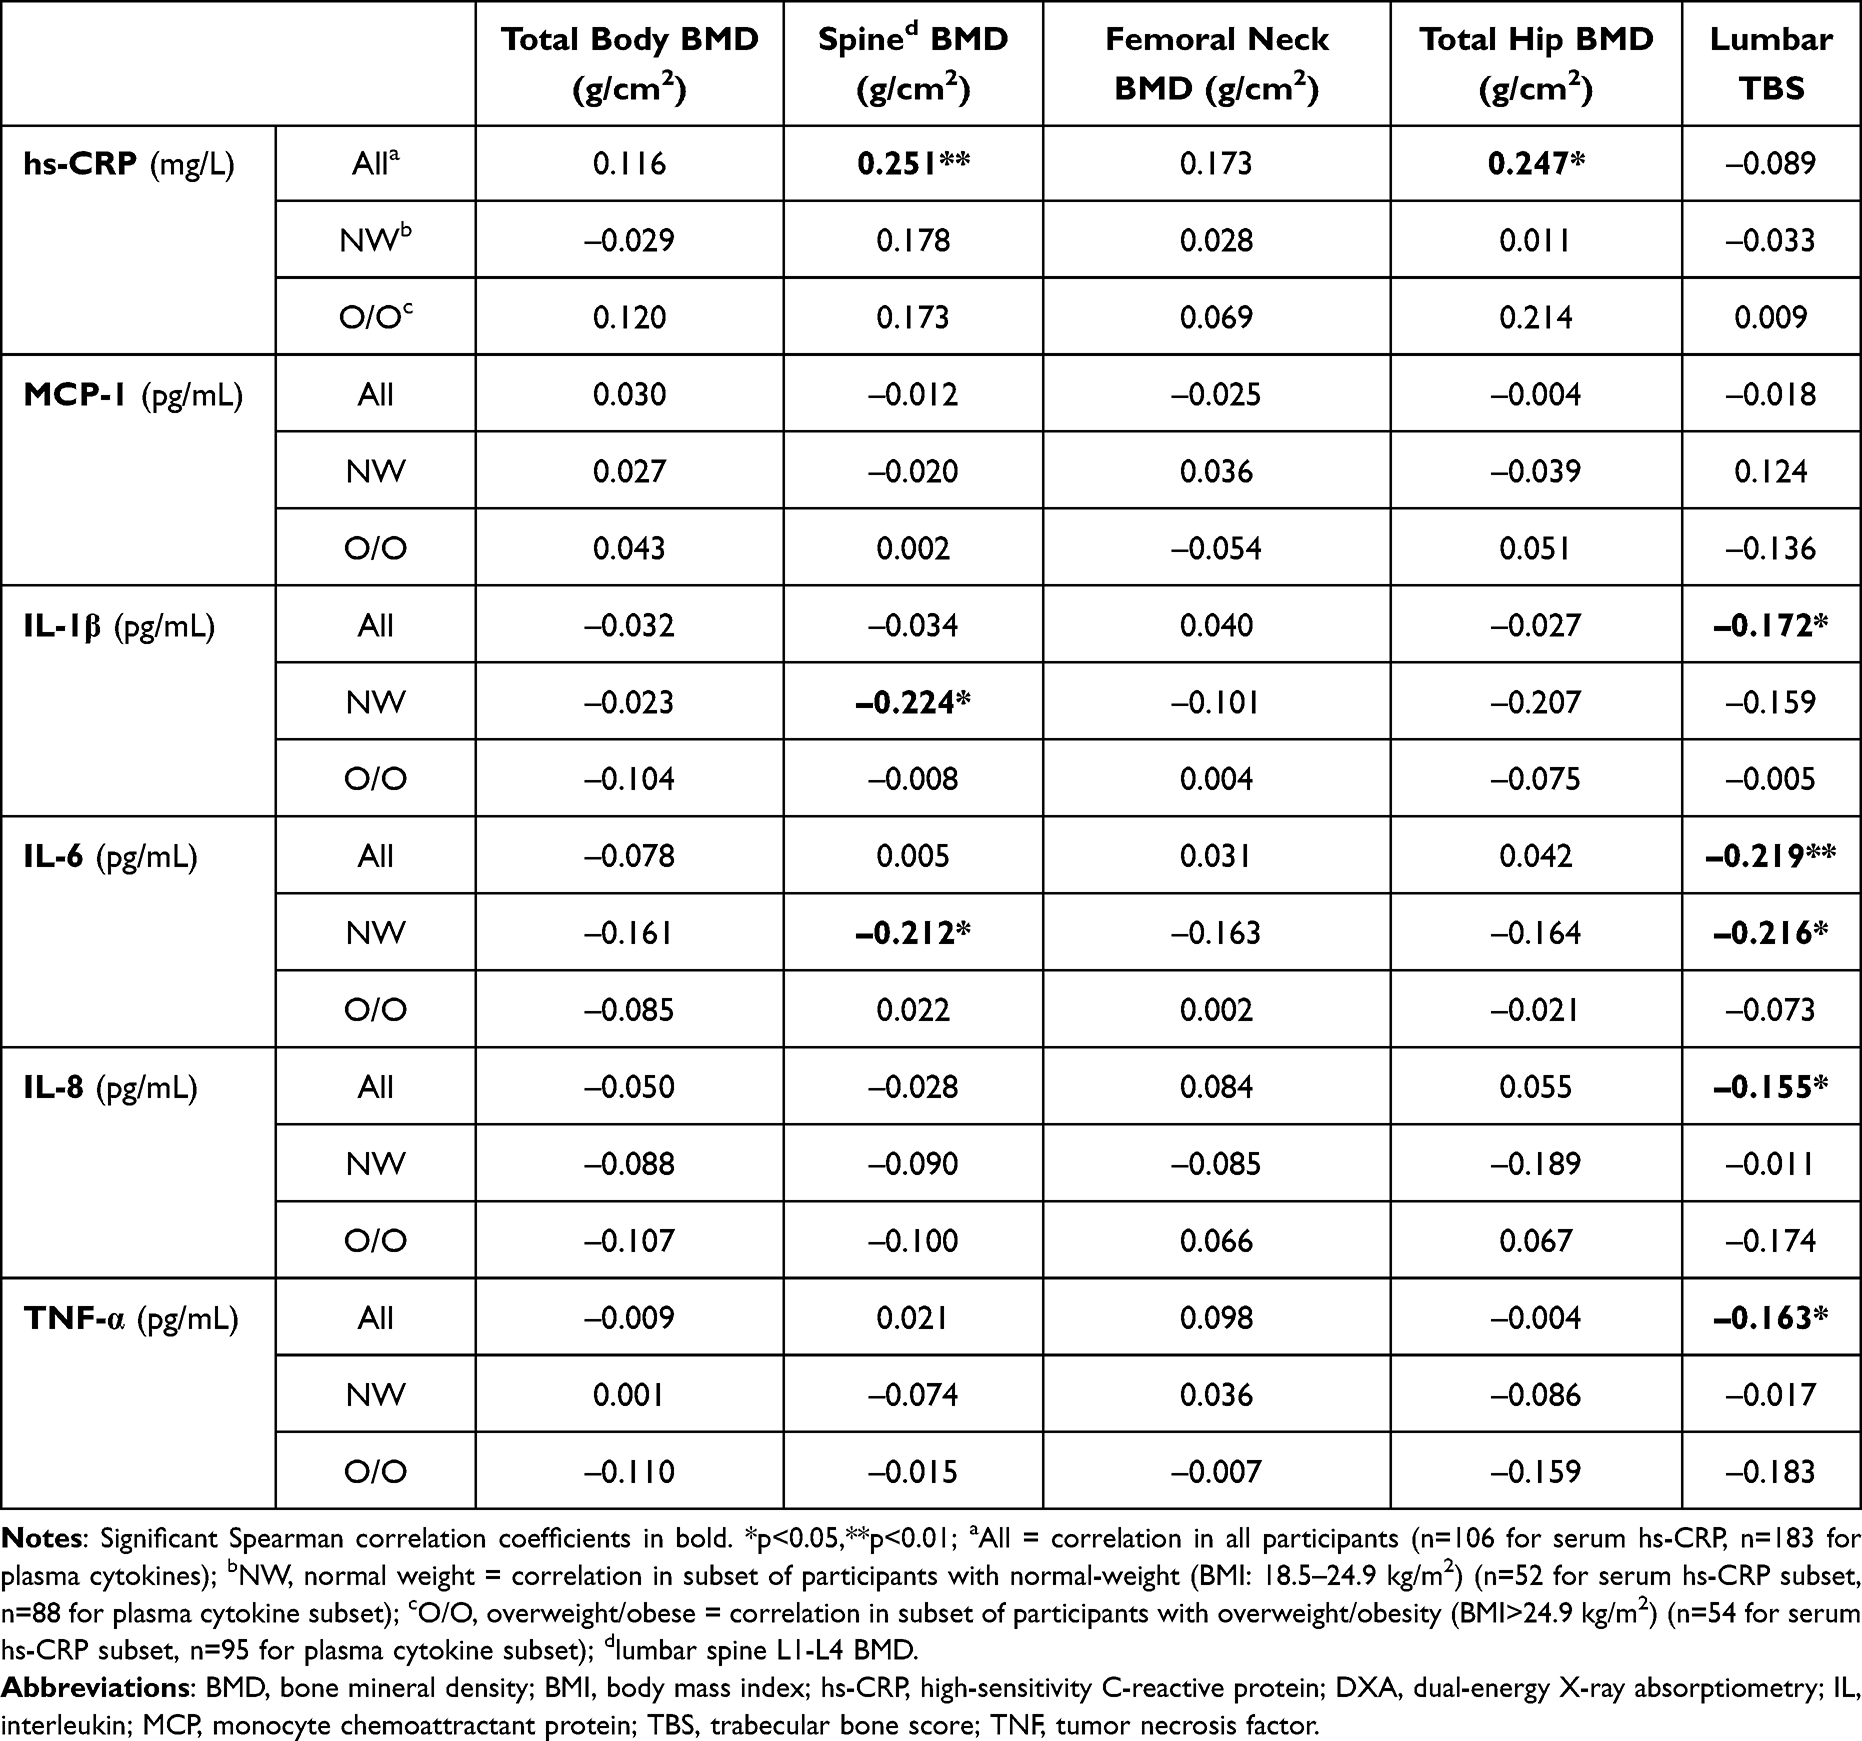 |
Table 3 Correlation Between Inflammatory Markers and Areal BMD Estimated at Various Sites Using DXA |
Correlations Between Inflammatory Markers and Bone Strength and Geometry
In all women, hs-CRP was positively correlated with total volumetric BMD at the tibia (Table 4; r=0.295, p<0.01) and trabecular volumetric BMD at the radius (Table 5; r=0.254, p<0.05) at the 4% metaphyseal sites. In women with overweight/obesity, hs-CRP was negatively correlated with total and trabecular bone areas at the 4% metaphyseal tibia (Table 4; r=−0.379, r=−0.371, respectively, p<0.01) and with periosteal and endosteal circumferences and polar strength strain index at the 33% diaphyseal radius (Table 5; r=−0.362, r=−0.374, r=−0.278, respectively, p<0.05). Significant positive correlations were observed between plasma MCP-1 and total and trabecular bone areas at the 4% metaphyseal tibia (Table 4; r=0.151, r=0.147, respectively, p<0.05) in all women. However, plasma MCP-1 was negatively correlated with cortical volumetric BMD at the 33% diaphyseal radius in all women (Table 5; r=−0.153, p<0.05). In normal-weight women, plasma IL-8 was negatively correlated with cortical volumetric BMD at the 14% diaphyseal tibia (Table 4; r=−0.226, p<0.05) and at the 33% and 66% diaphyseal radius (Table 5; r=−0.232, r=−0.225, respectively, p<0.05). Furthermore, in these normal-weight women, plasma IL-1β and IL-6 were negatively correlated with polar strength strain index at the 14% and 38% diaphyseal tibia (Table 4; 14%, r=−0.211, r=−0.245; 38%, r=−0.222, r=−0.240; respectively, p<0.05) and the 33% diaphyseal radius (Table 5; r=−0.271, p<0.05; r=−0.330, p<0.01; respectively). In women with overweight/obesity, plasma TNF-α was negatively correlated with total bone area (r=−0.233, p<0.05), periosteal circumference (r=−0.233, p<0.05), and polar strength strain index (r=−0.307, p<0.01) at the 66% diaphyseal radius (Table 5).
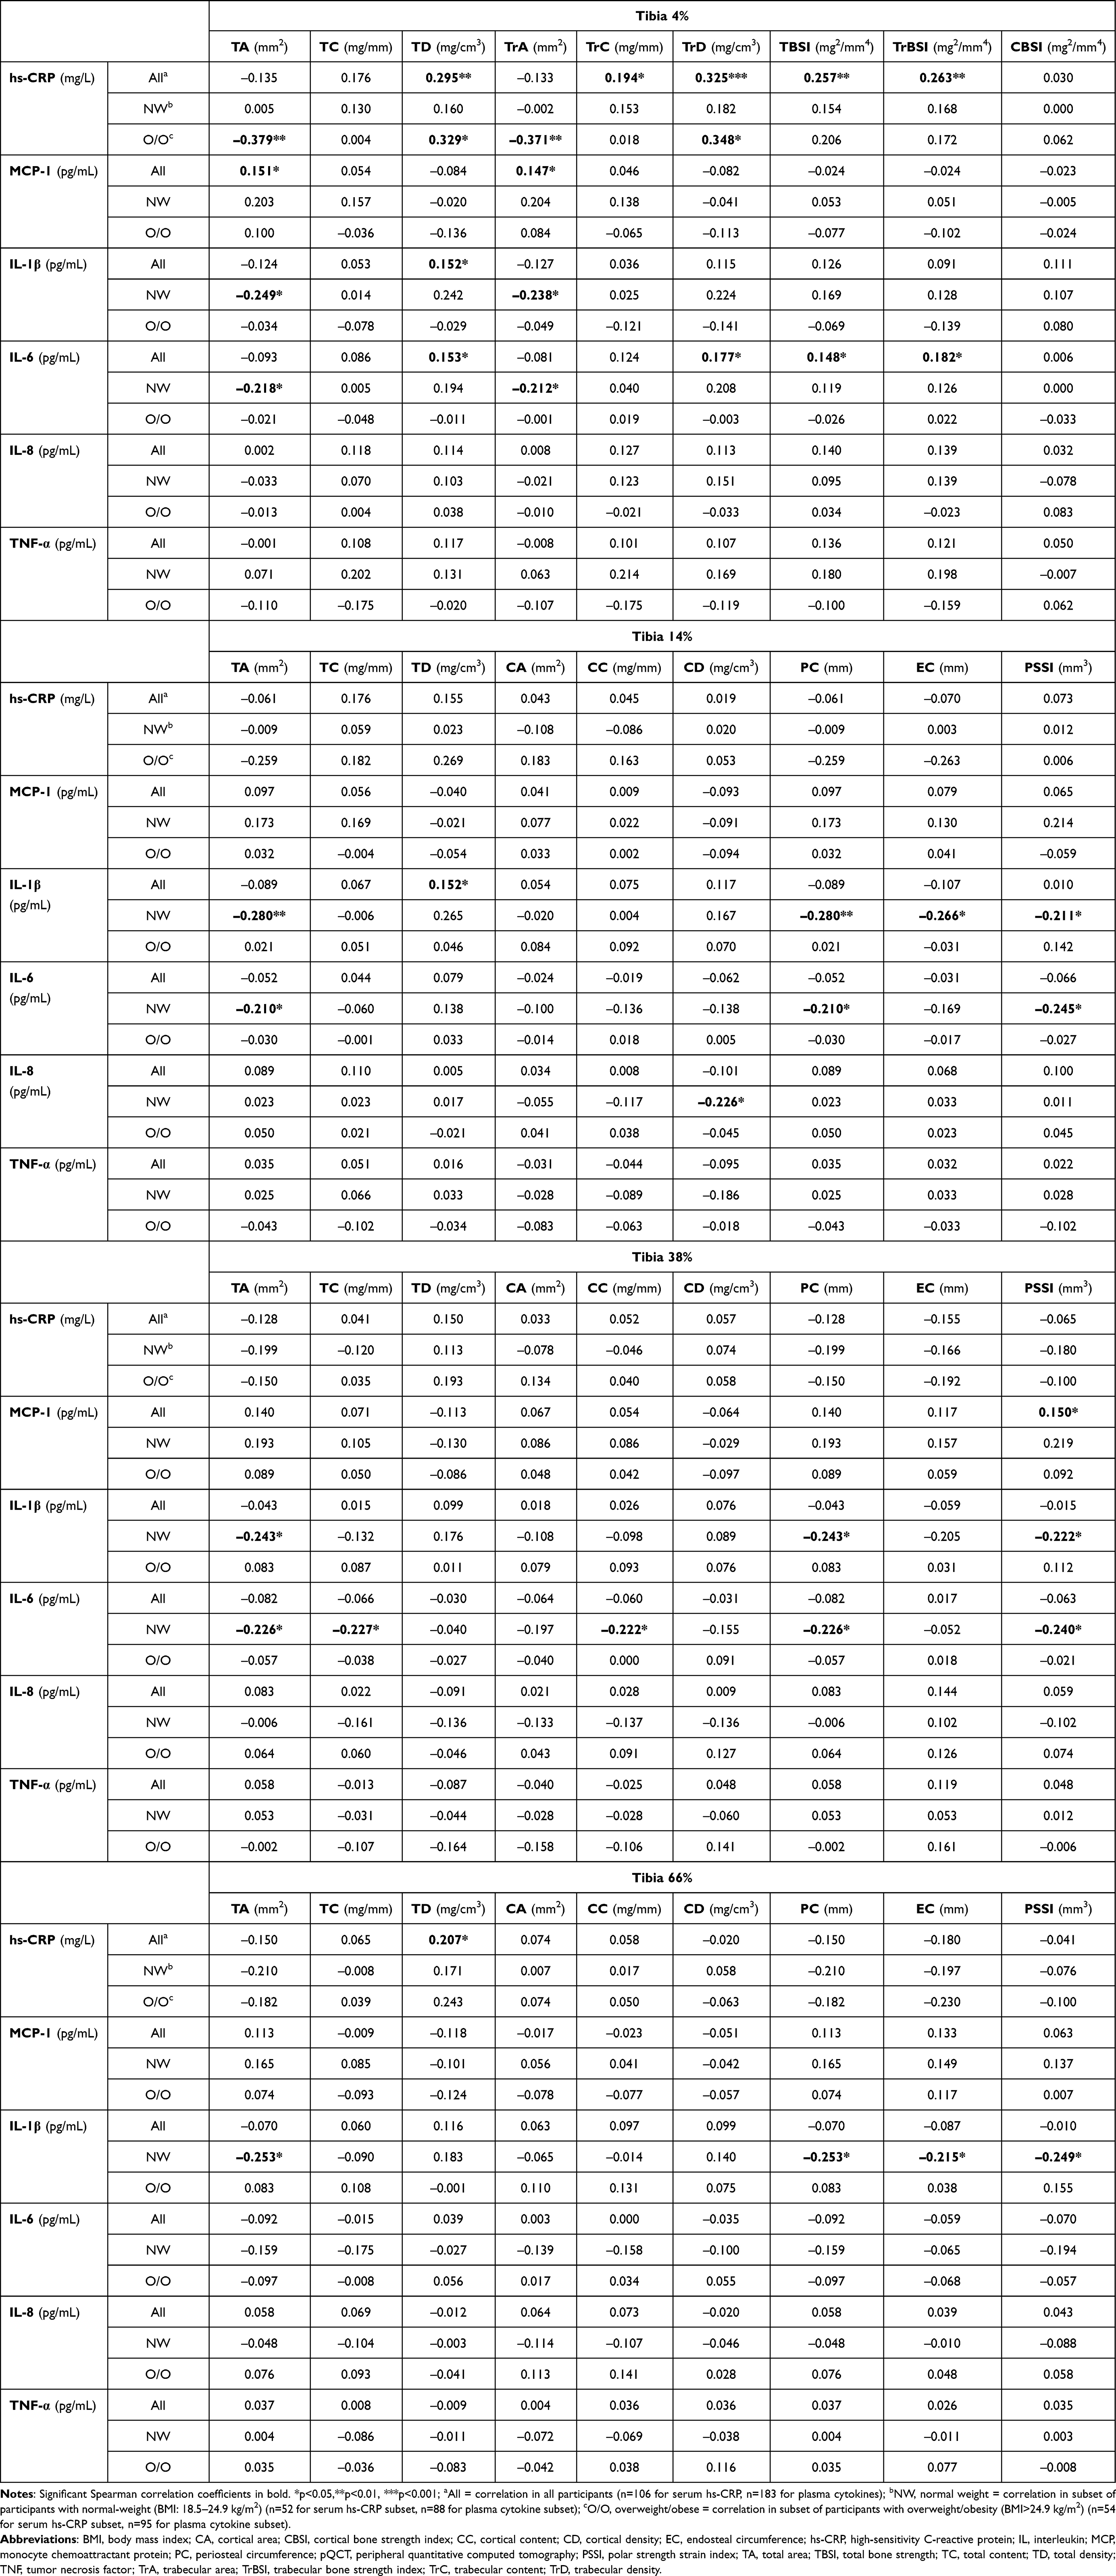 |
Table 4 Correlation Between Inflammatory Markers and Tibia Bone Strength and Geometry Estimated Using pQCT |
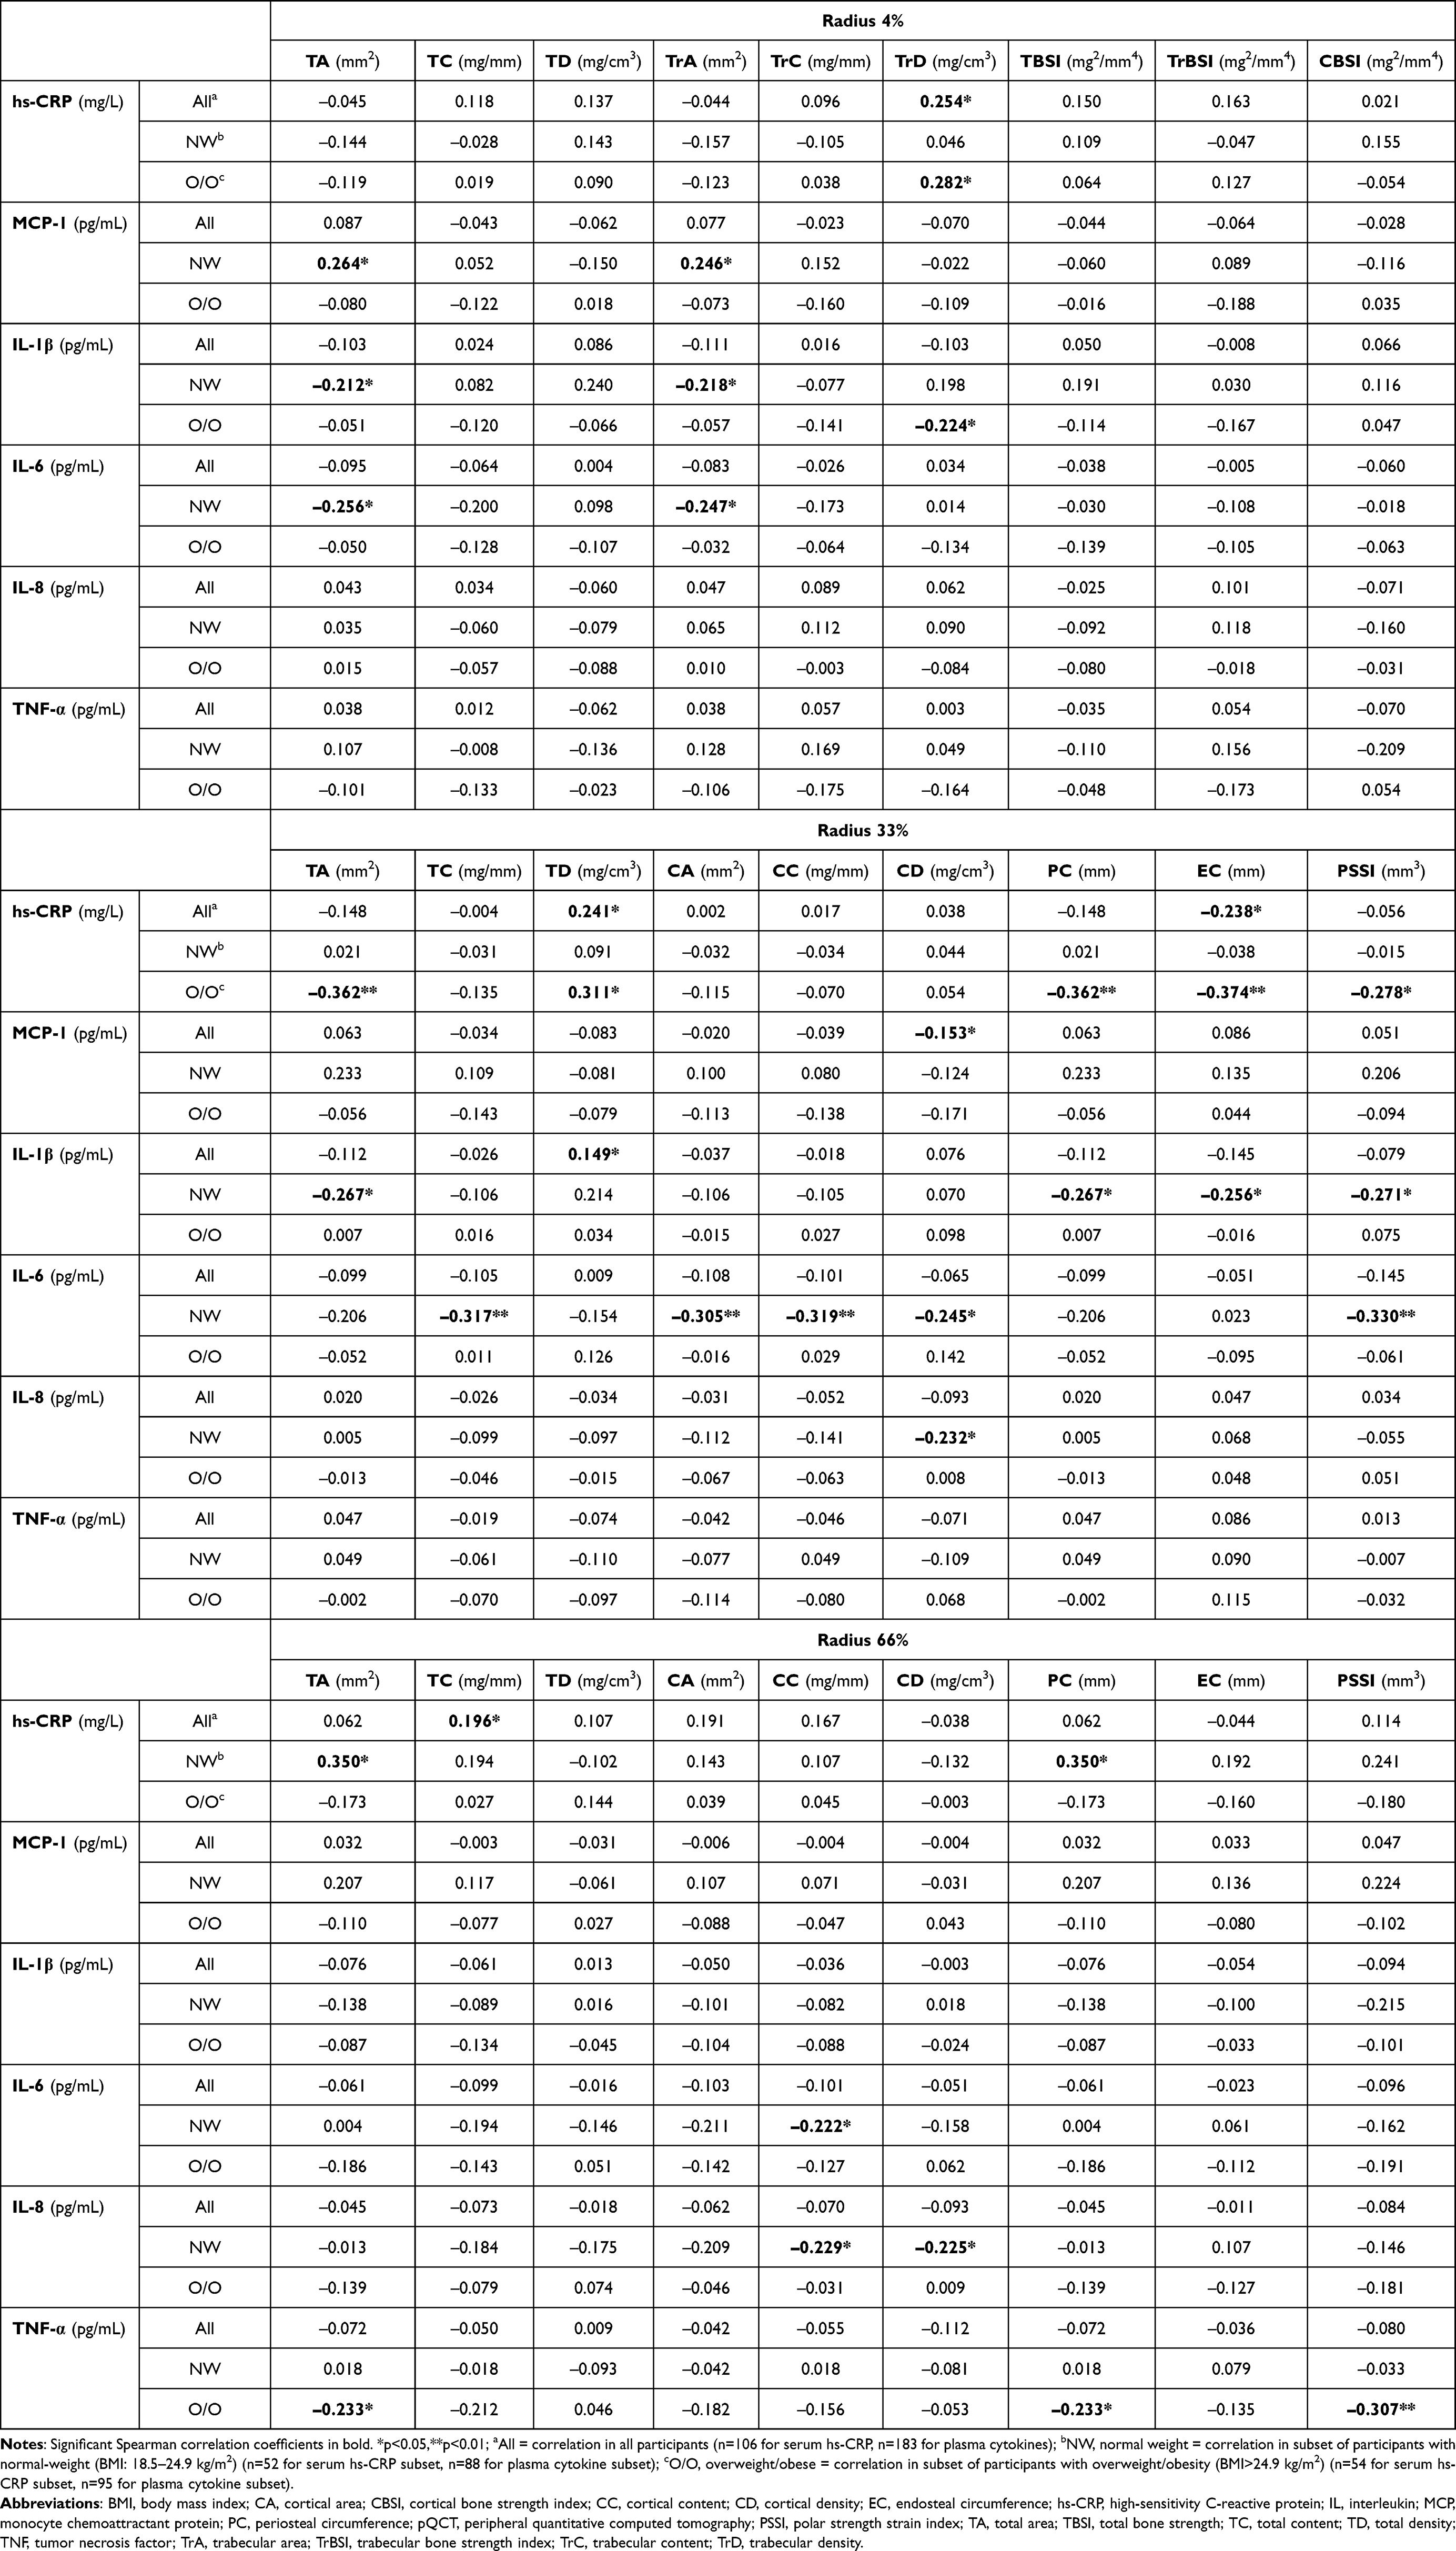 |
Table 5 Correlation Between Inflammatory Markers and Radius Bone Strength and Geometry Estimated Using pQCT |
Inflammatory Markers as Predictors of Areal BMD
Plasma IL-6 contributed to 4.52% of the variability in total body BMD (Table 6; β=–0.131, p=0.027). When IL-6, BMI, and dietary calcium intake were included in the model, the adjusted R2 was 13.17%. Plasma IL-6 also contributed 3.83% of the variability in lumbar spine BMD (Table 6; β=–0.151, p=0.036). In the unadjusted model, hs-CRP predicted lumbar spine BMD (Supplemental Table 4; β=0.065, p=0.013), and this effect remained significant in the final reduced model, accounting for 4.31% of the variability in lumbar spine BMD (Table 6; β=0.078, p=0.028). MCP-1 contributed to 5.37% of the variability in lumbar spine BMD (Table 6; β=0.001, p=0.017). When IL-6, hs-CRP, MCP-1, and BCAT calcium score were included in the model, the adjusted R2 was 16.30%. Plasma TNF-α contributed to 3.65% of the variability in total hip BMD (Table 6; β=–0.114, p=0.028). When TNF-A, BMI, and dietary calcium intake were included in the model, the adjusted R2 was 26.71%.
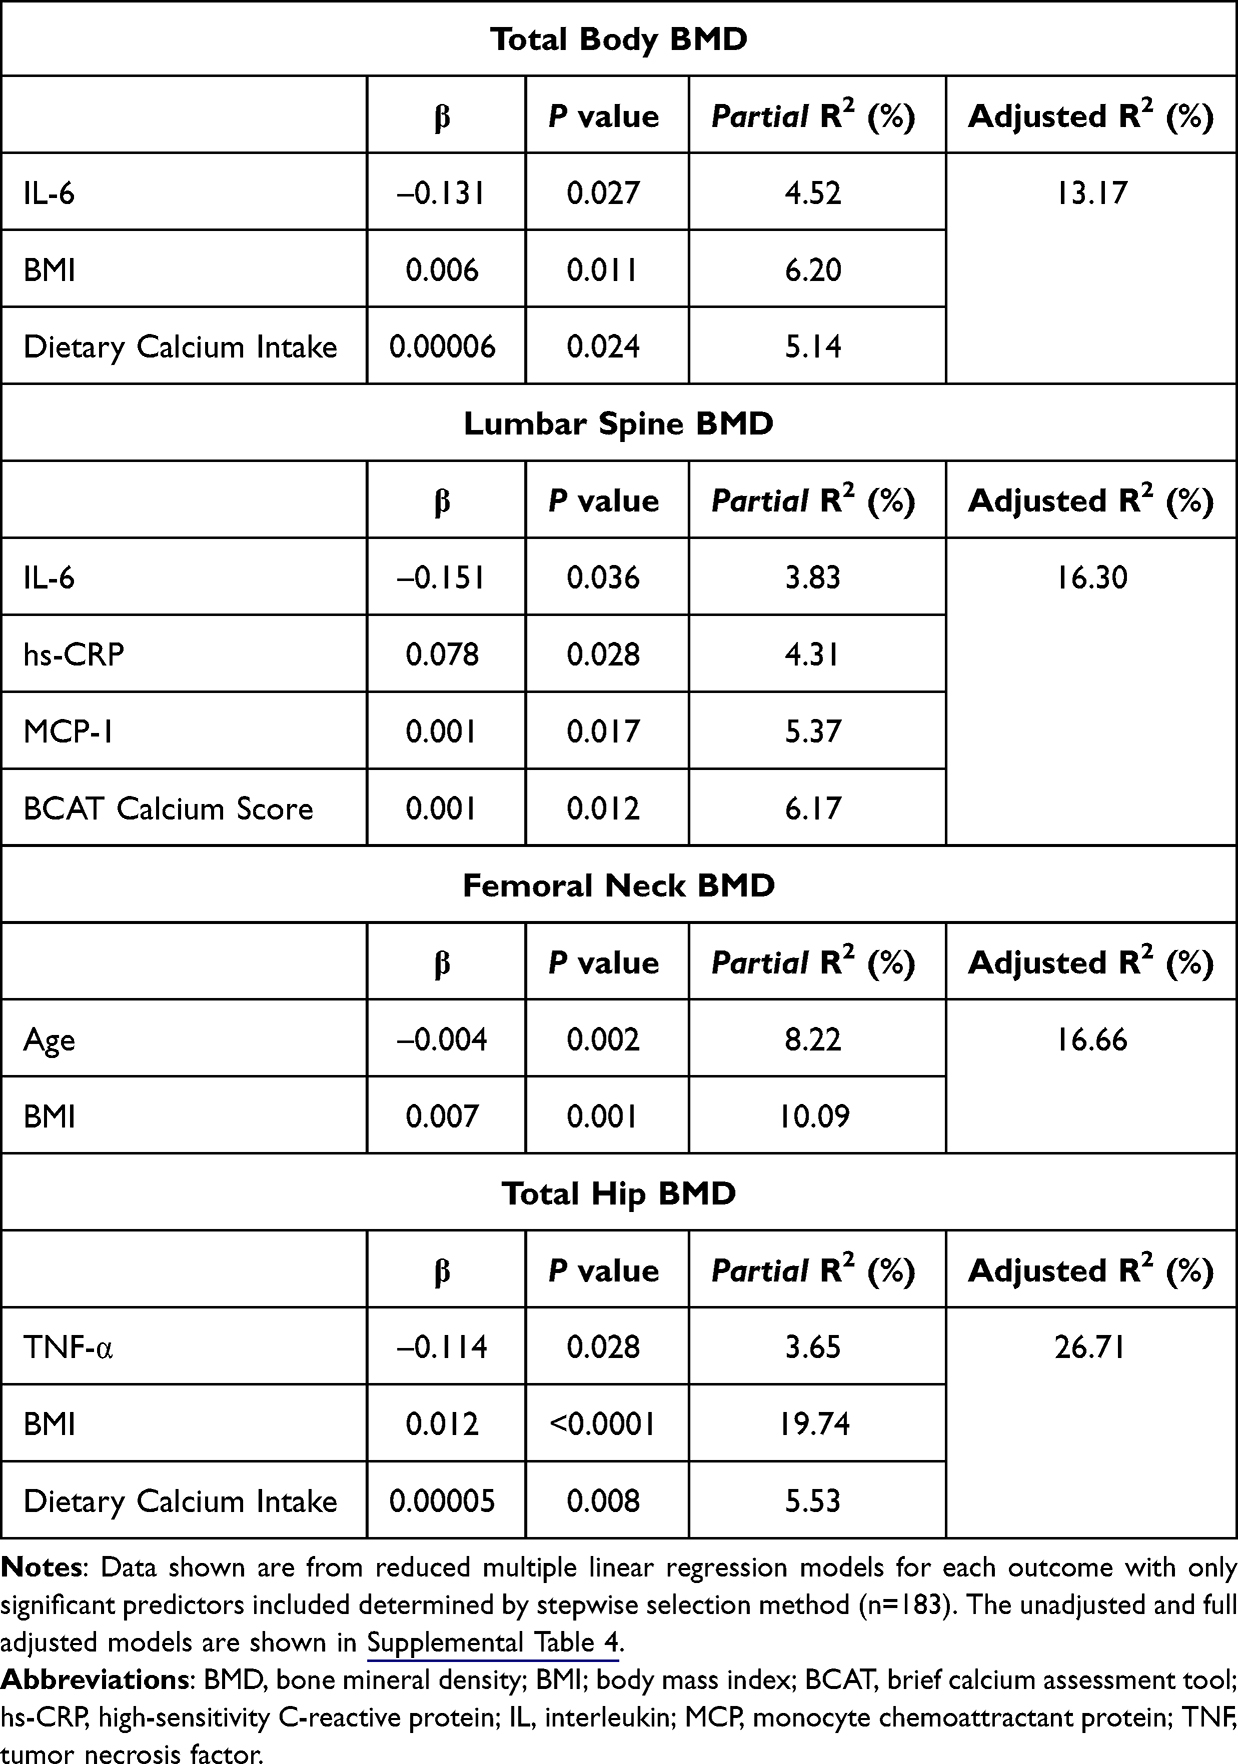 |
Table 6 Role of Inflammatory Markers in Predicting Areal BMD at Various Sites |
Discussion
In this cross-sectional study, we explored the relationship between inflammatory mediators and several measures of bone health in postmenopausal women. We demonstrate that serum hs-CRP levels negatively correlated with bone formation marker P1NP and showed a modest positive correlation with BMD at the lumbar spine and total hip. Plasma IL-6 and IL-1β negatively correlated with lumbar spine BMD in normal-weight postmenopausal women. At the lumbar spine, trabecular bone score negatively correlated with plasma IL-1β, IL-6, IL-8, and TNF-α. ln agreement with previous findings,48–50 we also demonstrate that circulating levels of hs-CRP, IL-1β, IL-6, IL-8, and TNF-α positively correlated with BMI and body fat percentage and were significantly higher in postmenopausal women with overweight/obesity. Furthermore, plasma IL-6 negatively predicted BMD at the total body and lumbar spine, whereas plasma TNF-α negatively predicted total hip BMD.
Several epidemiological studies demonstrate a positive association between markers of chronic inflammation and risk of osteoporotic fractures. In a 15-year prospective cohort study of 919 men and women aged 40–94 years,51 the risk of non-traumatic fractures was greater among subjects in the highest hs-CRP tertile group compared to the lowest hs-CRP tertile group. This association was also observed in a cohort of 444 elderly women (aged 71.2–82.3 years), wherein fracture risk increased 24–32% for each standard deviation increase in hs-CRP.52 Furthermore, older men and postmenopausal women with high levels of three or more inflammatory markers have an approximately 3-fold increased risk of fracture compared to individuals with low to moderate levels of inflammatory markers.53,54 Postmenopausal women in the highest inflammatory marker quartile have a greater risk of incident hip fractures compared to those in the lower quartiles,55 and this association is partly mediated by low BMD.56 Several cross-sectional studies demonstrate that postmenopausal women with osteopenia and/or osteoporosis have significantly higher CRP levels than women with normal BMD,57–60 while others49 report that postmenopausal women with osteoporosis have the lowest CRP levels compared to postmenopausal women with osteopenia or normal BMD, possibly because osteoporotic women have a lower body weight than women with osteopenia or normal BMD. In our study, we found that hs-CRP levels did not differ in postmenopausal women with osteoporosis, osteopenia, or normal BMD, despite women with osteoporosis having lower body mass in our study.
Pro-inflammatory cytokines including IL-1, IL-6, and TNF-α are implicated in the pathogenesis of postmenopausal bone loss.20,21 Previous observational studies investigating differences in circulating pro-inflammatory cytokines in postmenopausal women with normal BMD, osteopenia, and/or osteoporosis have yielded inconsistent results. While some studies61–64 report that postmenopausal women with osteoporosis exhibit significantly higher serum IL-1β, IL-6, IL-8, and TNF-α as well as ratios of IL-1α/IL-1 receptor agonist compared to those without osteoporosis, other studies49,65–68 demonstrate null findings. In our study, we also observed no differences in baseline concentrations of MCP-1, IL-1β, IL-6, IL-8, and TNF-α among our postmenopausal women with normal BMD, osteopenia, and osteoporosis. This may be because concentrations of pro-inflammatory cytokines in peripheral blood vary due to patient-related factors, such as BMI, circadian rhythm, dietary patterns, physical activity, and immune response to infections, as well as pre-analytical factors, including the half-life of cytokines and low blood concentrations.69,70 Postmenopausal women with low BMD71 or rheumatoid arthritis72 have significantly higher secretion of TNF-α, IL-6, IL-12, and IL-17 from mitogen-stimulated peripheral blood mononuclear cells (PBMCs) compared to their respective healthy controls. These results suggest that ex vivo cytokine profiles from mitogen-stimulated PBMCs might be more discriminatory than plasma cytokines in the context of bone loss.67,73
Inflammatory cytokines stimulate osteoclast activity and inhibit osteoblast activity;74 thus, several studies have evaluated whether biomarkers of bone turnover correlate with inflammatory markers. In postmenopausal women, CRP and P1NP are negatively correlated,49 and this association was also observed in our cohort, suggesting potentially reduced osteoblast activity concurrent with an elevated CRP. Ilesanmi-Oyelere et al49 found no correlation between CRP and CTx, when controlling for age and height in postmenopausal women. Pasco et al52 also found no significant correlation between CRP and CTx or bone-specific alkaline phosphatase in a cohort of elderly women. The lack of correlation between hs-CRP and CTx was corroborated in our study. However, we noted an inverse correlation between plasma IL-6 and plasma IGF-1, which is an important mediator of bone growth. Others have shown that plasma IL-6, IL-12p70, interferon (IFN)-α2, and IFN-γ negatively correlate with P1NP and/or CTx in age-adjusted partial correlations.49 In a cohort of 100 obese postmenopausal women with osteoporosis, serum IL-1β and TNF-α positively correlated with N-terminal telopeptide, another bone resorption marker.63 In our study, we noted no significant correlations between plasma cytokines and bone turnover markers P1NP and CTx. Discrepancies in these findings might be related to the high variability in the measurement of inflammatory and bone turnover markers or the effect of potential confounding factors such as age, sex, BMI, diet, and physical activity on their associations.75 Furthermore, a longitudinal analysis of samples might provide a more comprehensive understanding of the kinetics of these biomarkers of inflammation and bone turnover in postmenopausal women.
Evidence of associations between BMD and inflammatory mediators in postmenopausal women is inconsistent. Some studies demonstrate that high CRP levels are associated with osteoporosis risk,57,60 whereas others show that CRP was not significantly associated with BMD at various sites, after adjusting for covariates.49,76–78 We noted that hs-CRP positively correlated with BMD at the spine and hip in our entire cohort of postmenopausal women. However, this association was not statistically significant in either normal-weight or overweight/obese women. Furthermore, we observed a positive correlation between hs-CRP and BMI (Supplemental Table 2; r=0.442, p<0.0001), thus suggesting that BMI might partially mediate the relationship between hs-CRP and BMD at the spine and hip in postmenopausal women. Among cytokines, a previous study79 demonstrates that serum IL-6 is negatively correlated with BMD at the hip and forearm in 24 healthy women (aged 44–54 years). In addition, in older postmenopausal women aged 63.2 (±4.6) years, plasma IL-6 and IL-1β showed inverse correlations with BMD at the hip and spine, respectively, after controlling for age, height, and BMI.49 In our study, we observed no significant inverse correlations between plasma cytokines and BMD, which is consistent with previous findings.67 The lack of correlation between these inflammatory cytokines and BMD in our study might be partly attributed to their measurement at a single time point. BMD measurements across multiple time points provide a more relevant measure of bone loss over time, which might be more likely linked to changes in cytokine levels.28 Trabecular bone score is an indirect index of microarchitecture within the trabecular bone,80 which is rapidly lost within the first 4–8 years of menopause.81 In our entire cohort of postmenopausal women, trabecular bone score at the lumbar spine was negatively correlated with TNF-α, IL-1β, IL-6, and IL-8, suggesting a potential link between inflammation and trabecular bone loss with the onset of menopause.
In our adjusted regression analyses, hs-CRP positively predicted BMD at the lumbar spine and total hip, although the magnitude of its effect was small and was lost at the total hip after adjusting for BMI. Consistent with our finding, Sponholtz et al28 also found that CRP positively contributed to BMD at the femoral neck in postmenopausal women who received menopause hormonal therapy, which has been previously shown to be associated with elevated CRP levels.82,83 In our study, over 70% of postmenopausal women report no previous use of hormone therapy (data not shown), and therefore, it is likely that the modest positive association observed between BMD and CRP is confounded by other variables, as we noted that adjusting for BMI resulted in a non-significant effect. However, 1- to 3-year prospective studies in postmenopausal women84,85 report CRP as a significant predictor of decline in total body BMD, suggesting that the effect of systemic inflammatory markers such as CRP on bone loss over time might be better captured within a longitudinal investigation.
Among studies investigating the associations between BMD and cytokines, Gertz et al85 demonstrate that serum TNF-α positively predicted 1-year percent change in hip BMD, whereas serum IL-1β negatively predicted BMD at the same site in postmenopausal women. Although our study was cross-sectional, we noted that IL-6 and TNF-α emerged as significant negative predictors of BMD at the total body and lumbar spine and at the total hip, respectively. While Gertz et al85 enrolled healthy, normal-weight, non-osteoporotic women in their early postmenopausal years, our study population included older, overweight women in their late postmenopausal years, and a majority of women (>85%) had osteopenia/osteoporosis, which might partly explain the differences in the strength of the associations observed in our study. We also noted that BMI positively predicted BMD at all three sites (total body, femoral neck, and total hip), and TNF-α and IL-6 remained as negative predictors for BMD after adjusting for BMI, suggesting a strong inverse association between these pro-inflammatory mediators and bone outcomes when controlling for confounders. In a longitudinal study of older men and women,84 baseline levels of serum TNF-α and IL-6 predicted 3-year decline in BMD at the total body, hip, and/or lumbar spine. Furthermore, serum IL-6 significantly predicted a 3-year decline in BMD at the total hip in postmenopausal women within 10 years since menopause but not in women more than 10 years since menopause,86 suggesting that the effect of cytokines on bone loss may be more relevant throughout the first postmenopausal decade. The pleiotropic nature of cytokines may partly explain differences in their relationship to BMD in these studies, as they may exert either osteoclastogenic or anti-osteoclastogenic effects depending on their interactions within the bone microenvironment.87
Aging and menopause are associated with deterioration of trabecular and cortical bone microarchitecture, and about 80% of all osteoporotic fractures are appendicular.88–90 Although bone loss occurs more rapidly in trabecular bone than cortical bone within the first 4–8 years of menopause,81 a majority of bone loss originates in the cortical region, which comprises 80% of the adult skeleton and is an important predictor of bone strength in appendicular sites.88 Evidence on the association between circulating inflammatory markers and measures of bone strength and geometry in trabecular and cortical bone in postmenopausal women is limited. Two studies report no significant associations between CRP77 and pro-inflammatory cytokines85 with volumetric BMD at the distal tibia in healthy postmenopausal women with normal BMD. However, in a large population-based study91 of 435 overweight postmenopausal women with normal BMD, serum IL-6 and IL-1β negatively correlated with cortical cross-sectional area and cortical volumetric BMD, respectively, in the distal tibia. While these earlier findings are limited to pQCT measurements at only the distal tibia, our study included measurements at both proximal and distal sites of the tibia as well as the radius, which is another common site of osteoporotic fractures.36,92 Consistent with findings from the population-based study, we noted significant inverse correlations between pro-inflammatory cytokines and several indices of bone strength and geometry at the cortical and trabecular bone from pQCT and at the proximal femur from HSA-derived measurements, suggesting that these inflammatory mediators might impact bone strength in addition to bone density in postmenopausal women.
The link between obesity and bone is complex. The protective effect of obesity on bone is thought to be attributed to elevated mechanical loading and increased estrogen production from adipose tissue,27,93 which is also an important source of pro-inflammatory cytokines.26 We and others48,49 demonstrate that these pro-inflammatory cytokines positively correlated with BMI and body fat in postmenopausal women. In addition, compared to the normal-weight group, postmenopausal women with overweight/obesity not only exhibited higher levels of plasma proinflammatory cytokines but also showed inverse correlations between cytokines and several measures of bone quality and strength. In particular, buckling ratio, which is a predictor of incident hip fractures in postmenopausal women,34 positively correlated with plasma TNF-α, suggesting that elevated inflammation associated with obesity might have negative impacts on bone health.94 However, in normal-weight postmenopausal women, several estimates of volumetric BMD, geometry, and strength negatively correlated with IL-1β, IL-8, and IL-6. These findings suggest that BMI may mediate the associations between inflammatory markers and bone density and strength in postmenopausal women.
A major strength of our cross-sectional investigation is the assessment of the associations between inflammatory mediators and bone health across various estimates of bone strength and geometry in several sites within the hip and appendicular skeleton, in addition to bone density and bone turnover markers. Biomarkers of inflammation, including acute-phase proteins such as hs-CRP, activated monocytes and lymphocytes, cytokines, chemokines, and their derived immune–inflammatory indices are not only linked to acute95 and chronic infection96 but are also involved in the etiology of chronic disease, including cardiovascular disease, cancer, type 2 diabetes97 and related complications such as diabetic nephropathy98 and thyroiditis.99 Inflammation also contributes to chronic bone diseases, such as rheumatoid arthritis and osteoporosis.100,101 Thus, the reported inverse correlation between inflammatory markers and bone outcomes was not surprising. However, the findings reported in this study provide insight as to which bone outcomes are most influenced by specific inflammatory cytokines. Limitations of the study include the disproportionate sample sizes among the three groups according to baseline BMD status, with the least number of women in the normal BMD group, which might have reduced the statistical power to detect between-group differences. A majority of the postmenopausal women in our study were Caucasian, thereby limiting the generalizability of our findings. Another limitation includes the measurement of inflammatory markers only in the plasma and/or serum, which mostly occur in low concentrations due to their short half-lives and are subject to high inter-person and analytical variability. Thus, circulating levels of these inflammatory mediators may not reflect the local effects of inflammation within the bone microenvironment. Furthermore, while cytokines are broadly classified as “pro-inflammatory” and “anti-inflammatory” they exhibit pleiotropic effects and may possess pro-osteoclastic or anti-osteoclastic properties depending on crosstalk within the bone milieu,102 which was not captured within this study. Our findings suggest that plasma profiles of pro-inflammatory cytokines or a combination of inflammatory markers may serve as a biomarker for identifying postmenopausal women at risk for osteopenia or osteoporosis; however, additional studies are needed to confirm these findings. Finally, the cross-sectional nature of this study precludes any inferences about whether these inflammatory mediators are causally related to bone health in postmenopausal women.
Conclusion
Overall, findings from our cross-sectional analysis suggest a potential inverse association between inflammatory mediators and bone health outcomes in our population of postmenopausal women. Future research is warranted in large-scale longitudinal investigations to determine the utility of circulating markers of inflammation as potential risk factors for osteoporosis across the menopause transition, results of which might provide a rationale for studies assessing anti-inflammatory interventions to prevent bone loss and fracture risk in postmenopausal women.
Abbreviations
ANOVA, analysis of variance; BMD, bone mineral density; BMI, body mass index; CI, confidence interval; CTx, C-terminal telopeptide; CV, coefficient of variation; DXA, dual-energy X-ray absorptiometry; EDTA, ethylenediamine tetra acetic acid; FRAX, fracture risk assessment tool; HSA, hip structural analysis; hs-CRP, high-sensitivity C-reactive protein; IFN, interferon; IGF, insulin-like growth factor; IL, interleukin; MCP, monocyte chemoattractant protein; P1NP, type I N-terminal propeptide; PBMCs, peripheral blood mononuclear cells; pQCT, peripheral quantitative computed tomography; RCT, randomized controlled trial; SD, standard deviation; TNF, tumor necrosis factor; WHO, World Health Organization; 25(OH)D3, 25-hydroxyvitamin D3.
Data Sharing Statement
Data reported in this study will be made available upon request from the corresponding author.
Ethics Approval and Informed Consent
All study protocols and informed consent were approved by The Institutional Review Board of The Pennsylvania State University (University Park, PA, USA; STUDY00004252). After providing a detailed description of the study's purpose and procedures, written informed consent was obtained from all study participants. The study was performed in accordance with the Declaration of Helsinki.
Acknowledgments
The authors would like to thank The California Prune Board for providing funding for this work, and the study participants. We thank the clinical research staff at The Women’s Health and Exercise Lab (PSU). We thank the Biomarker Core Laboratory in the Department of Biobehavioral Health (PSU) for the use of the MesoScale Discovery platform to obtain biological assay data. We thank Dr. Christina L. Wissinger, the health sciences librarian at PSU, for providing guidance on building the search strategy for the review of relevant literature for this work.
Author Contributions
All authors have made a significant contribution to the work reported, including study conception; design; execution; data acquisition, analysis, and interpretation; or in all areas; participated in drafting, revising, and providing a critical review of the manuscript; have read and approved the final version of the manuscript; have agreed on the journal to which the manuscript has been submitted; and agreed to take responsibility and be accountable for the contents of the manuscript.
Funding
This work was funded by the California Prune Board (Award Number: 180215) awarded to M.J.D. and C.J.R. In addition, this work was funded by the National Center for Advancing Translational Sciences of the National Institutes of Health under Award Number TL1TR002016 to J.J.D. The content is solely the responsibility of the authors and does not necessarily represent the official views of the NIH. The funding agencies had no role in the study conceptualization, design, data collection, analysis, writing, decision to publish, or preparation and submission of the manuscript.
Disclosure
The authors report no conflicts of interest in this work.
References
1. Kanis JA, Melton LJ, Christiansen C, Johnston CC, Khaltaev N. The diagnosis of osteoporosis. J Bone Miner Res. 2009;9(8):1137–1141. doi:10.1002/jbmr.5650090802
2. NIH Consensus Development Panel on Osteoporosis Prevention, Diagnosis, and Therapy. Osteoporosis prevention, diagnosis, and therapy. JAMA. 2001;285(6):785–795.
3. Compston JE, McClung MR, Leslie WD. Osteoporosis. Lancet. 2019;393(10169):364–376.
4. Johnell O, Kanis JA. An estimate of the worldwide prevalence and disability associated with osteoporotic fractures. Osteoporos Int. 2006;17(12):1726–1733.
5. Kanis JA. Assessment of fracture risk and its application to screening for postmenopausal osteoporosis: synopsis of a WHO report. WHO Study Group. Osteoporos Int. 1994;4(6):368–381.
6. Xiao PL, Cui AY, Hsu CJ, et al. Global, regional prevalence, and risk factors of osteoporosis according to the World Health Organization diagnostic criteria: a systematic review and meta-analysis. Osteoporos Int. 2022;33(10):2137–2153.
7. Sarafrazi N, Wambogo EA, Shepherd JA. Osteoporosis or low bone mass in older adults: United States, 2017–2018. NCHS Data Brief. 2021;405:1–8.
8. Burge R, Dawson-Hughes B, Solomon DH, Wong JB, King A, Tosteson A. Incidence and economic burden of osteoporosis-related fractures in the United States, 2005–2025. J Bone Miner Res. 2007;22(3):465–475.
9. Wright NC, Looker AC, Saag KG, et al. The recent prevalence of osteoporosis and low bone mass in the United States based on bone mineral density at the femoral neck or lumbar spine. J Bone Miner Res. 2014;29(11):2520–2526.
10. Singer A, Exuzides A, Spangler L, et al. Burden of illness for osteoporotic fractures compared with other serious diseases among postmenopausal women in the United States. Mayo Clin Proc. 2015;90(1):53–62. doi:10.1016/j.mayocp.2014.09.011
11. Cauley JA, Thompson DE, Ensrud KC, Scott JC, Black D. Risk of mortality following clinical fractures. Osteoporos Int. 2000;11(7):556–561.
12. Johnell O, Kanis JA, Odén A, et al. Mortality after osteoporotic fractures. Osteoporos Int. 2004;15(1):38–42.
13. Brauer CA, Coca-Perraillon M, Cutler DM, Rosen AB. Incidence and mortality of Hip fractures in the United States. JAMA. 2009;302(14):1573–1579.
14. Lorentzon M, Johansson H, Harvey NC, et al. Osteoporosis and fractures in women: the burden of disease. Climacteric. 2022;25(1):4–10.
15. Office of the Surgeon General (US). Bone Health and Osteoporosis: A Report of the Surgeon General. Rockville (MD): Office of the Surgeon General (US); 2004.
16. Blake J, Cosman FA, Lewiecki EM, et al. Management of osteoporosis in postmenopausal women: the 2021 position statement of The North American Menopause Society. Menopause. 2021;28(9):973–997.
17. Hannan MT, Felson DT, Dawson-Hughes B, et al. Risk factors for longitudinal bone loss in elderly men and women: the Framingham Osteoporosis Study. J Bone Miner Res. 2010;15(4):710–720.
18. Khosla S, Oursler MJ, Monroe DG. Estrogen and the skeleton. Trends Endocrinol Metab. 2012;23(11):576–581.
19. Manolagas SC, Jilka RL. Bone marrow, cytokines, and bone remodeling. Emerging insights into the pathophysiology of osteoporosis. N Engl J Med. 1995;332(5):305–311.
20. Pfeilschifter J. Role of cytokines in postmenopausal bone loss. Curr Osteoporos Rep. 2003;1(2):53–58.
21. Pacifici R. Estrogen, cytokines, and pathogenesis of postmenopausal osteoporosis. J Bone Miner Res. 1996;11(8):1043–1051.
22. Ginaldi L, Di Benedetto MC, De Martinis M. Osteoporosis, inflammation and ageing. Immun Ageing. 2005;2(1):14.
23. Mundy GR. Osteoporosis and inflammation. Nutr Rev. 2007;65(12 Pt 2):S147–S151.
24. Franceschi C, Campisi J. Chronic inflammation (inflammaging) and its potential contribution to age-associated diseases. J Gerontol a Biol Sci Med Sci. 2014;69(Suppl 1):S4–S9.
25. Rea IM, Gibson DS, McGilligan V, McNerlan SE, Alexander HD, Ross OA. Age and age-related diseases: role of inflammation triggers and cytokines. Front Immunol. 2018;9:586.
26. Gregor MF, Hotamisligil GS. Inflammatory mechanisms in obesity. Annu Rev Immunol. 2011;29(1):415–445.
27. Cao JJ. Effects of obesity on bone metabolism. J Orthop Surg Res. 2011;6(1):30.
28. Sponholtz TR, Zhang X, Fontes JD, et al. Association between inflammatory biomarkers and bone mineral density in a community-based cohort of men and women. Arthritis Care Res. 2014;66(8):1233–1240.
29. Ishii S, Cauley JA, Greendale GA, et al. C-reactive protein, bone strength, and nine-year fracture risk: data from the Study of Women’s Health Across the Nation (SWAN). J Bone Miner Res. 2013;28(7):1688–1698.
30. Greendale GA, Jackson NJ, Han W, et al.. Increase in C-reactive protein predicts increase in rate of bone mineral density loss: the study of women’s health across the nation. JBMR Plus. 2021;5(4):e10480.
31. Jackson RD, Donepudi S, Mysiw WJ. Epidemiology of fracture risk in the Women’s Health Initiative. Curr Osteoporos Rep. 2008;6(4):155–161.
32. Bailey RL, Sahni S, Chocano-Bedoya P, et al. Best practices for conducting observational research to assess the relation between nutrition and bone: an International Working Group Summary. Adv Nutr. 2019;10(3):391–409.
33. Varela A, Jolette J. Bone Toolbox: biomarkers, Imaging Tools, Biomechanics, and Histomorphometry. Toxicol Pathol. 2018;46(5):511–529.
34. Lacroix AZ, Beck TJ, Cauley JA, et al. Hip structural geometry and incidence of Hip fracture in postmenopausal women: what does it add to conventional bone mineral density? Osteoporos Int. 2010;21(6):919–929.
35. Cheung AM, Frame H, Ho M, Mackinnon ES, Brown JP. Bone strength and management of postmenopausal fracture risk with antiresorptive therapies: considerations for women’s health practice. Int J Womens Health. 2016;8:537–547.
36. Chen H, Zhou X, Fujita H, Onozuka M, Kubo KY. Age-related changes in trabecular and cortical bone microstructure. Int J Endocrinol. 2013;213234:1–9.
37. De Souza MJ, Strock NCA, Rogers CJ, et al. Rationale and study design of randomized controlled trial of dietary supplementation with prune (dried plums) on bone density, geometry, and estimated bone strength in postmenopausal women: the Prune study. Contemp Clin Trials Commun. 2022;28:100941.
38. De Souza MJ, Strock NCA, Williams NI, et al. Prunes preserve Hip bone mineral density in a 12-month randomized controlled trial in postmenopausal women: the Prune Study. Am J Clin Nutr. 2022;116(4):897–910.
39. Centers for Disease Control and Prevention (CDC). National Health and Nutrition Examination Survey (NHANES) 2017–2018 Procedure Manuals, National Center for Health Statistics. Rockville (MD): Department of Health and Human Services; 2017.
40. Yang YJ, Martin BR, Boushey CJ. Development and evaluation of a brief calcium assessment tool for adolescents. J Am Diet Assoc. 2010;110(1):111–115.
41. Kanis JA, McCloskey EV, Johansson H, Oden A, Ström O, Borgström F. Development and use of FRAX in osteoporosis. Osteoporos Int. 2010;21:407–413.
42. McCloskey EV, Oden A, Harvey NC, et al. A meta-analysis of trabecular bone score in fracture risk prediction and its relationship to FRAX. J Bone Miner Res. 2016;31(5):940–948.
43. Yoshikawa T, Turner CH, Peacock M, et al. Geometric structure of the femoral neck measured using dual-energy x-ray absorptiometry. J Bone Miner Res. 1994;9(7):1053–1064.
44. Beck TJ, Ruff CB, Warden KE, Scott WW, Rao GU. Predicting femoral neck strength from bone mineral data. A structural approach. Invest Radiol. 1990;25(1):6–18.
45. Morin S, Tsang JF, Leslie WD. Weight and body mass index predict bone mineral density and fractures in women aged 40 to 59 years. Osteoporos Int. 2009;20(3):363–370.
46. Gallagher JC. Effect of early menopause on bone mineral density and fractures. Menopause. 2007;14(3 Pt 2):567–571.
47. Harlow SD, Gass M, Hall JE, et al. Executive summary of the Stages of Reproductive Aging Workshop +10: addressing the unfinished agenda of staging reproductive aging. Climacteric. 2012;15(2):105–114.
48. Perry CD, Alekel DL, Ritland LM, et al. Centrally located body fat is related to inflammatory markers in healthy postmenopausal women. Menopause. 2008;15(4 Pt 1):619–627.
49. Ilesanmi-Oyelere BL, Schollum L, Kuhn-Sherlock B, et al. Inflammatory markers and bone health in postmenopausal women: a cross-sectional overview. Immun Ageing. 2019;16(1):15.
50. Cohen E, Margalit I, Shochat T, Goldberg E, Krause I. Markers of chronic inflammation in overweight and obese individuals and the role of gender: a cross-sectional study of a large cohort. J Inflamm Res. 2021;14:567–573.
51. Schett G, Kiechl S, Weger S, et al. High-sensitivity C-reactive protein and risk of nontraumatic fractures in the Bruneck study. Arch Intern Med. 2006;166(22):2495–2501.
52. Pasco JA, Kotowicz MA, Henry MJ, et al. High-sensitivity C-reactive protein and fracture risk in elderly women. JAMA. 2006;296(11):1353–1355.
53. Cauley JA, Danielson ME, Boudreau RM, et al. Inflammatory markers and incident fracture risk in older men and women: the health aging and Body Composition Study. J Bone Miner Res. 2007;22(7):1088–1095.
54. Cauley JA, Barbour KE, Harrison SL, et al. Inflammatory markers and the risk of hip and vertebral fractures in men: the Osteoporotic Fractures in Men (MrOS). J Bone Miner Res. 2016;31(12):2129–2138.
55. Barbour KE, Boudreau R, Danielson ME, et al. Inflammatory markers and the risk of Hip fracture: the Women’s Health Initiative. J Bone Miner Res. 2012;27(5):1167–1176.
56. Barbour KE, Lui LY, Ensrud KE, et al. Inflammatory markers and risk of Hip fracture in older white women: the study of osteoporotic fractures. J Bone Miner Res. 2014;29(9):2057–2064.
57. Koh JM, Khang YH, Jung CH, et al. Higher circulating hsCRP levels are associated with lower bone mineral density in healthy pre- and postmenopausal women: evidence for a link between systemic inflammation and osteoporosis. Osteoporos Int. 2005;16(10):1263–1271.
58. Lee Y, Kim M, Choi K, et al. Relationship between inflammation biomarkers, antioxidant vitamins, and bone mineral density in patients with metabolic syndrome. Nutr Res Pract. 2011;5(2):150–156.
59. De Martinis M, Sirufo MM, Nocelli C, Fontanella L, Ginaldi L. Hyperhomocysteinemia is associated with inflammation, bone resorption, vitamin B12 and folate deficiency and MTHFR C677T polymorphism in postmenopausal women with decreased bone mineral density. Int J Environ Res Public Health. 2020;17(12):4260.
60. Khinda R, Valecha S, Kumar N, et al. Prevalence and predictors of osteoporosis and osteopenia in postmenopausal women of Punjab, India. Int J Environ Res Public Health. 2022;19(5):2999.
61. Khosla S, Peterson JM, Egan K, Jones JD, Riggs BL. Circulating cytokine levels in osteoporotic and normal women. J Clin Endocrinol Metab. 1994;79(3):707–711.
62. Al-Daghri NM, Yakout S, Al-Shehri E, Al-Fawaz H, Aljohani N, Al-Saleh Y. Inflammatory and bone turnover markers in relation to PTH and vitamin D status among Saudi postmenopausal women with and without osteoporosis. Int J Clin Exp Med. 2014;7(9):2812–2819.
63. Al-Daghri NM, Aziz I, Yakout S, et al. Inflammation as a contributing factor among postmenopausal Saudi women with osteoporosis. Medicine. 2017;96(4):e5780.
64. Murad R, Shezad Z, Ahmed S, Ashraf M, Qadir M, Rehman R. Serum tumour necrosis factor alpha in osteopenic and osteoporotic postmenopausal females: a cross-sectional study in Pakistan. J Pak Med Assoc. 2018;68(3):428–431.
65. Gunn CA, Weber JL, Kruger MC. Diet, weight, cytokines and bone health in postmenopausal women. J Nutr Health Aging. 2014;18(5):479–486.
66. Cervellati C, Bonaccorsi G, Bergamini CM, et al. Association between circulatory levels of adipokines and bone mineral density in postmenopausal women. Menopause. 2016;23(9):984–992.
67. Azizieh FY, Shehab D, Al Jarallah K, Mojiminiyi O, Gupta R, Raghupathy R. Circulatory pattern of cytokines, adipokines and bone markers in postmenopausal women with low BMD. J Inflamm Res. 2019;12:99–108.
68. Zhang Y, Huang X, Sun K, et al. The potential role of serum IGF-1 and leptin as biomarkers: towards screening for and diagnosing postmenopausal osteoporosis. J Inflamm Res. 2022;15:533–543.
69. Tworoger SS, Hankinson SE. Collection, processing, and storage of biological samples in epidemiologic studies: sex hormones, carotenoids, inflammatory markers, and proteomics as examples. Cancer Epidemiol Biomarkers Prev. 2006;15(9):1578–1581.
70. Burska A, Boissinot M, Ponchel F. Cytokines as biomarkers in rheumatoid arthritis. Mediators Inflamm. 2014;545493:1–24.
71. Azizieh F, Raghupathy R, Shehab D, Al-Jarallah K, Gupta R. Cytokine profiles in osteoporosis suggest a proresorptive bias. Menopause. 2017;24(9):1057–1064.
72. Azizieh FY, Al Jarallah K, Shehab D, Gupta R, Dingle K, Raghupathy R. Patterns of circulatory and peripheral blood mononuclear cytokines in rheumatoid arthritis. Rheumatol Int. 2017;37(10):1727–1734.
73. Dingle K, Azizieh F. Multivariate comparison of cytokine profiles for normal- and low-bone-density subjects. Diagnostics. 2019;9(4):134.
74. Pietschmann P, Mechtcheriakova D, Meshcheryakova A, Föger-Samwald U, Ellinger I. Immunology of osteoporosis: a mini-review. Gerontology. 2016;62(2):128–137.
75. Hlaing TT, Compston JE. Biochemical markers of bone turnover - uses and limitations. Ann Clin Biochem. 2014;51(Pt 2):189–202.
76. Ganesan K, Teklehaimanot S, Tran TH, Asuncion M, Norris K. Relationship of C-reactive protein and bone mineral density in community-dwelling elderly females. J Natl Med Assoc. 2005;97(3):329–333.
77. Bhupathiraju SN, Alekel DL, Stewart JW, et al. Relationship of circulating total homocysteine and C-reactive protein to trabecular bone in postmenopausal women. J Clin Densitom. 2007;10(4):395–403.
78. Nabipour I, Larijani B, Vahdat K, et al. Relationships among serum receptor of nuclear factor-kappaB ligand, osteoprotegerin, high-sensitivity C-reactive protein, and bone mineral density in postmenopausal women: osteoimmunity versus osteoinflammatory. Menopause. 2009;16(5):950–955.
79. Papadopoulos NG, Georganas K, Skoutellas V, Konstantellos E, Lyritis GP. Correlation of interleukin-6 serum levels with bone density in postmenopausal women. Clin Rheumatol. 1997;16(2):162–165.
80. Silva BC, Leslie WD, Resch H, et al. Trabecular bone score: a noninvasive analytical method based upon the DXA image. J Bone Miner Res. 2014;29(3):518–530.
81. Khosla S, Pacifici R. Estrogen deficiency, postmenopausal osteoporosis, and age-related bone loss. In: Marcus R, Feldman D, David WD, editors. Osteoporosis.
82. Ridker PM, Hennekens CH, Rifai N, Buring JE, Manson JE. Hormone replacement therapy and increased plasma concentration of C-reactive protein. Circulation. 1999;100(7):713–716.
83. Pradhan AD, Manson JE, Rossouw JE, et al. Inflammatory biomarkers, hormone replacement therapy, and incident coronary heart disease: prospective analysis from the Women’s Health Initiative observational study. JAMA. 2002;288(8):980–987.
84. Ding C, Parameswaran V, Udayan R, Burgess J, Jones G. Circulating levels of inflammatory markers predict change in bone mineral density and resorption in older adults: a longitudinal study. J Clin Endocrinol Metab. 2008;93(5):1952–1958.
85. Gertz ER, Silverman NE, Wise KS, et al. Contribution of serum inflammatory markers to changes in bone mineral content and density in postmenopausal women: a 1-year investigation. J Clin Densitom. 2010;13(3):277–282.
86. Scheidt-Nave C, Bismar H, Leidig-Bruckner G, et al. Serum interleukin 6 is a major predictor of bone loss in women specific to the first decade past menopause. J Clin Endocrinol Metab. 2001;86(5):2032–2042.
87. Zupan J, Komadina R, Marc J. The relationship between osteoclastogenic and anti-osteoclastogenic pro-inflammatory cytokines differs in human osteoporotic and osteoarthritic bone tissues. J Biomed Sci. 2012;19(1):28.
88. Seeman E. Age- and menopause-related bone loss compromise cortical and trabecular microstructure. J Gerontol a Biol Sci Med Sci. 2013;68(10):1218–1225.
89. Bjørnerem Å, Wang X, Bui M, et al. Menopause-related appendicular bone loss is mainly cortical and results in increased cortical porosity. J Bone Miner Res. 2018;33(4):598–605.
90. Chapurlat R, Bui M, Sornay‐Rendu E, et al. Deterioration of cortical and trabecular microstructure identifies women with osteopenia or normal bone mineral density at imminent and long‐term risk for fragility fracture: a prospective study. J Bone Miner Res. 2020;35(5):833–844.
91. Lauretani F, Bandinelli S, Russo CR, et al. Correlates of bone quality in older persons. Bone. 2006;39(4):915–921.
92. Zhu TY, Griffith JF, Qin L, et al. Alterations of bone density, microstructure, and strength of the distal radius in male patients with rheumatoid arthritis: a case-control study with HR-pQCT. J Bone Miner Res. 2014;29(9):2118–2129.
93. Hou JHC, He W, Yang M, Luo X, Li C. Obesity and bone health: a complex link. Front Cell Dev Biol. 2020;8:600181.
94. Fassio A, Idolazzi L, Rossini M, et al. The obesity paradox and osteoporosis. Eat Weight Disord. 2018;23(3):293–302.
95. Demirkol ME, Bilgin S, Kahveci G, et al. C-reactive protein-to-lymphocyte ratio is a reliable marker in patients with COVID-19 infection: the CLEAR COVID study. Cir Cir. 2022;90(5):596–601.
96. Demirkol ME, Aktas G, Bilgin S, et al. C-reactive protein to lymphocyte count ratio is a promising novel marker in hepatitis C infection: the clear hep-c study. Rev Assoc Med Bras. 2022;68(6):838–841.
97. Furman D, Campisi J, Verdin E, et al. Chronic inflammation in the etiology of disease across the life span. Nat Med. 2019;25(12):1822–1832.
98. Bilgin S, Kurtkulagi O, Atak Tel BM, et al. Does C-reactive protein to serum Albumin Ratio correlate with diabEtic nephropathy in patients with Type 2 dIabetes MEllitus? The CARE TIME study. Prim Care Diabetes. 2021;15(6):1071–1074.
99. Demirkol ME, Aktas G. C‐reactive protein to LymphocytE count ratio could be a reliable mArkeR of thyroiditis; the CLEAR‐T study. Precis Med Sci. 2022;11:31–34.
100. Weitzmann MN. Estrogen deficiency and bone loss: an inflammatory tale. J Clin Invest. 2006;116(5):1186–1194. doi:10.1172/JCI28550
101. Wu D, Cline-Smith A, Shashkova E, Perla A, Katyal A, Aurora R. T-cell mediated inflammation in postmenopausal osteoporosis. Front Immunol. 2021;12:687551.
102. Zupan J, Jeras M, Marc J. Osteoimmunology and the influence of pro-inflammatory cytokines on osteoclasts. Biochem Med. 2013;23(1):43–63.
 © 2023 The Author(s). This work is published and licensed by Dove Medical Press Limited. The
full terms of this license are available at https://www.dovepress.com/terms
and incorporate the Creative Commons Attribution
- Non Commercial (unported, 3.0) License.
By accessing the work you hereby accept the Terms. Non-commercial uses of the work are permitted
without any further permission from Dove Medical Press Limited, provided the work is properly
attributed. For permission for commercial use of this work, please see paragraphs 4.2 and 5 of our Terms.
© 2023 The Author(s). This work is published and licensed by Dove Medical Press Limited. The
full terms of this license are available at https://www.dovepress.com/terms
and incorporate the Creative Commons Attribution
- Non Commercial (unported, 3.0) License.
By accessing the work you hereby accept the Terms. Non-commercial uses of the work are permitted
without any further permission from Dove Medical Press Limited, provided the work is properly
attributed. For permission for commercial use of this work, please see paragraphs 4.2 and 5 of our Terms.
Recommended articles
Systemic Inflammation Markers Associated with Bone Mineral Density in perimenopausal and Postmenopausal Women
Chen Y, Yu J, Shi L, Han S, Chen J, Sheng Z, Deng M, Jin X, Zhang Z
Journal of Inflammation Research 2023, 16:297-309
Published Date: 22 January 2023
Construction and Validation of a Novel Nomogram Predicting Recurrence in Alpha-Fetoprotein-Negative Hepatocellular Carcinoma Post-Surgery Using an Innovative Liver Function-Nutrition-Inflammation-Immune (LFNII) Score: A Bicentric Investigation
Zhang BL, Liu J, Diao G, Chang J, Xue J, Huang Z, Zhao H, Yu L, Cai J
Journal of Hepatocellular Carcinoma 2024, 11:489-508
Published Date: 6 March 2024
Osteoclast Activation and Inflammatory Bone Diseases: Focusing on Receptors in Osteoclasts
Zhao W, Li J, Su T, Wang C, Fu Y, Li C, Hua P, Liang X, Zhu Y, Cui H
Journal of Inflammation Research 2025, 18:3201-3213
Published Date: 4 March 2025
Fracture-Induced Immunological Cascades Trigger Rapid Systemic Bone Loss via Osteocyte-Regulated Osteoclastogenesis
Sun L, Kuang S, Li Y, Wang G, Sun J, Zhou F, Zhang C
ImmunoTargets and Therapy 2025, 14:849-875
Published Date: 21 August 2025
Regulatory Mechanism and Drug Therapy of NLRP3 Inflammasome in Recurrent Pregnancy Loss: Research Status and Prospect
Cui Y, Yang Y, Li Y, Zhang Y, Niu D, Feng X
Journal of Inflammation Research 2025, 18:12279-12294
Published Date: 6 September 2025