Back to Journals » Journal of Hepatocellular Carcinoma » Volume 10
An Analysis Regarding the Association Between Proteasome (PSM) and Hepatocellular Carcinoma (HCC)
Authors Huang W, Mei J, Liu YJ ![]() , Li JP
, Li JP ![]() , Zou X, Qian XP
, Zou X, Qian XP ![]() , Zhang Y
, Zhang Y
Received 25 January 2023
Accepted for publication 27 March 2023
Published 30 March 2023 Volume 2023:10 Pages 497—515
DOI https://doi.org/10.2147/JHC.S404396
Checked for plagiarism Yes
Review by Single anonymous peer review
Peer reviewer comments 2
Editor who approved publication: Dr Mohamed Shaker
Wei Huang,1,2,* Jia Mei,3,* Yuan-Jie Liu,1,4 Jie-Pin Li,1,4,5 Xi Zou,1,6 Xiao-Ping Qian,2,7 Yu Zhang8
1Department of Oncology, Affiliated Hospital of Nanjing University of Chinese Medicine, Jiangsu Province Hospital of Chinese Medicine, Nanjing, Jiangsu, 210029, People’s Republic of China; 2Comprehensive Cancer Center, Nanjing Drum Tower Hospital Clinical College of Traditional Chinese and Western Medicine, Nanjing University of Chinese Medicine, Nanjing, Jiangsu, 210008, People’s Republic of China; 3Department of Pathology, Nanjing Jinling Hospital, Nanjing, Jiangsu, 210001, People’s Republic of China; 4No. 1 Clinical Medical College, Nanjing University of Chinese Medicine, Nanjing, Jiangsu, 210023, People’s Republic of China; 5Zhangjiagang TCM Hospital Affiliated to Nanjing University of Chinese Medicine, Zhangjiagang, Jiangsu, 215600, People’s Republic of China; 6Jiangsu Collaborative Innovation Center of Traditional Chinese Medicine in Prevention and Treatment of Tumor, Nanjing, 210023, People’s Republic of China; 7The Comprehensive Cancer Center of Nanjing Drum Tower Hospital, Medical School of Nanjing University, Clinical Cancer Institute of Nanjing University, Nanjing, Jiangsu, 210008, People’s Republic of China; 8Department of Oncology, Nanjing Jinling Hospital, Nanjing, Jiangsu, 210001, People’s Republic of China
*These authors contributed equally to this work
Correspondence: Yu Zhang; Xiao-ping Qian, Email [email protected]; [email protected]
Background: The Proteasome (PSM) is a large multi-catalytic protease complex consisting of a 20S core particle and a 19S regulatory particle whose main function is to accept and degrade ubiquitinated substrates, are now considered as one of the potential regulators of tumor proliferation, and stemness maintenance. However, to date, studies on the relationship between PSM and hepatocellular carcinoma (HCC) are limited.
Methods: This study used a bioinformatics approach combining validation experiments to investigate the biological mechanisms that may be related with PSM. A series of experiments in vivo and in vitro were performed to explore the function of the 26S proteasome non-ATPase regulatory subunit 13 (PSMD13) in HCC.
Results: HCC patients can be divided into two clusters. Cluster 1 (C1) patients having a significantly worse prognosis than Cluster (C2). Two subtypes had significant differences in proliferation-related signaling. In particular, the frequency of TP53 mutation was significantly higher in C1 than in C2. In addition, PSM-associated genes were highly consistent with the expression of DNA repair-related signatures, suggesting a potential link between PSM and genomic instability. We also found that downregulation of PSMD13 expression significantly inhibited stemness of tumor cells and impaired the Epithelial mesenchymal transition (EMT) process. Finally, the correlation between the PSMD13 and Ki67 was found to be strong.
Conclusion: PSM is a valid predictor of prognosis and therapeutic response in patients with HCC disease. Furthermore, PSMD13 may be a potential therapeutic target.
Keywords: hepatocellular carcinoma, proteasome, PSMD13, cell stemness, proliferation
Introduction
As a common malignant tumor of liver, the incidence of hepatocellular carcinoma (HCC) is sixth highest and the mortality rate is second highest worldwide.1,2 The standard of care in HCC treatment is radical surgery, but most patients miss out on surgery by the time they are diagnosed and are treated with nonsurgical locoregional interventions instead.3 As knowledge of tumorigenesis has improved, particularly the composition of the tumor microenvironment (TME), more curative treatments have been developed than ever before, including molecule targeted therapy and immunotherapy.4–7 Although more advanced therapies offer more options for HCC patients, the overall prognosis for HCC remains poor, with a 5-year survival rate of less than 20%, due to its dreadfully invasiveness and frequent recurrence.8 A large number of studies have shown that even patients with similar clinical characteristics respond very differently to the same treatment strategy, a phenomenon that is now thought to be explained by the heterogeneity of TME.9 With the development of molecular biology, clinical classification systems based on clinicopathology have shown great limitations,10,11 an important reason being that such classification methods tend to ignore the molecular characteristics of the patients.12 Therefore, the development of refined, micro-level molecular classification methods based on existing clinical stratification strategies is of great significance for optimising clinical decision-making, which is also in line with the trend towards precision medicine.13–15
Proteins in the organism are in a dynamic steady state of synthesis and degradation, they are hydrolysed into a variety of essential amino acids and replaced by new proteins through de novo synthesis.16 Importantly, most cytoplasmic proteins are not degraded in the lysosome, but are degraded in the cytoplasm dependent on the ubiquitin-proteasome system, which is independent of the lysosome. Specifically, the 26S proteasome accepts post-translationally modified proteins from the ubiquitin chain and tags them for destruction.17 Thus, in physiological situations, the Ubiquitin Proteasome System (UPS) system is an important mechanism responsible for intracellular proteolysis and turn off, covering aspects including antigen processing, biological signal transduction and more.18 In certain pathological conditions, particularly in diseases such as cancer, the UPS system is hijacked to provide catabolic mechanisms compatible with this demand due to the extreme proliferative demands of tumor cells.19 On the one hand, as tumor cells divide disorderly, proteins are destroyed and produced at an alarming rate; on the other hand, tumor cells have higher levels of PSM compared to their normal counterparts because they are under high levels of oxidative stress at all times.20
The development of drugs targeting PSM appears to be a promising strategy for cancer treatment.21 In fact, a number of drugs that directly target the 26S proteasome have been approved for clinical practice, the most prestigious of which is bortezomib (BTZ), which is routinely used in the treatment of multiple myeloma (MM).22,23 Since the success of Bortezomib (BTZ) in treating MM, its use has expanded to treat other forms of cancer including lymphocytoma, colorectal cancer, and thyroid cancer, further strengthening the evidence that targeted PSM is an effective strategy in the fight against cancer.24,25 However, frustratingly, apart from toxicities that severely affect patients’ quality of life (eg cardiotoxicity and neurotoxicity), the greatest hurdle facing all PSM inhibitors, including BTZ, stems from their poor efficacy in solid tumors.26,27 Therefore, there is a need to find inhibitors that can target solid tumors, have satisfactory bioavailability and can be combined with current first-line treatment options.
As part of this study, we analyzed 45 molecules that make up the PSM for gene expression heterogeneity in 32 cancer types. These results indicated that genome changes, including DNA methylation and copy number variation, were important factors that affect PSM molecular expression. We focused on the stratification significance of PSM activity in HCC patients and correlated PSM with proliferative features of tumors and genomic instability. Our study revealed a potential link between PSM activity and TP53 mutations, and that high levels of PSMD13 contributed to the maintenance of stemness in tumor cells as well as facilitating their EMT process. We demonstrated that PSM activity was a reliable prognostic indicator for HCC and that PSMD13 was a promising therapeutic target.
Materials and Methods
All the experimental methods, inclusion/exclusion criteria for participants and other details are listed in the Supplementary Method. The supplementary material enlists all the antibodies and reagents used in this investigation (Supplementary Material: Table S1).
Public Data Source and Corresponding Processing
A total of four public datasets were included in this study: TCGA-LIHC (n = 374),28 International Cancer Genome Consortium (ICGC)-LIRI-JP (n = 240)(https://dcc.icgc.org/), GSE57871 (n = 30),29 and GSE166635 (n = 2).30 For second-generation sequencing data, we applied the log2(transcripts per million (TPM) + 1) transformation to all expression data for normalisation and pre-processing purposes. A portion of the TCGA data is done through the Gene Set Cancer Analysis (GSCA)-Lite website (http://bioinfo.life.hust.edu.cn/web/GSCALite/). GSE57871 is managed using GPSAdb, a user-friendly web tool for the processing of genetic perturbation RNA-seq datasets. Finally, we used the single-cell dataset GSE166635 to characterize the expression heterogeneity of PSM-associated genes based on Tumor immune single-cell hub (TISCH) (http://tisch.comp-genomics.org/), which contains 2,045,746 cells from both tumor and healthy samples. All transcriptome data were processed uniformly to facilitate clarification of TME components in terms of both cell type and cell cluster.
Identification and Characterization of PSM Phenotypes
The basic information of 45 PSM molecules, which was downloaded from the Human Genome Organisation (HUGO) Gene Nomenclature Committee (HGNC) portal (http://www.genenames.org/), is listed in Table S2. Consensus clustering was used to stratify HCC patients based on the transcriptomic expression levels of these molecules. This process was done using the “ConsensusClusterPlus” package31 and was repeated 50 times.
Identification of Differentially Expressed Genes (DEGs)
We identified DEGs between two PSM subtypes using the R package “Limma” with a significance criterion of normal P < 0.05.32 We ran gene set enrichment analysis (GSEA)33 with “hallmark gene sets” as the background genome and performed the R package “clusterprofiler”34 for the gene ontology (GO) and Kyoto Encyclopedia of Genes and Genomes (KEGG) analysis.35,36
The main workflow of Multiscale Embedded Gene co-expression Network Analysis (MENEGA)37 is to construct a fast planar filtered network (PFN) and obtain significant gene pairs for the PFN. To complete the analysis of the PFNs, the data was imported into multiscale clustering analysis (MCA).
The Least Absolute Shrinkage and Selection Operator (LASSO) Regression Model and the Cox Regression Model Development
LASSO regression analysis was performed by “glmnet” package38 to determine the study objectives. The PSM molecules were analyzed via univariate Cox regression to identify independent prognostic factors. Using the “ggplot2” package, forest plots representing p-values, hazard ratios and 95% confidence intervals were generated for each variable.
Survival Curve Analysis
We performed Overall Survival (OS), Disease Free Interval (DFI), Disease Specific Survival (DSS), and Progression Free Interval (PFI) analyses of HCC cases in the TCGA-LIHC and ICGC cohorts according to the expression levels of PSM molecules using the “survival” and “survminer” packages, and plotted the corresponding Kaplan-Meier curves.
Immune Analysis
We estimated the abundance of immune cell infiltration in TCGA-LIHC samples using the TIMER,39 CIBERSORT,40 CIBERSORT-ABS,41 QUANTISEQ,42 MCPCOUNTER,43 XCELL,44 and EPIC algorithms,45 and compared the differences in immune composition across PSM subtypes.
Statistical Analysis
In order to determine the correlation between variables, we used Pearson/Spearman correlation coefficients. Statistical significance was estimated using the T Test for normally distributed variables and the Mann–Whitney U-test (also known as the Wilcoxon rank sum test) for non-normally distributed variables. ANOVA and Kruskal–Wallis tests were used to compare two or more groups. Log rank test was used in survival model to determine statistical significance. All statistical analyses used R (https://www.r-project.org/), with a P value < 0.05 (two-tailed) indicating significant differences.
Results
The Genetic Characteristics and Transcriptional Variations of 45 PSM Related Molecules
We obtained information on 45 PSM-related molecules from the HUGO Gene Nomenclature Committee portal, as shown in Table S2. The 45 molecules are PSMA1, PSMA2, PSMA3, PSMA4, PSMA5, PSMA6, PSMA7, PSMA8, PSMB1, PSMB2, PSMB3, PSMB4, PSMB5, PSMB6, PSMB7, PSMB8, PSMB9, PSMB10, PSMC1, PSMC2, PSMC3, PSMC4, PSMC5, PSMC6, PSMD1, PSMD2, PSMD3, PSMD4, PSMD5, PSMD6, PSMD7, PSMD8, PSMD9, PSMD10, PSMD11, PSMD12, PSMD13, PSMD14, SEM1, ADRM1, PSME1, PSME2, PSME3, PSME4, and PSMF1. Figure 1A shows the regulatory mechanism of PSM in the protein degradation system. We selected 1112 samples from the TCGA database with at least one PSM-associated molecular mutation to observe the genetic variation in PSM-associated molecules in cancer. Waterfall plot shows the somatic mutations of the 10 PSM-associated molecules with the highest mutation frequencies in the pan-cancer samples (Figure 1B). Among the 1112 samples, 591 cases had PSM molecular mutations, with a frequency of 53.15%. Of these, PSME4 exhibited the highest mutation frequency (18%), followed by PSMD1 (10%) and PSMD2 (9%). Missense mutation was the most common type of mutation, and uterine corpus endometrial carcinoma (UCEC) was the most frequently type of mutating cancer. Considering that only 14 cancer types contained a sufficient number of paired tumor and normal samples, we provided differential mRNA expression profiles of 45 PSM molecules in these cancer types. The vast majority of PSM molecules are upregulated in tumor tissue compared to normal tissue (Figure 1C). We further investigated the impact of PSM molecules on the prognosis and showed that most of them are detrimental factors for OS in cancer patients, especially in kidney renal clear cell carcinoma (Figure 1D). Genetic variation influenced PSM molecule expression, as demonstrated in our study. Most cancers showed a positive correlation between CNV and mRNA expression, particularly in PSMF1 (Figure 1E); the degree of DNA methylation and mRNA expression levels were negatively correlated in most cancer types, particularly in PSMB9 (Figure 1F). Of the 363 samples from HCC, 51 samples had mutations in the PSM molecule, but the frequency of mutations in all molecules was less than 1% (Figure S1A). In addition, we observed significant co-mutations between PSMD14 and PSMB6, PSMC1 and PSMD1, PSMD11 and PSMC6, and PSMA7 and PSMA4 (Figure S1B, P < 0.05). Finally, the correlation of these PSM molecules was analyzed, as shown in Figure 1G (TCGA) and Figure S2 (ICGC). Results suggested that transcriptional variation is a potential regulator of PSM molecule expression levels.
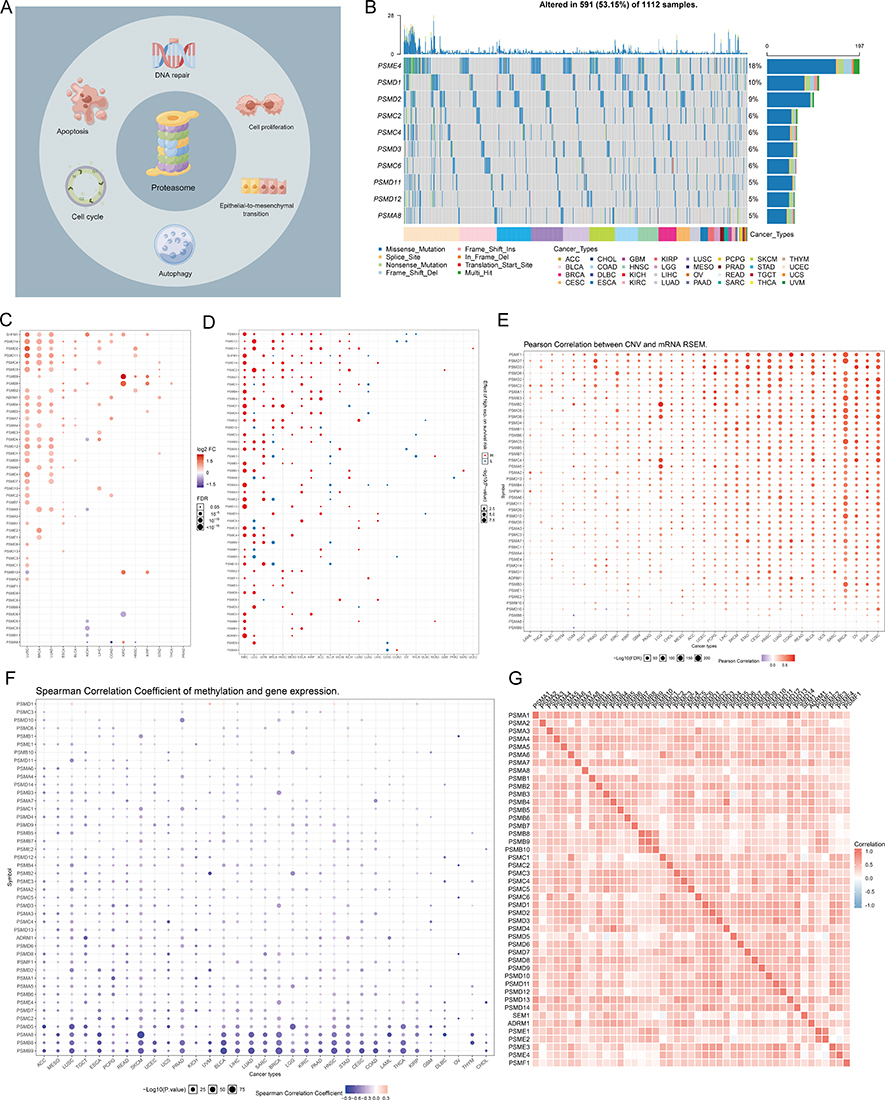 |
Figure 1 Expression variation of proteasome molecules. (A) The pattern diagram shows the potential regulation mechanism of the proteasome in tumors. (B) The waterfall diagram shows the somatic mutations of the 10 proteasome molecules with the highest mutation frequency using pan-cancer analysis. 53.15% is the proportion of 591 samples with at least one mutation of the top 10 genes among 1112 samples with at least one mutation of 45 proteasome (PSM) molecules. The percentage figure of each line on the right of the picture is the number of samples with the corresponding gene mutation divided by 1112 samples with at least one mutation among the 45 PSM molecules. (C) The color of the dots represents the degree of variance. Redder dots represent higher expression in cancer tissue. Blue dots represent higher expression in normal tissue. The fold change equals mean (Tumor) / mean (Normal), P-value was used, t-test and P-value was adjusted by false discovery rate (FDR). The size of the bubbles indicates the FDR. Larger bubbles represent a lower FDR. The genes with fold change (Fold change >2) and significance (FDR > 0.05) were retained to produce the figures. If there is no significant gene in one cancer type, the cancer type is omitted in the final figure. (D) The risk scores distribution and gene expression patterns of patients in high and low-risk groups. Hazard ratio (HR) above 1.0 indicates greater risk (red dot); hazard ratio below 1.0 indicates less risk (blue dot). (E) The bubble chart shows the correlation between Copy number variant (CNV) and mRNA expression level. Red indicates positive correlation; blue indicates negative correlation. The deeper color indicates a larger correlation index (Pearson correlation). The bubble size indicates the FDR. (F) The bubble chart shows the correlation between methylation of the 45 PSM and mRNA expression. Red shows a positive correlation and blue shows a negative correlation. The darker color indicates a larger correlation index (Pearson correlation). Bubble size indicates the FDR. (G) Correlation between expression levels of 45 PSM molecules, red represents positive correlation, blue represents negative correlation. The size of the circle represents the absolute value of the correlation coefficient (Spearman method, TCGA-LIHC, n = 373). |
The Significance of PSM Molecules in HCC
We first further confirmed the significant upregulation of PSM levels in tumor tissue by the Gene Set Variation Analysis (GSVA) algorithm (Figure 2A). We then explored the relationship between PSM and signaling pathway characteristics. At the pan-cancer level, most PSM molecules, particularly PSMD14, PSMB2, PSMA7, and PSMA5, showed high levels of activation in cell cycle and apoptotic signaling, but showed consistent inhibition of the RAS/MAPK signaling pathway (Figure 2B). In HCC, most PSM molecules activate apoptosis, cell cycle, and EMT signaling pathways, but inhibit RTK, RAS/MAPK, Hormone ER, and Hormone AR signaling pathways (Figure 2C). Enrichment analysis showed that PSM molecules were closely associated with peptidase activity (Figure 2D). GSVA algorithm showed that PSM activity was significantly and positively correlated with cell cycle, EMT signaling activation (Figure 2E, *P < 0.05).
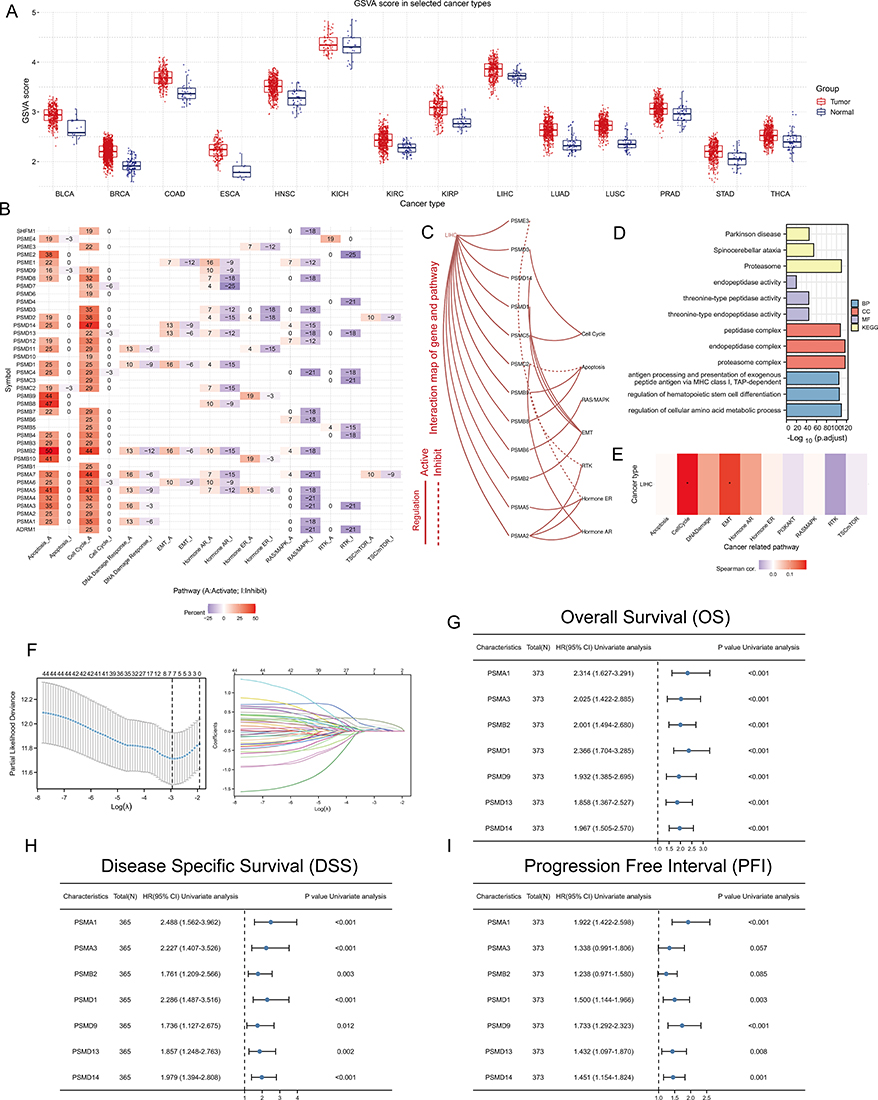 |
Figure 2 The significance of PSM molecules in hepatocellular carcinoma (HCC). (A) Overall expression levels (Gene set variation analysis, GSVA scores) of proteasome molecules in 14 cancers containing paired normal samples. (B) The heatmap shows the correlation between the expression level of the 45 PSM molecules in important cancer signaling pathways. The global percentage of cancers in which a gene has an effect on the pathway among the 32 cancer types, is shown as the percentage: (number of activated or inhibited cancer types/32 *100%). Heatmap shows collagen molecules that have a function (inhibit or activate) in at least 5 cancer types. “Pathway activate” (red) represents the percentage of cancers in which a pathway may be activated by given genes, inhibition in a similar way shown as “pathway inhibit” (blue). (C) The correlation between the 45 PSM molecules in TCGA-LIHC and important cancer signaling pathways. The solid line represents activation and the dashed line represents inhibition. (D) The “clusterProfiler” R package was used for the Gene Ontology (GO) and Kyoto Encyclopedia of Genes and Genomes (KEGG) enrichment analysis. Different colors represented different background gene sets. (E) The Gene Set Variation Analysis (GSVA) heatmap showing PSM molecules that activate and inhibit pathways in TCGA-LIHC. The pathway activity was assessed with the GSCALite web server. (F) Least absolute shrinkage and selection operator (LASSO) Cox model fitting. Each curve represents a gene. The profiles of coefficients were plotted versus log(λ). Vertical lines indicate the positions of seven genes with coefficients greater than 0 determined by 10-fold cross-validation. λ was determined from 10-fold cross-validation. The x-axis represents log(λ); the y-axis represents binomial deviance. Optimal values calculated from minimum criteria and one standard error of the criteria are indicated by the dotted vertical lines. (G–I) Univariate Forest plot showing association between 7 candidate PSM molecules expression and Overall survival (OS) (G), Disease Specific Survival (DSS) (H) and Progression Free Interval (PFI) (I) in TCGA-LIHC. |
We next constructed a LASSO-COX model based on TCGA-LIHC to identify independent prognostic factors in the PSM molecules. The results showed that PSMA1, PSMA3, PSMB2, PSMD1, PSMD9, PSMD13, and PSMD14 were significant detrimental factors for HCC (Figure 2F-I). Kaplan-Meier survival curves showed that high expression of these seven molecules correlated with poor OS, DSS and PFI (Figure S3, TCGA-LIHC). And interestingly, we noted relatively high expression levels of PSM molecules in progressive and poorly differentiated HCC samples (Figure S4A and B, TCGA-LIHC).
Unsupervised Hierarchical Clustering Identifying Two Different Patterns at the PSM Level
To fully understand the regulatory mechanisms of PSM in HCC, the 363 tumor samples from TCGA-LIHC were grouped into k clusters (k = 2–6) using the R package “ConsensusClusterPlus”. Figure S5 presented the consensus matrix for K = 2–6. When k = 2, the HCC samples could be well divided into cluster 1 (C1) and cluster 2 (C2) (Figure 3A and B). Principal component analysis (PCA) showed that the two clusters could be effectively distinguished from each other by the levels of 45 PSM molecules (Figure 3C). KM survival curves for both clusters indicated that C2 HCC patients had better survival rates compared to C1 patients (Figure 3D; Log rank test; OS, P = 0.0014; DFI, P = 0.0016; DSS, P = 0.0044; PFI, P = 0.00033). To ensure the stability of the clustering, we repeated the above process in a separate ICGC cohort (Figure S6A-D). Our results showed that C1 had higher PSM-related gene expression, while C2 showed the opposite trend (Figure 3E), which is highly consistent with both low- and high-risk subgroups.
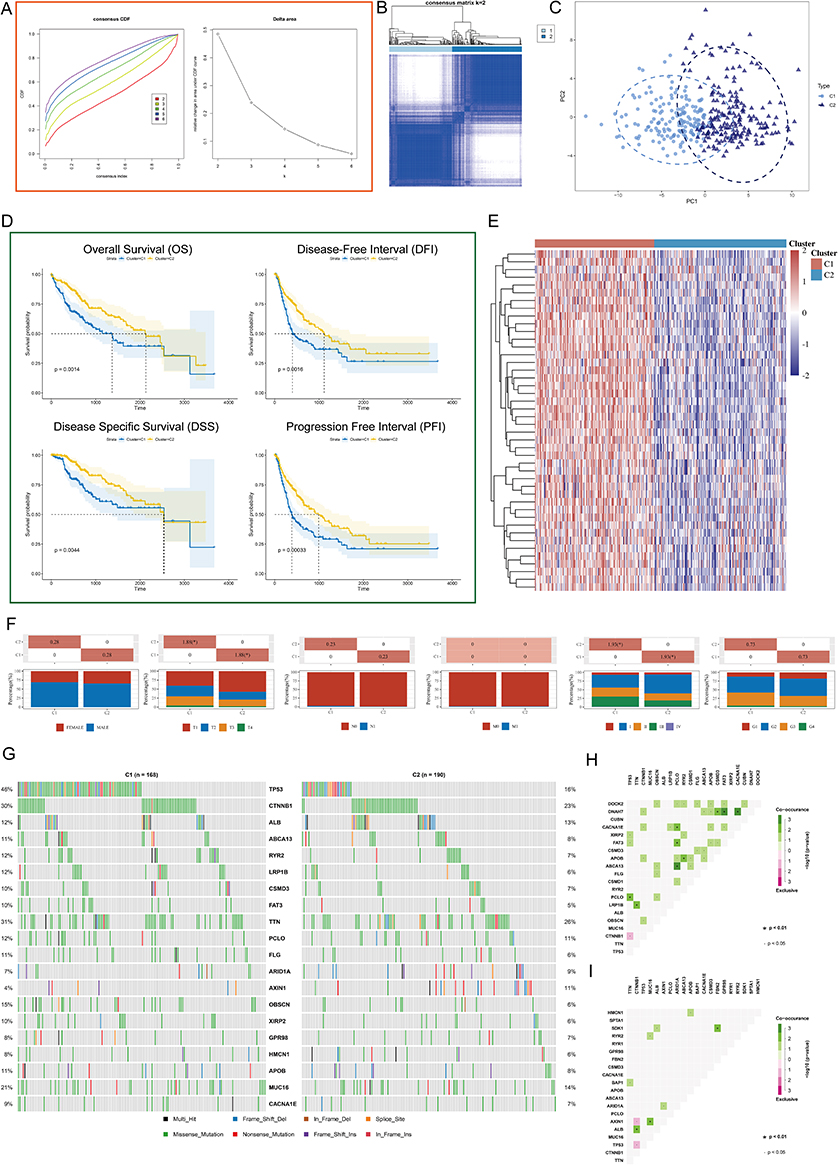 |
Figure 3 Unsupervised Machine Learning algorithms was used to identify 2 molecular subtypes in TCGA. (A) Left: The cumulative distribution function (CDF) curves in consensus cluster analysis. CDF curves of consensus scores by different subtype numbers (k = 2, 3, 4, 5, and 6) were displayed. Right: Relative change in area under the CDF curve for k = 2–6. (B) The consensus score matrix of all samples when k = 2. The higher the consensus score is, the more likely they were assigned to the same group (TCGA-LIHC). (C) The Principal Component Analysis (PCA) distribution of TCGA-LIHC samples by expression profile of PSM. Each point represents a single sample; different colors/shapes represent C1 and C2 respectively. (D) Survival analysis including Overall Survival (OS), Disease Specific Survival (DSS), Disease Free Interval (DFI), and Progression Free Interval (PFI) based on two clusters (Log rank test, TCGA-LIHC, n = 373). (E) Expression distribution of 45 PSM molecules between two subtypes in TCGA-LIHC. (F) Distribution of clinical characteristics of two subtypes, including Gender, T/N/M stages, Clinical stage, and Tumor grade. (G) Oncoplot shows mutations in the top 20 genes with the highest mutation frequency in both subtypes (TCGA-LIHC). Each column represents an individual patient. (H and I) Graphs show the mutually exclusive and co-occurrence of mutational events in both subtypes (TCGA-LIHC; (H) C1, (I) C2). Green indicates co-mutation, red indicates mutex-mutation, the asterisk indicates P-value (Wilcoxon test,·P <0.05, *P <0.01). |
We further explored the relationship among subtypes, clinical features and driver gene mutations. It is interesting to note that C1 contained a higher proportion of HCC patients with advanced stages compared to C2, particularly in terms of pathological stage and T stage (Figure 3F, P < 0.05). The oncoplots showed the mutation profiles of genes that are frequently mutated in both clusters (Figure 3G). In both clusters, TP53 and CTNNB1 were observed to have frequent missense mutations. More importantly, C1 had more frequent TP53 missense mutations compared to C2, and other genes were also mutated more frequently, including CTNNB1, ABCA13, and RYR2. Finally, we found that, C1 showed more mutational co-occurrences, such as DNAH7 and CSMD3 mutations (Figure 3H), whereas C2 had relatively independent mutational events that did not interact with one another (Figure 3I).
Biological Signal Variation in the PSM Phenotype
To explore the differences in gene expression between PSM subtypes and the characteristics of the associated signaling pathways, we obtained DEGs in the TCGA cohort based on | log2 (fold change) | > 2 and adj. p < 0.05 (Figure 4A). Functional analysis showed that cell cycle, DNA replication, P53 signaling pathway, organelle fission, nuclear division were enriched in C1, while Retinol metabolism, Drug metabolism - cytochrome P450, carboxylic acid catabolic process, organic acid catabolic process were enriched in C2 (Figure 4B). In addition, we compared the differences in Tumor Immune Dysfunction and Exclusion (TIDE) scores and 12 immune cell infiltrations. Compared to C2, C1 had an increased TIDE score, exclusion score, CD8+ T cells, M0 macrophages, and CD4+ T cell infiltration (Figure S7). We then constructed a MEGENA network based on DEGs. As shown in Figure 4C, we identified six modules, the largest of which, C1_2, consisted of 137 genes (Figure 4C). Enrichment analysis showed that C1_2 was closely associated with cell division-related signal (Figure 4D) and that levels of the 10 most heavily weighted genes were all upregulated in tumor tissues (Figure 4E).
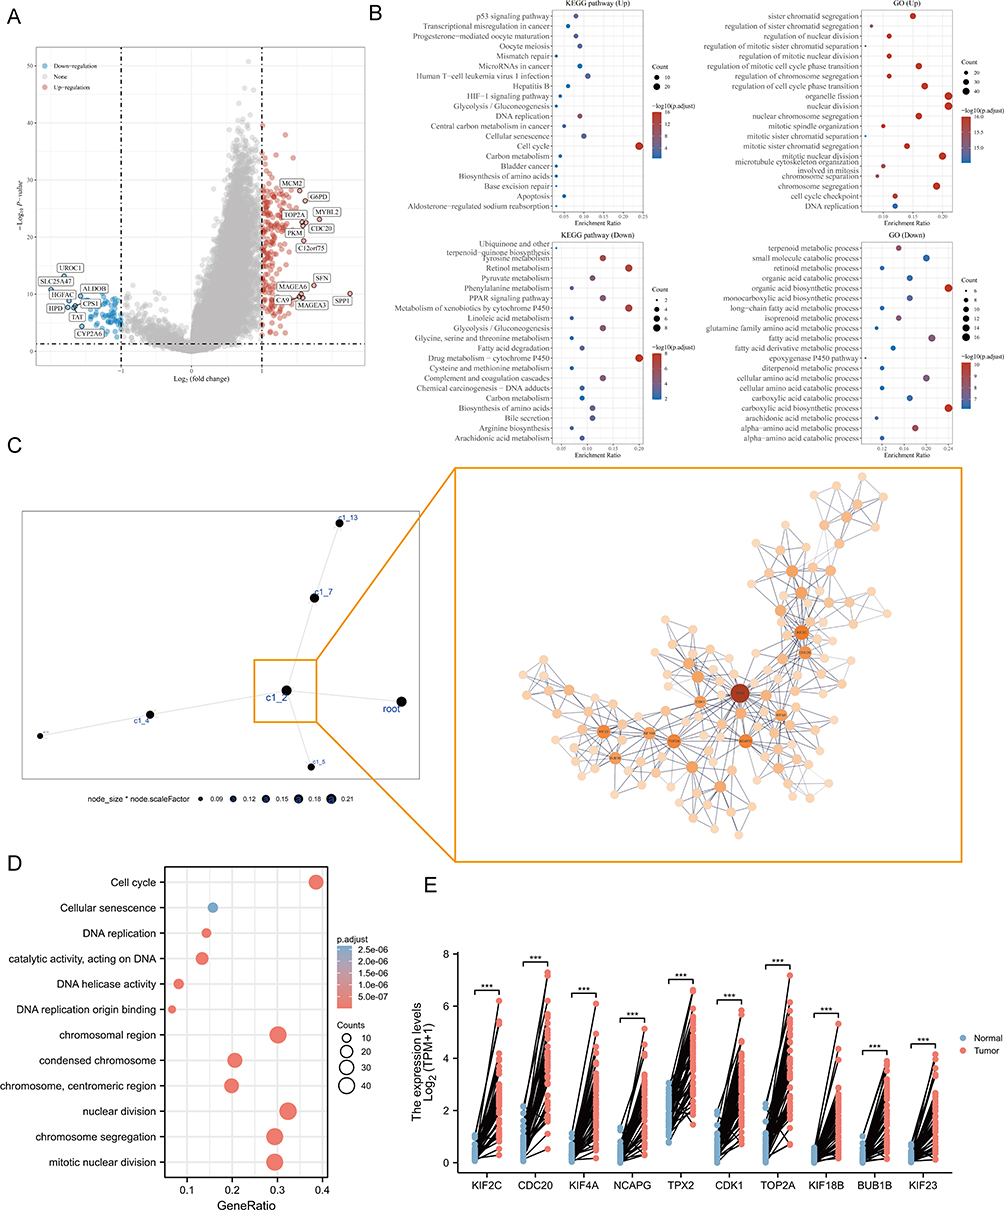 |
Figure 4 Analysis of PSM-related signaling pathways. (A) Volcano map of differentially expressed genes (DEGs) between C1 and C2 based on TCGA-LIHC dataset. Data on the abscissa are differences in gene expression (log2 fold change); data on the ordinate represent the significance of these differences (−log10 padj). Red indicates upregulation, and blue indicates downregulation. (B) Significant Gene Ontology (GO) enrichment terms and Kyoto Encyclopedia of Genes and Genomes (KEGG) pathway enrichment analyses of the DEGs. (C) The co-expression network of DEGs is based on Multiscale Embedded Gene Co-Expression Network Analysis (MEGENA). Each node represents a module, with the larger nodes indicating a higher number of genes. Right MEGENA network showing the largest gene module C1_2. The degree value of the node was calculated by Cytoscape. The higher the degree value, the darker the color and the larger the size. (D) Enrichment analysis of the largest gene module (node indicates gene expression level; color indicates P value). (E) Graphs for comparison of ten hub genes expression in paired normal and tumor tissues using TCGA-LIHC (Paired t test, *** P < 0.001, n = 50). |
Identification of Ten Hub Genes Upregulation in Malignant Cells and Tprolif Cells
The full application of single-cell sequencing technology will contribute to a better understanding of the microenvironmental features of the HCC development process. We utilized a single cell RNA sequence of HCC here to characterize the expression pattern of ten hub genes in the tumor microenvironment (TME). Figure 5A and B showed the distribution of cell types and cell clusters in GSE166635, respectively. Uniform Manifold Approximation and Projection (UMAP) plots and violin plots show that ten hub genes are upregulated in malignant (cluster 8) and Tprolif (cluster 12 and 18) cells through unique genetic markers for each cell type (Figure 5C-E). Cells rich in PSM-related genes are mainly in the G2M phase (Figure S8A). To determine the mechanism by which PSM affects HCC, we analyzed ligand-receptor interactions through TISCH. In HCC samples, epithelial C1 and C9 were the main cell populations interacting with epithelial C8 (Figure S8B and C), and there were interactions between Tprolif C18 as well as C12 and other cell types (Figure S8D and E). The results further suggested that differences in C1 and C2 may be derived from proliferation-related signal.
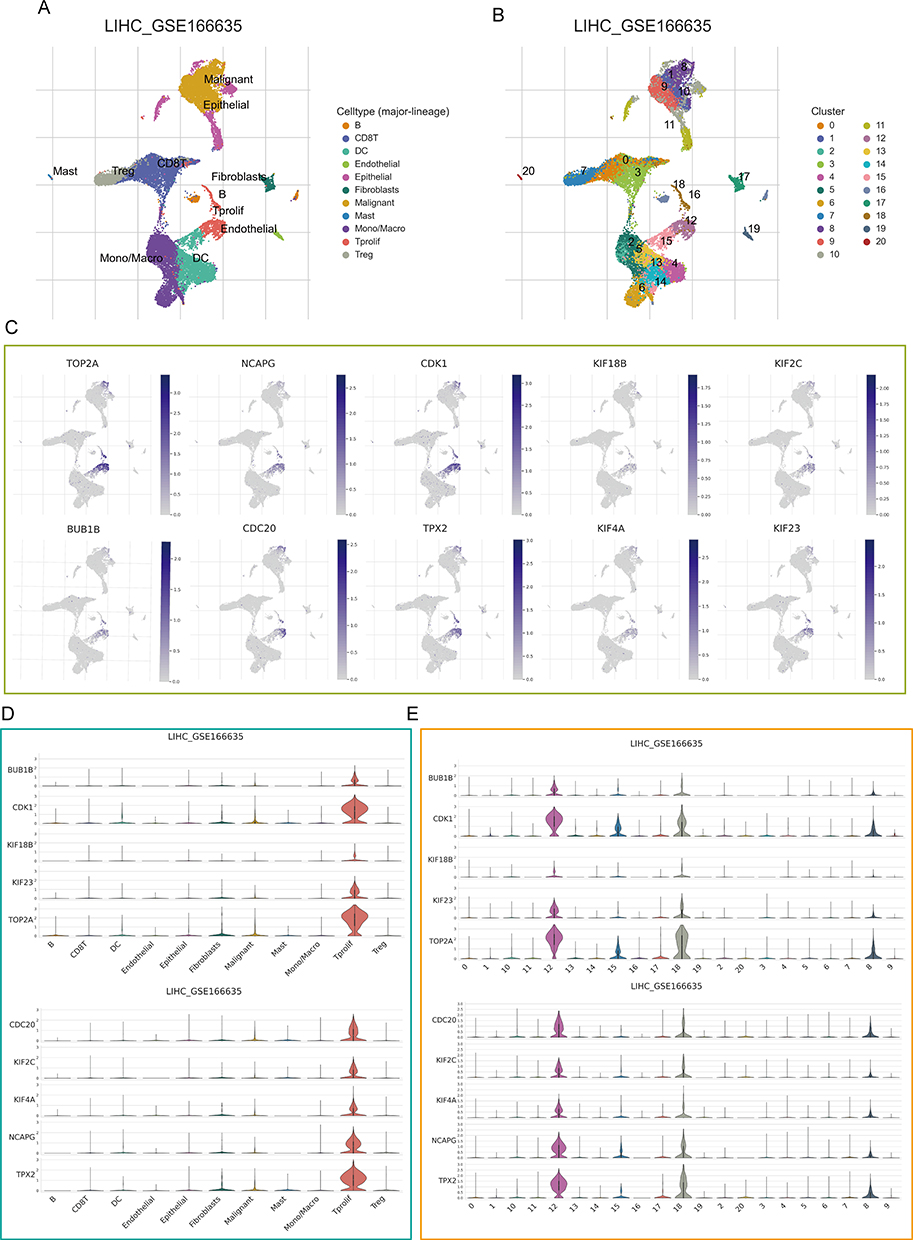 |
Figure 5 Single-cell analysis. (A) Uniform Manifold Approximation and Projection (UMAP) plot dimensionality reduction algorithm, each color represents a unique cell type. (B) Cells were clustered into 21 types via UMAP plot dimensionality reduction algorithm, each color represents a unique cluster. (C) Dot plots demonstrate the expression distribution of the top 10 degree value genes. (D and E) Violin plots of the top 10 degree value genes across different cell types (D) and cell cluster (E). |
PSM Correlated with Cancer DNA Repair and Stemness
The stability of the cancer genome is largely dependent on the repair of DNA through different mechanisms, including DNA Mismatch Repair (MMR) and Homologous Recombination Repair (HRR), which also contribute to the maintenance of stemness in cancer cells. Here we analyzed the relationship between PSM-related genes and MMR signatures, HRR signatures, and cancer stemness.
At the single-cell level, we found that PSM-related genes and HHR, MMR-related genes were consistently highly expressed on malignant cells (Figure 6A-F). In addition, we also observed a high positive correlation among them (Figure 6G and H; PSM-HRR, R = 0.67; PSM-MMR, R = 0.44). For cancer stemness, we noted that C1 has a much higher stemness index than C2 (Figure 6I, P < 0.0001). Based on previous analysis of survival rates, we focused on PSMD14, PSMD13, PSMD9, PSMD1, PSMB2, PSMA3, and PSMA1. Except for PSMD1, the levels of the remaining six genes were positively correlated with the stemness index (Figure 6J, P < 0.001). The results of the Cancer Cell Line Encyclopedia (CCLE) are shown in Figure 6K and the transcriptome expression levels of PSMD13 at cell level were, in descending order (Hep 3B2.1–7, HepG2, HuH-7, HuH-6 and Li-7). The Western blotting, shown in Figure 6L, yielded consistent results. Since Hep3B2.1–7 and HepG2 cells showed relatively higher PSMD13 expression, we selected these two cell lines for further analysis. Considering that PSMD13 exhibited the strongest stemness correlation (R = 0.324, P < 0.001), we next demonstrated in vitro that interference with PSMD13 expression significantly reduced the sphere-forming and proliferative capacity of Hep3B2.1–7 and HepG2 cells (Figure 6M-O).
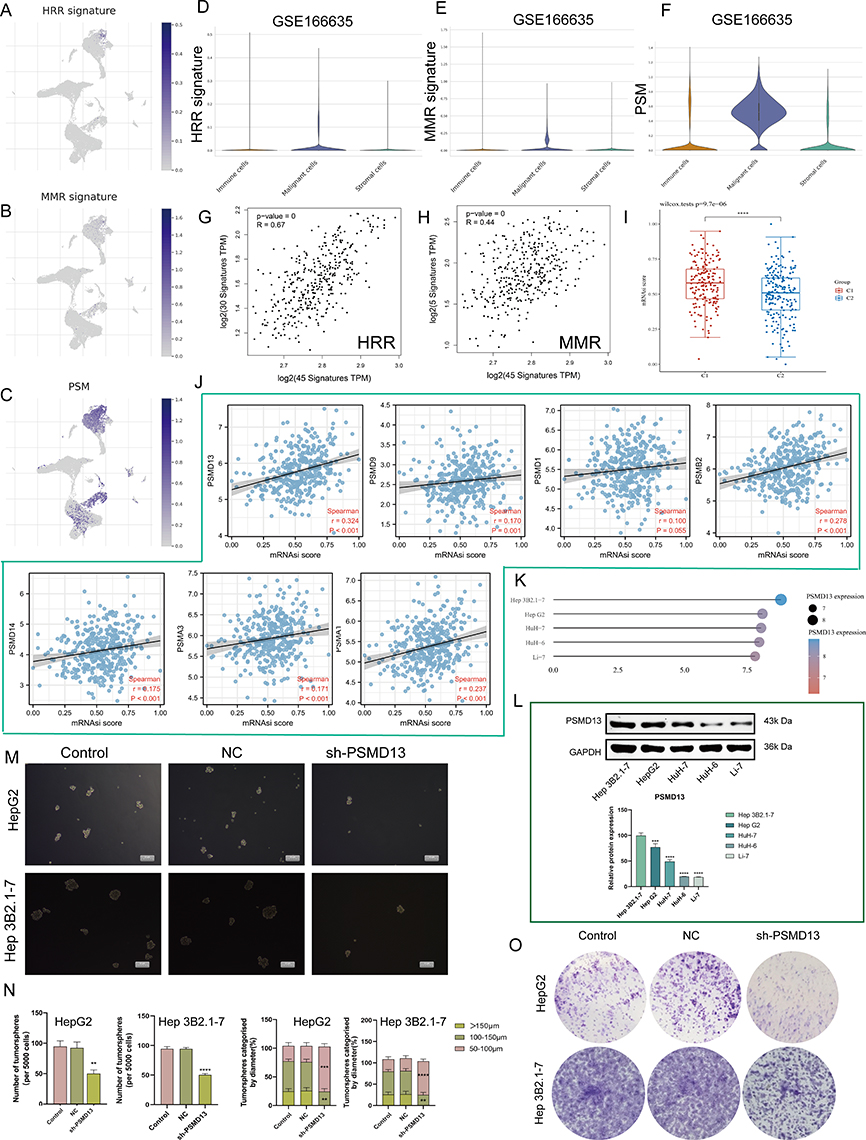 |
Figure 6 PSM correlated with cancer DNA repair and stemness. (A–C) Dot plots demonstrate the expression distribution of homologous recombination repair (HRR) signature (A), mismatch repair (MMR) (B) signature and PSM molecules (C) in GSE166635. (D–F) Violin plots demonstrate the expression distribution of HRR signature (D), MMR (E) signature and PSM molecules (F) in GSE166635. (G) The correlation scatter plots in TCGA-LIHC present the correlations between the HRR signature and PSM molecules expression. (H) The correlation scatter plots in TCGA-LIHC present the correlations between the MMR signature and PSM molecules expression. (I) Analysis of the mRNAsi score difference between the two subtypes (Wilcoxon test, TCGA-LIHC, n = 373). (J) Correlation analysis of the 7 candidate genes mRNA expression and mRNAsi score based in TCGA-LIHC (Spearman method, n = 373). (K and L) PSMD13 expression in different Human hepatocarcinoma cell lines based on (K) the Cancer Cell Line Encyclopedia (CCLE) and (L) Western blot. One-way ANOVA was conducted. (***P < 0.001, ****P < 0.0001). (M and N) Hep 3B2.1–7 and HepG2 cells transfected with the NC, sh-PSMD13 constructs. The representative images from the sphere-forming assay (M). The scale bar represents 50 μm. The number of tumor spheres was counted and plotted, and percentage of tumor spheres with diameters of 50–100 μm, 100–150 μm, or >150 μm was calculated and plotted (N). (ANOVA, **P < 0.01, ***P < 0.001, ****P < 0.0001). (O) Clone formation capacity of the Hep 3B2.1–7 and HepG2 transfected with the NC, sh-PSMD13 constructs assessed using the clone formation assay. Data are means ± SEM. All experiments were repeated at least three times, independently. |
PSMD13 Regulates Cancer EMT Through MMP2 and MMP9
The EMT program and tumor cell stemness are always closely linked and, in particular, EMT confers a strong stemness on epithelial tumor cells. We first analyzed the transcriptomic differences generated by PSMD13 knockdown using GSE57871 (Figure 7A). We found that PSMD13 was positively correlated with EMT activation (Figure 7B and C). To clarify the potential regulatory mechanisms of PSMD13 on EMT, we calculated the correlation between PSMD13 and four EMT marker genes. It was found that PSMD13 was positively correlated with MMP2 and MMP9 based on TCGA (Figure 7D; PSMD13-MMP2, R = 0.170, P < 0.001; PSMD13-MMP9, R = 0.398, P < 0.001) and ICGC (Figure 7E; PSMD13-MMP2, R = 0.293, P < 0.001; PSMD13-MMP9, R = 0.430, P < 0.001), respectively. In pan-cancer, PSMD13 was found to be positively correlated with MMP2 and MMP9 in most cancer types (Figure 7F). We then demonstrated in vitro that down-regulation of PSMD13 levels could significantly affect the expression of MMP2 and MMP9 (Figure 7G and H), and attenuate the migration and invasive ability of tumor cells (Figure 7I-L). Finally, in vivo assays showed that intervention with PSMD13 impeded tumor growth (Figure 7M-P).
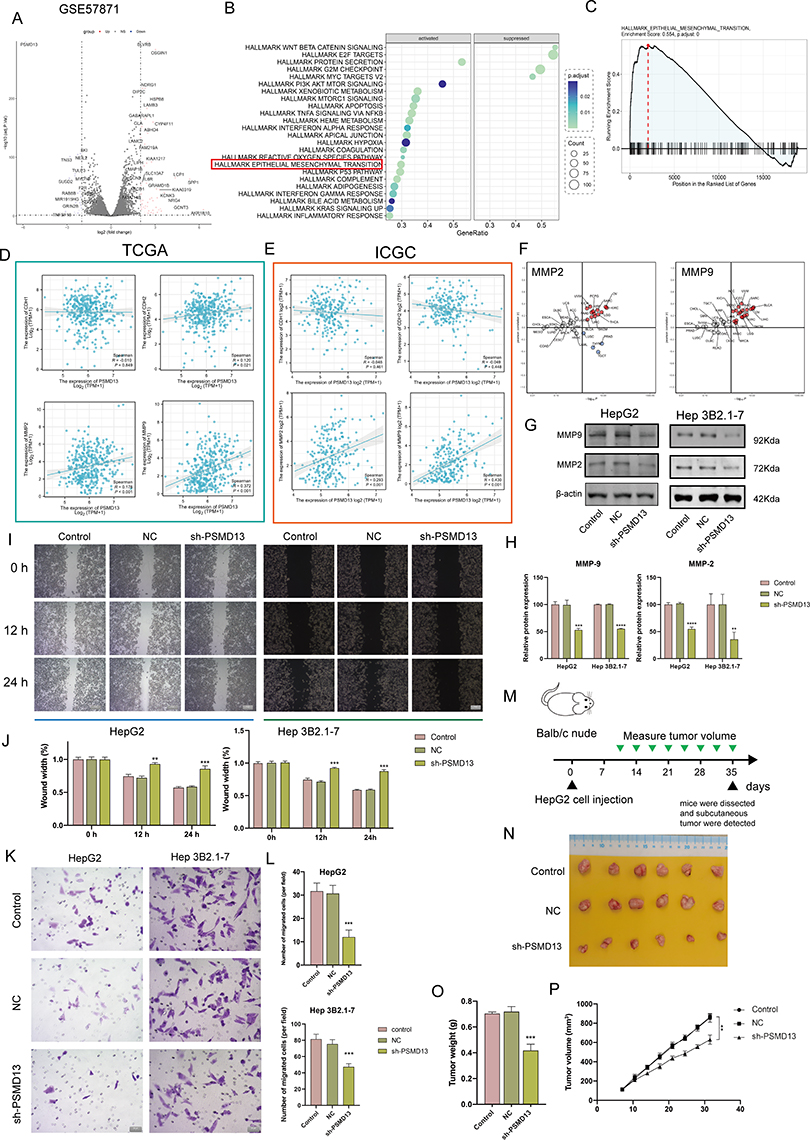 |
Figure 7 PSMD13 overexpression promotes a malignant phenotype in HCC. (A) A volcano plot of differentially expressed mRNAs in PSMD13 knockdown cells. (B) Enrichment analysis of DEGs upon PSMD13 knockdown. The larger the circle area is, the higher the number of genes; the smaller the p-values and the more significant the enrichment (the darker the color). (C) Gene set enrichment analysis (GSEA) plots of HALLMARK terms were analyzed in GSE57871. (D and E) Correlation of the PSMD13 expression levels with EMT-related makers based on TCGA-LIHC (D) and ICGC (E). Spearman method is applied. (F) Association of PSMD13 expression with MMP2 and MMP9 in TCGA pan-cancer. Red: positively correlated; Blue: negatively correlated, Grey: not statistically significant. Spearman method is applied. (G and H) The Expression of the MMP2 and MMP9 proteins was examined using Western blots after the transfection of the Hep 3B2.1–7 and HepG2 cells with NC, sh-PSMD13 constructs. (ANOVA, **P < 0.01, ***P < 0.001, ****P < 0.0001). (I and J) The migratory ability of the different groups of Hep 3B2.1–7 and HepG2 was examined using the wound-healing assays (Scale bars = 50 μm). (**P < 0.01, ***P < 0.001). (K and L) Cell invasion (Transwell assay) (Scale bars = 20 μm). (ANOVA, ***P < 0.001). (M) Schematic diagram of subcutaneous tumor models. Green triangles represent the time point when the tumor volume was measured. (N) Xenograft mouse tumors (n= 6 mice per group). (O) Weights of xenograft tumors at completion of the study. (ANOVA, ***P < 0.001). (P) Volumes of xenograft tumors measured twice a week. Data are means ± SEM. All experiments were repeated at least three times, independently. |
Characterization of the Clinical Significance of PSM
The ssGSEA algorithm was applied to build a risk score model using the expression profiles of the seven genes mentioned above. As shown in Figure 8A (TCGA) and B (ICGC), patients with high risk have a higher probability of early death than those with low risk. Kaplan-Meier curves stratified by median cut-off values showed that patients in the high-risk group had a significantly worse OS than those in the low-risk group (Figure 8C and D; TCGA, P = 0.0026; ICGC, P = 0.01). The predictive capability of the risk score was assessed by time-dependent ROC curves, with the area under the curve (AUC) reaching 0.64 at 1 year, 0.64 at 3 years and 0.65 at 5 years for TCGA (Figure 8E), and 0.67 at 1 year and 0.76 at 3 years for ICGC (Figure 8F).
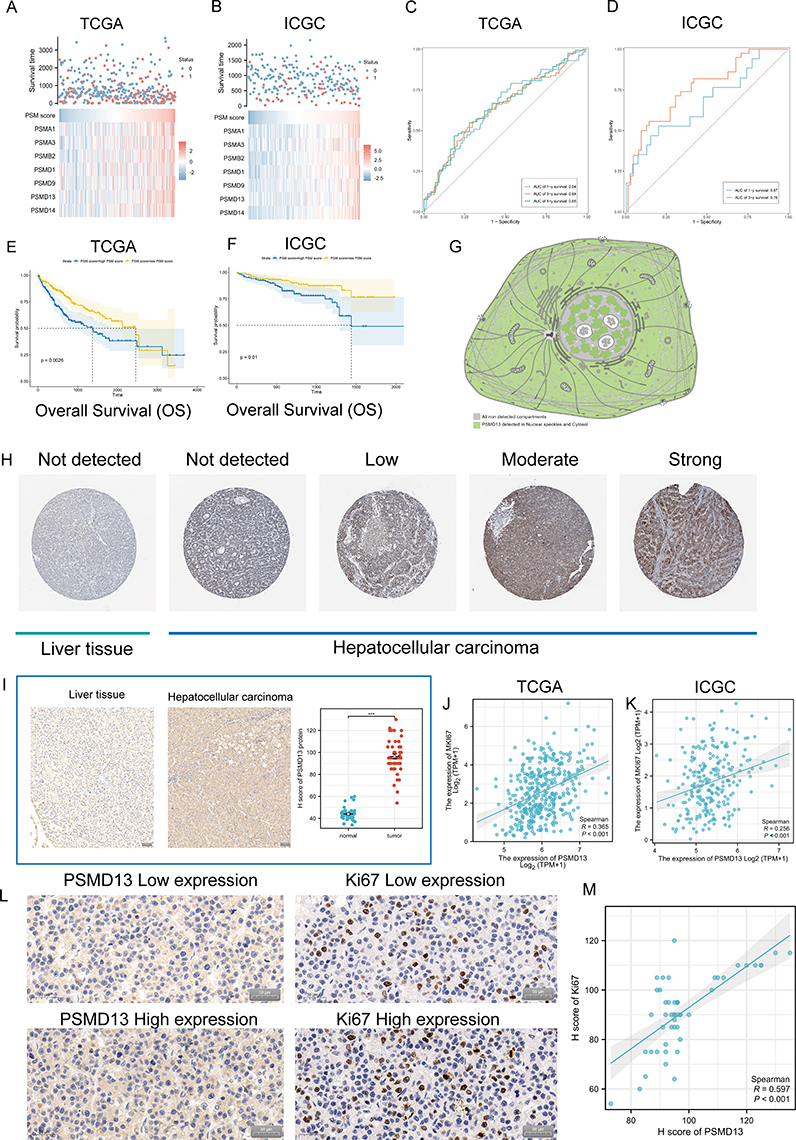 |
Figure 8 Clinical significance of PSM. (A and B) The composite plots of the distribution of risk scores, vital status and expression patterns of the seven PSM prognostic molecules in HCC patients from TCGA (A) and ICGC (B). Risk scores are listed in ascending order from left to right. (C and D) The predictive value of the PSM score was evaluated using time-dependent Receiver operating characteristic (ROC) curve analysis within 1, 3 and 5 years (C: TCGA-LIHC; (D) ICGC). (E and F) Kaplan-Meier curves of association between the PSM prognostic molecule expression levels (ssGSEA algorithm) and overall survival of HCC patients in TCGA (E) and ICGC (F) datasets (Log rank test, n = 373). (G) Main subcellular localization of PSMD13 based on Human Protein Atlas (HPA) database. (H) Representative Immunohistochemistry (IHC) images of PSMD13 expression in normal liver tissue and HCC tissue according to HPA databases. (I) IHC analysis of PSMD13 of our own samples. The statistical comparison of PSMD13 expression levels (H-SCORE) in paracancerous and HCC tissue (Wilcoxon test, ***p< 0.001, n = 40, Scale bars = 50 μm). All the IHC scores were repeated three times using a double-blind method. Statistical analysis All experiments were repeated at least three times, independently. (J and K) Scatter plot showing the correlation of PSMD13 and MKI67 mRNA levels based on TCGA (J) and ICGC (K) datasets. (L and M) Matched HCC tissue sections of adjacent slides were displayed to prove the correlation of PSMD13 and Ki-67 expression (L). The correlation analysis was based on immunohistochemical H-score (M). (Wilcoxon test, ***P < 0.001, n = 40, Scale bars = 50 μm). |
We next examined the expression of PSMD13 in clinical samples. In terms of subcellular localization, PSMD13 was mainly found in nuclear speckles and cytosol (Figure 8G, data derived from Human Protein Atlas (HPA) database). Figure 8H showed representative pictures of PSMD13 Immunohistochemistry (IHC) in the HPA database, and the results suggested that PSMD13 was overexpressed in HCC tissues. To validate this result, we retrospectively collected 40 HCC specimens and quantified the expression of PSMD13 using the H-score (Figure 8I, P < 0.001). Considering previous results suggesting that PSMD13 can promote tumor cell proliferation, we conducted serial sections to examine the correlation between PSMD13 and Ki67 expression. In addition to the transcriptional level findings (Figure 8J, TCGA, R = 0.365, P < 0.001; Figure 8K, ICGC, R = 0.256, P < 0.001), IHC staining confirmed an increase in protein levels of Ki67 (representing the proliferative capacity of tumor cells) with increased PSMD13 protein expression (Figure 8L and M, R = 0.597, P < 0.001).
Discussion
The PSM is a large multi-catalytic protease complex consisting of a 20S core particle and a 19S regulatory particle whose main function is to accept and degrade ubiquitinated substrates.46 The entire regulatory system is highly complex and is responsible for the degradation of over 80% of the body’s intracellular proteins, ultimately maintaining cellular homeostasis.47 The PSM is critical for cell fate, regulating many processes including cell cycle progression, apoptosis, DNA repair and the degradation of misfolded proteins derived from the endoplasmic reticulum (ER).48
It is a fundamental fact that the expression of PSM-related genes is frequently elevated in tumor cells.49 A previous study has shown that enhanced degradation of misfolded proteins can provide antioxidant defence for tumor cells to maintain their malignant phenotype.50 Thus, there is a long history of antitumor therapeutic strategies targeting PSM, such as lenalidomide, which can bind to Cereblon to gain the ability to target Aiolos and Ikaros and ultimately inhibit PSM activity.51 Unfortunately, the success of this therapy has only been for haematological malignancies and there has still been no breakthrough in solid tumors. In the present study, we describe the transcriptional heterogeneity of PSM-associated molecules in tumor tissues and find that imbalances in PSM activity may be associated with genomic alterations. We defined two distinct clusters in HCC based on the transcriptome level of PSM-related genes. We found substantial differences in clinical features and mutational profiles between the two clusters. Of particular importance, TP53 showed an extremely high mutation rate (46%) in C1. Numerous studies have demonstrated that TP53 is a DNA-binding transcription factor capable of binding to a variety of different promoter elements in the genome to regulate the expression of hundreds of genes.52,53 These studies have highlighted its key role in processes such as the regulation of proliferation and the maintenance of genomic stability. In response to DNA damage and excessive proliferation signals, TP53 proteins are significantly activated, in other words, inactivation of TP53 by mutation will result in potent oncogenic effects. We found that variation in the mRNA transcriptome in PSM subtypes was significantly associated with specific proliferation-related biological pathways, and in particular was positively correlated with cell division and cell cycle signalling. Interestingly, key genes representing differences between the two clusters were found to be restrictively expressed on malignant cells (high proliferation rate cells). This evidence seems to support the possibility that the essential feature of the PSM subtype is the sustained proliferation of tumor cells. The above results show that the frequency of mutations involved in regulating cell growth is significantly higher in C1 (high PSM activity cluster) than in C2 (low PSM activity cluster). These mutations have been shown to underlie the hallmark of sustained proliferation in a large number of cancer models. A corollary of excessive proliferation is increased DNA replication pressure, which induces genomic instability and forces tumor cells to choose to escape apoptosis and eventually establish a hallmark of replicative immortality.
The DNA damage response induces a network of cellular pathways called the DNA damage response (DDR) to trigger DNA repair, which usually consists of mismatch repair (MMR) protein, homologous recombinational repair (HRR) and non-homologous end joining (NHEJ) and is coordinated with cell cycle progression and proliferation.54 In the present study, we found that PSM is highly correlated with HRR and MMR at the transcriptome level and that both repair systems have been reported to maintain the stem cell characteristics of tumor cells. Importantly, C1 patients with poor prognosis exhibited a higher stem cell index, a measure based on the stem cell index of mRNA expression (mRNAsi).55 The stem cell profile of tumors has been shown to be highly resistant to cytotoxic therapies and to underlie proliferation and dissemination in several tumors.56 Elevated PSM levels are critical for stem cell identity in both physiological and pathological situations.57 It has been found that upregulation of levels of the PSM subunit PSMD11/RPN-6 contributes to the induction of increased PSM activity in human pluripotent stem cells and that the UPS pathway is able to respond to various upstream factors to regulate cancer cell stemness.58,59 Our further calculations showed the strongest correlation between PSMD13 and mRNAsi, and subsequent experiments confirmed that interfering with PSMD13 levels significantly attenuated the sphere-forming and proliferative capacity of tumor cells. Interestingly, we found that PSMD13 was able to promote the activation of EMT signalling, which was identified as a regulator of tumor heterogeneity, and that cells undergoing EMT acquired stem cell characteristics.60 In vivo experiments also demonstrated that down-regulation of PSMD13 expression significantly inhibited the growth of xenotransplanted tumor. In addition, it is noteworthy that the expression of PSM-related genes increases with tumor stage and grade, and that progressive tumors often exhibit strong stemness. Based on the few studies on the association of PSMD13 with tumors, selective splicing events mediated by single nucleotide polymorphism (SNP) rs7128029 in PSMD13 have been identified to be associated with endometrial cancer risk.61 Based on a holistic bioinformatics approach, PSMD family members are now hypothesized to be possible prognostic biomarkers for breast and bladder cancer progression and to be promising therapeutic targets.62,63
Past attention to cancer research has focused on cancer cells, and over time, cancer has been recognized as an evolutionary and ecological process involving continuous, dynamic and interactive interactions between cancerous and mesenchymal components.64 Mesenchymal components are non-cancerous host cells, including macrophages, CD4+/CD8+ T cells, fibroblasts, endothelial cells, myeloid-derived suppressor cells and natural killer cells, as well as non-cellular components, including extracellular matrix (ECM) and soluble cytokines.65,66 They construct communication loops with tumor cells in various ways to help them acquire and maintain cancer hallmarks such as EMT, angiogenesis, apoptosis resistance, hyperproliferation, and immune evasion.67,68 This TME-dependent progression pattern of tumors provides a therapeutic modality to target mesenchymal components.69 This therapeutic approach has obvious advantages over direct targeting of cancer cells, which are prone to drug-resistant mutations due to their genomic instability, while the non-tumor component of TME is still genetically stable.70,71 In this study, high levels of CD4+ T cells, regulatory T cells and M0 macrophages were found in C1 (high PSM activity cluster), indicating the presence of immune tolerance in C1 patients. The results of the TIDE score also suggest that C1 patients are less likely to benefit from immunotherapy compared to C2. Thus, the biological signatures associated with PSM may define a unique group of patients who are prone to develop cytotoxic treatment resistance while also responding poorly to immunotherapy. This implies that the altered activity of PSM may have an effect on the complex signaling cascade in TME.
There are some limitations of our study. The results of this study relied heavily on bioinformatics analysis. Although we included a small cohort, further expansion of the sample size could well strengthen our conclusions. Our results suggested that PSMD13 plays an important role in HCC, but full exploration of its biological mechanisms is still lacking. Our team is attempting to further investigate this target.
Conclusion
In conclusion, our study reveals the potential significance of PSM in genomic instability and maintenance of tumor stemness. The activity of PSM is a valid predictor of prognosis and therapeutic response in patients with HCC disease. Furthermore, PSMD13 may be a potential therapeutic target and might thus facilitate individualized treatment and medical decision making.
Data Sharing Statement
We declare that all the data in this article are authentic, valid, and available for use on reasonable request. Dr. Yu Zhang can be contacted ([email protected]) regarding the availability of data and materials.
Ethics Approval and Consent to Participate
This study conformed to the principles outlined in the Declaration of Helsinki (World Medical Association Declaration of Helsinki). The study’s protocol was approved by the ethics committee of the Jiangsu Province Hospital of Chinese Medicine, and informed consent was obtained from clinicians and patients (2019NL-166-02). Written information was provided and written consent was given to all participants prior to collection of specimens for research purposes. All mouse experiments were performed in accordance with the Guide for Care and Use of Laboratory Animals and approved by the Animal Ethics Committee of Jiangsu Province Hospital of Chinese Medicine (2021DW-42-02). Prior to the commencement of data collection, the first author obtained written consent from all participants concerning participation and subsequent publication of the study results.
Acknowledgment
The authors gratefully acknowledge contributions from the GEO and TCGA databases.
Author Contributions
All authors made a significant contribution to the work reported, whether that is in the conception, study design, execution, acquisition of data, analysis and interpretation, or in all these areas; took part in drafting, revising or critically reviewing the article; gave final approval of the version to be published; have agreed on the journal to which the article has been submitted; and agree to be accountable for all aspects of the work.
Funding
The present study was supported by the Jiangsu Province Hospital of Chinese Medicine Peak Academic Talent Project (y2021rc19), Jiangsu Provincial Health and Medical Committee Key Projects (ZD2022070), State Administration of Chinese Medicine Project (20085-9-3), Natural Foundation of Jiangsu Province (BK20211007), Jiangsu Province Postgraduate Research Innovation Program Project (KYCX21-1677), Nanjing Medical Key Foundation (ZKX21028), Key Projects of Chinese Medicine Science and Technology Development in Jiangsu Province (ZD202227), Natural Science Foundation of China (82205212).
Disclosure
The authors declare no conflicts of interest.
References
1. Forner A, Reig M, Bruix J. Hepatocellular carcinoma. Lancet. 2018;391(10127):1301–1314. doi:10.1016/S0140-6736(18)30010-2
2. Llovet JM, Kelley RK, Villanueva Aet al. Hepatocellular carcinoma. Nat Rev Dis Primers. 2021;7(1):7. doi:10.1038/s41572-021-00245-6
3. Llovet JM, Pinyol R, Kelley RK, et al. Molecular pathogenesis and systemic therapies for hepatocellular carcinoma. Nat Cancer. 2022;3(4):386–401. doi:10.1038/s43018-022-00357-2
4. Sim HW, Knox J. Hepatocellular carcinoma in the era of immunotherapy. Curr Probl Cancer. 2018;42(1):40–48. doi:10.1016/j.currproblcancer.2017.10.007
5. Johnston MP, Khakoo SI. Immunotherapy for hepatocellular carcinoma: current and future. World J Gastroenterol. 2019;25(24):2977–2989. doi:10.3748/wjg.v25.i24.2977
6. Anwanwan D, Singh SK, Singh S, et al. Challenges in liver cancer and possible treatment approaches. Biochim Biophys Acta Rev Cancer. 2020;1873(1):188314. doi:10.1016/j.bbcan.2019.188314
7. Liu CY, Chen KF, Chen PJ. Treatment of Liver Cancer. Cold Spring Harb Perspect Med. 2015;5(9):a021535. doi:10.1101/cshperspect.a021535
8. Rajendran L, Ivanics T, Claasen MP, et al. The management of post-transplantation recurrence of hepatocellular carcinoma. Clin Mol Hepatol. 2022;28(1):1–16. doi:10.3350/cmh.2021.0217
9. Santhakumar C, Gane EJ, Liu K, et al. Current perspectives on the tumor microenvironment in hepatocellular carcinoma. Hepatol Int. 2020;14(6):947–957. doi:10.1007/s12072-020-10104-3
10. Chute CG. Clinical classification and terminology: some history and current observations. J Am Med Inform Assoc. 2000;7(3):298–303. doi:10.1136/jamia.2000.0070298
11. Berlth F, Bollschweiler E, Drebber U, et al. Pathohistological classification systems in gastric cancer: diagnostic relevance and prognostic value. World J Gastroenterol. 2014;20(19):5679–5684. doi:10.3748/wjg.v20.i19.5679
12. Wang L, Su M, Zhang M, et al. Accurate Prediction of Prognosis by Integrating Clinical and Molecular Characteristics in Colon Cancer. Front Cell Dev Biol. 2021;9:664415. doi:10.3389/fcell.2021.664415
13. Chen S, Li Y, Qian L, et al. A Review of the Clinical Characteristics and Novel Molecular Subtypes of Endometrioid Ovarian Cancer. Front Oncol. 2021;11:668151. doi:10.3389/fonc.2021.668151
14. Wang K, He H, Feng X. Construction of Metabolic Molecular Classification and Immune Characteristics for the Prognosis Prediction of Ovarian Cancer. J Immunol Res. 2022;2022:2359349. doi:10.1155/2022/2359349
15. Long S, Chen Y, Wang Y, et al. Identification of Ferroptosis-related molecular model and immune subtypes of hepatocellular carcinoma for individual therapy. Cancer Med. 2023;12(2):2134–2147. doi:10.1002/cam4.5032
16. Haselkorn R, Rothman-Denes LB. Protein synthesis. Annu Rev Biochem. 1973;42(1):397–438. doi:10.1146/annurev.bi.42.070173.002145
17. Bard JAM, Goodall EA, Greene ER, et al. Structure and Function of the 26S Proteasome. Annu Rev Biochem. 2018;87:697–724. doi:10.1146/annurev-biochem-062917-011931
18. Çetin G, Klafack S, Studencka-Turski M, et al. The Ubiquitin-Proteasome System in Immune Cells. Biomolecules. 2021;11(1):60. doi:10.3390/biom11010060
19. Park J, Cho J, Song EJ. Ubiquitin-proteasome system (UPS) as a target for anticancer treatment. Arch Pharm Res. 2020;43(11):1144–1161. doi:10.1007/s12272-020-01281-8
20. Devoy A, Soane T, Welchman R, et al. The ubiquitin-proteasome system and cancer. Essays Biochem. 2005;41:187–203. doi:10.1042/bse0410187
21. Aliabadi F, Sohrabi B, Mostafavi E, et al. Ubiquitin-proteasome system and the role of its inhibitors in cancer therapy. Open Biol. 2021;11(4):200390. doi:10.1098/rsob.200390
22. Chen D, Frezza M, Schmitt S, et al. Bortezomib as the first proteasome inhibitor anticancer drug: current status and future perspectives. Curr Cancer Drug Targets. 2011;11(3):239–253. doi:10.2174/156800911794519752
23. Arkwright R, Pham TM, Zonder JA, et al. The preclinical discovery and development of bortezomib for the treatment of mantle cell lymphoma. Expert Opin Drug Discov. 2017;12(2):225–235. doi:10.1080/17460441.2017.1268596
24. Qing W, Xing X, Feng D, et al. Indocyanine green loaded pH-responsive bortezomib supramolecular hydrogel for synergistic chemo-photothermal/photodynamic colorectal cancer therapy. Photodiagnosis Photodyn Ther. 2021;36:102521. doi:10.1016/j.pdpdt.2021.102521
25. Tsumagari K, Abd Elmageed ZY, Sholl AB, et al. Bortezomib sensitizes thyroid cancer to BRAF inhibitor in vitro and in vivo. Endocr Relat Cancer. 2018;25(1):99–109. doi:10.1530/ERC-17-0182
26. Wu P, Oren O, Gertz MA, et al. Proteasome Inhibitor-Related Cardiotoxicity: mechanisms, Diagnosis, and Management. Curr Oncol Rep. 2020;22(7):66. doi:10.1007/s11912-020-00931-w
27. Yamamoto S, Egashira N. Pathological Mechanisms of Bortezomib-Induced Peripheral Neuropathy. Int J Mol Sci. 2021;22(2):888. doi:10.3390/ijms22020888
28. Blum A, Wang P, Zenklusen JC. SnapShot: TCGA-Analyzed Tumors. Cell. 2018;173(2):530. doi:10.1016/j.cell.2018.03.059
29. Falkenberg KJ, Newbold A, Gould CM, et al. A genome scale RNAi screen identifies GLI1 as a novel gene regulating vorinostat sensitivity. Cell Death Differ. 2016;23(7):1209–1218. doi:10.1038/cdd.2015.175
30. Meng Y, Zhao Q, An L, et al. A TNFR2-hnRNPK Axis Promotes Primary Liver Cancer Development via Activation of YAP Signaling in Hepatic Progenitor Cells. Cancer Res. 2021;81(11):3036–3050. doi:10.1158/0008-5472.CAN-20-3175
31. Wilkerson MD, Hayes DN. ConsensusClusterPlus: a class discovery tool with confidence assessments and item tracking. Bioinformatics. 2010;26(12):1572–1573. doi:10.1093/bioinformatics/btq170
32. Ritchie ME, Phipson B, Wu D, et al. limma powers differential expression analyses for RNA-sequencing and microarray studies. Nucleic Acids Res. 2015;43(7):e47. doi:10.1093/nar/gkv007
33. Subramanian A, Tamayo P, Mootha VK, et al. Gene set enrichment analysis: a knowledge-based approach for interpreting genome-wide expression profiles. Proc Natl Acad Sci U S A. 2005;102(43):15545–15550. doi:10.1073/pnas.0506580102
34. Yu G, Wang L-G, Han Y, et al. clusterProfiler: an R package for comparing biological themes among gene clusters. Omics. 2012;16(5):284–287. doi:10.1089/omi.2011.0118
35. Collaborators. Gene Ontology Consortium: going forward. Nucleic Acids Res. 2015;43(D1):D1049–56. doi:10.1093/nar/gku1179
36. Kanehisa M, Goto S. KEGG: Kyoto encyclopedia of genes and genomes. Nucleic Acids Res. 2000;28(1):27–30. doi:10.1093/nar/28.1.27
37. Song WM, Zhang B. Multiscale Embedded Gene Co-expression Network Analysis. PLoS Comput Biol. 2015;11(11):e1004574. doi:10.1371/journal.pcbi.1004574
38. Wang S, Su W, Zhong C, et al. An Eight-CircRNA Assessment Model for Predicting Biochemical Recurrence in Prostate Cancer. Front Cell Dev Biol. 2020;8:599494. doi:10.3389/fcell.2020.599494
39. Li T, Fan J, Wang B, et al. TIMER: a Web Server for Comprehensive Analysis of Tumor-Infiltrating Immune Cells. Cancer Res. 2017;77(21):e108–e110. doi:10.1158/0008-5472.CAN-17-0307
40. Chen B, et al. Profiling Tumor Infiltrating Immune Cells with CIBERSORT. Methods Mol Biol. 2018;1711:243–259.
41. Zhu K, Xiaoqiang L, Deng W, et al. Development and validation of a novel lipid metabolism-related gene prognostic signature and candidate drugs for patients with bladder cancer. Lipids Health Dis. 2021;20(1):146. doi:10.1186/s12944-021-01554-1
42. Plattner C, Finotello F, Rieder D. Deconvoluting tumor-infiltrating immune cells from RNA-seq data using quanTIseq. Methods Enzymol. 2020;636:261–285.
43. Lu H, Wu J, Liang L, et al. Identifying a Novel Defined Pyroptosis-Associated Long Noncoding RNA Signature Contributes to Predicting Prognosis and Tumor Microenvironment of Bladder Cancer. Front Immunol. 2022;13:803355. doi:10.3389/fimmu.2022.803355
44. Aran D, Hu Z, Butte AJ. xCell: digitally portraying the tissue cellular heterogeneity landscape. Genome Biol. 2017;18(1):220. doi:10.1186/s13059-017-1349-1
45. Yang Z, Wei X, Pan Y, et al. A new risk factor indicator for papillary thyroid cancer based on immune infiltration. Cell Death Dis. 2021;12(1):51. doi:10.1038/s41419-020-03294-z
46. Collins GA, Goldberg AL. The Logic of the 26S Proteasome. Cell. 2017;169(5):792–806. doi:10.1016/j.cell.2017.04.023
47. Xie Y. Structure, assembly and homeostatic regulation of the 26S proteasome. J Mol Cell Biol. 2010;2(6):308–317. doi:10.1093/jmcb/mjq030
48. Rousseau A, Bertolotti A. Regulation of proteasome assembly and activity in health and disease. Nat Rev Mol Cell Biol. 2018;19(11):697–712. doi:10.1038/s41580-018-0040-z
49. Xie Y. Feedback regulation of proteasome gene expression and its implications in cancer therapy. Cancer Metastasis Rev. 2010;29(4):687–693. doi:10.1007/s10555-010-9255-y
50. Chen L, Brewer MD, Guo L, et al. Enhanced Degradation of Misfolded Proteins Promotes Tumorigenesis. Cell Rep. 2017;18(13):3143–3154. doi:10.1016/j.celrep.2017.03.010
51. Jan M, Sperling AS, Ebert BL. Cancer therapies based on targeted protein degradation - lessons learned with lenalidomide. Nat Rev Clin Oncol. 2021;18(7):401–417. doi:10.1038/s41571-021-00479-z
52. Aubrey BJ, Strasser A, Kelly GL. Tumor-Suppressor Functions of the TP53 Pathway. Cold Spring Harb Perspect Med. 2016;6:5. doi:10.1101/cshperspect.a026062
53. Olivier M, Hollstein M, Hainaut P. TP53 mutations in human cancers: origins, consequences, and clinical use. Cold Spring Harb Perspect Biol. 2010;2(1):a001008. doi:10.1101/cshperspect.a001008
54. Li Z, Pearlman AH, Hsieh P. DNA mismatch repair and the DNA damage response. DNA Repair (Amst). 2016;38:94–101. doi:10.1016/j.dnarep.2015.11.019
55. Zhang Y, Tseng JT, Lien IC, et al. mRNAsi Index: machine Learning in Mining Lung Adenocarcinoma Stem Cell Biomarkers. Genes. 2020;11(3):257.
56. Najafi M, Mortezaee K, Majidpoor J. Cancer stem cell (CSC) resistance drivers. Life Sci. 2019;234:116781. doi:10.1016/j.lfs.2019.116781
57. Kapetanou M, Chondrogianni N, Petrakis S, et al. Proteasome activation enhances stemness and lifespan of human mesenchymal stem cells. Free Radic Biol Med. 2017;103:226–235. doi:10.1016/j.freeradbiomed.2016.12.035
58. Vilchez D, Boyer L, Morantte I, et al. Increased proteasome activity in human embryonic stem cells is regulated by PSMD11. Nature. 2012;489(7415):304–308. doi:10.1038/nature11468
59. Yang Y, Cao L, Guo Z, et al. Deubiquitinase UCHL5 stabilizes ELK3 to potentiate cancer stemness and tumor progression in pancreatic adenocarcinoma (PAAD). Exp Cell Res. 2022;421(2):113402. doi:10.1016/j.yexcr.2022.113402
60. Giannelli G, Koudelkova P, Dituri F, et al. Role of epithelial to mesenchymal transition in hepatocellular carcinoma. J Hepatol. 2016;65(4):798–808. doi:10.1016/j.jhep.2016.05.007
61. He S, Cao R, Mao Y, et al. Alternative splicing of PSMD13 mediated by genetic variants is significantly associated with endometrial cancer risk. J Gynecol Oncol. 2023;34. doi:10.3802/jgo.2023.34.e40
62. Xuan DTM, Wu -C-C, Kao T-J, et al. Prognostic and immune infiltration signatures of proteasome 26S subunit, non-ATPase (PSMD) family genes in breast cancer patients. Aging. 2021;13(22):24882–24913. doi:10.18632/aging.203722
63. Salah Fararjeh A, Al-Khader A, Al-Saleem M, et al. The Prognostic Significance of Proteasome 26S Subunit, Non-ATPase (PSMD) Genes for Bladder Urothelial Carcinoma Patients. Cancer Inform. 2021;20:11769351211067692. doi:10.1177/11769351211067692
64. Zhu X, Li S, Xu B, et al. Cancer evolution: a means by which tumors evade treatment. Biomed Pharmacother. 2021;133:111016. doi:10.1016/j.biopha.2020.111016
65. Ligorio M, Sil S, Malagon-Lopez J, et al. Stromal Microenvironment Shapes the Intratumoral Architecture of Pancreatic Cancer. Cell. 2019;178(1):160–175.e27. doi:10.1016/j.cell.2019.05.012
66. Kaushik N, Kim S, Suh Y, et al. Proinvasive extracellular matrix remodeling for tumor progression. Arch Pharm Res. 2019;42(1):40–47. doi:10.1007/s12272-018-1097-0
67. de Miranda MC, Melo MIAD, Cunha PDS, et al. Roles of mesenchymal stromal cells in the head and neck cancer microenvironment. Biomed Pharmacother. 2021;144:112269. doi:10.1016/j.biopha.2021.112269
68. Nilendu P, Sarode SC, Jahagirdar D, et al. Mutual concessions and compromises between stromal cells and cancer cells: driving tumor development and drug resistance. Cell Oncol. 2018;41(4):353–367. doi:10.1007/s13402-018-0388-2
69. Atiya H, et al. Mesenchymal Stem Cells in the Tumor Microenvironment. Adv Exp Med Biol. 2020;1234:31–42.
70. Chen DS, Mellman I. Elements of cancer immunity and the cancer-immune set point. Nature. 2017;541(7637):321–330. doi:10.1038/nature21349
71. Dzobo K, Senthebane DA, Dandara C. The Tumor Microenvironment in Tumorigenesis and Therapy Resistance Revisited. Cancers. 2023;15(2). doi:10.3390/cancers15020376
 © 2023 The Author(s). This work is published and licensed by Dove Medical Press Limited. The
full terms of this license are available at https://www.dovepress.com/terms
and incorporate the Creative Commons Attribution
- Non Commercial (unported, 3.0) License.
By accessing the work you hereby accept the Terms. Non-commercial uses of the work are permitted
without any further permission from Dove Medical Press Limited, provided the work is properly
attributed. For permission for commercial use of this work, please see paragraphs 4.2 and 5 of our Terms.
© 2023 The Author(s). This work is published and licensed by Dove Medical Press Limited. The
full terms of this license are available at https://www.dovepress.com/terms
and incorporate the Creative Commons Attribution
- Non Commercial (unported, 3.0) License.
By accessing the work you hereby accept the Terms. Non-commercial uses of the work are permitted
without any further permission from Dove Medical Press Limited, provided the work is properly
attributed. For permission for commercial use of this work, please see paragraphs 4.2 and 5 of our Terms.
Recommended articles
High Expression of Heterogeneous Nuclear Ribonucleoprotein A1 Facilitates Hepatocellular Carcinoma Growth
Cao Z, Guan L, Yu R, Yang F, Chen J
Journal of Hepatocellular Carcinoma 2023, 10:517-530
Published Date: 1 April 2023
An Analysis Regarding the Association Between the Nuclear Pore Complex (NPC) and Hepatocellular Carcinoma (HCC)
Huang P, Hu YD, Liu YJ, Li JP, Zhang YH
Journal of Hepatocellular Carcinoma 2023, 10:959-978
Published Date: 22 June 2023
TRIM55 Promotes Proliferation of Hepatocellular Carcinoma Through Stabilizing TRIP6 to Activate Wnt/β-Catenin Signaling

Lu X, Yuan Y, Cai N, Rao D, Chen M, Chen X, Zhang B, Liang H, Zhang L
Journal of Hepatocellular Carcinoma 2023, 10:1281-1293
Published Date: 3 August 2023
Hsa_circ_0007991 Promotes Immune Evasion in Hepatocellular Carcinoma via Regulation of the miR-505-3p/CANX Axis
Wang L, Liang L, Qian J, Yu C, Shi Y, Yan X, Chen X
Journal of Hepatocellular Carcinoma 2025, 12:1337-1351
Published Date: 7 July 2025
FAM105B Promotes Hepatocellular Carcinoma Progression and Metastasis by Activating the PI3K/AKT/MTOR Signaling Pathway and Inducing Epithelial-Mesenchymal Transition
Yang LL, Chen X, Tang ST, Huang KT, Ye GY, Wang JL
Journal of Hepatocellular Carcinoma 2025, 12:1541-1555
Published Date: 22 July 2025