
Back to Journals » International Journal of General Medicine » Volume 18
A Mortality Risk Prediction Model for Septic Shock in Patients Aged ≥50: Role of Norepinephrine Index and Procalcitonin
Authors Li XL  , Mi T, Liu C , Feng M
Received 4 February 2025
Accepted for publication 27 May 2025
Published 10 June 2025 Volume 2025:18 Pages 3045—3062
DOI https://doi.org/10.2147/IJGM.S520290
Checked for plagiarism Yes
Review by Single anonymous peer review
Peer reviewer comments 2
Editor who approved publication: Dr Gauri Agarwal
Xue-Lin Li,1,2,* Te Mi,1,2,* Cancan Liu,1,2 Mingchen Feng1,2
1Department of Intensive Care Unit, Jining No. 1 People’s Hospital, Shandong First Medical University, Jining, People’s Republic of China; 2Jining Critical Care Diagnosis and Treatment Center, Jining, People’s Republic of China
*These authors contributed equally to this work
Correspondence: Mingchen Feng, Department of Intensive Care Unit, Jining No. 1 People’s Hospital, Shandong First Medical University, Jining, 272000, People’s Republic of China, Email [email protected]
Background: Septic shock is a high-mortality syndrome, particularly in patients aged 50 and older. Predicting mortality in this population is challenging due to clinical heterogeneity and limitations of traditional scoring systems like SOFA and APACHE II. This study aimed to develop and validate a predictive model using norepinephrine index (NEI)—a novel biomarker defined as the norepinephrine dose administered within the first 24 hours of ICU admission divided by BMI and 24 hours—and procalcitonin (PCT) to improve risk stratification and clinical decision-making.
Methods: A retrospective cohort of 94 patients aged ≥ 50 years with septic shock was analyzed. Key clinical variables within the first 24 hours were collected, and univariate and stepwise logistic regression identified predictors of 28-day mortality. The model’s performance was evaluated with ROC curves, AUC, and confusion matrices, alongside internal validation through stratified analysis, bootstrap resampling, and training-test splits. External validation was conducted in an independent cohort of 57 patients.
Results: The final model incorporating NEI and PCT achieved an AUC of 0.91, outperforming individual biomarkers (NEI: AUC = 0.86; PCT: AUC = 0.69). Nonlinear analysis identified NEI > 4mg· m² / (kg· 24h) and PCT < 50 ng/mL as critical thresholds for high mortality risk.
Conclusion: The NEI and PCT-based prognostic model provides a reliable tool for predicting 28-day mortality in septic shock patients aged 50 and above. However, as a single-center study with a relatively small sample size, the generalizability of these findings may be limited. Future multicenter studies with larger sample sizes are necessary to validate this model’s applicability across populations. This model holds potential to optimize clinical management, enabling timely interventions such as more intensive hemodynamic support and infection control.
Keywords: septic shock, mortality prediction, norepinephrine index, procalcitonin, machine learning, risk stratification
Introduction
Septic shock is an exceedingly complex clinical syndrome, typically characterized by acute inflammatory responses, immune system dysregulation, microvascular dysfunction, and alterations in tissue perfusion physiology.1,2 Its management requires prompt anti-infective therapy, fluid resuscitation, and hemodynamic support.3 However, the high clinical heterogeneity of septic shock makes it particularly challenging to predict patient mortality risk accurately, as presentations vary significantly across individuals.4
Septic shock is associated with high mortality rates and a complex clinical course, with prognosis influenced by numerous factors including age, comorbidities, site of infection, and the promptness of treatment.3,5 Notably, immune function progressively declines with age, particularly in the middle-aged and elderly populations, and is frequently accompanied by chronic diseases, resulting in a greater physiological burden, poorer treatment responses, and more complicated prognoses in these patients with septic shock.6,7 The United Nations projects that by 2050, the global elderly population will reach 2.1 billion, constituting 22% of the world population.8 Additionally, studies have shown that mortality rates for septic shock significantly increase in individuals aged 50 and above, with inpatient mortality rates for patients over 80 being twice as high as those for patients under 50.9 Concurrently, economic development and advancements in medical care have led to a rising proportion of middle-aged and elderly patients in intensive care units and critical care settings. Consequently, the treatment and prognosis of septic shock patients aged 50 and above have become major clinical and societal challenges. Despite the increasing prevalence of middle-aged and elderly patients, particularly those aged 50 and above, in critical care settings, research on predictive models for sepsis in this population remains scarce.10 Therefore, accurately assessing mortality risk in patients aged 50 and above with septic shock is crucial for developing personalized treatment strategies and improving survival outcomes.
Although biomarkers like procalcitonin (PCT) and C-reactive protein (CRP) have been widely used in septic shock diagnosis and prognosis, they have notable limitations. These traditional biomarkers often lack sufficient sensitivity and specificity, making them unreliable in immunosuppressed individuals, where their levels may not correlate with infection severity.11 Additionally, current biomarkers primarily assess inflammatory responses or metabolic disturbances but fail to capture the full complexity of septic shock, especially in elderly patients who often present with subtle inflammatory responses and altered immune functions.1 Single biomarkers like PCT are insufficient for comprehensive risk stratification, as they do not address the multifactorial nature of sepsis, including hemodynamic instability, immune dysfunction, and metabolic derangements.12 Despite the utility of biomarkers like CRP and PCT, these markers often fail to provide accurate mortality risk predictions in elderly septic shock patients due to their inability to capture the multi-dimensional nature of sepsis, such as immune dysfunction and metabolic disturbances, as highlighted in previous studies.13 These limitations highlight the need for more integrated and dynamic biomarkers, capable of offering a personalized assessment of mortality risk, particularly in the elderly.
However, traditional scoring systems like the Sequential Organ Failure Assessment (SOFA) and the Acute Physiology and Chronic Health Evaluation II (APACHE II),14,15 despite incorporating multiple laboratory indicators, have limitations.16 These systems primarily assess organ dysfunction and inflammatory markers but fail to account for age-related changes, such as immune senescence and chronic comorbidities, common in older adults.1 This makes them less accurate for mortality prediction in the elderly, as they do not capture the altered immune and metabolic responses that are crucial in this population.9 Additionally, comorbidities like diabetes, hypertension, cardiovascular diseases, and renal insufficiency further complicate the interpretation of these models, as they impair organ function and hinder the body’s ability to cope with critical illness, leading to worse outcomes that are not fully captured by SOFA or APACHE II.5
Norepinephrine (NE) is a widely used vasopressor for treating septic shock, with its dosage closely linked to patient mortality risk. High doses of NE indicate severe illness, requiring stronger vasoconstrictive effects to maintain hemodynamic stability, reflecting intense stress responses and cardiovascular dysfunction.17,18 Unlike traditional biomarkers such as lactate or CRP, which primarily assess metabolic derangements or inflammation, the Norepinephrine Index (NEI) incorporates the dose of norepinephrine, body mass index (BMI), and the duration of norepinephrine administration. These variables offer a more dynamic and personalized understanding of circulatory and metabolic function, particularly in elderly patients, who often present with subtle inflammatory responses and are more prone to circulatory and metabolic dysfunction.1 This makes NEI a more suitable marker for assessing the complex pathophysiological status of older patients with septic shock.
The Norepinephrine Index (NEI), which reflects both norepinephrine dosage and metabolic response, offers a comprehensive approach to mortality prediction in septic shock, especially when combined with procalcitonin (PCT), a well-established biomarker for bacterial infections,19,20 PCT indicates infection severity, while NEI provides insights into hemodynamic and metabolic responses, which are critical in septic shock, particularly in older adults with immune senescence and reduced inflammatory responses.21 Together, these biomarkers improve risk stratification by capturing both infection severity and physiological stability, enhancing mortality prediction accuracy.
Machine learning (ML) effectively handles complex interactions and non-linearities, improving predictive accuracy and model interpretability.22 Unlike traditional models, ML algorithms utilize large, high-dimensional datasets to capture complex relationships among clinical, demographic, and biomarker data.23 For example, biomarkers like Norepinephrine Index (NEI) and Procalcitonin (PCT) may have non-linear effects on mortality prediction, which traditional models cannot account for. By integrating diverse biomarkers and accounting for interactions between age-related factors, immune dysfunction, and comorbidities, ML improves risk stratification and prediction accuracy beyond the linear assumptions of traditional models like SOFA and APACHE II. Techniques like random forests, support vector machines, and neural networks allow ML models to learn from data without predefined assumptions, enabling more robust modeling of septic shock mortality and better personalized predictions.24 By incorporating NEI, PCT, and other clinical data, ML models can identify subtle patterns, improving mortality predictions, especially when traditional scoring systems fall short. Integrating novel biomarkers, reconstructing existing models, and validating them externally are crucial to enhancing the accuracy and reliability of mortality prediction in septic shock patients.25–28
Effective mortality prediction requires multiple validation methods to assess a model’s generalizability and clinical applicability. Methods like stratified validation, bootstrap validation, training-test partitioning, and external dataset validation strengthen the model’s reliability and robustness.29–32 External dataset validation, in particular, is essential for evaluating a model’s adaptability across diverse datasets, ensuring its generalizability and clinical utility.33
Current sepsis management faces challenges, including limited attention to middle-aged and elderly patients, the low predictive accuracy of single biomarkers, and inadequate validation methods. This study aims to develop a mortality risk prognostic model for septic shock patients aged 50 and above by integrating multiple biomarkers and rigorously validating its clinical utility. We will construct the prediction model using retrospective clinical data, applying univariate analysis and stepwise logistic regression. The model’s performance will be evaluated using metrics such as AUC, ROC curves, and calibration curves. To ensure robustness and clinical applicability, we will employ multiple validation techniques, including stratified, bootstrap, training-testing splits, and external dataset validation. Ultimately, this study aims to create a precise tool for mortality risk assessment in middle-aged and elderly septic shock patients, enabling personalized treatment strategies and improving survival outcomes.
Materials and Methods
Study Design and Patients
This retrospective cohort study aims to develop a predictive model for septic shock outcomes. The study includes ICU patients aged ≥50 years at Jining No. 1 People’s Hospital, between January 2022 and July 2024, diagnosed with septic shock and with a length of stay >24 hours. The external validation cohort consists of septic shock patients hospitalized for >24 hours between August and October 2024, with no age restrictions. Patient data were extracted from anonymized electronic medical records, with sepsis and septic shock diagnoses based on the Third International Consensus Definition.34 Exclusion criteria were: 1) admission <24 hours; 2) missing information; 3) long-term use of anticoagulants, corticosteroids, or medications that induce inflammatory mediator release; 4) concurrent hematologic disorders or severe conditions (eg, Child-Pugh Class C liver disease, end-stage renal disease, or NYHA Class IV heart failure); 5) cancer patients. Based on the inclusion and exclusion criteria, 151 out of 932 septic shock patients were eligible and enrolled in the study (Figure 1). The study was approved by the Ethics Committee of the Jining No. 1 People’s Hospital (Approval No. 2024-IIT-074), and informed consent was waived due to its retrospective design.
 |
Figure 1 Study flowchart. |
Data Collection and Definition
Demographic and clinical data were collected, including sex, age, and clinical parameters within the first 24 hours following septic shock diagnosis. These parameters included the Glasgow Coma Scale (GCS), SOFA score, APACHE II score, oxygenation index (OI), and biochemical markers (eg, CRP, WBC, PLT, lymphocyte count, neutrophil count, hemoglobin, IL-6, PCT, creatinine, total bilirubin, albumin, prothrombin time, APTT, fibrinogen, D-dimer), as well as lactate levels measured before and 24 hours after initial resuscitation (LAC, LAC24) and lactate clearance rate (LCR). Norepinephrine use was recorded, including the total norepinephrine dose (D) and the calculated norepinephrine index (NEI). NEI was defined as: NEI = D / (BMI × T), where D is the cumulative norepinephrine dose administered within the first 24 hours of ICU admission, expressed in micrograms (mg); BMI is calculated in kilograms per square meter (kg/m²); and T represents the duration of norepinephrine administration, which was fixed at 24 hours for all patients; and its unit is mg· m² / (kg· 24h). This fixed 24-hour window was selected to reflect the early-phase hemodynamic instability of septic shock—when vasopressor requirements are most indicative of illness severity—and to standardize NEI calculation across the cohort. The primary outcome was 28-day mortality, defined as death within 28 days of septic shock diagnosis, irrespective of discharge status. Patients who died within this period were classified as deceased, while those who survived were classified as survivors.
Statistical Analysis
For normally distributed continuous data, values are expressed as mean ± standard deviation (x ± s), and comparisons are made using the t-test. For non-normally distributed data, values are presented as median (interquartile range) [M (QL, QU)], with comparisons using the Mann–Whitney U-test. Categorical data are expressed as frequencies (percentages), with comparisons performed using the chi-square test or Fisher’s exact test. All analyses were conducted using R software version 4.2.2 (http://www.r-project.org/) and SPSS Statistics version 26.0 (IBM Corp, Armonk, NY, USA), with p-values < 0.05 considered statistically significant. To assess whether the sample sizes of the internal (n = 94) and external (n = 57) validation cohorts were sufficient to detect the observed predictive performance, a post hoc power analysis was performed. DeLong’s method for AUC-based power estimation was used to calculate the power for each cohort. This analysis was conducted to ensure that the study was statistically well-powered to detect meaningful predictive performance.
Variable Selection and Model Construction
We performed univariate logistic regression to identify variables significantly associated with 28-day mortality (P < 0.05), and significant variables were entered into a stepwise logistic regression model using forward selection. Key variables were selected based on the Akaike Information Criterion (AIC) and Bayesian Information Criterion (BIC),35 which balance model fit with complexity. During stepwise regression, variables with P < 0.05 or those reducing AIC/BIC were retained, while variables with P > 0.10 or improving AIC/BIC upon exclusion were removed, resulting in a preliminary 28-day mortality risk model. To assess model stability, multicollinearity was tested using variance inflation factors (VIF) and tolerance,36 with variables having VIF > 10 or tolerance < 0.1 being considered highly collinear and reevaluated. To address complete separation and enhance model stability, stepwise regression was combined with Lasso regression, which uses L1 regularization to shrink coefficients of less important variables and mitigate overfitting.37 The optimal λ value was determined via 10-fold cross-validation,38 and validate the model optimization effectiveness with AIC/BIC variation plots. This approach validated the stability of the selected variables, ensuring a reliable and stable final model.39
We chose logistic regression with stepwise selection for variable selection due to its simplicity, interpretability, and clinical applicability. Logistic regression provides clear insights into the relationship between predictors and outcomes, which is essential for clinical decision-making, especially in high-stakes situations like septic shock management. While more complex machine learning models, such as random forests or XGBoost, could offer higher predictive accuracy, they tend to be less interpretable and may not be as useful in clinical settings where understanding predictor-outcome relationships is crucial. Additionally, logistic regression is robust to overfitting, especially in small datasets like ours, and the stepwise selection process helps to avoid overfitting while focusing on the most clinically relevant variables.
Model Performance Evaluation
ROC Curve and Confusion Matrix
Model performance was evaluated using the ROC curve and area under the curve (AUC). The ROC curve illustrates the relationship between false positive rate (FPR) and true positive rate (TPR), while the AUC quantifies overall performance. An AUC ≥ 0.9 indicates excellent performance, 0.8–0.9 good, 0.7–0.8 moderate, and < 0.6 poor, requiring further evaluation.40
The confusion matrix provides key metrics for model evaluation. Sensitivity is the proportion of correctly predicted positive cases (TP / [TP + FN]), while Specificity represents the proportion of correctly predicted negative cases (TN / [TN + FP]). Accuracy measures overall classification performance and is calculated as (TP + TN) / (TP + FP + TN + FN). These metrics allow for a comprehensive assessment of the model’s ability to distinguish between high-risk (eg, mortality) and low-risk (eg, survival) patients.
Feature Importance Analysis
Variable importance was assessed based on the standardized regression coefficients of the logistic regression model. The magnitude of each coefficient reflects the impact of the corresponding variable on predictions.41
SHAP Analysis
To enhance model interpretability, SHAP (SHapley Additive exPlanations) values were applied. SHAP values quantify each variable’s contribution to the model’s prediction, revealing both the direction and magnitude of its influence.42
Model Validation Methods
To ensure model reliability and stability, we employed the following validation techniques.
Age-Stratified Validation
The sample was divided into three age groups: 50–65, 65–80, and >80 years. ROC curves and AUC values were calculated for each group to assess model performance across age ranges, ensuring stability and generalizability.
Bootstrap Validation
We performed 1000 bootstrap resampling iterations to generate datasets and calculate the average AUC with 95% confidence intervals (CI). This assessed the model’s robustness and adaptability to random variations.43 Additionally, varying noise levels (0.01–0.08) were introduced to test model stability under noise.44
Internal Training and Test Set Split
The dataset was randomly split into a 70% training set and 30% test set. Ten-fold cross-validation was used to calculate the average AUC for the training set. ROC curves, confusion matrices, and precision-recall (PR) curves were compared between the training and test sets to assess consistency.45
External Validation
An independent external validation cohort (n = 57) was used to assess model performance. AUC, 95% CI, calibration curves (1000 bootstrap iterations), and decision curve analysis (DCA) were performed to evaluate model reliability and clinical applicability.46
Decision Tree and Nonlinear Effect Analysis
We used recursive partitioning to construct decision trees,47 selecting the variable that maximized data purity at each split. To prevent overfitting, we set the minimum sample size to 10 and adjusted the complexity parameter (cp = 0.01). The decision tree stratified patients into risk groups and identified key cutoff values for clinical risk assessment. For nonlinear effect analysis, we applied a natural cubic splines regression model.39 Independent variables were log-transformed to reduce skewness and express predicted probabilities as log-odds for interpretability. Other variables were fixed at their median values to control for confounding. The nonlinear effects of each variable were visualized to highlight their curvilinear relationships with the outcome.
Results
Population Characteristics
This study included 94 patients with septic shock for model development (internal set), comprising 66 males (70.21%) and 28 females (29.79%). Based on their 28-day outcomes, patients were stratified into the survival group (n = 48) and the mortality group (n = 46). Statistically significant differences (P < 0.05) were observed between the two groups in terms of OI, SOFA, PCT, LCR, and NEI. Detailed data are provided in Table 1.
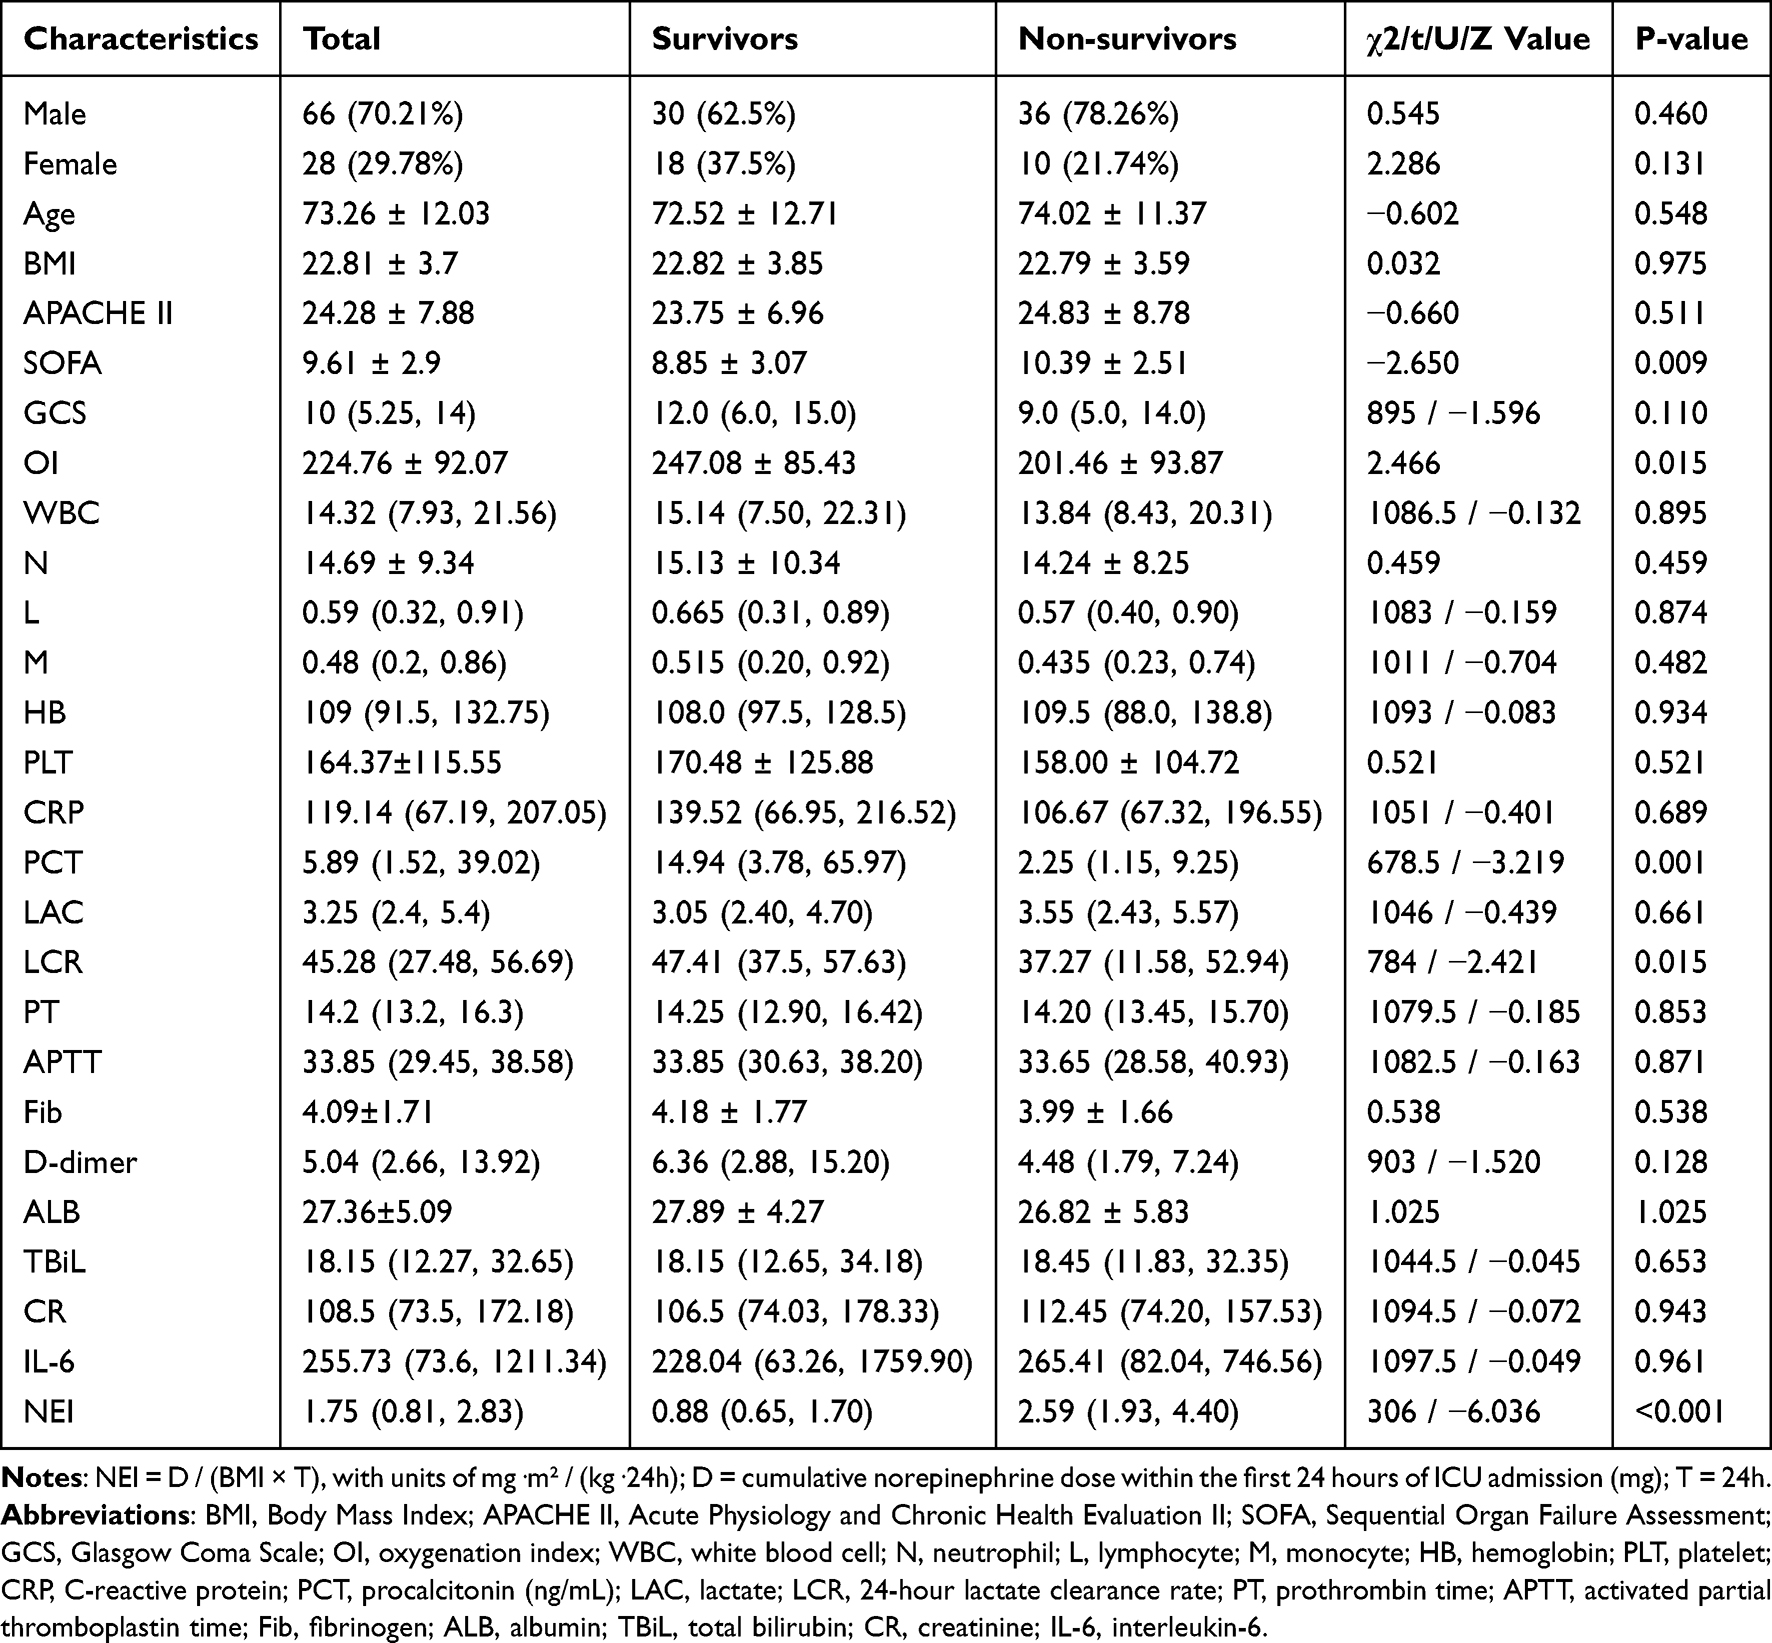 |
Table 1 Characteristics of Septic Shock Patients, Including Demographic and Clinical Parameters, for the Total Population, Survivors, and Non-Survivors |
Predictive Model for Mortality Risk: Logistic Regression and Regularization
Univariate logistic regression identified OI, SOFA, PCT, LCR, and NEI as significant predictors of mortality risk (P < 0.05). Stepwise logistic regression (PIN = 0.05, POUT = 0.10) refined the model, retaining NEI and PCT as the strongest predictors of 28-day mortality, while excluding SOFA, LCR, and OI due to minimal contributions (Table 2).
 |
Table 2 Significant Variables From Univariate Logistic Analysis and Stepwise Logistic Regression in Patients with Septic Shock |
Collinearity diagnostics (VIF and tolerance) confirmed no significant issues for NEI and PCT, supporting their inclusion. To address complete separation and enhance model stability, L1 regularization (Lasso) was applied. Using 10-fold cross-validation, λ.min was selected as the optimal regularization parameter, minimizing AIC (74.40) and BIC (79.48) (Figure 2A and B). L1 regularization progressively shrank weaker variable coefficients to zero, preserving the stability of NEI and PCT as key predictors (Figure 2C). The final model, focused on NEI and PCT as key predictors, provided stable and optimized predictions for 28-day mortality risk, highlighting their critical role in septic shock risk assessment.
 |
Figure 2 Development of the predictive model for mortality risk. (A) Selection of optimal regularization parameters (λ.min and λ.1se) using 10-fold cross-validation based on binomial deviance. (B) AIC and BIC reach their lowest values at λ.min (AIC = 74.40, BIC = 79.48). (C) Coefficient shrinkage with increasing regularization strength (λ), where weaker variables are progressively compressed to zero, while key predictors (NEI and PCT) remain stable. The final model highlights NEI and PCT as critical predictors of 28-day mortality risk in septic shock patients. Cumulative norepinephrine dose within the first 24 hours of ICU admission (mg) / (BMI × 24h), unit: mg· m² / (kg· 24h). Abbreviations: NEI, norepinephrine index; PCT, procalcitonin (ng/mL). |
Model Performance Evaluation: ROC, Feature Importance, and SHAP
The model’s predictive performance was evaluated using the ROC curve and AUC with 95% confidence intervals (CI) (Figure 3A). The final model (NEI + PCT) achieved an AUC of 0.91 (95% CI: 0.86–0.97), outperforming NEI (AUC = 0.86, 95% CI: 0.79–0.93) and PCT (AUC = 0.69, 95% CI: 0.59–0.80). The multivariable model (NEI + PCT) enhanced 28-day mortality prediction accuracy by 5.3% and 32.0% compared to NEI and PCT alone, respectively.
 |
Figure 3 Performance evaluation of the predictive model for mortality risk. (A) ROC curves comparing the multivariable model (NEI + PCT) with NEI and PCT alone, showing the highest AUC for the multivariable model (AUC = 0.91, 95% CI: 0.86–0.97). (B) Confusion matrix analysis illustrating overall accuracy (85.11%), sensitivity (86.96%), and specificity (83.33%). False positives indicate patients incorrectly predicted to die, while false negatives represent missed high-risk cases. (C) Standardized regression coefficients indicating NEI as the dominant predictor of 28-day mortality. (D) SHAP analysis confirming NEI’s primary contribution and PCT’s moderating role, supporting the multivariable model’s predictive robustness. Cumulative norepinephrine dose within the first 24 hours of ICU admission (mg) / (BMI × 24h); unit: mg· m² / (kg· 24h). Abbreviations: NEI, norepinephrine index; PCT, procalcitonin (ng/mL). |
Confusion matrix analysis revealed an overall accuracy of 85.11%, sensitivity of 86.96%, and specificity of 83.33% (Figure 3B), In the model, false positives refer to patients who were incorrectly predicted to die but ultimately survived, while false negatives are those predicted to survive but who died. The relatively low false negative rate indicates that the model has high sensitivity in identifying high-risk patients, making it effective in assisting early interventions in clinical practice and reducing the chance of missing critically ill patients. Standardized regression coefficients identified NEI as the dominant predictor of 28-day mortality (Figure 3C). SHAP analysis confirmed NEI’s primary contribution and revealed PCT’s moderating role in specific cases, validating the multivariable approach (Figure 3D).
Model Validation
Stratified Validation
Stratified analysis across age groups (50–64, 65–79, and ≥80 years) yielded AUC values of 0.89, 0.89, and 0.99, respectively (Figure 4A). The ≥80 years group showed significantly better classification performance, highlighting the model’s enhanced accuracy in older populations, while the other age groups maintained strong discriminatory ability.
 |
Figure 4 Model validation for predicting septic shock mortality. (A) Stratified analysis showing AUC values across age groups (50–64, 65–79, and ≥80 years), with enhanced performance in the ≥80 years group. (B) Bootstrap validation demonstrating robust classification performance with an average AUC of 0.91 (95% CI: 0.86–0.95). (C) Feature-specific analysis highlighting the synergistic predictive power of NEI and PCT combined (AUC = 0.92). (D) Noise resilience testing showing consistent AUC >0.91 under noise levels ≤0.05. (E) Internal training and test set performance with AUC values of 0.94 (training) and 0.85 (test). (F) Confusion matrix analysis comparing accuracy, sensitivity, and specificity between training and test sets. False negative rates were slightly higher in the test set, suggesting more missed high-risk cases. (G) Precision-recall curves indicating stable classification performance (AUC-PR = 0.93 for training, 0.89 for test). (H) Prediction probability distributions revealing near-complete separation of positive (75–100%) and negative samples (0–25%) in the training set and slight overlap in the test set. Overall, these results confirm the model’s strong predictive performance, robustness, and generalizability for mortality risk in septic shock patients. NEI and PCT were used as predictive biomarkers. NEI was measured in mg· m² / (kg· 24h), and PCT in ng/mL. |
Bootstrap Validation
Robustness was assessed using 1000 bootstrap iterations, yielding an average AUC of 0.91 (95% CI: 0.86–0.95) with a near-normal distribution, indicating stable classification performance (Figure 4B). Feature analysis (Figure 4C) showed NEI alone achieved an AUC of 0.86, PCT alone 0.69, and their combination significantly improved the AUC to 0.92, highlighting the synergistic predictive power of integrated features.
To evaluate noise resilience, random noise levels (0.01–0.08) were introduced. The model maintained an AUC above 0.91 with noise ≤0.05, with a slight decline observed beyond this threshold (Figure 4D). These results demonstrate the model’s robustness under moderate noise interference, ensuring reliable performance within acceptable ranges.
While the bootstrap validation results demonstrate robust performance, we acknowledge that overfitting is always a potential concern, especially given the relatively small sample size. We addressed this by employing L1 regularization (Lasso) during model construction to minimize overfitting, and our validation results, including in the test set, suggest that the model remains stable and generalizable.
Performance Evaluation on Internal Training and Test Sets
The internal set were stratified by survival and mortality proportions and divided into a training set (n = 66) and a test set (n = 28) at a 7:3 ratio. Model stability was evaluated using 10-fold cross-validation on the training set, achieving an AUC of 0.94 (95% CI: 0.89–0.98), while the test set reached an AUC of 0.85 (95% CI: 0.69–0.97), demonstrating strong generalization performance (Figure 4E). Confusion matrix analysis showed training set accuracy, sensitivity, and specificity of 87.88%, 87.50%, and 88.24%, respectively, compared to 75.00%, 76.92%, and 73.33% for the test set (Figure 4F). In the training set, the model showed a low false negative rate, indicating good ability to identify high-risk patients. In contrast, in the test set, a slight increase in false negatives was observed, which suggests a slight decrease in sensitivity when applied to unseen data. This highlights the need for clinical judgment when predicting borderline-risk patients using the model, to avoid potential undertreatment.
The precision-recall curve yielded AUC-PR values of 0.93 for the training set and 0.89 for the test set, indicating stable classification performance (Figure 4G). Prediction probability distributions demonstrated strong classification performance across datasets. In the training set, positive and negative samples showed near-complete separation, with positive samples clustering within the 75–100% range and negative samples within the 0–25% range. A slight overlap was observed in the test set, indicating a modest decline in classification capability for unseen data (Figure 4H). Overall, the model demonstrated excellent classification performance on the training set and strong generalization on the test set. Despite minor differences, the robust predictive capability affirms its reliability for unseen data.
External Validation
To validate the model’s generalizability, an independent external validation cohort (n = 57) was utilized. A comparison of baseline characteristics (Table 3) revealed no significant differences in gender distribution, BMI, GCS, SOFA scores, APACHE II scores, or key biomarkers (PCT and NEI) between the two datasets (all P > 0.05). However, the external validation dataset had a slightly younger median age compared to the training dataset (69 years vs 75 years, P = 0.037). These findings indicate that the external dataset is comparable to the internal dataset, supporting the model’s applicability to independent patient cohorts.
 |
Table 3 Comparison of Baseline Characteristics Between the Internal Dataset and External Validation Dataset |
In external validation cohort (n = 57), the model achieved an AUC of 0.90 (95% CI: 0.83–0.98) (Figure 5A), with sensitivity and specificity of 88.0% and 75.0%, respectively (Figure 5B). The confusion matrix analysis revealed a relatively low number of false negatives, suggesting that the model maintains high sensitivity and can effectively identify most patients at high risk of mortality. While some false positives exist, the high sensitivity in the prediction ensures that critically ill patients are identified and receive timely interventions, which is crucial in sepsis management. Bootstrap resampling (1000 iterations, Figure 5C) confirmed the model’s robustness, yielding a near-normal AUC distribution (mean AUC = 0.877, 95% CI: 0.850–0.903).
 |
Figure 5 External validation of the predictive model. (A) ROC curve showing an AUC of 0.90 (95% CI: 0.83–0.98). (B) Confusion matrix analysis illustrating overall accuracy (80.70%), sensitivity (88.0%), and specificity (75.0%). The low false negative count supports reliable detection of high-risk patients. (C) Bootstrap validation (1000 iterations) confirming robustness with a near-normal AUC distribution (mean AUC = 0.877, 95% CI: 0.850–0.903). (D) Calibration curve indicating strong agreement between predicted and observed probabilities, particularly in the mid-range (0.4–0.7). (E) Decision curve analysis demonstrating higher net benefit for high-risk screening at low threshold probabilities (≤0.05). The results confirm the model’s stability, robustness, and clinical applicability in an independent external cohort. Abbreviations: PCT, procalcitonin (ng/mL); NEI, norepinephrine index (mg· m² / (kg· 24h)). |
The calibration curve (Figure 5D) showed good agreement between predicted and observed probabilities, particularly in the mid-range interval (0.4–0.7). The mean absolute error (MAE) and Brier score were 0.243 and 0.154, respectively.
Decision curve analysis (Figure 5E) demonstrated a significantly higher net benefit for high-risk screening compared to a “no screening” strategy, especially at low threshold probabilities (≤0.05).
To further assess the adequacy of the sample sizes used in the internal and external validation cohorts, a post hoc power analysis was performed using DeLong’s method for AUC-based inference. The internal cohort (AUC = 0.91, n = 94) yielded a standard error of 0.0205 and a statistical power of 1.00. Similarly, the external validation cohort (AUC = 0.90, n = 57) achieved a standard error of 0.0276 and a power of 1.00. These results suggest that, despite relatively modest sample sizes, the study was sufficiently powered to detect statistically significant predictive performance in both internal and external datasets. This provides additional statistical assurance regarding the robustness and clinical applicability of the proposed model.
Decision Tree and Nonlinear Effect Analysis
Nonlinear Relationship Analysis
Natural cubic spline regression revealed significant nonlinear relationships between NEI, PCT, and mortality risk (Figure 6). Mortality risk for NEI rose gradually below 4 mg· m² / (kg· 24h), increased sharply above 4 mg· m² / (kg· 24h), and plateaued thereafter (Figure 6A). For PCT, risk declined rapidly below 50 ng/mL and stabilized beyond this threshold (Figure 6B). These critical values (NEI > 4mg· m² / (kg· 24h), PCT < 50 ng/mL) offer key insights for risk stratification and clinical decisions.
 |
Figure 6 Decision tree and nonlinear relationship analysis. (A) Natural cubic spline regression showing a nonlinear relationship between NEI and mortality risk, with risk increasing sharply above NEI > 4mg· m² / (kg· 24h) and plateauing thereafter. The NEI axis is labeled in mg· m² / (kg· 24h). (B) Nonlinear effect of PCT on mortality risk, where risk decreases rapidly below PCT < 50ng/mL and stabilizes beyond this threshold. The PCT axis is labeled in ng/mL. (C) Decision tree model identifying NEI and PCT as key variables for risk stratification, delineating low-risk (NEI < 1.5mg· m² / (kg· 24h)), intermediate-risk (NEI 1.5–3.6mg· m² / (kg· 24h)), and high-risk (NEI ≥ 3.6mg· m² / (kg· 24h)) patient groups. The decision tree also identifies PCT < 4.2ng/mL as a significant threshold within a specific NEI subgroup. Notably, the spline regression identified 50ng/mL as the nonlinear inflection point for PCT, whereas the decision tree identified 4.2ng/mL as the optimal threshold within a specific NEI subgroup. These thresholds are complementary, reflecting population-level and subgroup-specific risk stratification, respectively. NEI is expressed as mg· m² / (kg· 24h); PCT in ng/mL. |
Decision Tree Model
A decision tree model (Figure 6C) identified NEI and PCT as pivotal variables for risk stratification. Patients with NEI < 1.5mg· m² / (kg· 24h) were classified as low-risk (87% survival), while those with NEI ≥ 3.6 mg· m² / (kg· 24h) were categorized as high-risk (100% mortality). For intermediate-risk patients (NEI 1.5–3.6mg· m²/ (kg· 24h)), further stratification based on PCT levels revealed distinct patterns: PCT ≥ 45ng/mL indicated higher survival, PCT between 4.2ng/mL and 45ng/mL indicated a mortality rate of 59%, reflecting a moderately high-risk category with a relatively low survival rate (41%), and PCT < 4.2ng/mL indicated a significantly worse prognosis with an 89% mortality rate. These findings underscore the clinical significance of NEI and PCT in guiding mortality risk assessment.
The spline analysis identified 50ng/mL for PCT and 4mg· m²/(kg· 24h) for NEI as non-linear inflection points, reflecting the overall non-linear trends in mortality risk. However, the decision tree model identified specific NEI and PCT thresholds that are clinically meaningful for mortality risk stratification. An NEI value above 3.6 mg· m²/(kg· 24h) indicated a high-risk group with a 100% mortality rate, which aligns with clinical understanding that high norepinephrine requirements are associated with severe circulatory dysfunction and poor prognosis in septic shock. The 4.2ng/mL PCT threshold identified in the decision tree model further refines the prognosis, indicating a significantly worse outcome for patients with lower PCT levels. These thresholds have direct clinical relevance, helping to identify patients who need urgent intervention and intensive monitoring to improve survival chances.
Discussion
In this study, we developed and validated an innovative predictive model for 28-day mortality risk in septic shock patients aged 50 years and above, emphasizing NEI and PCT as core predictors. The model demonstrated excellent predictive accuracy, stability, and clinical applicability through rigorous construction, internal and external validation, and multidimensional analyses. These findings establish NEI and PCT as critical biomarkers for mortality risk assessment in septic shock, with nonlinear analysis identifying NEI > 4mg· m²/(kg· 24h) and PCT < 50ng/mL as pivotal thresholds. Decision tree analysis further validated these thresholds, highlighting their utility in clinical risk stratification. Compared to traditional assessment methods primarily based on APACHE II or SOFA scores,16,25 our model achieved superior predictive accuracy and calibration in both internal and external validation cohorts, reflecting its ability to intuitively capture hemodynamic status and infection/immune responses.
NEI provides a novel lens for assessing hemodynamic stress and microvascular function by integrating norepinephrine dosage, BMI, and duration of administration. It quantifies the severity of microcirculatory perfusion insufficiency and the patient’s reliance on hemodynamic support.48,49 Conversely, PCT < 50ng/mL was significantly correlated with higher mortality, challenging the conventional notion that elevated PCT levels always predict worse outcomes. This phenomenon likely reflects immune suppression or dysfunction, where impaired cytokine secretion diminishes PCT elevation.50 Specifically, patients who are immunocompromised—such as those receiving immunosuppressive therapy, organ transplant recipients, or elderly patients—may exhibit lower or unchanged PCT levels despite the presence of severe infection. This suggests that immune suppression can result in a blunted inflammatory response, which may impair the production and release of PCT, making it less reliable as a marker of infection severity in these individuals. Several studies have reported similar findings. Lombardi et al23 found that PCT levels were significantly lower in immunosuppressed patients compared to immunocompetent septic patients, indicating that immune status can modulate PCT production and its diagnostic utility. Furthermore, Nicolas Bele et al24 showed that in critically ill immunocompromised patients, PCT was less sensitive as a marker of infection, particularly in the early stages of sepsis, due to the weakened immune response. These findings underscore the importance of considering a patient’s immune status when interpreting PCT levels in clinical practice. While PCT remains a useful biomarker in many cases, its diagnostic utility may be compromised in immunocompromised patients, and clinicians should use additional diagnostic tools and clinical judgment to assess the severity of infection.
This model offers three key clinical advantages: (1) Efficient risk stratification: The NEI- and PCT-based model effectively distinguishes low-, medium-, and high-risk groups. Nonlinear analysis revealed that when NEI > 4mg· m² / (kg· 24h), mortality risk rises sharply; similarly, PCT < 50ng/mL indicates a poorer prognosis. Notably, decision tree analysis further validated these critical thresholds, aiding in the clinical identification of high-risk patients who require intensified hemodynamic support or more aggressive infection control strategies.51 For example, patients with NEI ≥ 3.6 mg· m² / (kg· 24h) represent the highest-risk group, requiring intensive hemodynamic support and infection control, whereas those with NEI < 1.5 mg· m² / (kg· 24h) can avoid unnecessary interventions, optimizing resource utilization. (2) Real-time dynamic monitoring: By incorporating dynamic variables, the model captures real-time changes in patient status, outperforming traditional static scoring systems such as APACHE II and SOFA. External validation achieved an AUC of 0.90, surpassing the typical < 0.80 AUC of conventional systems,16,25 underscoring its superiority in dynamic monitoring. In addition, when directly compared with traditional scoring systems in the same cohort, the NEI + PCT model consistently outperformed both SOFA and APACHE II. In the internal validation dataset, the model achieved an AUC of 0.91, significantly higher than SOFA (AUC = 0.64) and APACHE II (AUC = 0.52). In the external validation cohort, the model maintained its superior performance with an AUC of 0.90, compared to SOFA (AUC = 0.70) and APACHE II (AUC = 0.50). These findings reinforce the robustness and clinical relevance of the NEI + PCT model, particularly in its ability to capture hemodynamic instability and immune response, which are critical determinants of outcome in septic shock. The enhanced discrimination over traditional systems highlights the value of integrating dynamic biomarkers into risk stratification tools. (3) Clinical practicality: Decision tree analysis provides an intuitive and user-friendly stratification tool, enabling rapid identification of high-risk patients in resource-limited settings, thereby facilitating precision treatment strategies. The decision tree further refines our core findings—namely, NEI > 3.6mg· m² / (kg· 24h) and PCT < 4.2ng/mL as key mortality risk thresholds—by delineating more granular subgroups for clinical decision-making. While logistic regression underscored these two cutoffs as pivotal, the tree reveals that NEI ≥ 3.6mg· m² / (kg· 24h) substantially increases the likelihood of fatal outcomes, signifying the need for intensified hemodynamic support and infection control. Conversely, NEI < 1.5mg· m² / (kg· 24h) generally corresponds to a lower-risk profile, suggesting less aggressive intervention. PCT levels provide additional specificity for risk stratification: patients with PCT within certain cutoffs (eg, < 4.2ng/mL) exhibit a markedly higher mortality risk. These results emphasize that the interaction between NEI and PCT is critical for early identification of high-risk septic shock patients, while also highlighting the need for tailored resource allocation and treatment strategies across different threshold ranges in clinical practice. Taken together, these findings validate our model’s primary thresholds while offering a practical, stepwise pathway to tailor therapy and resource allocation in managing septic shock.
This study rigorously evaluated the model’s robustness and clinical applicability through stratified validation, bootstrap resampling, and external validation. In the external validation cohort, the model achieved an AUC of 0.90, with sensitivity and specificity of 88.0% and 75.0%, respectively, demonstrating its reliability on independent datasets. Bootstrap resampling (mean AUC: 0.877; 95% CI: 0.850–0.903) and calibration curve analysis (Brier score: 0.154) confirmed a strong concordance between predicted probabilities and actual outcomes. SHAP analysis further elucidated the dynamic contributions of NEI and PCT to individual risk predictions, enhancing the model’s interpretability and fostering clinician trust. Additionally, the decision tree simplified complex predictive patterns into clear, actionable rules, providing a robust framework for developing clinical decision support systems.
The predictive roles of NEI and PCT align with their established pathophysiological mechanisms in septic shock. NEI, which incorporates norepinephrine dosage, BMI, and duration of use, serves as an indicator of hemodynamic and microcirculatory status. Nonlinear analyses show that NEI > 4mg· m² / (kg· 24h) significantly increases mortality risk, linking high-dose norepinephrine to severe hemodynamic instability and microcirculatory dysfunction,18,52,53 and underscoring its prognostic value. Notably, PCT levels below 50ng/mL are correlated with higher mortality, challenging the conventional understanding that higher PCT levels are always associated with worse outcomes.54–57 In the decision tree model subgroup, patients with PCT < 4.2ng/mL demonstrated significantly increased mortality risk, likely reflecting a state of immune suppression or paralysis, where the body fails to mount an adequate response to infection.58 This is particularly relevant in elderly patients, who are often affected by immunosenescence and impaired inflammatory responses.58 Additionally, NEI in the range of 1.5–3.6mg· m²/ (kg· 24h) may indicate an immune-inflammatory imbalance, representing a transition phase between hyperinflammation and immune exhaustion. Integrating immune assessments, such as monocyte HLA-DR expression or lymphocyte profiling, could be valuable for identifying high-risk individuals in this subgroup.59,60 Future research should investigate the role of immune dysfunction in this population and evaluate the potential of immunomodulatory therapies to improve outcomes.
While this study offers valuable insights, it has several limitations: (1) The relatively small, single-center sample may limit the generalizability of the findings. Future research should expand the sample size and incorporate multicenter data for more robust validation. (2) The accurate and reproducible measurement of NEI and PCT requires strict standardization of norepinephrine dosing documentation and laboratory protocols. Inconsistencies across centers may introduce variability, thus posing challenges for large-scale application. Future multicenter studies must ensure harmonized data collection and biomarker quantification protocols to preserve model accuracy and reliability. (3) Slight discrepancies in stratification outcomes were observed between thresholds derived from nonlinear analysis and decision tree methods. Integrating these approaches in future studies could enhance the practicality of stratification rules. Future studies should also explore incorporating dynamic biomarkers (eg, IL-6, lactate, immune indicators) to enrich the model’s variable structure, applying advanced machine learning algorithms (eg, random forest, XGBoost) to improve model performance and interpretability, and developing clinical decision support tools by integrating the model into electronic medical record systems for real-time and precise mortality risk assessment. (4) Despite the inclusion of external validation, we acknowledge the limitations inherent in our retrospective cohort. While retrospective studies are valuable for hypothesis generation, they inherently carry risks of bias, such as selection bias, information bias, and unmeasured confounding, particularly in real-world clinical settings. For instance, variations in treatment protocols, documentation quality, or comorbidity burden may not be fully captured in retrospective data, potentially influencing model performance and limiting generalizability. For example, patients with incomplete data or those excluded from initial assessments may not represent the general population, which could impact the study’s findings. Additionally, we recognize the potential for unmeasured confounding factors, such as comorbidities or treatment protocols, that could influence the outcomes. Future studies should consider prospective, multicenter trials to further validate our findings across different patient populations and clinical settings, which would help confirm the model’s external validity and enhance its applicability in real-world clinical practice.
While our model demonstrates promising results in predicting mortality in septic shock, several areas for future research and improvements remain.
One important next step is to validate the model in multicenter settings. While our study included external validation, a larger and more diverse cohort from multiple centers would provide further validation of the model’s performance across different populations and healthcare settings. This would also enhance its generalizability and external validity, which is crucial for real-world clinical applications.
Another exciting avenue for future research is the dynamic monitoring of NEI trends. As NEI reflects both hemodynamic and metabolic status, continuous monitoring of this marker could provide real-time insights into patient progression and enable early detection of deteriorating conditions. Integrating such dynamic monitoring into clinical practice could significantly improve patient outcomes by facilitating timely interventions, particularly for patients at high risk of deterioration.
By addressing these future improvements, we believe that our model can evolve to provide more personalized, real-time support for clinical decision-making, ultimately improving sepsis management and prognosis.
Conclusion
This study developed a dynamic risk prediction model for 28-day mortality in septic shock patients aged 50 and above, with NEI and PCT as the core predictive factors. By identifying NEI > 4mg· m² / (kg· 24h) and PCT < 50ng/mL as critical thresholds, the model facilitates accurate patient stratification and supports personalized treatment strategies. While the findings are promising, but the model’s application is currently limited by the relatively modest sample size, and caution should be exercised when interpreting the results.
To fully validate the predictive potential of this model, future research should involve prospective validation across larger, more diverse patient populations from multiple centers. A well-designed prospective cohort study will help establish the model’s generalizability, real-time performance, and clinical utility. Importantly, multicenter validation will provide insights into how the model performs across various healthcare settings, ensuring that it is robust and applicable in different clinical environments. This validation step will also enhance predictive precision and further confirm the model’s effectiveness.
Integrating this model into clinical workflows represents a critical next step in improving patient outcomes. Embedding the model within Electronic Health Record (EHR) systems will enable real-time risk predictions based on incoming patient data, thereby supporting clinicians in making timely and informed decisions. Additionally, future interventional trials could assess the impact of the model on clinical decision-making, early intervention strategies, and patient outcomes. With external validation and successful clinical implementation, this model could become a valuable tool in sepsis management guidelines, enabling more targeted, efficient, and evidence-based care for septic shock patients.
Abbreviations
BMI, Body Mass Index; APACHE II, Acute Physiology and Chronic Health Evaluation II; SOFA, Sequential Organ Failure Assessment; GCS, Glasgow Coma Scale; OI, oxygenation index; WBC, white blood cell; N, neutrophil; L, lymphocyte; M, monocyte; HB, hemoglobin; PLT, platelet; CRP, C-reactive protein; PCT, procalcitonin; LAC, lactate; LCR, 24-hour lactate clearance rate; PT, prothrombin time; APTT, activated partial thromboplastin time; Fib, fibrinogen; ALB, albumin; TBiL, total bilirubin; CR, creatinine; IL-6, interleukin-6; NEI, norepinephrine index; NEI = D / (BMI × T); D, cumulative norepinephrine dose within the first 24 hours of ICU admission (mg); T, 24h. SE, standard error; OR, odds ratio. CI, confidence interval.
Data Sharing Statement
The datasets used and/or analyzed during the current study are available from the corresponding author on reasonable request.
Ethics Approval and Consent to Participate
This study was approved by the Ethics Committee of Jining No. 1 People’s Hospital (Approval No. 2024-IIT-074). The requirement for informed consent was waived because the study was retrospective in nature, involved no intervention or risk to patients, and used anonymized data extracted from electronic medical records. All data were fully anonymized before analysis to ensure patient privacy, and no identifiable information was collected or reported. The study was conducted in accordance with the ethical principles outlined in the Declaration of Helsinki.
Consent for Publication
All authors have provided their approval for the publication of this manuscript.
Acknowledgments
We sincerely thank Dr. Haiyang Wang from the Department of Neurology, Affiliated Jining No. 1 People’s Hospital of Shandong First Medical University, for his valuable contributions to this article.
Author Contributions
Wrote the paper: XL Li. Data collection and analysis: XL Li, T Mi, C Liu and M Feng. Conceived and designed the study: XL Li and M Feng. All authors made a significant contribution to the work reported, whether that is in the conception, study design, execution, acquisition of data, analysis and interpretation, or in all these areas; took part in drafting, revising or critically reviewing the article; gave final approval of the version to be published; have agreed on the journal to which the article has been submitted; and agree to be accountable for all aspects of the work.
Funding
There is no funding to report.
Disclosure
The authors declare that they have no competing interests in this work.
References
1. Ait-Oufella H, Bakker J. Understanding clinical signs of poor tissue perfusion during septic shock. Intensive Care Med. 2016;42:2070–2072. doi:10.1007/s00134-016-4250-6
2. de Pablo R, Monserrat J, Reyes E, et al. Mortality in patients with septic shock correlates with anti-inflammatory but not proinflammatory immunomodulatory molecules. J Intensive Care Med. 2011;26:125–132. doi:10.1177/0885066610384465
3. Cecconi M, Evans L, Levy M, Rhodes A. Sepsis and sep ic shock. Lancet. 2018;392:75–87. doi:10.1016/S0140-6736(18)30696-2
4. Artero A, Zaragoza R, Camarena JJ, Sancho S, González R, Nogueira JM. Prognostic factors of mortality in patients with community-acquired bloodstream infection with severe sepsis and septic shock. J Crit Care. 2010;25:276–281. doi:10.1016/j.jcrc.2009.12.004
5. Leligdowicz A, Dodek PM, Norena M, Wong H, Kumar A, Kumar A. Association between source of infection and hospital mortality in patients who have septic shock. Am J Respir Crit Care Med. 2014;189:1204–1213.
6. Gotts JE, Matthay MA. Sepsis: pathophysiology and clinical management. BMJ. 2016;353:i1585. doi:10.1136/bmj.i1585
7. Xue L, Sun QM, Yu H, Liang YH, Li CS. Relationship between cellular immunity changes and prognosis in elderly patients with sepsis. J Coll Physicians Surg Pak. 2019;29:1144–1148. doi:10.29271/jcpsp.2019.12.1144
8. Wilmoth JR, Bas D, Mukherjee S, Hanif N. World social report 2023: leaving no one behind in an ageing world. United Nations. 2023;2023:1.
9. Kotfis K, Wittebole X, Jaschinski U, et al. A worldwide perspective of sepsis epidemiology and survival according to age: observational data from the ICON audit. J Crit Care. 2019;51:122–132. doi:10.1016/j.jcrc.2019.02.015
10. Boonmee P, Ruangsomboon O, Limsuwat C, Chakorn T. Predictors of mortality in elderly and very elderly emergency patients with sepsis: a retrospective study. West J Emerg Med. 2020;21:210–218. doi:10.5811/westjem.2020.7.47405
11. Liu X, Ren H, Peng D. Sepsis biomarkers: an omics perspective, front. Med China. 2014;8:58–67.
12. Siddiqui MA, Pandey S, Azim A, Sinha N, Siddiqui MH. Metabolomics: an emerging potential approach to decipher critical illnesses. Biophys Chem. 2020;267:106462. doi:10.1016/j.bpc.2020.106462
13. Pandey S. Sepsis, management & advances in metabolomics. Nanotheranostics. 2024;8(3):270–284. doi:10.7150/ntno.94071
14. Kopczynska M, Sharif B, Cleaver S, et al. Red-flag sepsis and SOFA identifies different patient population at risk of sepsis-related deaths on the general ward. Medicine. 2018;97:e13238. doi:10.1097/MD.0000000000013238
15. Le Gall JR, Lemeshow S, Saulnier F. A new Simplified Acute Physiology Score (SAPS II) based on a European/North American multicenter study. JAMA. 1993;270:2957–2963. doi:10.1001/jama.1993.03510240069035
16. Zhang L, Huang T, Xu F, et al. Prediction of prognosis in elderly patients with sepsis based on machine learning (random survival forest). BMC Emerg Med. 2022;22:26. doi:10.1186/s12873-022-00582-z
17. Arishi H, AlQahtani S, Tamim H, et al. Combination of norepinephrine with phenylephrine versus norepinephrine with vasopressin in critically ill patients with septic shock: a retrospective study. J Crit Care. 2022;72:154121. doi:10.1016/j.jcrc.2022.154121
18. Yamamura H, Kawazoe Y, Miyamoto K, Yamamoto T, Ohta Y, Morimoto T. Effect of norepinephrine dosage on mortality in patients with septic shock. J Intensive Care. 2018;6:12. doi:10.1186/s40560-018-0280-1
19. Suberviola B, Castellanos-Ortega A, González-Castro A, García-Astudillo LA, Fernández-Miret B. Prognostic value of procalcitonin, C-reactive protein and leukocytes in septic shock. Med Intensiva. 2012;36:177–184. doi:10.1016/j.medin.2011.09.008
20. Ryoo SM, Han KS, Ahn S, et al. The usefulness of C-reactive protein and procalcitonin to predict prognosis in septic shock patients: a multicenter prospective registry-based observational study. Sci Rep. 2019;9:6579. doi:10.1038/s41598-019-42972-7
21. Goyani P, Christodoulou R, Vassiliou E. Immunosenescence: aging and immune system decline. Vaccines. 2024;12(12):1314. doi:10.3390/vaccines12121314
22. Ke X, Zhang F, Huang G, Wang A. Interpretable machine learning to optimize early in-hospital mortality prediction for elderly patients with sepsis: a discovery study. Comput Math Methods Med. 2022;2022:4820464. doi:10.1155/2022/4820464
23. Lombardi G, Shah PM. Procalcitonin in patients with and without immunosuppression and sepsis. Infection. 1996;24(6):434–436. doi:10.1007/BF01713044
24. Bele N, Darmon M, Coquet I, et al. Diagnostic accuracy of procalcitonin in critically ill immunocompromised patients. BMC Infect Dis. 2011;11:224. doi:10.1186/1471-2334-11-224
25. Wei J, Liang R, Liu S, et al. Nomogram predictive model for in-hospital mortality risk in elderly ICU patients with urosepsis. BMC Infect Dis. 2024;24:442. doi:10.1186/s12879-024-09319-8
26. Yu H, Nie L, Liu A, et al. Combining procalcitonin with the qSOFA and sepsis mortality prediction. Medicine. 2019;98:e15981. doi:10.1097/MD.0000000000015981
27. Olejarova M, Dobisova A, Suchankova M, et al. Vitamin D deficiency - a potential risk factor for sepsis development, correlation with inflammatory markers, SOFA score and higher early mortality risk in sepsis. Bratisl Lek Listy. 2019;120:284–290. doi:10.4149/BLL_2019_040
28. Hou N, Li M, He L, et al. Predicting 30-days mortality for MIMIC-III patients with sepsis-3: a machine learning approach using XGboost. J Transl Med. 2020;18:462. doi:10.1186/s12967-020-02620-5
29. Park JE, Park SY, Kim HJ, Kim HS. Reproducibility and generalizability in radiomics modeling: possible strategies in radiologic and statistical perspectives. Korean J Radiol. 2019;20:1124–1137. doi:10.3348/kjr.2018.0070
30. Labarère J, Renaud B, Fine MJ. How to derive and validate clinical prediction models for use in intensive care medicine. Intensive Care Med. 2014;40:513–527. doi:10.1007/s00134-014-3227-6
31. Scheinost D, Noble S, Horien C, et al. Ten simple rules for predictive modeling of individual differences in neuroimaging. Neuroimage. 2019;193:35–45. doi:10.1016/j.neuroimage.2019.02.057
32. Goodacre Y, Xu R. On splitting training and validation set: a comparative study of cross-validation, bootstrap and systematic sampling for estimating the generalization performance of supervised learning. J Anal Test. 2018;2:249–262. doi:10.1007/s41664-018-0068-2
33. Zhu N, Zhang L, Gong S, et al. Derivation and external validation of a risk prediction model for pulmonary embolism in patients with lung cancer: a large retrospective cohort study. Clin Appl Thromb Hemost. 2023;29:10760296231151696. doi:10.1177/10760296231151696
34. Singer M, Deutschman CS, Seymour CW, et al. The third international consensus definitions for sepsis and septic shock (Sepsis-3). JAMA. 2016;315:801–810. doi:10.1001/jama.2016.0287
35. Bedogni G. Clinical Prediction models—a Practical Approach to Development, Validation and Updating. Oxford: Oxford University Press; 2009.
36. Kutner MH, Nachtsheim CJ, Neter J, Li W. Applied Linear Statistical Models. New York: McGraw-Hill; 2005.
37. Steyerberg EW, Fe H Jr, Borsboom GJ, Eijkemans MJ, Vergouwe Y, Habbema JD. Internal validation of predictive models: efficiency of some procedures for logistic regression analysis. J Clin Epidemiol. 2001;54:774–781. doi:10.1016/S0895-4356(01)00341-9
38. Hastie T. The Elements of Statistical Learning: Data Mining, inference, and Prediction. New York: Springer; 2009.
39. Harrell FE. Regression Modeling Strategies: With Applications to Linear Models, Logistic Regression, and Survival Analysis. New York: Springer; 2001.
40. Fawcett TJ. An introduction to ROC analysis. Pattern Recognit Lett. 2006;27:861–874. doi:10.1016/j.patrec.2005.10.010
41. Dw H Jr, Lemeshow S, Sturdivant RX. Applied Logistic Regression. Hoboken: John Wiley & Sons; 2013.
42. Lundberg S, Lee S-I. A unified approach to interpreting model predictions. Nat Mach Intell. 2017;2017:1.
43. Carpenter J, Bithell J. Bootstrap confidence intervals: when, which, what? A practical guide for medical statisticians. Stat Med. 2000;19:1141–1164. doi:10.1002/(SICI)1097-0258(20000515)19:9<1141::AID-SIM479>3.0.CO;2-F
44. Bishop CM, Nasrabadi NM. Pattern Recognition and Machine Learning. New York: Springer; 2006.
45. Arlot S, Celisse A. A survey of cross-validation procedures for model selection. Stat Surv. 2010;4:40–79. doi:10.1214/09-SS054
46. Steyerberg EW, Vickers AJ, Cook NR, et al. Assessing the performance of prediction models: a framework for traditional and novel measures. Epidemiology. 2010;21:128–138. doi:10.1097/EDE.0b013e3181c30fb2
47. Breiman L. Classification and Regression Trees. New York: Routledge; 2017.
48. Martin C, Medam S, Antonini F, et al. Norepinephrine: not too much, too long. Shock. 2015;44:305–309. doi:10.1097/SHK.0000000000000426
49. Hamzaoui O, Scheeren TWL, Teboul JL. Norepinephrine in septic shock: when and how much? Curr Opin Crit Care. 2017;23:342–347. doi:10.1097/MCC.0000000000000418
50. Matwiyoff GN, Prahl JD, Miller RJ, et al. Immune regulation of procalcitonin: a biomarker and mediator of infection. Inflamm Res. 2012;61:401–409. doi:10.1007/s00011-012-0439-5
51. Wong HR, Lindsell CJ, Pettilä V, et al. A multibiomarker-based outcome risk stratification model for adult septic shock. Crit Care Med. 2014;42:781–789. doi:10.1097/CCM.0000000000000106
52. Wang C, Wang X, Zhang H, Liu D, Zhang C. Effect of norepinephrine on peripheral perfusion index and its association with the prognosis of patients with sepsis. J Intensive Care Med. 2024;39:21–27. doi:10.1177/08850666231187333
53. Sacha GL, Bauer SR. Optimizing vasopressin use and initiation timing in septic shock: a narrative review. Chest. 2023;164:1216–1227. doi:10.1016/j.chest.2023.07.009
54. Gregoriano C, Heilmann E, Molitor A, Schuetz P. Role of procalcitonin use in the management of sepsis. J Thorac Dis. 2020;12:S5–S15. doi:10.21037/jtd.2019.11.63
55. Wang X, Jing M, Li L, Xu Q. The prognostic value of procalcitonin clearance and procalcitonin to albumin ratio in sepsis patients. Clin Lab. 2023;69:1.
56. Jain S, Sinha S, Sharma SK, et al. Procalcitonin as a prognostic marker for sepsis: a prospective observational study. BMC Res Notes. 2014;7:1–7. doi:10.1186/1756-0500-7-458
57. Liu D, Su L, Han G, Yan P, Xie L. Prognostic value of procalcitonin in adult patients with sepsis: a systematic review and meta-analysis. PLoS One. 2015;10(6):e0129450. doi:10.1371/journal.pone.0129450
58. Pei F, Yao RQ, Ren C, et al. Expert consensus on the monitoring and treatment of sepsis-induced immunosuppression. Mil Med Res. 2022;9(1):74. doi:10.1186/s40779-022-00430-y
59. Bodinier M, Peronnet E, Brengel-Pesce K, et al. Monocyte trajectories endotypes are associated with worsening in septic patients. Front Immunol. 2021;12:795052. doi:10.3389/fimmu.2021.795052
60. Cheng L, Guan W, Duan C, et al. Effect of recombinant human granulocyte colony–stimulating factor for patients with coronavirus disease 2019 (COVID-19) and lymphopenia: a randomized clinical trial. JAMA Intern Med. 2021;181(1):71–78. doi:10.1001/jamainternmed.2020.5503
 © 2025 The Author(s). This work is published and licensed by Dove Medical Press Limited. The
full terms of this license are available at https://www.dovepress.com/terms
and incorporate the Creative Commons Attribution
- Non Commercial (unported, 4.0) License.
By accessing the work you hereby accept the Terms. Non-commercial uses of the work are permitted
without any further permission from Dove Medical Press Limited, provided the work is properly
attributed. For permission for commercial use of this work, please see paragraphs 4.2 and 5 of our Terms.
© 2025 The Author(s). This work is published and licensed by Dove Medical Press Limited. The
full terms of this license are available at https://www.dovepress.com/terms
and incorporate the Creative Commons Attribution
- Non Commercial (unported, 4.0) License.
By accessing the work you hereby accept the Terms. Non-commercial uses of the work are permitted
without any further permission from Dove Medical Press Limited, provided the work is properly
attributed. For permission for commercial use of this work, please see paragraphs 4.2 and 5 of our Terms.
Recommended articles

A Machine Learning Model Based on Health Records for Predicting Recurrence After Microwave Ablation of Hepatocellular Carcinoma
An C, Yang H, Yu X, Han Z, Cheng Z, Liu F, Dou J, Li B, Li Y, Li Y, Yu J, Liang P
Journal of Hepatocellular Carcinoma 2022, 9:671-684
Published Date: 28 July 2022
Machine Learning Predictive Model for Septic Shock in Acute Pancreatitis with Sepsis
Xia Y, Long H, Lai Q, Zhou Y
Journal of Inflammation Research 2024, 17:1443-1452
Published Date: 5 March 2024
Machine Learning-Based Predictive Modeling of Diabetic Nephropathy in Type 2 Diabetes Using Integrated Biomarkers: A Single-Center Retrospective Study
Zhu Y, Zhang Y, Yang M, Tang N, Liu L, Wu J, Yang Y
Diabetes, Metabolic Syndrome and Obesity 2024, 17:1987-1997
Published Date: 10 May 2024
Comparative Analysis of Heart Failure with Preserved Vs Reduced Ejection Fraction: Patient Characteristics, Outcomes, Mortality Prediction, and Machine Learning Model Development in the JoHFR
Izraiq M, AlBalbissi K, Alawaisheh R, Toubasi A, Ahmed YB, Mahmoud M, Khraim KI, AL-Ithawi M, Mansour OM, Hamati A, Khraisat FA, Abu-Hantash H
International Journal of General Medicine 2024, 17:3083-3091
Published Date: 15 July 2024
A Novel Composite Bioscore Integrating Biomarkers, Clinical Scores, and Comorbidity Indices for Prognostic Stratification in Sepsis
Țocu G, Mihailov R, Luțenco V, Dimofte F, Ștefănescu BI, Niculeț E, Mihailov OM, Țocu L, Stavăr Matei L
Journal of Inflammation Research 2026, 19:579172
Published Date: 23 February 2026