
Back to Journals » International Journal of General Medicine » Volume 19
A Five-Gene PANoptosis Signature Correlates with Immune Infiltration and Secondary Brain Injury in Intracerebral Hemorrhage
Authors Chen Z  , Zhang X, Deng Z, Luo J, Han C, Weng Y
Received 14 November 2025
Accepted for publication 15 February 2026
Published 6 March 2026 Volume 2026:19 581629
DOI https://doi.org/10.2147/IJGM.S581629
Checked for plagiarism Yes
Review by Single anonymous peer review
Peer reviewer comments 4
Editor who approved publication: Dr Woon-Man Kung
Zhaohui Chen,1,2,* Xueyuan Zhang,1,3,* Zhicheng Deng,1,2,* Jiali Luo,1,4 Chunyang Han,1,4 Yinlun Weng1,3,4
1Shenshan Medical Center, Memorial Hospital of Sun Yat-Sen University, Shanwei, Guangdong, People’s Republic of China; 2Guangdong Provincial Key Laboratory of Cancer Pathogenesis and Precision Diagnosis and Treatment, Shenshan Medical Center, Memorial Hospital of Sun Yat-Sen University, Shanwei, Guangdong, People’s Republic of China; 3Sun Yat-Sen Memorial Hospital, Sun Yat-Sen University, Guangzhou, Guangdong, People’s Republic of China; 4Department of Neurosurgery, Shenshan Medical Center, Memorial Hospital of Sun Yat-Sen University, Shanwei, Guangdong, People’s Republic of China
*These authors contributed equally to this work
Correspondence: Yinlun Weng, Email [email protected]
Objective: Primary intracerebral hemorrhage (ICH) is a severe stroke subtype characterized by high mortality and disability rates, largely attributable to secondary brain injury (SBI). While programmed cell death (PCD) pathways contribute to SBI, their mechanisms remain incompletely understood. This research investigated PANoptosis, a newly defined integrated PCD pathway, and its interactions with immune responses in ICH.
Methods: The transcriptomic dataset GSE24265 was analyzed to identify differentially expressed genes (DEGs), which were intersected with a PANoptosis-related gene set. PANoptosis-related DEGs were analyzed through protein-protein interaction (PPI) networks, functional enrichment, and machine learning (LASSO and Random Forest) to identify signature genes. The diagnostic utility was evaluated using nomograms and receiver operating characteristic (ROC) curves. Immune interactions were assessed using CIBERSORT. Key findings were validated in clinical specimens using qRT-PCR and Western blot.
Results: We identified 50 PANoptosis-related DEGs in ICH and derived five signature genes (AKR1C2, SLC2A14, FTL, TNFRSF12A, and SLC2A3) that were significantly upregulated and had high diagnostic accuracy. These genes were implicated in an inflammatory cell death hub, as their expression correlated with altered proportions of T follicular helper and T gamma delta cells, linking PANoptosis to immune dysregulation. Experimental validation confirmed the upregulation of mRNA levels of SLC2A3, SLC2A14, and TNFRSF12A in perihematomal tissues, along with increased protein levels of SLC2A3 and SLC2A14. Functional enrichment analysis linked these genes to HIF-1, NF-κB, and TNF signaling pathways in ICH PANoptosis.
Conclusion: Our study identifies PANoptosis as a pathological hub connecting SBI and neuroinflammation in ICH, with five signature genes serving as key diagnostic biomarkers. Notably, SLC2A3 was significantly elevated in peripheral blood, highlighting its potential as a non-invasive plasma biomarker for ICH. These genes likely contribute to neuroinflammation through immune crosstalk and metabolic reprogramming, offering novel mechanistic insights and potential therapeutic targets for SBI post-ICH.
Keywords: intracerebral hemorrhage, PANoptosis, machine learning, immune infiltration
Introduction
Intracerebral hemorrhage (ICH) accounts for 10–15% of all acute stroke cases and is associated with high mortality and disability among cerebrovascular diseases.1,2 Initial ICH is followed by a cascade of secondary brain injury (SBI) events, including brain edema, blood-brain barrier disruption, and neuronal death, triggered by hematoma metabolites.3 Despite extensive research, effective therapeutic interventions for SBI remain elusive.4–6 This clinical challenge partly stems from an incomplete understanding of the dynamics of programmed cell death (PCD) in ICH pathology.7 Although individual PCD pathways, such as apoptosis, necroptosis, and pyroptosis, contribute to ICH pathology, functional compensation among them limits the neuroprotective efficacy of inhibiting any single pathway.7,8 This limitation underscores the significant interactions and crosstalk between different PCD modalities.9 A concept defined in the emerging framework of PANoptosis.
PANoptosis, first introduced by Malireddi et al in 2019, represents an integrated inflammatory cell death pathway that incorporates key molecular features of pyroptosis, apoptosis, and necroptosis but cannot be solely confined to any one of these pathways.10 This newly defined PCD is executed by a central signaling platform called the PANoptosome—a supramolecular complex that can be nucleated by sensors like ZBP1 or AIM2,11,12 which then co-recruit and co-activate effector molecules (eg, caspases, RIPKs, GSDMD) from across the individual death pathways.13,14 Critically, the PANoptosis framework has evolved to be recognized as a comprehensive cell death paradigm that functionally integrates signals from ferroptosis and cuproptosis. Key mechanistic studies demonstrate that the induction of ferroptosis (via iron dysregulation) or cuproptosis (via copper overload) can each serve as potent upstream triggers that activate the core PANoptotic machinery.15,16 Thus, in current conceptualization, PANoptosis has defined as a broad, functionally interconnected cell death network encompassing pyroptosis, apoptosis, necroptosis, ferroptosis, and cuproptosis.17
In ischemic stroke models, PANoptosis drives neuronal loss via RIPK3-dependent signaling18 and cGAS-STING-mediated neuroinflammation.19 Critically, the pathological microenvironment following ICH is highly conducive to PANoptosis. Hemoglobin degradation products, such as heme and iron, induce potent oxidative stress and inflammasome activation.20,21 Hypoxia upregulates metabolic sensors that reprogram death signaling,22 and robust neuroinflammation recruits immune effectors that amplify the cell death cascades.23 Collectively, these factors position PANoptosis not merely as a parallel cell death pathway, but as a potential pathological nexus that integrates metabolic stress, multiple PCD modalities, and neuroinflammation in the progression of secondary injury after ICH. However, the systematic profiling of PANoptosis-related genes (PRGs) in human ICH tissues and their interplay with the immune microenvironment remains unexplored. In addition, machine learning has gained great benefits in the application of various diseases in recent years,24,25 which can identify prognostic gene signatures from complex biological data and reveal disease mechanisms.26,27
Therefore, this study aims to systematically identify and validate PANoptosis-related gene signatures in human ICH tissues and explore their diagnostic potential and interplay with the immune microenvironment. Using an integrated strategy of transcriptomics, machine learning, and clinical validation, we seek to unveil new mechanisms driving SBI post-ICH and to identify clinically relevant biomarkers with diagnostic and therapeutic promise.
Materials and Methods
Data Acquisition
The transcriptomic dataset GSE24265 was retrieved from the NCBI Gene Expression Omnibus (GEO) database (https://www.ncbi.nlm.nih.gov/geo/). This dataset, based on the GPL570 platform, includes microarray data from 11 brain samples: four perihematomal tissues from patients with ICH and seven contralateral normal tissues. A comprehensive PANoptosis-related gene (PRG) set was assembled by integrating genes from multiple sources. (i) Core PANoptosis-related genes (PANRGs): The GeneCards database was firstly queried using the keyword “PANoptosis”. Noncoding RNA entries were excluded, resulting in an initial list of 30 protein-coding genes. In order to capture genes with established functional roles in the crosstalk between pyroptosis, apoptosis, and necroptosis, we compiled additional lists from the supplementary materials of two key publications that define the PANoptosis concept.28,29 The union of genes from these two sources formed our final PANRG list. (ii) Ferroptosis-related genes (FRGs): FRGs were obtained from the FerrDb V2 database (http://www.zhounan.org/ferrdb/current/), selecting all genes annotated as drivers, suppressors, or markers in the “Gene” module. This was supplemented with FRGs reported specifically in the context of ICH from the literature.30 (iii) Cuproptosis-related genes (CRGs): CRGs were compiled by searching the GeneCards database with the keyword “cuproptosis”, combined with genes identified in the seminal study by Tsvetkov et al.31 After merging all gene lists from the above three categories and removing duplicates, the final master PRG set was established. The complete list is provided in Supplementary Table 1.15
Identification of PANoptosis-Related Differentially Expressed Genes (PDEGs)
Differential expression analysis of the GSE24265 dataset was performed using the “limma” R package. Genes with |log2 (fold-change)| > 1 and p < 0.05 were defined as DEGs. The resulting DEGs were visualized using volcano plots and heatmaps. PDEGs were identified by taking the intersection between the DEGs and the curated PRGs dataset, which was visualized using a Venn diagram.
PPI Network and Functional Enrichment Analysis
The protein-protein interaction (PPI) network among PDEGs was constructed using the STRING online database, with a minimum interaction confidence score threshold of 0.4. The resulting network was imported into Cytoscape for visualization, where the node sizes and colors were determined by connection degree and combined interaction scores to highlight hub genes. Functional enrichment analysis, including Gene Ontology (GO) and Kyoto Encyclopedia of Genes and Genomes (KEGG) pathway analyses, was performed. The top 20 significantly enriched GO terms with a gene count ≥ 5 and the top 10 enriched KEGG pathways were selected for visualization. Gene Set Enrichment Analysis (GSEA) was also conducted to identify relevant phenotypic pathways.
Screening of the Signature Genes by Machine Learning Algorithms
Two machine learning algorithms were employed to refine the PDEGs. Least Absolute Shrinkage and Selection Operator (LASSO) regression was performed using the “glmnet” R package, with the optimal penalty parameter (lambda) selected via 10-fold cross-validation. Simultaneously, the Random Forest (RF) algorithm was applied using the “randomForest” package. Genes with a relative importance value exceeding 0.25 in both the Mean Decrease Accuracy and Mean Decrease Gini metrics were considered significant. The intersection of genes identified by both the LASSO and RF algorithms was defined as the final set of signature genes for subsequent analyses.
The Diagnostic Nomogram Constructing and ROC Analysis
The diagnostic efficacy of the signature genes for ICH was assessed by conducting a logistic regression analysis of the dataset and constructing a logistic regression model. Nomograms were subsequently developed utilizing the “rms” R package based on the outcomes of the logistic regression analysis. Decision curve analysis (DCA) was used to evaluate the accuracy and discrimination of the logistic regression model. Receiver operating characteristic (ROC) curves were generated for each signature gene and the combined logistic regression model using the pROC package in R. The area under the curve (AUC) with 95% confidence intervals (DeLong method) was calculated to assess diagnostic efficacy. An AUC value of 0.7 to 0.8 is regarded as acceptable, 0.8 to 0.9 is classified as excellent, and values over 0.9 are considered outstanding.32
Immune Infiltration and Correlation Analysis of the Signature Genes
The proportion of 22 immune cells in the samples of the GSE24265 dataset was estimated using CIBERSORT analysis. Differences in immune cell composition between the ICH and control groups were assessed using the Wilcoxon rank-sum test. The correlations between the expression levels of signature genes and immune cell abundance were calculated using Spearman correlation analysis. In addition, a correlation analysis of the signature genes was performed using the “corrplot” package to investigate the degree of correlation among the five signature genes. The “ggpubr” package was used to evaluate the expression profiles of the five signature genes in the control and ICH groups.
Clinical Samples of ICH
Perihematomal brain tissues and peripheral blood samples were obtained from five patients undergoing surgical evacuation for spontaneous ICH between June 2024 and June 2025. All patients met the diagnostic criteria outlined in the 2015 AHA/ASA guidelines for spontaneous ICH.33 The inclusion criteria were as follows: (1) age between 18 and 75 years and (2) surgical intervention within 6–48 h of onset. The exclusion criteria encompassed hemorrhage secondary to vascular malformations, aneurysms, trauma, or tumors, as well as patients with underlying coagulopathies or unstable vital signs. Control brain tissues from the control group were obtained from non-functional areas (eg, frontal pole and temporal pole) far from the hematoma margin, which were incidentally resected during the surgical approach, confirmed by visual inspection. Peripheral blood samples (5 mL) were collected into RNA Shield™ blood preservation tubes (#TS001, JianShi Biotech, Beijing) within 30 min of surgery, and blood from healthy volunteers served as controls. All samples were immediately snap-frozen in liquid nitrogen and stored at -80°C. The study protocol adhered to the Consolidated Standards of Reporting Trials (CONSORT) and was approved by the Ethics Committee of Shenshan Medical Center, Memorial Hospital of Sun Yat-sen University (Approval No.2024-SSKY-220). Written informed consent was obtained from all participants or their authorized representatives.
Quantitative Real-Time PCR (qRT-PCR)
Total RNA was extracted from blood and tissue samples using the RNAiso Plus RNA Extraction Kit (TaKaRa Bio, Japan, #9109). RNA was reverse-transcribed to cDNA using PrimeScript RT Master Mix (TaKaRa Bio, Japan, #RR036A). Quantitative PCR was performed using SYBR Green Master Mix (Yeasen Biotechnology, China, #11201ES03) on a Light Cycler 480 system (Roche, Switzerland). Relative mRNA expression levels were calculated using the 2−ΔΔCT method, with GAPDH as the internal control. All primer sequences were synthesized by Tsingke BIO (Beijing, China) and are listed in Table 1.
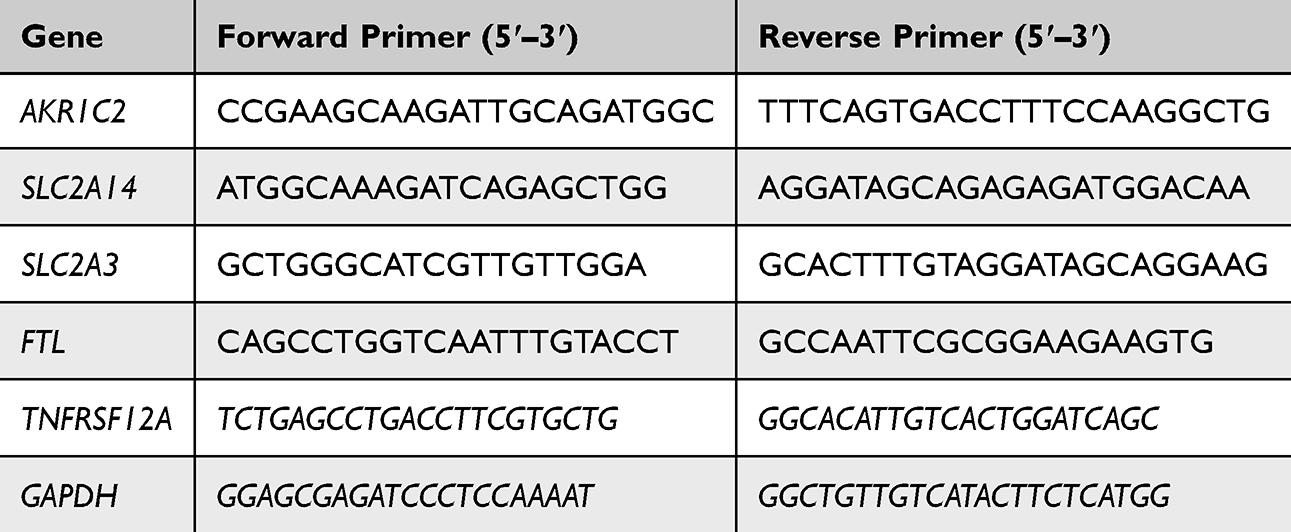 |
Table 1 The Primer Pair Sequences Used in This Study |
Western Blot
Tissue samples were lysed on ice using RIPA buffer (CWBIO, China, #CW2333S) supplemented with protease and phosphatase inhibitors (CWBIO, China, #CW2383S). The lysates were centrifuged at 14,000 rpm for 15 min at 4°C to collect the supernatant. Protein concentration was determined using a BCA protein assay kit (CWBIO, China; #CW0014S). Equal amounts of protein were separated by SDS-PAGE and transferred onto PVDF membranes. After blocking with 5% BSA, the membranes were incubated overnight at 4°C with the following primary antibodies (all at 1:1000 dilution): AKR1C2 (#13035S, Cell Signaling Technology), FTL (#ab69090, Abcam), SLC2A14 (#PK35494-S, Abmart), SLC2A3 (#20403-1-AP, Proteintech), TNFRSF12A (#AWA10766, Abiowell), and GAPDH (#ab181602, ProteinTech). Following incubation with HRP-conjugated secondary antibodies, protein bands were visualized using an ECL detection reagent (Millipore, Germany) and imaged with a SmartChemi 910 Plus system (Sage, Beijing, China).
Statistical Analysis
The R software (v.4.3.3), GraphPad Prism 10.0, and the Wei Sheng Xin online platform (https://www.bioinformatics.com.cn) were utilized for statistical analysis and figure generation. Continuous variables were represented as mean ± standard deviation (SD). A T-test or Wilcoxon test was employed to assess differences between the two groups of normally distributed data, with a P value < 0.05 deemed statistically significant.
Results
Identification of PDEGs in ICH
Our analytical workflow is presented in Figure 1. Analysis of the GSE24265 dataset identified 428 DEGs in ICH samples compared to controls, comprising 325 upregulated and 103 downregulated genes (Figures 2A and B). The intersection of these DEGs with the curated PANoptosis-related gene set (524 PANRGs, 577 FRGs, and 62 CRGs; Supplementary Table 1) revealed 50 overlapping genes, defined as PANoptosis-related DEGs (PDEGs) for subsequent analysis (Figures 2C–E and Table 2).
 |
Table 2 The Common PANoptosis-Related Differentially Expressed Genes in ICH |
 |
Figure 1 Flow chart of the study. Abbreviations: PANRGs, genes related to pyroptosis, apoptosis and necroptosis; FRGs, ferroptosis-related genes; CRGs, cuproptosis-related genes; PRGs, PANoptosis related gene; DEGs, differentially expressed genes; PDEGs, PANoptosis-related differentially expressed genes; GO, Gene Ontology; KEGG, Kyoto Encyclopedia of Genes and Genomes; GSEA, Gene set enrichment analysis; LASSO, Least absolute shrinkage and selection operator; ROC, Receiver Operating Characteristic. |
 |
Figure 2 Identification of DEGs in ICH. (A) Volcano plot depicting the differentially expressed genes of microarray GSE24265. Red points represent upregulated DEGs, blue points represent downregulated DEGs, and grey represents genes without significant differences. (B) The expression heatmap of DEGs in the ICH and control group. (C) Venn diagram of 35 intersected genes between DEGs and PANRGs. (D) Venn diagram of 27 intersected genes between DEGs and FRGs. (E) Venn diagram of 2 intersected genes between DEGs and CRGs. |
Functional Enrichment of PDEGs Highlights Key Pathways
The protein-protein interaction (PPI) network constructed from the PDEGs contained 43 nodes interconnected by 169 edges, indicating substantial functional relationships (Figure 3A). Node centrality analysis, based on degree and combined scores, identified several hub genes in the network (Figure 3B). GO enrichment analysis showed that these PDEGs were significantly involved in biological processes, including the regulation of apoptosis, inflammatory response, and angiogenesis. They were localized to cellular components such as the nucleus, cytosol, and mitochondria, and were enriched in molecular functions such as protein binding and dimerization (Figure 3C). KEGG pathway analysis further linked PDEGs to critical pathways in ICH pathophysiology, including the HIF-1, necroptosis, NF-kappa B, and TNF signaling pathways (Figure 3D). Gene Set Enrichment Analysis (GSEA) corroborated these findings, suggesting significant involvement in the chemokine signaling pathway and cytokine-cytokine receptor interactions (Figure 3E).
 |
Figure 3 PPI network construction and Functional enrichment analysis of PDEGs in ICH. (A) PPI network of PDEGs in STRING online database. (B) The core target network of PDEGs. (C) GO analysis based on the PDEGs. (D) Mulberry&bubble plots of top 10 KEGG pathways enriched for PDEGs. (E) GSEA analysis based on the PDEGs. |
Screening of the Signature Genes by Machine Learning Algorithms
Six candidate genes (AKR1C2, FTL, SLC2A14, STAT3, SLC2A3, and TNFRSF12A) were screened by LASSO regression analysis (Figure 4A and B). The RF algorithm selected the top 10 genes with the highest Mean Decrease Accuracy and Mean Decrease Gini according to their relative importance (combined candidate genes: AKR1C2, FTL, SLC2A14, STAT3, SLC2A3, TNFRSF12A, DDIT3, PMAIP1, TNFAIP3, SERPINE1, and ITGA5; Figure 4C and D). The results of these two machine learning algorithms were then intercrossed by a Venn diagram, and five overlapping signature genes (AKR1C2, SLC2A14, TNFRSF12A, FTL, and SLC2A3) were ultimately identified (Figure 4E, Tables 3 and 4).
 |
Table 3 The Results of LASSO Algorithm |
 |
Table 4 The Results of RF Algorithm |
 |
Figure 4 Signature genes identification. (A and B) LASSO regression analysis and cross-validation based on PDEGs. (C) RF error rate versus the number of classification trees based on PDEGs. (D) The top 10 genes with the relative importance of mean decrease accuracy and mean decrease Gini based on the RF algorithm, respectively. (E) Five signature genes were obtained by intersection of LASSO and RF results. |
The Signature Genes Exhibit High Diagnostic Performance
A diagnostic nomogram was constructed to predict the ICH risk based on the expression levels of the five signature genes (Figure 5A). DCA indicated the favorable clinical utility of this model across a wide range of risk thresholds (Figure 5B). ROC curve analysis yielded AUC values of 1.000 for the diagnostic nomogram and each signature gene within the GSE24265 discovery cohort (Figure 5C–H). It is imperative to note that these perfect AUCs likely reflect overfitting due to the limited sample size (n=11) of this dataset, rather than representing definitive, generalizable diagnostic accuracy. Therefore, their primary value lies in indicating a strong associative signal warranting further validation in larger, independent cohorts.
 |
Figure 5 Validation of the diagnostic efficacy of signature genes. (A) Nomogram showing the predicted risk for ICH based on 5 signature genes. (B) DCA shows the clinical benefits of the nomogram. (C–G) ROC curve of 5 signature genes. (H) ROC curve of the diagnostic model in the GSE24265 dataset. Abbreviation: AUC, area under the curve. |
Given the constraint of the small cohort, we sought evidence for the preliminary validation of our signature gene in an independent, publicly available dataset from a rat model of ICH (GSE149317). Orthologs for four of the five signature genes (Akr1c2, Ftl, Tnfrsf12a, and Slc2a3) were identified and analyzed. SLC2A14 was excluded from this validation as a reliable ortholog is not annotated in the rat genome, consistent with its known status as a primate-specific duplicate of SLC2A3.34 In this cross-species context, the four-gene signature maintained a promising but more modest diagnostic performance, with individual AUCs of 0.719 (Akr1c2), 0.828 (Slc2a3), 0.852 (Ftl), and 0.797 (Tnfrsf12a) (Supplementary Figure 1). This analysis provides preliminary, supportive evidence that the biological pathways implicated by our signature may be relevant across species in ICH pathology, despite the inherent limitations of model systems and the absence of SLC2A14.
Immune Infiltration Landscape and Correlation with Signature Genes
Evaluation of the immune microenvironment using CIBERSORT revealed a distinct profile in the ICH tissue. Notably, the proportion of T follicular helper (Tfh) cells was significantly reduced, whereas of that T gamma delta (Tγδ) cells was elevated in the ICH group compared to the control group (Figures 6A–C). Correlation analysis indicated that the expression of SLC2A14, FTL, TNFRSF12A, and SLC2A3 was positively associated with eosinophils, activated Tγδ cells, and mast cells and negatively correlated with naïve B cells and Tfh cells (Figure 6D). The individual correlation profiles for each signature gene with the 22 immune cell types are detailed in Figures 6E–I.
 |
Figure 6 The immune cell infiltration and association with signature genes. (A) The heat map of immune cell infiltration in the ICH and the Control group. (B) The distribution of immune cells in the ICH and the Control group. (C) Comparison of 22 immune cells between the ICH group and the control group. (D) The heat map of correlations between signature genes and differently infiltrated Immune cells. (E–I) Rod and stick plots of respective correlations between signature genes and different infiltrating immune cells. * represents p<0.05; **represents p<0.01. |
Signature Genes Are Highly Correlated and Upregulated in ICH
Next, we assessed the interrelationships among the five signature genes. A strong positive correlation was observed between most gene pairs (Figures 7A–C), with particularly significant associations (p < 0.001) between TNFRSF12A and SLC2A14, TNFRSF12A and FTL, and SLC2A14 and SLC2A3 (Figures 7D–M). The results indicated that the signature genes shared remarkably analogous traits related to ICH. The strong inter-correlation likely reflects their coordinated involvement in related biological processes or shares remarkably analogous traits related to SBI post-ICH. However, the limited sample size may also amplify correlation estimates. Validation in an independent dataset confirmed that all five signature genes were significantly upregulated in ICH samples compared to normal controls (Figures 8A–F).
 |
Figure 7 Correlation between the five signature genes. (A) Chord diagram of correlation. (B) Heat map of correlation. (D–M) Scatter plot of correlation among AKR1C2, SLC2A14, FTL, TNFRSF12A, and SLC2A3. * represents p<0.05; **represents p<0.01; ***represents p<0.01. |
 |
Figure 8 The expression levels of the signature genes between the ICH group and the control group. (A) The expression heat map of the five signature genes in the GSE24265 dataset. (B-F) The expression of the five signature genes between ICH and control samples in the GSE48556 dataset. **represents p<0.01; ***represents p<0.01. |
Experimental Validation Confirms Upregulation of Key Genes in Clinical Samples
To substantiate our bioinformatic findings, we analyzed clinical samples from patients with ICH. Quantitative RT-PCR revealed that SLC2A3 mRNA levels were significantly elevated in the peripheral blood of ICH patients compared to healthy volunteers (Figures 9A–E). In perihematomal brain tissues, the mRNA expression of SLC2A3, SLC2A14, and TNFRSF12A was markedly higher than in paired normal brain tissues (Figures 9F–J). At the protein level, Western blot analysis confirmed the significant upregulation of SLC2A3 and SLC2A14 in perihematomal tissues (Figures 10A–C). However, the protein levels of AKR1C2, FTL, and TNFRSF12A did not show statistically significant changes (Figures 10D–F) (the original Western blot images are shown in Supplementary Figure 2), a finding that may be attributable to post-transcriptional regulation or sample heterogeneity. Overall, the experimental results further substantiated that the signature genes SLC2A3, SLC2A14, and TNFRSF12A possess the potential to predict ICH and can serve as biomarkers for PANoptosis in ICH.
 |
Figure 9 Experimental verification of mRNA expression in the clinical sample employed by qRT-PCR. (A-E) The mRNA expression levels of the five signature genes within the peripheral blood samples of ICH patients and healthy individuals. (F-J) The mRNA expression levels of the five signature genes in the perihematoma and paired normal brain tissue samples of ICH patients. * represents p<0.05; ns represents no significance. |
 |
Figure 10 Experimental verification of protein expression in the clinical sample. (A) The expression levels of AKR1C2, SLC2A14, FTL, TNFRSF12A, and SLC2A3 were detected by Western blot. (B–F) Protein quantification of the five signature genes. * represents p<0.05; ns represents no significance. Abbreviations: N, Normal; P, Perihematoma. |
Discussion
ICH continues to be a stroke subtype with devastating outcomes, where the processes driving SBI result in largely irreversible neurological deficits.1,3,35 The recently formulated concept of PANoptosis provides a unifying framework for understanding the complex crosstalk between different PCD pathways, including pyroptosis, apoptosis, necroptosis, ferroptosis, and cuproptosis.10,15,36 This paradigm transcends the traditional view of independent cell death pathways by proposing the existence of an integral “PANoptosome” complex.17 This molecular scaffold, which can be nucleated by sensors like Z-DNA-binding protein 1 (ZBP1),11,37 selectively recruits and co-activates key executors from pyroptosis (eg, GSDMD, caspase-1), apoptosis (eg, caspase-3/8), and necroptosis (eg, RIPKs), thereby orchestrating a coordinated inflammatory cell death response.12,13,38 While this paradigm is rapidly gaining recognition as a pivotal mechanism in disease pathogenesis and a promising source of novel biomarkers and therapeutic strategies,28,29 its specific role in ICH remains unclear. In this study, we identified five key PANoptosis-related signature genes (AKR1C2, SLC2A14, FTL, TNFRSF12A, and SLC2A3) in ICH through an integrated bioinformatics and clinical validation approach. These genes exhibited remarkable diagnostic power and were closely linked to altered immune cell infiltration, suggesting that PANoptosis may potentially acts as a pathological hub connecting SBI and neuroinflammation in ICH. This aligns with emerging evidence implicating PANoptosis as a unified PCD mechanism in neurological disorders.23,36
Functional enrichment analysis indicated that these PANoptosis-related signature genes are clustered within the HIF-1 signaling pathway, NF-κB pathway, and TNF cascade, which are key mechanisms involved in ICH-induced metabolic stress and inflammatory amplification.14,35,39 This molecular convergence offers an explanation for the limited success of therapies targeting single PCD pathways and suggests that disrupting the PANoptosis hub may be essential for effective neuroprotection. Experimental validation using clinical specimens confirmed the significant upregulation of SLC2A3, SLC2A14, and TNFRSF12A at the mRNA level in perihematomal tissue. Notably, SLC2A3 was the only gene found to be significantly elevated in the peripheral blood of ICH patients, highlighting its potential as an accessible plasma biomarker. At the protein level, we confirmed the upregulation of SLC2A3 and SLC2A14 expression. The lack of significant changes in AKR1C2, FTL, and TNFRSF12A protein levels could be attributed to factors such as limited sample size, patient heterogeneity, or post-transcriptional regulation. Nonetheless, the overall validation strongly supports our bioinformatics findings.
The glucose transporters SLC2A3 (GLUT3) and SLC2A14 (GLUT14) are critical metabolic adaptors in neurological disorders.40,41 Their marked upregulation in the perihematomal region likely represents a compensatory response to energy depletion after ICH. However, We speculate that this heightened glucose metabolism may paradoxically fuel the process of PANoptosis. Previous studies have linked increased GLUT3 expression to virus-induced neuroinflammation and neuronal apoptosis.42 SLC2A14, believed to originate from a gene duplication of SLC2A3, could sustain glucose uptake under hypoxic conditions, independent of HIF-1α.34,43 Thus, both transporters are likely key players in the hypoxic-ischemic metabolic reprogramming that contributes to PANoptosis after ICH, although their specific roles warrant further investigation.
TNFRSF12A (Fn14), the receptor for TWEAK (TNF-like weak inducer of apoptosis), exhibits strong correlations with disease pathology and has emerged as a potential master regulator of PANoptosis crosstalk.44 Inhibition of the TWEAK-TNFRSF12A axis protects the neurovascular unit from cerebral ischemia.45 Furthermore, apoptosis initiated via the TWEAK/TNFRSF12A pathway can trigger inflammatory cascades and recruit necroptosis effectors such as RIPK1, RIPK3, and MLKL, potentially leading to necroptotic death.46 Given the critical role of neurovascular unit disruption and programmed necrosis in ICH, elevated TNFRSF12A levels likely exacerbate injury and represent a compelling therapeutic target. Although not significantly upregulated in our validation samples, AKR1C2 and FTL play established roles in cell death pathways relevant to PANoptosis. AKR1C2 is implicated in vascular inflammation and can exacerbate vascular smooth muscle cell dysfunction via ferroptosis.47 FTL is essential for maintaining intracellular iron homeostasis. In ICH models, FTL deficiency in microglia promotes iron-catalyzed lipid peroxidation and inflammasome activation,48 and cooperates with mitochondrial iron overload to trigger ferroptosis and apoptosis.49 These observations imply that AKR1C2 and FTL may function as key genes that modulate ferroptosis, thereby contributing to PANoptosis in ICH.
The specificity of this five-gene signature for PANoptosis, as different from a general stress response, lies in its integrated representation of the pathway’s core biological features. While cellular stresses like hypoxia or oxidative stress may induce individual genes such as SLC2A3, the coordinated upregulation of our signature points to a more programmed and interconnected death process. PANoptosis is characterized by a demand for intense metabolic activity,50 which is likely by the induction of signature genes, the glucose transporters SLC2A3 and SLC2A14, suggesting a substrate supply for inflammatory execution beyond mere compensatory glycolysis. Simultaneously, the upregulation of the receptor TNFRSF12A (Fn14) provides a potential trigger capable of initiating caspase-8 activity—a recognized molecular switch that can orchestrate apoptotic, pyroptotic, and necroptotic signaling cascades,51 thereby integrating multiple death modalities.52 Furthermore, the concurrent dysregulation of FTL and AKR1C2 indicates a shift in iron homeostasis and lipid peroxidation sensitivity, effectively priming the cellular microenvironment for ferroptosis.47,48 Crucially, evidence suggests that ferroptotic stress and the NLRP3 inflammasome activation engage in intricate crosstalk, potentially forming a feed-forward loop that amplifies inflammatory cell death.53,54 This interplay mechanistically links iron-dependent ferroptosis to pyroptotic inflammation. Thus, our signature genes does not merely reflect the stress state after cellular injury but captures the essential triad of metabolic reprogramming, death signal integration, and lytic microenvironment remodeling, which are definitive of PANoptosis.10,23
Neuroinflammation post-ICH disrupts the blood-brain barrier, allowing immune cell infiltration, which exacerbates damage.55 Our CIBERSORT analysis revealed significant changes in the immune landscape, notably a reduction in T follicular helper (Tfh) cells and an increase in T gamma delta (Tγδ) cells. Immune microenvironment remodeling is a critical enabler of PANoptosis.56,57 Tfh cells are essential for B cell activation and anti-inflammatory cytokine production,58 their decline may impair the endogenous control of neuroinflammation, potentially permitting uncontrolled NLRP3 inflammasome activation.59 Conversely, increased Tγδ cell infiltration has been associated with anti-neuroinflammatory effects in cerebral microbleeds.60 The strong correlation of SLC2A14, SLC2A3, and TNFRSF12A with eosinophils may indicate a novel damage mechanism, as eosinophil-derived proteins can induce neuronal calcium overload, a trigger for copper-dependent cell death.31
Our study pioneers the link between PANoptosis and ICH pathogenesis through an integrated bioinformatics and experimental approach. We confirmed the central involvement of SLC2A3, SLC2A14, and TNFRSF12A, demonstrating their consistent upregulation in perihematomal tissues. A key translational finding was the significant elevation of SLC2A3 mRNA levels in the peripheral blood of ICH patients. This systemic presence suggests that SLC2A3 has strong potential as a readily accessible plasma biomarker for ICH. The systemic detection of SLC2A3 mRNA suggests its potential utility as a rapid, non-invasive biomarker in emergency settings, possibly aiding in early differential diagnosis of ICH or monitoring of SBI progression, pending validation in large prospective trials. The exceptional diagnostic capacity of our five-gene signature further underscores that PANoptosis possibly constitutes an early and quantifiable driver of SBI, providing both fundamental insights and a feasible path toward improved ICH patients management.
However, our study has several limitations. Given the exploratory nature of this study and the limited sample sizes of both the expression dataset and the validation cohort, limitations exist in interpreting the robustness of specific results (eg, AUC value, CIBERSORT and protein-level comparisons in WB). These findings provide preliminary evidence that merits further validation in larger cohorts. Furthermore, our cross-species validation was partial due to the absence of a rat ortholog for SLC2A14, highlighting a common challenge in translational research. Finally, the precise mechanistic roles of these signature genes, particularly SLC2A3, in orchestrating PANoptosis following ICH remain to be fully determined and represent an important focus for future investigation. Despite these limitations, our integrated analysis provides compelling preliminary evidence that PANoptosis is a promising target for understanding and treating ICH.
Conclusions
In summary, we identified a five-gene PANoptosis signature (AKR1C2, SLC2A14, FTL, TNFRSF12A, and SLC2A3) in ICH, which demonstrates significant diagnostic potential and a close association with altered immune infiltration, suggesting its role in SBI via immunoregulatory mechanisms. Clinical samples further verified that SLC2A3, SLC2A14, and TNFRSF12A are upregulated and likely contribute to PANoptosis and SBI pathological progression after ICH. While further validation in larger cohorts and functional investigation of the underlying mechanisms are warranted, this study establishes a novel molecular framework and provides promising candidates for the development of early diagnostic and immunomodulatory strategies for ICH.
Data Sharing Statement
The original results presented in this study are available from the corresponding author on request.
Ethics Approval and Informed Consent
This study was conducted in accordance with the Declaration of Helsinki and was approved by the Ethics Committee of Shenshan Medical Center, Memorial Hospital of Sun Yat-sen University (2024-SSKY-220). Written informed consent was obtained from all participants or their authorized representatives.
Author Contributions
All authors made a significant contribution to the work reported, whether that is in the conception, study design, execution, acquisition of data, analysis and interpretation, or in all these areas; took part in drafting, revising or critically reviewing the article; gave final approval of the version to be published; have agreed on the journal to which the article has been submitted; and agree to be accountable for all aspects of the work.
Funding
This research was supported by grants from the National Natural Science Foundation of China (82201279), Administration of Traditional Chinese Medicine of Guangdong Province (20251409), Guangdong Medical Scientific Research Foundation (B2025201), Shanwei Science and Technology Plan Project (2024C046, 2024C041), and Yat-sen Scholarship for Young Scientists to Yinlun Weng.
Disclosure
The authors declare that they have no conflicts of interest in this work.
References
1. Sheth KN, Ropper AH. Spontaneous intracerebral hemorrhage. N Engl J Med. 2022;387(17):1589–18. doi:10.1056/NEJMra2201449
2. Tsao CW, Aday AW, Almarzooq ZI, et al. Heart disease and stroke statistics-2022 update: a report from the American heart association. Circulation. 2022;145:e153–e639. doi:10.1161/cir.0000000000001052
3. Zhu H, Wang Z, Yu J, et al. Role and mechanisms of cytokines in the secondary brain injury after intracerebral hemorrhage. Prog Neurobiol. 2019;178:101610. doi:10.1016/j.pneurobio.2019.03.003
4. Xue M, Yong VW. Neuroinflammation in intracerebral haemorrhage: immunotherapies with potential for translation. Lancet Neurol. 2020;19:1023–1032. doi:10.1016/s1474-4422(20)30364-1
5. Liao KH, Sung CW, Huang YN, Li WJ, Yu PC, Wang JY. Therapeutic potential of drugs targeting pathophysiology of intracerebral hemorrhage: from animal models to clinical applications. Curr Pharm Des. 2017;23:2212–2225. doi:10.2174/1381612822666161027151624
6. Hostettler IC, Seiffge DJ, Werring DJ. Intracerebral hemorrhage: an update on diagnosis and treatment. Expert Rev Neurother. 2019;19:679–694. doi:10.1080/14737175.2019.1623671
7. Bobinger T, Burkardt P, Bh H, Manaenko A. Programmed cell death after intracerebral hemorrhage. Curr Neuropharmacol. 2018;16:1267–1281. doi:10.2174/1570159x15666170602112851
8. Shen X, Zhu J, Gu Y, et al. Prognostic role of cuproptosis-related gene after intracerebral hemorrhage in mice. Cell Mol Neurobiol. 2025;45:48. doi:10.1007/s10571-025-01571-z
9. Eskander G, Abdelhamid SG, Wahdan SA, Radwan SM. Insights on the crosstalk among different cell death mechanisms. Cell Death Discov. 2025;11:56. doi:10.1038/s41420-025-02328-9
10. Malireddi RKS, Kesavardhana S, Kanneganti T-D. ZBP1 and TAK1: master regulators of NLRP3 inflammasome/pyroptosis, apoptosis, and necroptosis (PAN-optosis). Front Cell Infect Microbiol. 2019;9:406. doi:10.3389/fcimb.2019.00406
11. Lee S, Karki R, Wang Y, Nguyen LN, Kalathur RC, Kanneganti T-D. AIM2 forms a complex with pyrin and ZBP1 to drive PANoptosis and host defence. Nature. 2021;597(7876):415–419. doi:10.1038/s41586-021-03875-8
12. Duan J, Cao Z, Zhou Z, et al. Mitochondrial dysfunction drives ZBP1-mediated PANoptosis to increase the susceptibility of heart failure with preserved ejection fraction-associated atrial fibrillation. J Adv Res. 2025. doi:10.1016/j.jare.2025.09.016
13. Yuan T, Yang HY, Li YP, et al. Scutellarin inhibits inflammatory PANoptosis by diminishing mitochondrial ROS generation and blocking PANoptosome formation. Int Immunopharmacol. 2024;139:112710. doi:10.1016/j.intimp.2024.112710
14. Lei P, Li Z, Hua Q, et al. Ursolic acid alleviates neuroinflammation after intracerebral hemorrhage by mediating microglial pyroptosis via the NF-κB/NLRP3/GSDMD pathway. Int J Mol Sci. 2023;24. doi:10.3390/ijms241914771
15. Lin JF, Hu PS, Wang YY, et al. Phosphorylated NFS1 weakens oxaliplatin-based chemosensitivity of colorectal cancer by preventing PANoptosis. Signal Transduct Target Ther. 2022;7:54. doi:10.1038/s41392-022-00889-0
16. Chen W, Jiang Y, Zeng J, et al. FDX1 promotes elesclomol-induced PANoptosis in diffuse large B-cell lymphoma via activating IRF3/IFN-β signaling. Oncogene. 2025;44:2303–2314. doi:10.1038/s41388-025-03366-4
17. Pandeya A, Kanneganti TD. Therapeutic potential of PANoptosis: innate sensors, inflammasomes, and RIPKs in PANoptosomes. Trends Mol Med. 2024;30:74–88. doi:10.1016/j.molmed.2023.10.001
18. Deng XX, Li SS, Sun FY. Necrostatin-1 prevents necroptosis in brains after ischemic stroke via inhibition of RIPK1-mediated RIPK3/MLKL signaling. Aging Dis. 2019;10:807–817. doi:10.14336/ad.2018.0728
19. Ma X, Xin D, She R, Liu D, Ge J, Mei Z. Novel insight into cGAS-STING pathway in ischemic stroke: from pre- to post-disease. Front Immunol. 2023;14:1275408. doi:10.3389/fimmu.2023.1275408
20. Sundaram B, Pandian N, Mall R, et al. NLRP12-PANoptosome activates PANoptosis and pathology in response to heme and PAMPs. Cell. 2023;186:2783–2801.e2720. doi:10.1016/j.cell.2023.05.005
21. Henkel FDR, O’Neill LAJ. NLRP12 drives PANoptosis in response to heme. Trends Immunol. 2023;44:574–576. doi:10.1016/j.it.2023.06.008
22. She H, Zheng J, Zhao G, et al. Arginase 1 drives mitochondrial cristae remodeling and PANoptosis in ischemia/hypoxia-induced vascular dysfunction. Signal Transduct Target Ther. 2025;10:167. doi:10.1038/s41392-025-02255-2
23. Hou K, Pan W, Liu L, et al. Molecular mechanism of PANoptosis and programmed cell death in neurological diseases. Neurobiol Dis. 2025;209:106907. doi:10.1016/j.nbd.2025.106907
24. Sümbül H, Yüzer AH. Design of a fuzzy input expert system visual information interface for classification of apnea and hypopnea. Multimedia Tools Appl. 2024;83:21133–21152. doi:10.1007/s11042-023-16152-9
25. Sümbül H. A novel mems and flex sensor-based hand gesture recognition and regenerating system using deep learning model. IEEE Access. 2024;12:133685–133693. doi:10.1109/ACCESS.2024.3448232
26. Yang P, Feng P, Tian G, Zhao G, Yuan G, Pan Y. Integrative machine learning and bioinformatics analysis unveil key genes for precise glioma classification and prognosis evaluation. Comput Biol Chem. 2025;119:108510. doi:10.1016/j.compbiolchem.2025.108510
27. Guo J, Dong R, Zhang R, Yang F, Wang Y, Miao W. Interpretable machine learning model for predicting the prognosis of antibody positive autoimmune encephalitis patients. J Affect Disord. 2025;369:352–363. doi:10.1016/j.jad.2024.10.010
28. Yi X, Li J, Zheng X, et al. Construction of PANoptosis signature: novel target discovery for prostate cancer immunotherapy. Mol Ther Nucleic Acids. 2023;33:376–390. doi:10.1016/j.omtn.2023.07.010
29. Song F, Wang CG, Mao JZ, et al. PANoptosis-based molecular subtyping and HPAN-index predicts therapeutic response and survival in hepatocellular carcinoma. Front Immunol. 2023;14:1197152. doi:10.3389/fimmu.2023.1197152
30. Sun Y, Li Q, Guo H, He Q. Ferroptosis and iron metabolism after intracerebral hemorrhage. Cells. 2022;12. 10.3390/cells12010090.
31. Tsvetkov P, Coy S, Petrova B, et al. Copper induces cell death by targeting lipoylated TCA cycle proteins. Science. 2022;375:1254–1261. doi:10.1126/science.abf0529
32. Mandrekar JN. Receiver operating characteristic curve in diagnostic test assessment. J Thorac Oncol. 2010;5:1315–1316. doi:10.1097/JTO.0b013e3181ec173d
33. Jc H, SM G, CS A, et al. Guidelines for the management of spontaneous intracerebral hemorrhage: a guideline for healthcare professionals from the American Heart Association/American Stroke Association. Stroke. 2015;46:2032–2060. doi:10.1161/str.0000000000000069
34. Wu X, Freeze HH. GLUT14, a duplicon of GLUT3, is specifically expressed in testis as alternative splice forms. Genomics. 2002;80:553–557. doi:10.1006/geno.2002.7010
35. Loan JJ, Kirby C, Emelianova K, et al. Secondary injury and inflammation after intracerebral haemorrhage: a systematic review and meta-analysis of molecular markers in patient brain tissue. J Neurol Neurosurg Psychiatry. 2022;93:126–132. doi:10.1136/jnnp-2021-327098
36. Yan WT, Yang YD, Hu XM, et al. Do pyroptosis, apoptosis, and necroptosis (PANoptosis) exist in cerebral ischemia? Evidence from cell and rodent studies. Neural Regen Res. 2022;17:1761–1768. doi:10.4103/1673-5374.331539
37. Cui Y, Lin H, Ma J, et al. Ischemia-reperfusion injury induces ZBP1-dependent PANoptosis in endothelial cells. Biochim Biophys Acta Mol Basis Dis. 2025;1871:167782. doi:10.1016/j.bbadis.2025.167782
38. You YP, Yan L, Ke HY, et al. Baicalin inhibits PANoptosis by blocking mitochondrial Z-DNA formation and ZBP1-PANoptosome assembly in macrophages. Acta Pharmacol Sin. 2025;46:430–447. doi:10.1038/s41401-024-01376-8
39. Rendevski V, Aleksovski B, Stojanov D, et al. Peripheral glutamate and TNF-α levels in patients with intracerebral hemorrhage: their prognostic values and interactions toward the formation of the edemal volume. Neurol Neurochir Pol. 2018;52:207–214. doi:10.1016/j.pjnns.2017.10.003
40. Peng W, Tan C, Mo L, et al. Glucose transporter 3 in neuronal glucose metabolism: health and diseases. Metabolism. 2021;123:154869. doi:10.1016/j.metabol.2021.154869
41. Daida T, Shin BC, Cepeda C, Devaskar SU. Neurodevelopment is dependent on maternal diet: placenta and brain glucose transporters GLUT1 and GLUT3. Nutrients. 2024;16. 10.3390/nu16142363.
42. Schreiber-Stainthorp W, Solomon J, Lee JH, et al. Longitudinal in vivo imaging of acute neuropathology in a monkey model of Ebola virus infection. Nat Commun. 2021;12:2855. doi:10.1038/s41467-021-23088-x
43. Valli A, Morotti M, Zois CE, et al. Adaptation to HIF1α deletion in hypoxic cancer cells by upregulation of GLUT14 and creatine Metabolism. Mol Cancer Res. 2019;17:1531–1544. doi:10.1158/1541-7786.Mcr-18-0315
44. Burkly LC, Michaelson JS, Zheng TS. TWEAK/Fn14 pathway: an immunological switch for shaping tissue responses. Immunol Rev. 2011;244:99–114. doi:10.1111/j.1600-065X.2011.01054.x
45. Yepes M. TWEAK and Fn14 in the Neurovascular Unit. Front Immunol. 2013;4:367. doi:10.3389/fimmu.2013.00367
46. Martin-Sanchez D, Fontecha-Barriuso M, Carrasco S, et al. TWEAK and RIPK1 mediate a second wave of cell death during AKI. Proc Natl Acad Sci U S A. 2018;115:4182–4187. doi:10.1073/pnas.1716578115
47. Meng Y, Sun HY, He Y, et al. BET inhibitors potentiate melanoma ferroptosis and immunotherapy through AKR1C2 inhibition. Mil Med Res. 2023;10:61. doi:10.1186/s40779-023-00497-1
48. Fei X, Dou Y, Yang Y, et al. Lipocalin-2 inhibition alleviates neural injury by microglia ferroptosis suppression after experimental intracerebral hemorrhage in mice via enhancing ferritin light chain expression. Biochim Biophys Acta Mol Basis Dis. 2024;1870:167435. doi:10.1016/j.bbadis.2024.167435
49. Peng C, Zhang Y, Lang X, Zhang Y. Role of mitochondrial metabolic disorder and immune infiltration in diabetic cardiomyopathy: new insights from bioinformatics analysis. J Transl Med. 2023;21:66. doi:10.1186/s12967-023-03928-8
50. Ye Z, Deng M, Yang Y, et al. Epithelial mitochondrial fission-mediated PANoptosis is crucial for ulcerative colitis and its inhibition by saquinavir through Drp1. Pharmacol Res. 2024;210:107538. doi:10.1016/j.phrs.2024.107538
51. Wang X, Cheng D, Hu G, et al. Tumor necrosis factor (TNF) receptor expression determines keratinocyte fate upon stimulation with TNF-Like weak inducer of apoptosis. Mediators Inflamm. 2019;2019:2945083. doi:10.1155/2019/2945083
52. Ikner A, Ashkenazi A. TWEAK induces apoptosis through a death-signaling complex comprising receptor-interacting protein 1 (RIP1), Fas-associated death domain (FADD), and caspase-8. J Biol Chem. 2011;286:21546–21554. doi:10.1074/jbc.M110.203745
53. Guo Z, Liu Y, Chen D, et al. Targeting regulated cell death: apoptosis, necroptosis, pyroptosis, ferroptosis, and cuproptosis in anticancer immunity. J Transl Int Med. 2025;13:10–32. doi:10.1515/jtim-2025-0004
54. Xu Q, Zhao B, Ye Y, et al. Relevant mediators involved in and therapies targeting the inflammatory response induced by activation of the NLRP3 inflammasome in ischemic stroke. J Neuroinflammation. 2021;18:123. doi:10.1186/s12974-021-02137-8
55. Lin J, Xu Y, Guo P, et al. CCL5/CCR5-mediated peripheral inflammation exacerbates blood‒brain barrier disruption after intracerebral hemorrhage in mice. J Transl Med. 2023;21:196. doi:10.1186/s12967-023-04044-3
56. Zhang X, Tang B, Luo J, et al. Cuproptosis, ferroptosis and PANoptosis in tumor immune microenvironment remodeling and immunotherapy: culprits or new hope. Mol Cancer. 2024;23:255. doi:10.1186/s12943-024-02130-8
57. Wan J, Zhao J, Fang X. Dynamics of the immune microenvironment and immune cell PANoptosis in colorectal cancer: recent advances and insights. Front Immunol. 2024;15:1502257. doi:10.3389/fimmu.2024.1502257
58. Nurieva RI, Chung Y. Understanding the development and function of T follicular helper cells. Cell Mol Immunol. 2010;7:190–197. doi:10.1038/cmi.2010.24
59. Rayasam A, Kijak JA, Kissel L, et al. CXCL13 expressed on inflamed cerebral blood vessels recruit IL-21 producing T(FH) cells to damage neurons following stroke. J Neuroinflammation. 2022;19:125. doi:10.1186/s12974-022-02490-2
60. Su X, Yang S, Li Y, et al. γδ T cells recruitment and local proliferation in brain parenchyma benefit anti-neuroinflammation after cerebral microbleeds. Front Immunol. 2023;14:1139601. doi:10.3389/fimmu.2023.1139601
 © 2026 The Author(s). This work is published and licensed by Dove Medical Press Limited. The
full terms of this license are available at https://www.dovepress.com/terms
and incorporate the Creative Commons Attribution
- Non Commercial (unported, 4.0) License.
By accessing the work you hereby accept the Terms. Non-commercial uses of the work are permitted
without any further permission from Dove Medical Press Limited, provided the work is properly
attributed. For permission for commercial use of this work, please see paragraphs 4.2 and 5 of our Terms.
© 2026 The Author(s). This work is published and licensed by Dove Medical Press Limited. The
full terms of this license are available at https://www.dovepress.com/terms
and incorporate the Creative Commons Attribution
- Non Commercial (unported, 4.0) License.
By accessing the work you hereby accept the Terms. Non-commercial uses of the work are permitted
without any further permission from Dove Medical Press Limited, provided the work is properly
attributed. For permission for commercial use of this work, please see paragraphs 4.2 and 5 of our Terms.
Recommended articles
Immune Cell Infiltration Analysis Based on Bioinformatics Reveals Novel Biomarkers of Coronary Artery Disease
He T, Muhetaer M, Wu J, Wan J, Hu Y, Zhang T, Wang Y, Wang Q, Cai H, Lu Z
Journal of Inflammation Research 2023, 16:3169-3184
Published Date: 26 July 2023


New Insights into Roles of IL-7R Gene as a Therapeutic Target Following Intracerebral Hemorrhage
Cui J, Wang H, Liu S, Zhao Y
Journal of Inflammation Research 2024, 17:399-415
Published Date: 18 January 2024
Analysis and Validation of Critical Signatures and Immune Cell Infiltration Characteristics in Doxorubicin-Induced Cardiotoxicity by Integrating Bioinformatics and Machine Learning
Huang C, Pei J, Li D, Liu T, Li Z, Zhang G, Chen R, Xu X, Li B, Lian Z, Chu XM
Journal of Inflammation Research 2024, 17:669-685
Published Date: 2 February 2024
Identification and Analysis of PANoptosis-Related Genes in Sepsis-Induced Lung Injury by Bioinformatics and Experimental Verification
Yang Z, Kao X, Huang N, Yuan K, Chen J, He M
Journal of Inflammation Research 2024, 17:1941-1956
Published Date: 28 March 2024
Cuproptosis-Related Biomarkers and Characterization of Immune Infiltration in Sepsis
Wang Y, Qiu X, Liu J, Liu X, Pan J, Cai J, Liu X, Qu S
Journal of Inflammation Research 2024, 17:2459-2478
Published Date: 22 April 2024