")
Back to Journals » Journal of Inflammation Research » Volume 17
New Insights into Roles of IL-7R Gene as a Therapeutic Target Following Intracerebral Hemorrhage
Authors Cui J , Wang H, Liu S, Zhao Y
Received 22 September 2023
Accepted for publication 9 January 2024
Published 18 January 2024 Volume 2024:17 Pages 399—415
DOI https://doi.org/10.2147/JIR.S438205
Checked for plagiarism Yes
Review by Single anonymous peer review
Peer reviewer comments 3
Editor who approved publication: Professor Ning Quan
Jie Cui,1– 4,* Hongbin Wang,5,6,* Shiyao Liu,1– 4 Yiming Zhao1– 4
1Jiangsu Institute of Hematology, The First Affiliated Hospital of Soochow University, Suzhou, 215006, People’s Republic of China; 2National Clinical Research Center for Hematologic Diseases, The First Affiliated Hospital of Soochow University, Suzhou, 215006, People’s Republic of China; 3NHC Key Laboratory of Thrombosis and Hemostasis, The First Affiliated Hospital of Soochow University, Suzhou, 215006, People’s Republic of China; 4Collaborative Innovation Center of Hematology, Soochow University, Suzhou, 215006, People’s Republic of China; 5Department of Emergency, Jiangyin Hospital of Traditional Chinese Medicine, Wuxi, 214400, People’s Republic of China; 6Department of Intensive Care Unit, The First Affiliated Hospital of Soochow University, Suzhou, 215006, People’s Republic of China
*These authors contributed equally to this work
Correspondence: Yiming Zhao, Jiangsu Institute of Hematology, National Clinical Research Center for Hematologic Diseases, NHC Key Laboratory of Thrombosis and Hemostasis, The First Affiliated Hospital of Soochow University, Suzhou, 215006, People’s Republic of China, Tel +86-512-67781379, Fax +86-512-65113556, Email [email protected]
Background: Spontaneous intracerebral hemorrhage (ICH) is a subtype of stroke leading to high rates of morbidity and mortality in adults. Recent studies showed that immune and inflammatory responses might play essential roles in secondary brain injury. The purpose of this article was to provide a reference for further therapeutic strategies for ICH patients.
Methods: GSE206971 and GSE216607 datasets from the gene expression omnibus (GEO) database were used to screen the highly immune-related differentally expressed genes (IRDEGs). We used the CIBERSORT algorithm to assess the level of immune signatures infiltration and got the possible function of IRDEGs which was analyzed through Gene Ontology (GO) analysis and Kyoto Encyclopedia of Genes and Genomes (KEGG) pathway analysis. Protein-protein interaction (PPI) networks and six hub genes were identified in the Cytoscape plug-in. GSVA algorithm was performed to evaluate the potential pathways of six hub genes in ICH samples. The expression level of IL-7R chosen from six hub genes was further validated by Western blotting. The cell models of ICH were established for the research of IL-7/IL-7R signaling way.
Results: A total of six hub genes (ITGAX, ITGAM, CCR2, CD28, SELL, and IL-7R) were identified. IL-7R was highly expressed in the mice ICH group, as shown by immunoblotting. Next, we constructed ICH cell models in RAW264.7 cells and BV2 cells. After treatment with IL-7, iNOS expression (M1 marker) was greatly inhibited while Arg-1(M2 marker) was enhanced, and it might function via the JAK3/STAT5 signaling pathway.
Conclusion: The hypothesis is proposed that the IL-7/IL-7R signaling pathway might regulate the inflammatory process following ICH by regulating microglia polarization. Our study is limited and requires more in-depth experimental confirmation.
Keywords: immune infiltration, intracerebral hemorrhage, CIBERSORT algorithm, IL-7 receptor
Introduction
Spontaneous intracerebral hemorrhage (ICH) remains one of the most devastating cerebrovascular diseases of significant morbidity and mortality,1,2 with a poor prognosis and a substantial burden on families.2 Indeed, the occurrence of ICH is rising with the increasing risk factors, such as the age of the population, hypertension, obesity, diabetes, and alcohol consumption.3 The primary bleed increases intracranial pressure which can cause physical disruption of the brain regions, subsequently, brain damage exacerbates neuroinflammatory reactions and release of clots.4 The individuals who survive the initial episode of ICH are susceptible to secondary damage to their peripheral parenchyma induced by the molecular and cellular reactions of the hematoma, potentially leading to long-term dysfunction or even death.5 Greater knowledge of the causes of harm and prospective treatment options for ICH has resulted from a significant increase in preclinical and clinical investigations on ICH over the past 20 years.6 While some researches have demonstrated the potential of several neuroprotective medications, including thrombin inhibitors, cytotoxic pharmaceuticals, antioxidant drugs, and anti-inflammatory therapies, large-scale clinical trials have not proven the effectiveness of these medications.3,7 Thus, it is necessary to explore a more comprehensive understanding of the mechanism underlying ICH and the identification of novel therapeutic targets at different phases of ICH.
It has been discovered that the immune cascade plays a crucial role in ICH-induced brain damage and repair. Neuroinflammation is caused by a large number of immune cells triggering both innate and adaptive immune responses.8 This leads to the release of multiple cytokines, chemokines, free radicals, and other potentially toxic chemicals, which in turn disrupt the blood-brain barrier (BBB), brain edema, and cell death.3,9 Microglia are known as “first responders” in the early phases of ICH since they are resident immune cells in the brain.10 Activated microglia develop either a classically activated (M1, pro-inflammatory) or activated (M2, anti-inflammatory) phenotype in vitro, a process known as polarization.11,12 Acute neuroinflammation and hematoma regression during ICH are significantly influenced by polarized macrophages and microglia.10 Activation of giant microglia was evident peri-hematoma from day 5 and consistently 7–12 days post-ICH.13 Local microglia sense the injury and are triggered by the release of various cytokines and chemokines, which coordinate the leukocyte recruitment to the injury regions.14 Increasingly, studies have reported that inhibiting microglia polarization toward M1 and promoting it toward M2 can resolve nerve injury and promote repair.15 Several targets that control microglia polarization to lessen inflammatory reactions have been proposed as successful therapeutic approaches for brain tissue injured by ICH.16,17 However, clinical studies are necessary to confirm the safety and efficacy of therapy. The mechanisms involved in microglial activation following ICH are still required to be deeply investigated to seek new and promising cell-specific targets.
IL-7R is expressed by hematopoietic cells, especially those related to the lymphoid lineage, which includes developing T cells, B cells, and precursors of fetal dendritic cells.18 The level of expression of IL-7R regulates the homeostasis of the immune system and the development of normally functioning T cells.19 Nevertheless, several studies have shown that a variety of cancerous cell lines, such as those from lung cancer, melanoma, breast cancer, leukemia, and cutaneous T-cell lymphoma, express IL-7R.20 IL-7/IL-7R signal transduction has bidirectional regulatory effects on tumors by activating downstream signaling pathways.21–24 It was found that IL-7R is also involved in the progression and pathophysiology of multiple inflammatory disorders, including inflammatory bowel disease (IBD) and autoimmune encephalomyelitis (EAE).25,26 It has been hypothesized that IL-7R may be associated with molecular subtypes of ischemic stroke (IS) and immunomodulation.27 By examining the in situ phenotypes of human monocytes in COVID-19 and RA patients, recent research discovered that CD127 designated a subgroup of monocytes/macrophages that kept hypo-inflammatory behaviors inside the highly inflammatory tissue settings.28 The role of IL-7R in cerebral hemorrhage is still poorly explored, more thorough research is needed to confirm the role of IL-7R in ICH.
In this study, we analyzed the infiltration proportions of immune cells by the CIBERSORT algorithm and screened out immune-related differentially expressed genes (IRDEGs) of ICH tissue compared to SHAM brain tissue by bioinformatics analysis. Next, the IRDEGs were analyzed by Gene Ontology and Kyoto Encyclopedia of Genes and Genomes (KEGG). In addition, the hub genes were identified from the protein-protein interaction (PPI) network. Next, we analyzed the correlation between six hub genes and immune signatures. The IL-7R was chosen to preliminary explore whether the IL-7/IL-7R pathway affects the M1/M2 phenotypic transition in microglia/macrophages. The findings of the present study may provide a better understanding of pathophysiological mechanisms after ICH and further development of immunotherapeutic strategies for ICH patients.
Materials and Methods
Data Collection
RNA-seq transcriptome profiles of GSE206971, GSE216607, and GSE200575 in our research were obtained from the Gene Expression Omnibus (GEO, http://www.ncbi.nlm.nih.gov/geo/) database. The GSE206971 dataset contains 3 intracerebral hemorrhage (ICH) models and 3 Sham models (SHAM). The GSE216607 and GSE200575 datasets include 3 intracerebral hemorrhage (ICH) models, and 3 Sham models (SHAM), respectively. The GPL24247 platform was used to generate the transcriptome sequencing data, which are exclusively from C57BL/6 mice.
Analysis of Differentially Expressed Genes (DEGs)
Biojupies (https://maayanlab.cloud/biojupies/) is used to identify DEGs between ICH and SHAM samples in datasets from the GEO database. The cutoff criteria were set as | log2 fold change (FC) | > 1 and p < 0.05. Volcano diagrams were delineated by statistical software environment R, version 4.2.1 (https://www.r-project.org/). BioLadder (https://www.bioladder.cn/web/#/pro/cloud) was used to create Venn diagrams.
Proportions of Immune Cell Subsets Between ICH and SHAM Samples
CIBERSORT is an analytical algorithm,29 which can be used to evaluate the cell proportions of 25 immune subsets in each sample.30 The result was visualized by SangerBox software (http://sangerbox.com/).31
Functional Enrichment Analysis
The Database for Annotation, Visualization, and Integrated Discovery (DAVID, https://david.ncifcrf.gov/) was used for analyzing immune-related differentially expressed genes (IRDEGs) of each GEO dataset.32,33 The results of Gene Ontology (GO) and Kyoto Encyclopedia of Genes and Genomes (KEGG) pathway analysis were obtained. In this investigation, the top five results were displayed in ascending order of p-value (p <0.05). The analysis of gene set enrichment analysis (GSEA) was applied using GSEA software against the reference gene sets m2.cp.v2022.1.Mm.symbols.gmt, which was downloaded from the Molecular Signatures Database (MSigDB, http://software.broadinstitute.org/gsea/index.jsp).
Construction of PPI Network
Tool for the Retrieval of Interacting Genes (STRING, http://string.embl.de/) was used to construct a Protein-protein interaction network (PPI) of the identified IRDEGs. The PPI network was visualized by Cytoscape software (http://www.cytoscape.org/). A confidence score > 0.7 was considered as the criterion of judgment. Genes were represented by the nodes, and the connections between the genes were shown by the edges.
Selection and Analysis of Hub Genes
Key PPI network modules were identified through clustering analysis of gene networks using the Cytoscape plug-in Molecular Complex Detection (MCODE). The criteria of MCODE analysis are that node score cutoff = 0.2, degree cutoff = 2, Max depth = 100, and K-core > 3. The cytoHubba is a common tool for further identifying the hub genes. The top 10 hub genes were determined using the maximal clique centrality (MCC) algorithm, which was ranked in descending order of score.
GeneMANIA (http://genemania.org/) was used to predict the functions of hub genes.34 The Pearson correlation analysis was performed between hub genes and immune cells to further analyze the immune mechanism during the development of ICH using the R package.
Gene Set Variation Analysis (GSVA)
The gene sets which included immune processes, inflammation, and signaling pathways were obtained from the GSEA. Under default conditions, the functional enrichment score of each sample was determined using the GSVA package (R environment).35 The pheatmap package was used to create a heatmap of the enrichment results (R environment).
Construction of a miRNA-mRNA Network
The database, miRWalk (http://129.206.7.150/), was used to predict the critical miRNAs.36 The interactions between miRNAs and mRNAs were integrated to construct a miRNA-mRNA correlation network. The target gene binding region was 3′UTR. The selected miRNAs were also found in the miRDB database (http://www.mirdb.org/). miRNAs that target more than two genes were labeled.
Animals
All animal experiments were performed in compliance with the Ethics Committee of Soochow University (Approval No. SUDA20230825A01) and the National Institutes of Health Guide for the Care and Use of Laboratory Animals. Male C57BL/6 mice (weight 23–28 g, 8–10 weeks old) were obtained from Jihui Laboratory Animal Company (Shanghai, China). All the animals were housed under controlled conditions (controlled temperature of 22 ± 1 °C, relative humidity of 50 ± 1%, 12 h light/dark cycle, and minimum-range environmental noise) and provided with standard food and water. Every attempt was made to reduce the quantity of mice and their misery. The animals were allocated into the following two groups at random: (1) SHAM: mice undergoing surgery in the absence of ICH; (2) ICH: mice receiving autologous blood injection. Blinding was used for the experimental procedures and result evaluations.
ICH Mouse Model
The procedure for modeling ICH by injection of autologous whole blood was referenced from the protocol of Rynkowski et al.37 Briefly, mice were anesthetized using 1% pentobarbital sodium (50 mg/kg, i.p.). After anesthesia, the mice were fixed in the prone position on the brain stereotaxic apparatus.30 μL autologous blood from the angular vein was injected into the striatum at 2 μL/min (10 μL followed by a 5-minute pause and then 20 μL followed by a 3 to 5 minutes pause) at the following coordinates relative to the bregma: 0.2 mm anterior, 2.3 mm lateral, and 3.5 mm deep. The sham-operated mice received the same procedures, including needle insertion, but they were not given blood injections. After 72 hours, mice were euthanized by deep anesthesia and then perfused transcardially with ice-cold phosphate-buffered saline (PBS). The entire brain of each mouse was weighed and the brain tissue surrounding the hematoma was subsequently isolated and placed in a −80 °C freezer for further experiments.
Cell Culture
Murine macrophages (RAW264.7, Procell Life Science&Technology, CL-0190, Wuhan, China) were cultured in DMEM high-glucose medium (Procell Life Science&Technology, PM150210, Wuhan, China). Mouse microglia cells (BV2) were purchased from Boster Biological Technology (Wuhan, China) and maintained in MEM (Procell Life Science&Technology, PM150410, Wuhan, China). RAW264.7 cells and BV2 cells were all supplemented with 10% FBS and 1% penicillin–streptomycin at 37°C and 5% CO2. The results of STR typing were favorable, and no human cells were contaminated.
RAW264.7 and BV2 cells were digested with 0.25% trypsin when they reached 80–90% confluence. After counting the cells, the cells were inoculated into 6-well plates at 5×10⁵/2 mL and cultured overnight. The next day, different concentrations of hemin (0, 20, 40, 60, and 80 μM) were added to each well for stimulation, and the protein expression levels of IL-7R, inducible nitric oxide synthase (iNOS), and arginase-1 (Arg-1) were determined by Western blotting after 24 hours. Treatment: To investigate whether IL-7 alters the equilibrium of M1 and M2 differentiation, RAW264.7 and BV2 cells were treated with hemin (80 μM each of imidazole in dimethylsulfoxide) for 24 h. IL-7 (50, 100, and 200 ng/mL) was pre-spiked for 1 h. The levels of IL-7R, iNOS, and Arg-1 were then determined by Western blotting. Cells were harvested 24 hours later. The cell experiment was repeated three times.
Western Blot
Brain tissue hematoma sites were utterly ground in glass homogenizers against a pre-cooled RIPA lysis buffer that contained protease and phosphatase inhibitors to obtain 10% tissue homogenates, which were then lysed on ice for 30 minutes, subsequently centrifuged at 4°C for 20 min at 12,000 rpm. Protease inhibitor-containing RIPA lysis solution was used to lyse macrophages and microglia for 30 minutes on ice. The cells were then centrifuged for 20 minutes at 12,000g at 4°C. The concentrations of the supernatants were ascertained by using the BCA technique after they were collected.
Equal amounts of protein (30 μg of cell protein or 90 μg of tissue protein are placed in each well channel) were separated by 10% SDS polyacrylamide gel electrophoresis (under 80 V for 30 min and then 120 V for 40 min), transferred to nitrocellulose (NC) membranes, and blocked with 5% skimmed milk. After overnight incubation at 4°C with primary antibodies, the membranes were treated with secondary antibodies that were conjugated with either anti-rabbit or anti-rat IgG. The antibodies used were as follows: anti-IL-7R (1:2000, Thermo Fisher Scientific Inc, 14-1271-82, Waltham, MA, USA); anti-GAPDH (1:10000, Proteintech, 10494-1-AP, Wuhan, China); anti-JAK3 (1:2000, Absin, abs115170, Shanghai, China); anti-p-JAK3 (1:2000, Absin, abs139988, Shanghai, China); anti-STAT5 (1:2000, Absin, abs131821, Shanghai, China); anti-p-STAT5 (1:2000, Absin, abs130928, Shanghai, China); anti-iNOS (1:4000, Proteintech, 18985-1-AP, Wuhan, China); anti-Arg-1 (1:10000, Proteintech, 16001-1-AP, Wuhan, China); anti-Rat IgG (1:5000, Proteintech, SA00001-15, Wuhan, China); and anti-Rabbit IgG (1:10000, Proteintech, SA00001-2, Wuhan, China). At the end of the incubation of the secondary antibody, PBS was rinsed three times,subsequently the proteins were visualized using an enhanced chemiluminescence system (ECL). Various protein bands were quantitatively analyzed using ImageJ software.
Statistical Analysis
GraphPad Prism 8.0.2 software was used to draw graphics and perform statistical analysis. All of the data are shown as mean ± standard error of the mean (SEM). Depending on whether the measurement data meets normality and homogeneity of variance, the statistical analysis of the two groups was carried out using the unpaired t-test, the Mann–Whitney U-test, or, in the event of multiple groups, the One-way analysis of variance (ANOVA) or the Kruskal–Wallis test. All statistical tests were two-sided at a significance threshold of 0.05. Differences are indicated by *; those at p < 0.05 are indicated by *; those at p < 0.01 are indicated by **; and those at p < 0.0001 by ****. The following R packages (version R-4.2.1) are mainly used: ggplot2, CIBERSORT, pheatmap, circlize, and GSVA.
Results
Identification of DEGs Between ICH and SHAM Brain Tissues
The GSE206971 dataset included information on 3 ICH samples and 3 SHAM samples; the GSE216607 dataset included information on 3 ICH samples and 3 SHAM samples. The sequencing information of the two datasets is from Mus Musculus, and both belong to the GPL24247 platform. The GSE206971 and GSE216607 data were obtained from mouse brain tissue 3 d after ICH (Table 1). According to the cutoff value of |log FC| ≥ 1 and adjusted p < 0.05, 1001 DEGs, including 946 upregulated genes and 55 downregulated genes, were obtained from the GSE206971 dataset; 2413 DEGs, including 2144 upregulated genes and 269 downregulated genes, were identified in GSE216607. Volcano plots showed the DEGs of GSE206971 (Figure 1A) and GSE216607 (Figure 1B).
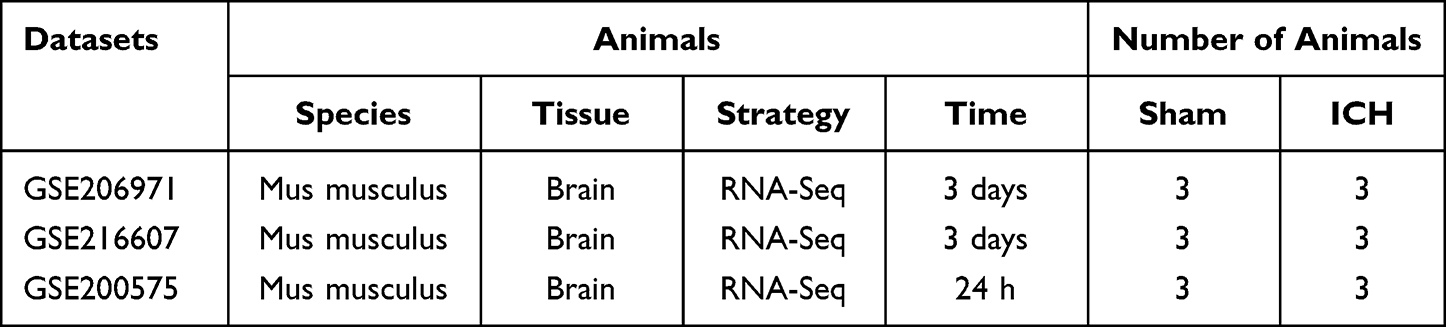 |
Table 1 Basic Information of the Selected Datasets |
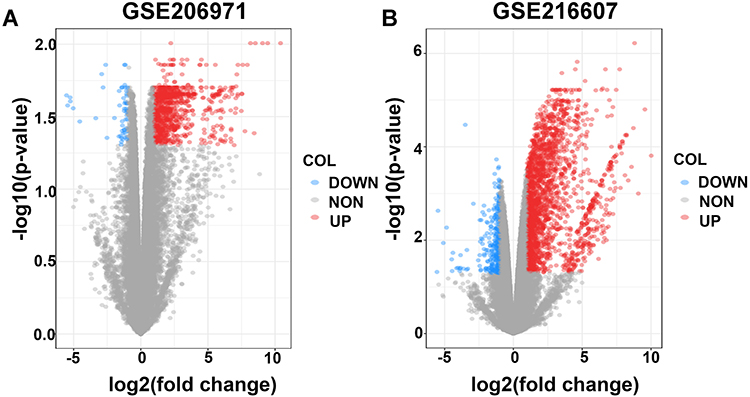 |
Figure 1 Volcano plots of DEGs from the two datasets. (A and B) Volcano plots of DEGs from GSE206971 and GSE216607 datasets. The red dots represent upregulated differential genes, the blue dots represent differentially downregulated genes and the gray dots represent genes without significant differences. Abbreviation: DEGs, differentially expressed genes. |
Immune Cell Infiltration results
We explored whether the proportion of the infiltrating immune cells varied between ICH and SHAM samples using the CIBERSORT plug-in in the R package in two datasets. The results showed that the proportion of M0 macrophages in ICH tissues significantly was higher than that in SHAM tissues, which was significant in both the GSE206971 and GSE216607 datasets (Figure 2A and B). Significant differences in M2 macrophages, Th17 cells, and monocytes were revealed in the GSE206971 dataset (Figure 2A). Furthermore, we found that the change was significant “microglia pathogen phagocytosis pathway” and “causal network in microglia” in ICH samples compared with SHAM samples based on GSEA results in GSE206971 and GSE216607 datasets (Figure 2C and D).
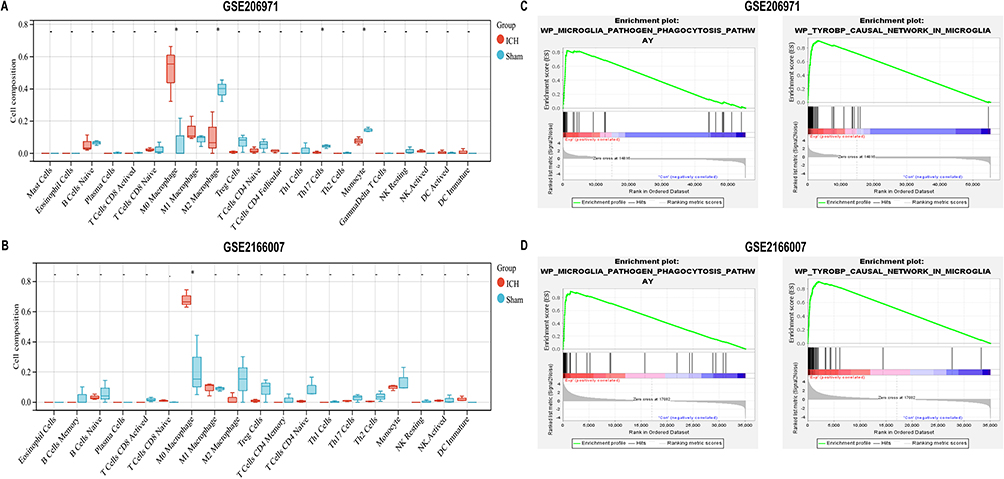 |
Figure 2 The level of immune cell composition in different groups. (A and B) The proportion of immune cell infiltration between ICH and SHAM groups in two datasets (GSE206971 and GSE216607). The statistical analysis used was an unpaired t-test. *p < 0.05.(C and D) GSEA GO analysis of microglia in GSE206971 and GSE216607 datasets. Abbreviations: GSEA, Gene Set Enrichment Analysis; GO, Gene Ontology. |
Functional Enrichment Analysis
Next, the Venn diagrams revealed common IRDEGs between DEGs and immune-related genes. The 93 common IRDEGs were identified in the GSE206971 dataset and the 155 common IRDEGs were obtained in the GSE216607 dataset (Figure 3A and B). To clarify the functions of IRDEGs, we used DAVID Bioinformatics Resources to perform GO function terms and KEGG pathway enrichment analysis. The results of biological process terms revealed that variations were predominantly enriched in the immune system process, inflammatory response, and innate immune response, which were similar in both GSE206971 and GSE216607 (Figure 3C and D).
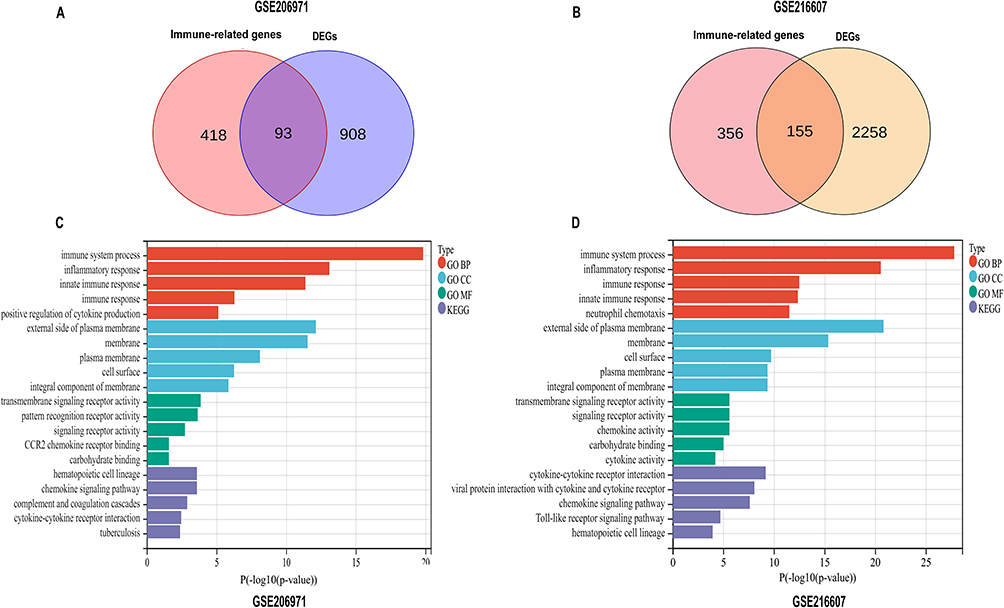 |
Figure 3 The enrichment analysis of IRDEGs by DAVID. (A and B) Identification of IRDEGs between immune-related genes and differentially expressed genes (DEGs) in GSE206971 and GSE216607 datasets. (C and D) Gene Ontology (GO) enrichment analysis and Kyoto Encyclopedia of Genes and Genomes (KEGG) pathway analysis of immune-related DEGs in GSE206971 and GSE216607 datasets. Abbreviations: IRDEGs, immune-related differentially expressed genes; DAVID, the Database for Annotation, Visualization, and Integrated Discovery; DEGs, differentially expressed genes; GO, Gene Ontology; KEGG, Kyoto Encyclopedia of Genes and Genomes. |
The top five closely signaling pathways of KEGG analysis in the GSE206971 dataset were hematopoietic cell lineage, chemokine signaling pathway, complement and coagulation cascades, cytokine-cytokine receptor interaction, and tuberculosis (Figure 3C). In the GSE216607 dataset, the top five strongly linked signaling pathways of KEGG analysis were cytokine-cytokine receptor interaction, viral protein interaction with cytokine and cytokine receptor, chemokine signaling pathway, Toll-like receptor signaling pathway, and hematopoietic cell lineage (Figure 3D). Thus, we inferred that the immune processes might play an important role in ICH.
Construction and Analysis of the PPI Network
In the GSE206971 and GSE216607 datasets, to further investigate the interactions between the IRDEGs in the ICH samples compared with SHAM samples, a PPI network was constructed using the online STRING tool and visualized by the Cytoscape software (Figure 4A and B). In addition, we screened the MCODE plug-in to screen out key molecular complexes (module) based on the cut-off criteria. The results showed there was one cluster in GSE206971 (Figure 4C) and two clusters in GSE216607 (Figure 4D). Cluster 2 in GSE216607 was highly correlated with the results in GSE206971 and selected to identify the hub genes.
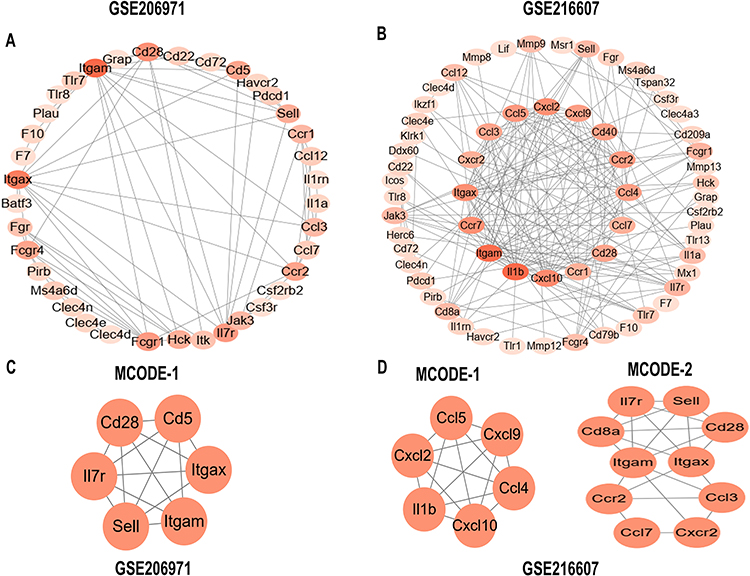 |
Figure 4 Identification of the hub network in IRDEGs. (A and B) A graphic representation of protein–protein network based on IRDEGs of ICH and SHAM groups in two datasets (GSE206971 and GSE216607). The color of a node reflects the degree calculated by Cytoscape. The darker the color, the higher the connectivity. (C and D) In two datasets (GSE206971 and GSE216607), the significant MCODE module was constructed from the PPI network according to the MCODE algorithm. Abbreviation: IRDEGs, immune-related differentially expressed genes. |
Identification of Hub Genes
Then, we used CytoHubba, a Cytoscape plug-in, to analyze the common hub genes in GSE206971 and GSE216607 datasets. According to the algorithm of maximal clique centrality (MCC), the top 10 hub genes were identified in the GSE206971 and GSE216607 datasets (Figure 5A and B). A total of six common genes between two datasets were selected as hub genes (ITGAM, ITGAX, CCR2, CD28, IL-7R, SELL) which were upregulated in ICH samples compared with SHAM samples. The expression levels of the four hub genes (ITGAX, CCR2, IL-7R, SELL) were also significantly up-regulated, and ITGAM and CD28 were not significant in the GSE200575 dataset (Figure 5C). Next, we uploaded hub genes to predict the function of these genes using the GeneMANIA database. As a result, immune process and chemokine-related functions were enriched, such as chemokine binding, T cell proliferation, cytokine binding, immune receptor activity, positive regulation of leukocyte cell-cell adhesion, and G protein-coupled chemoattractant receptor activity (Figure 5D). These results demonstrated that hub genes were correlated with immuno-inflammatory responses.
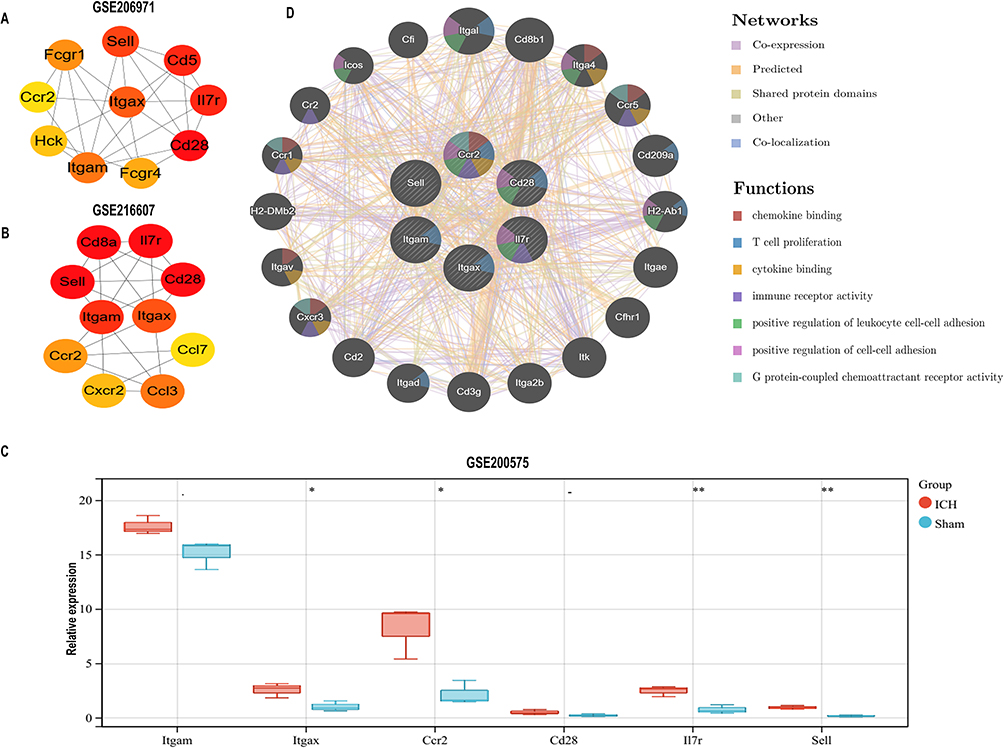 |
Figure 5 Hub genes recognized by the cytoHubba plug-in. (A and B) In the GSE206971 and GSE216607 datasets, the top 10 hub genes were calculated by the MCC method in the cytoHubba plug-in. The gradation of color represents the value of the score according to the MCC method. (C) Expression of six hub genes in the GSE200575 dataset. The statistical analysis used was an unpaired t-test. *p < 0.05; **p < 0.01. (D) The functions prediction of six common hub genes by GeneMANIA. 20 of the predicted genes are located in the outer circle while six hub genes are drawn in the inner circle. The color of the line represents different relationships between genes. The color within the gene dots indicates the functions of these genes. |
The Correlation Between Hub Genes and Immune Cells Was Analyzed
Most of the genes were correlated with certain types of immune cells, such as ITGAM and ITGAX, which were mainly expressed in monocytes, macrophages, microglia, and neutrophils. The relationship between cell markers of microglia and neutrophil and 6 hub genes analyzed using Pearson’s correlation analysis was performed. We chose CD86, ARG1, and TMEM119 as the markers of microglia and CD177 as the marker of neutrophil to perform correlation analysis. The results indicated that the cell markers of microglia and neutrophils were all positively correlated with hub genes based on the criteria of p-value < 0.05 (Figure 6A–D). Besides, we performed correlation analysis on the two kinds of immune cells and six IRDEGs. The results revealed that M1 macrophages were positively correlated with the six IRDEGs while M2 macrophages were negatively correlated with the six IRDEGs in both two datasets (Figure 6E and F).
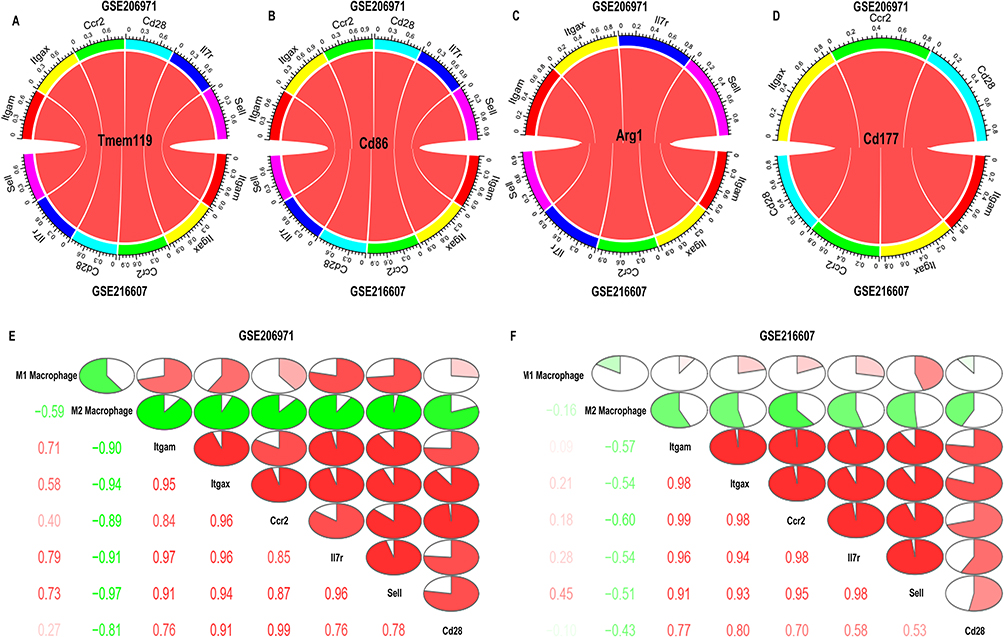 |
Figure 6 Correlation between hub genes and surface biomarkers of immune cells in GSE206971 and GSE216607 datasets. (A) Correlation between hub genes and Tmem119. (B) Correlation between hub genes and Cd86. (C) Correlation between hub genes and Arg1. (D) Correlation between hub genes and Cd177. The red color of the band represented the R-value. The darker the color, the higher the correlation. Pearson’s test was used for correlation analysis. (E and F) Correlation analysis between immune cells and six hub genes in two datasets (GSE206971 and GSE216607). |
Gene Set Variation Analysis (GSVA)
To further demonstrate the relationships between six hub genes and microglia and neutrophils and the pathways for the development of immune-inflammatory response, the GSVA algorithm was performed. The enrichment score illustrated that six hub genes were positively correlated with the neutrophil pathway, microglia pathogen phagocytosis pathway, NOD1/2 signaling pathway, Toll-like receptor cascades, and IL6 signaling pathway both in GSE206971 (Figure 7A) and GSE216607 (Figure 7B) datasets.
 |
Figure 7 Gene set variation analysis. (A and B) Correlation analysis between six hub genes and gene sets related to immune processes, inflammation, and signaling pathways in two datasets (GSE206971 and GSE216607). |
miRNA-Target Hub Gene Network Prediction
Subsequently, to further understand the mechanism of six hub genes, we predicted the miRNAs that may regulate 6 hub genes by using a comprehensive miRNA-target gene database, miRWalk. The results were shown in Figure 8. We found the common miRNA including mmu-miR-7021-3P and mmu-miR-1907 between IL-7R and Ccr2, muu-miR-330-3p and mmu-miR-12196-5p between Ccr2 and Cd28, mmu-miR-466a-5p between Cd28 and Itgam, which may participate in immune-inflammatory responses after cerebral hemorrhage.
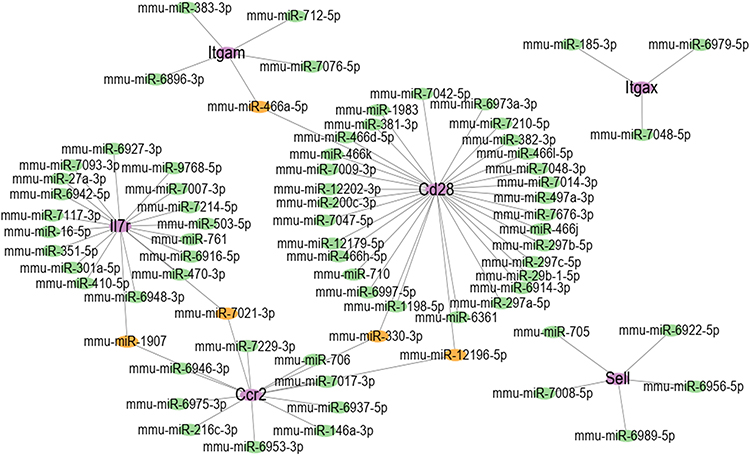 |
Figure 8 miRNA prediction with miRWalk. Interaction network between six hub genes and their targeted miRNAs. The purple ellipses represent hub Genes. The green ellipses represent miRNAs and the Orange ellipses represent common miRNAs between hub genes. |
The Expression of IL-7R Was Upregulated Following ICH
Next, the mice ICH models were constructed and the results showed the weight of the brain was significantly increased following ICH (Figure 9A). The IL-7R gene of interest was chosen from the hub genes obtained for further research, and the findings showed that IL-7R expression was considerably elevated after ICH (Figure 9B and C). Additionally, attention was given to the JAK/STAT5 pathway, which is a well-known signaling pathway downstream of the IL-7/IL-7R axis.38 The results showed that the expression of p-JAK3 and p-STAT5 increased in ICH samples (Figure 9B and C), which may help to explain how IL-7R is involved in the pathogenic process that occurs after ICH. The ICH cell models were then created to observe the activation status of macrophages and microglia. We used the hemin concentration intervals used by other researchers to determine which concentration of hemin would result in a more pronounced expression of IL-7R for subsequent studies.39,40 After hemin was added, the expression of IL-7R was greater than that of the control group (Figure 9D–G). To verify the role and underlying mechanism of the IL-7/IL-7R axis, we decided to add IL-7 (50, 100, and 200 ng/mL) to assay the expression of M1/M2 polarization-related markers to verify the role and intrinsic mechanism of the IL-7/IL-7R axis. The results showed that in hemin (80 μM) treated BV2 cells, IL-7 (200 ng/mL) up-regulated the expression of Arg-1 (Figure 10A and B), the difference was statistically significant. There was a trend of decreasing iNOS expression, but it was not statistically significant. Similar trends were observed in RAW264.7 (Figure 10C and D).
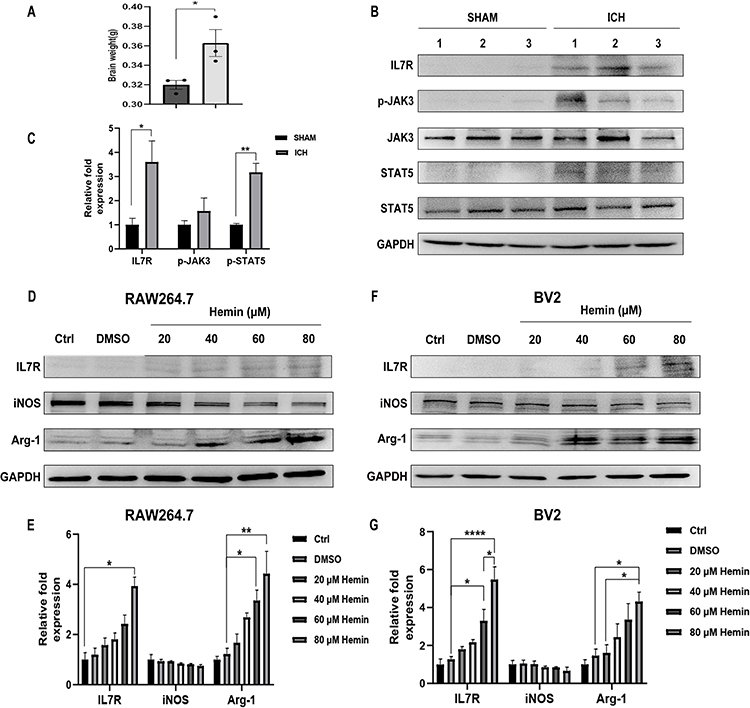 |
Figure 9 IL-7R was highly expressed and the JAK3/STAT5 pathway was activated following ICH. (A) The statistical analysis of brain weight between the SHAM group and the ICH group. Data are presented as mean ± SEM. n=3. *p < 0.05. (B and C) The protein levels of IL-7R, p-JAK3, JAK3, p-STAT5, and STAT5 were determined by Western blotting analysis in SHAM and ICH mice. (D and E) The RAW264.7 cells were treated with hemin for 24 h. The protein levels of IL-7R, iNOS, and Arg-1 in RAW264.7 cells. (F and G). The BV2 cells were treated with hemin for 24 h. The protein levels of IL-7R, iNOS, and Arg-1 in BV2 cells. Values are presented as mean ± SEM with n = 3 per group. Statistical analyses were performed by unpaired t-test or one-way ANOVA (*p < 0.05, **p < 0.01,****p < 0.0001). |
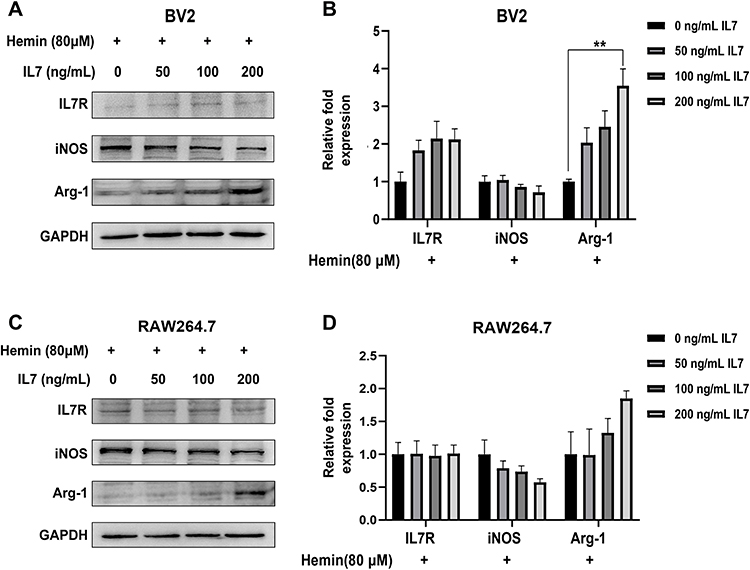 |
Figure 10 M1/M2 polarization in macrophages and microglia was impacted by IL-7. (A and B) The BV2 cells were exposed to a 24-hour hemin (80 μM) treatment, while IL-7 (50, 100, and 200 ng/mL) was added beforehand for one hour. Using Western blotting analysis, the relative protein levels of p-JAK3, p-STAT5, and IL-7R were detected. (C and D) Hemin (80 μM) was applied to the RAW264.7 cells for 24 hours, while IL-7 (50, 100, and 200 ng/mL) was added beforehand for one hour. Using Western blotting analysis, the relative protein levels of p-JAK3, p-STAT5, and IL-7R were detected. The data is displayed as mean ± SEM for each group, with n = 3. One-way ANOVA or the unpaired t-test were used for statistical analysis (**p < 0.01). |
Discussion
Intracerebral hemorrhage, the most common subtype of focal stroke, occurs due to the extravasation of blood into the brain parenchyma.41 Although an increasing number of mechanistic studies have been performed, up to date, there is still no effective treatment for improving the prognosis after ICH. It is imperative to further understand the progression of brain damage and find promising therapeutic targets. Regarding several previous studies, immune processes serve a significant role in the progress of ICH.42,43 In this study, to inspire new immune therapeutic ideas for patients with ICH, two mice ICH datasets were chosen from the GEO database to screen for the immune-related hub genes respectively. At first, the GO and KEGG enrichment analysis were identified to investigate the biological functions and pathways of immune-related genes. Next, the PPI network by STRING database was constructed and the six common hub genes (ITGAX, ITGAM, CCR2, CD28, SELL, and IL-7R) were finally defined by the algorithm of MCC in both two datasets. Then, the major regulatory pathways of six hub genes were obtained by the GSVA package, and Pearson correlation analysis revealed that these hub genes have positive correlations with TMEM119, CD86, ARG1, and CD177, which defined multiple subtypes of immune cells jointly participating in the process of ICH, such as M1/M2 macrophages/microglia, and neutrophils. The aforementioned findings offered fresh avenues for investigation into cerebral hemorrhage therapy.
Endogenous non-coding RNA molecules known as miRNAs bind to a gene’s 3′UTR region and control gene expression by preventing or weakening the target gene’s capacity for translation.44 In our investigation, five miRNAs that target two or more hub genes were found. The study discovered that miR-330 activation suppresses BACH1 expression at the post-transcriptional level, which prevents colorectal cancer cells from proliferating,45 and MicroRNA-1907 increases apoptosis in atherosclerosis-associated endothelial cells by blocking Bcl-2.46 According to our findings, ICH may be associated with the mRNA–miRNA interaction chain. More research is necessary to determine the possible mechanisms of miRNA after ICH.
In the present study, six hub genes (ITGAX, ITGAM, CCR2, CD28, SELL, and IL-7R) were identified and might provide a better--clear understanding of secondary inflammatory pathogenesis. Integrin Subunit Alpha M (ITGAM or CD11b) gene, which was considered as a surface marker of monocytes and essential adhesion molecule. ITGAM deficiency might attenuate the development, vascular structural damage, and the inflammatory response of abdominal aortic aneurysm (AAA) by reducing trans-endothelial migration of macrophages from the peripheral blood into the aortic wall as well as the accompanying proinflammatory cytokine secretion, suggesting a vital role of ITGAM in AAA.47 Glibenclamide, a sulfonylurea receptor 1 antagonist, significantly reduced water content, expression of galectin-3 and ITGAM, and activation of microglia in the cerebral cortex impaired region of rat ICH models.48 Integrin alpha X (ITGAX or CD11c), a defining marker for dendritic cells (DCs), was also associated with activated microglia that can develop in some neuroinflammatory disorders.49,50 Researchers have found that CD11c+ microglia were much more efficient than CD11c−microglia in inducing the release of IFN-γ and IL-17A by T cells.51 After ICH, circulating monocytes that traffick into brain tissue also have a significant function.52 CCR2+ inflammatory monocytes can have regulatory or pro-inflammatory functions. The upregulated CC chemokine receptor 2 (CCR2) regulates the migration and accumulation of monocytes/microglia in brain injuries under the stimulus of C-C motif ligand 2 (CCL2).53 Lack of CCR2 decreased the hematoma volume early after collagenase-induced ICH but delayed its recovery.53 Blood-derived CCR2+ Ly6C(hi) monocyte cells contribute to neurologic disability in the early phase after ICH.54 The activation and polarization of microglia and infiltrating monocyte-derived macrophages play important roles in neuroinflammation.55 The previous studies indicated that the roles of microglia/macrophages might differ after ICH.56 Our analysis provided similar evidence that the hub genes related to the pathological process of ICH and infiltration of microglia/macrophages.
CD28, a receptor of T lymphocytes, binding B7-1 (CD80) which is primarily expressed on the surface of macrophages, dendritic cells, and activated B lymphocyte cells, regulates T cell activation and the secretion of inflammatory cytokines.57 Anti-B7-1 antibody treatment improved learning and memory, mediating the prognosis by blocking the B7-1/CD28 pathway after ICH.58 Treg cells could restrict inflammatory response and release of cytokines mediated by microglia through the NF-κB pathway, providing a protective neurological function in ICH.59 A CD28 super-agonist antibody, which can boost Tregs, reduced the inflammatory injury by shifting microglia/macrophage polarization toward the M2 phenotype.60 SELL (CD62L) is defined as a vascular adhesion molecule regulating leukocytic adhesion and migration. One research showed that a higher SELL level was found in the patients with symptomatic delayed cerebral infarction (DCI) after aneurysmal subarachnoid hemorrhage (SAH) compared with control subjects, which was significantly connected with poor outcomes after 6 months of follow-up.61 IL-7 receptor (IL-7R) is reported to be expressed on CD4+ and CD8+ T cells and myeloid cells.62 The majority of the studies have focused on the T cell development and function of the IL-7/IL-7R pathway.63 In recent years, IL-7 and IL-7R were found more effects on other diseases. In rheumatoid arthritis (RA), it has been demonstrated that IL-7 and IL-7R were co-expressed on macrophages and endothelial cells compared to normal cells.64 IL-7-induced mouse bone marrow-derived macrophages (BMMϕs) into the M1 phenotype, which was further strengthened by the enhancement of IL-7R expression induced by LPS stimulation.65 Moreover, in LPS-primed BMMϕs, blocking IL-7R signaling reduced IL-7-induced TNF, IL-6, CCL2, and CCL5 secretion.65 Previous research showed that the anti-IL-7Rα mAb (A7R34) treatment induced a significant shift from M1 to M2 phenotype macrophage population at 3 days after spinal cord injury, and fewer Gr-1−CD45hiCD11bhi activated macrophages were observed in the A7R34 group compared with the rat-IgG control group, and the researchers reported that IL-7 displayed a strong chemotactic capacity for macrophages and anti-IL-7Rα mAb (A7R34) inhibited their infiltration into injured regions.66 Intraspinal infusion of IL-7 restricted functional recovery and exacerbated neuronal apoptosis in spinal cord lesions, which were possibly caused by the activation of the JAK/STAT5 pathway.67 However, the role of IL-7R in ICH was not reported.
To further explore the complex mechanisms of post-ICH inflammation, the IL-7R gene was identified for further research. The findings demonstrated an association between high IL-7R expression and ICH development. Subsequent cellular investigations verified that the IL-7/IL-7R signaling pathway might offer a new way to understand the pathogenesis of ICH. The hypothesis is made that IL-7/IL-7R signaling way increases M2 macrophages/microglial polarization and inhibits M1 macrophages/microglial polarization. The specific mechanisms need to be more deeply validated. This study explored the role of IL-7R in cerebral hemorrhage in a preliminary manner. Despite certain limitations such as a lack of persuasiveness due to the small number of animals, it is hoped that this preliminary analysis will provide insight into the mechanisms underlying secondary inflammation following cerebral hemorrhage. The reliability of the present study needs to be validated by further in vivo and in vitro experiments.
Conclusion
In conclusion, we put out the hypothesis that, from the standpoint of the immune system, the IL-7/IL-7R signaling pathway could influence the polarization of microglia and macrophages, which is important for clarifying the precise molecular mechanism of ICH and creating novel targets for immunotherapy. Further extensive validation is required for the particular mechanisms.
Abbreviations
ICH, Intracerebral hemorrhage; PMNs, Polymorphonuclear neutrophils; IRDEGs, Immune-related differentially expressed genes; KEGG, Kyoto Encyclopedia of Genes and Genomes; PPI, Protein-protein interaction; GEO, Gene expression omnibus; GO, Gene Ontology; GSEA, Gene set enrichment analysis; GSVA, Gene set variation analysis; Arg-1, Arginase-1; iNOS, Inducible nitric oxide synthase; MCC, Maximal clique centrality; ITGAM, Integrin Subunit Alpha M; AAA, Abdominal aortic aneurysm; ITGAX, Integrin alpha X; DCs, Dendritic cells; CCR2, CC chemokine receptor 2; CCL2, C-C motif ligand 2; DCI, Delayed cerebral infarction; SAH, Subarachnoid hemorrhage; BMMϕs, Bone marrow-derived macrophages.
Data Sharing Statement
The data presented in this study are available from the gene expression omnibus (GEO, http://www.ncbi.nlm.nih.gov/geo/) database.
Ethical Statement
The animal experiments were approved by the Ethics Committee of Soochow University (Approval No. SUDA20230825A01) and complied with the National Institutes of HealthGuide for the Care and Use of Laboratory Animals. No patients participated in this study.
Consent for Publication
The authors are responsible for all aspects of the work and must see to it that any concerns about the truthfulness or integrity of any part of the work are duly investigated and addressed.
Acknowledgments
The authors would like to acknowledge the gene expression omnibus (GEO, http://www.ncbi.nlm.nih.gov/geo/) database for its publicly available.
Author Contributions
All authors made a significant contribution to the work reported, whether that is in the conception, study design, execution, acquisition of data, analysis and interpretation, or in all these areas; took part in drafting, revising or critically reviewing the article; gave final approval of the version to be published; have agreed on the journal to which the article has been submitted; and agree to be accountable for all aspects of the work.
Funding
The present study was supported by the National Natural Science Foundation of China (No. 81873431), The Jiangsu Provincial Key Medical Center (No. YXZXA2016002), and the Priority Academic Program Development of Jiangsu Higher Education Institutions (PAPD).
Disclosure
The authors have no conflicts of interest to disclose.
References
1. Feigin VL, Lawes CM, Bennett DA, et al. Worldwide stroke incidence and early case fatality reported in 56 population-based studies: a systematic review. Lancet Neurol. 2009;8(4):355–369. doi:10.1016/S1474-4422(09)70025-0
2. Wilkinson DA, Pandey AS, Thompson BG, Keep RF, Hua Y, Xi G. Injury mechanisms in acute intracerebral hemorrhage. Neuropharmacology. 2018;134:240–248. doi:10.1016/j.neuropharm.2017.09.033
3. Ren H, Han R, Chen X, et al. Potential therapeutic targets for intracerebral hemorrhage-associated inflammation: an update. J Cereb Blood Flow Metab. 2020;40(9):1752–1768. doi:10.1177/0271678X20923551
4. Keep RF, Hua Y, Xi G. Intracerebral haemorrhage: mechanisms of injury and therapeutic targets. Lancet Neurol. 2012;11(8):720–731. doi:10.1016/S1474-4422(12)70104-7
5. Kearns KN, Ironside N, Park MS, et al. Neuroprotective therapies for spontaneous intracerebral hemorrhage. Neurocrit Care. 2021;35(3):862–886. doi:10.1007/s12028-021-01311-3
6. Zhou Y, Wang Y, Wang J, Anne Stetler R, Yang QW. Inflammation in intracerebral hemorrhage: from mechanisms to clinical translation. Progr Neurobiol. 2014;115:25–44. doi:10.1016/j.pneurobio.2013.11.003
7. Shao Z, Tu S, Shao A. Pathophysiological mechanisms and potential therapeutic targets in intracerebral hemorrhage. Front Pharmacol. 2019;10:1079. doi:10.3389/fphar.2019.01079
8. Zhang W, Wu Q, Hao S, Chen S. The hallmark and crosstalk of immune cells after intracerebral hemorrhage: immunotherapy perspectives. Front Neurosci. 2022;16:1117999. doi:10.3389/fnins.2022.1117999
9. Zhu H, Wang Z, Yu J, et al. Role and mechanisms of cytokines in the secondary brain injury after intracerebral hemorrhage. Progr Neurobiol. 2019;178:101610. doi:10.1016/j.pneurobio.2019.03.003
10. Lan X, Han X, Li Q, Yang QW, Wang J. Modulators of microglial activation and polarization after intracerebral haemorrhage. Nat Rev Neurol. 2017;13(7):420–433. doi:10.1038/nrneurol.2017.69
11. Xiong XY, Liu L, Yang QW. Functions and mechanisms of microglia/macrophages in neuroinflammation and neurogenesis after stroke. Progr Neurobiol. 2016;142:23–44. doi:10.1016/j.pneurobio.2016.05.001
12. Fumagalli S, Perego C, Pischiutta F, Zanier ER, De Simoni MG. The ischemic environment drives microglia and macrophage function. Front Neurol. 2015;6:81. doi:10.3389/fneur.2015.00081
13. Shtaya A, Bridges LR, Esiri MM, et al. Rapid neuroinflammatory changes in human acute intracerebral hemorrhage. Ann Clin Transl Neurol. 2019;6(8):1465–1479. doi:10.1002/acn3.50842
14. Aronowski J, Hall CE. New horizons for primary intracerebral hemorrhage treatment: experience from preclinical studies. Neurological Res. 2005;27(3):268–279. doi:10.1179/016164105X25225
15. Guo Y, Dai W, Zheng Y, et al. Mechanism and regulation of microglia polarization in intracerebral hemorrhage. Molecules. 2022;27(20):7080. doi:10.3390/molecules27207080
16. He Y, Gao Y, Zhang Q, Zhou G, Cao F, Yao S. IL-4 switches microglia/macrophage M1/M2 polarization and alleviates neurological damage by modulating the JAK1/STAT6 pathway following ICH. Neuroscience. 2020;437:161–171. doi:10.1016/j.neuroscience.2020.03.008
17. Xi Z, Xu C, Chen X, et al. Protocatechuic acid suppresses microglia activation and facilitates M1 to M2 phenotype switching in intracerebral hemorrhage mice. J Stroke Cerebrovascular Dis. 2021;30(6):105765. doi:10.1016/j.jstrokecerebrovasdis.2021.105765
18. Wang C, Kong L, Kim S, et al. The role of IL-7 and IL-7R in cancer pathophysiology and immunotherapy. Int J Mol Sci. 2022;23(18):10412. doi:10.3390/ijms231810412
19. Fry TJ, Mackall CL. Interleukin-7: from bench to clinic. Blood. 2002;99(11):3892–3904. doi:10.1182/blood.V99.11.3892
20. Cosenza L, Gorgun G, Urbano A, Foss F. Interleukin-7 receptor expression and activation in nonhaematopoietic neoplastic cell lines. Cell Signalling. 2002;14(4):317–325. doi:10.1016/S0898-6568(01)00245-5
21. Seol MA, Kim JH, Oh K, et al. Interleukin-7 contributes to the invasiveness of prostate cancer cells by promoting epithelial-mesenchymal transition. Sci Rep. 2019;9(1):6917. doi:10.1038/s41598-019-43294-4
22. Silva A, Almeida ARM, Cachucho A, et al. Overexpression of wild-type IL-7Rα promotes T-cell acute lymphoblastic leukemia/lymphoma. Blood. 2021;138(12):1040–1052. doi:10.1182/blood.2019000553
23. Alderson MR, Tough TW, Ziegler SF, Grabstein KH. Interleukin 7 induces cytokine secretion and tumoricidal activity by human peripheral blood monocytes. J Exp Med. 1991;173(4):923–930. doi:10.1084/jem.173.4.923
24. Fritzell S, Eberstål S, Sandén E, Visse E, Darabi A, Siesjö P. IFNγ in combination with IL-7 enhances immunotherapy in two rat glioma models. J Neuroimmunol. 2013;258(1–2):91–95. doi:10.1016/j.jneuroim.2013.02.017
25. Belarif L, Danger R, Kermarrec L, et al. IL-7 receptor influences anti-TNF responsiveness and T cell gut homing in inflammatory bowel disease. J Clin Invest. 2019;129(5):1910–1925. doi:10.1172/JCI121668
26. Arbelaez CA, Glatigny S, Duhen R, Eberl G, Oukka M, Bettelli E. IL-7/IL-7 receptor signaling differentially affects effector CD4+ T cell subsets involved in experimental autoimmune encephalomyelitis. J Iimmunol. 2015;195(5):1974–1983. doi:10.4049/jimmunol.1403135
27. Wei D, Chen X, Xu J, He W. Identification of molecular subtypes of ischaemic stroke based on immune-related genes and weighted co-expression network analysis. Iet Syst Biol. 2023;17(2):58–69. doi:10.1049/syb2.12059
28. Zhang B, Zhang Y, Xiong L, et al. CD127 imprints functional heterogeneity to diversify monocyte responses in inflammatory diseases. J Exp Med. 2022;219(2):e20211191. doi:10.1084/jem.20211191
29. Newman AM, Liu CL, Green MR, et al. Robust enumeration of cell subsets from tissue expression profiles. Nature Methods. 2015;12(5):453–457. doi:10.1038/nmeth.3337
30. Chen Z, Huang A, Sun J, Jiang T, Qin -FX-F, Wu A. Inference of immune cell composition on the expression profiles of mouse tissue. Sci Rep. 2017;7(1):40508. doi:10.1038/srep40508
31. Shen W, Song Z, Zhong X, et al. Sangerbox: a comprehensive, interaction-friendly clinical bioinformatics analysis platform. iMeta. 2022;1(3):e36. doi:10.1002/imt2.36
32. Huang DW, Sherman BT, Lempicki RA. Systematic and integrative analysis of large gene lists using DAVID bioinformatics resources. Nature Protocols. 2009;4(1):44–57. doi:10.1038/nprot.2008.211
33. Sherman BT, Hao M, Qiu J, et al. DAVID: a web server for functional enrichment analysis and functional annotation of gene lists (2021 update). Nucleic Acids Res. 2022;50(W1):W216–W221. doi:10.1093/nar/gkac194
34. Franz M, Rodriguez H, Lopes C, et al. GeneMANIA update 2018. Nucleic Acids Res. 2018;46(W1):W60–W64. doi:10.1093/nar/gky311
35. Hänzelmann S, Castelo R, Guinney J. GSVA: gene set variation analysis for microarray and RNA-Seq data. BMC Bioinf. 2013;14(1):7. doi:10.1186/1471-2105-14-7
36. Sticht C, De La Torre C, Parveen A, Gretz N, Campbell M. miRWalk: an online resource for prediction of microRNA binding sites. PLoS One. 2018;13(10):e0206239. doi:10.1371/journal.pone.0206239
37. Rynkowski MA, Kim GH, Komotar RJ, et al. A mouse model of intracerebral hemorrhage using autologous blood infusion. Nature Protocols. 2008;3(1):122–128. doi:10.1038/nprot.2007.513
38. O’Shea JJ, Schwartz DM, Villarino AV, Gadina M, McInnes IB, Laurence A. The JAK-STAT pathway: impact on human disease and therapeutic intervention. Ann Rev Med. 2015;66(1):311–328. doi:10.1146/annurev-med-051113-024537
39. Nie H, Hu Y, Guo W, et al. miR-331-3p inhibits inflammatory response after intracerebral hemorrhage by directly targeting NLRP6. Biomed Res Int. 2020;2020:6182464. doi:10.1155/2020/6182464
40. Wang M, Ye X, Hu J, et al. NOD1/RIP2 signalling enhances the microglia-driven inflammatory response and undergoes crosstalk with inflammatory cytokines to exacerbate brain damage following intracerebral haemorrhage in mice. J Neuroinflammation. 2020;17(1):364. doi:10.1186/s12974-020-02015-9
41. Kathirvelu B, Carmichael ST. Intracerebral hemorrhage in mouse models: therapeutic interventions and functional recovery. Metab Brain Dis. 2015;30(2):449–459. doi:10.1007/s11011-014-9559-7
42. Li W, Li L, Li W, et al. Spleen associated immune-response mediates brain-heart interaction after intracerebral hemorrhage. Exp Neurol. 2020;327:113209. doi:10.1016/j.expneurol.2020.113209
43. Shao A, Zhu Z, Li L, Zhang S, Zhang J. Emerging therapeutic targets associated with the immune system in patients with intracerebral haemorrhage (ICH): from mechanisms to translation. EBioMedicine. 2019;45:615–623. doi:10.1016/j.ebiom.2019.06.012
44. Elton TS, Selemon H, Elton SM, Parinandi NL. Regulation of the MIR155 host gene in physiological and pathological processes. Gene. 2013;532(1):1–12. doi:10.1016/j.gene.2012.12.009
45. Shirjang S, Mansoori B, Mohammadi A, et al. miR-330 regulates colorectal cancer oncogenesis by targeting BACH1. Adv Pharm Bull. 2020;10(3):444–451. doi:10.34172/apb.2020.054
46. Zhao J, Ou SL, Wang WY, Yan C, Chi LX. MicroRNA-1907 enhances atherosclerosis-associated endothelial cell apoptosis by suppressing Bcl-2. Am J Transl Res. 2017;9(7):3433–3442.
47. Zhou M, Wang X, Shi Y, et al. Deficiency of ITGAM attenuates experimental abdominal aortic aneurysm in mice. J Am Heart Assoc. 2021;10(7):e019900. doi:10.1161/JAHA.120.019900
48. Shiokawa R, Otani N, Kajimoto R, et al. Glibenclamide attenuates brain edema associated with microglia activation after intracerebral hemorrhage. Neurochirurgie. 2022;68(6):589–594. doi:10.1016/j.neuchi.2022.07.009
49. Shen X, Qiu Y, Wight AE, Kim H-J, Cantor H. Definition of a mouse microglial subset that regulates neuronal development and proinflammatory responses in the brain. Proc Natl Acad Sci USA. 2022;119(8):e2116241119. doi:10.1073/pnas.2116241119
50. Wlodarczyk A, Holtman IR, Krueger M, et al. A novel microglial subset plays a key role in myelinogenesis in developing brain. EMBO J. 2017;36(22):3292–3308. doi:10.15252/embj.201696056
51. Wlodarczyk A, Løbner M, Cédile O, Owens T. Comparison of microglia and infiltrating CD11c+ cells as antigen presenting cells for T cell proliferation and cytokine response. J Neuroinflammation. 2014;11(1):57. doi:10.1186/1742-2094-11-57
52. Grainger JR, Wohlfert EA, Fuss IJ, et al. Inflammatory monocytes regulate pathologic responses to commensals during acute gastrointestinal infection. Nature Med. 2013;19(6):713–721. doi:10.1038/nm.3189
53. Yao Y, Tsirka SE. The CCL2-CCR2 system affects the progression and clearance of intracerebral hemorrhage. Glia. 2012;60(6):908–918. doi:10.1002/glia.22323
54. Hammond MD, Taylor RA, Mullen MT, et al. CCR2+ Ly6C(hi) inflammatory monocyte recruitment exacerbates acute disability following intracerebral hemorrhage. J Neurosci. 2014;34(11):3901–3909. doi:10.1523/JNEUROSCI.4070-13.2014
55. Lan X, Han X, Li Q, et al. Pinocembrin protects hemorrhagic brain primarily by inhibiting toll-like receptor 4 and reducing M1 phenotype microglia. Brain Behav Immun. 2017;61:326–339. doi:10.1016/j.bbi.2016.12.012
56. Li Q, Lan X, Han X, Wang J. Expression of Tmem119/Sall1 and Ccr2/CD69 in FACS-sorted microglia- and monocyte/macrophage-enriched cell populations after intracerebral hemorrhage. Front Cell Neurosci. 2018;12:520. doi:10.3389/fncel.2018.00520
57. Greaves P, Gribben JG. The role of B7 family molecules in hematologic malignancy. Blood. 2013;121(5):734–744. doi:10.1182/blood-2012-10-385591
58. Ma L, Shen X, Gao Y, et al. Blocking B7-1/CD28 pathway diminished long-range brain damage by regulating the immune and inflammatory responses in a mouse model of intracerebral hemorrhage. Neurochem Res. 2016;41(7):1673–1683. doi:10.1007/s11064-016-1883-3
59. Yang Z, Yu A, Liu Y, et al. Regulatory T cells inhibit microglia activation and protect against inflammatory injury in intracerebral hemorrhage. Int Immunopharmacol. 2014;22(2):522–525. doi:10.1016/j.intimp.2014.06.037
60. Zhou K, Zhong Q, Wang Y-C, et al. RETRACTED: regulatory T cells ameliorate intracerebral hemorrhage-induced inflammatory injury by modulating microglia/macrophage polarization through the IL-10/GSK3β/PTEN axis. J Cereb Blood Flow Metab. 2017;37(3):967–979. doi:10.1177/0271678X16648712
61. Wang H-C, Lin W-C, Yang T-M, et al. The association between symptomatic delayed cerebral infarction and serum adhesion molecules in aneurysmal subarachnoid hemorrhage. Neurosurgery. 2011;68(6):1611–1617. doi:10.1227/NEU.0b013e318210c871
62. Jiang Q, Li WQ, Aiello FB, et al. Cell biology of IL-7, a key lymphotrophin. Cytokine Growth Factor Rev. 2005;16:513–533.
63. Chen Z, S-j K, Chamberlain ND, et al. The novel role of IL-7 ligation to IL-7 receptor in myeloid cells of rheumatoid arthritis and collagen-induced arthritis. J Immunol. 2013;190(10):5256–5266. doi:10.4049/jimmunol.1201675
64. Pickens SR, Chamberlain ND, Volin MV, et al. Characterization of interleukin-7 and interleukin-7 receptor in the pathogenesis of rheumatoid arthritis. Arthritis Rheumatol. 2011;63:2884–2893.
65. S-j K, Chang HJ, Volin MV, et al. Macrophages are the primary effector cells in IL-7-induced arthritis. Cell Mol Immunol. 2020;17(7):728–740. doi:10.1038/s41423-019-0235-z
66. Bao C, Wang B, Yang F, Chen L. Blockade of interleukin-7 receptor shapes macrophage alternative activation and promotes functional recovery after spinal cord injury. Neuroscience. 2018;371:518–527. doi:10.1016/j.neuroscience.2017.10.022
67. Yuan X, Wu Q, Wang P, et al. Intraspinal administration of interleukin-7 promotes neuronal apoptosis and limits functional recovery through JAK/STAT5 pathway following spinal cord injury. Biochem Biophys Res Commun. 2019;514(3):1023–1029. doi:10.1016/j.bbrc.2019.04.159
 © 2024 The Author(s). This work is published and licensed by Dove Medical Press Limited. The full terms of this license are available at https://www.dovepress.com/terms.php and incorporate the Creative Commons Attribution - Non Commercial (unported, v3.0) License.
By accessing the work you hereby accept the Terms. Non-commercial uses of the work are permitted without any further permission from Dove Medical Press Limited, provided the work is properly attributed. For permission for commercial use of this work, please see paragraphs 4.2 and 5 of our Terms.
© 2024 The Author(s). This work is published and licensed by Dove Medical Press Limited. The full terms of this license are available at https://www.dovepress.com/terms.php and incorporate the Creative Commons Attribution - Non Commercial (unported, v3.0) License.
By accessing the work you hereby accept the Terms. Non-commercial uses of the work are permitted without any further permission from Dove Medical Press Limited, provided the work is properly attributed. For permission for commercial use of this work, please see paragraphs 4.2 and 5 of our Terms.