Back to Journals » Diabetes, Metabolic Syndrome and Obesity » Volume 18
Utilizing Podocyte Foot Process Morphology for the Identification of Diabetic Nephropathy with or without Minimal Change Disease: Establishment of an Artificial Intelligence-Assisted Diagnostic Model
Authors Li X ![]() , Zhang P
, Zhang P ![]() , Jiang S
, Jiang S ![]() , Shang S
, Shang S ![]() , Zhang J, Liu J, Li C, Gao Y, Zhang H
, Zhang J, Liu J, Li C, Gao Y, Zhang H ![]() , Li W
, Li W
Received 1 March 2025
Accepted for publication 27 June 2025
Published 4 July 2025 Volume 2025:18 Pages 2141—2153
DOI https://doi.org/10.2147/DMSO.S525765
Checked for plagiarism Yes
Review by Single anonymous peer review
Peer reviewer comments 2
Editor who approved publication: Professor Jae Woong Sull
Xiangmeng Li,1– 4 Peihua Zhang,5 Shimin Jiang,1 Shunlai Shang,1 Jiao Zhang,6 Jinyu Liu,7 Chenchen Li,3,4 Yan Gao,3,4 Haisong Zhang,3,4 Wenge Li1,2,6,7
1Department of Nephrology, China-Japan Friendship Hospital, Beijing, People’s Republic of China; 2China-Japan Friendship Hospital, Chinese Academy of Medical Sciences & Peking Union Medical College, Beijing, People’s Republic of China; 3Key Laboratory of Bone Metabolism and Physiology in Chronic Kidney Disease of Hebei Province, Affiliated Hospital of Hebei University, Baoding, Hebei, People’s Republic of China; 4Department of Nephrology, Affiliated Hospital of Hebei University, Baoding, Hebei, People’s Republic of China; 5School of Big Data Science, Hebei Finance University, Baoding, Hebei, People’s Republic of China; 6Graduate School, Beijing University of Chinese Medicine, Beijing, People’s Republic of China; 7Graduate School, Capital Medical University, Beijing, People’s Republic of China
Correspondence: Wenge Li, Department of Nephrology, China-Japan Friendship Hospital, Beijing, People’s Republic of China, Email [email protected] Haisong Zhang, Department of Nephrology, Affiliated Hospital of Hebei University, Baoding, Hebei, People’s Republic of China, Email [email protected]
Background: This study aimed to differentiate whether diabetic nephropathy (DN) is complicated by minimal change disease (MCD) through the differences in podocyte foot process morphology, and subsequently establish an Artificial Intelligence-Assisted (AI-assisted) Diagnostic Model through machine learning of renal tissue electron microscopy images.
Methods: Patients diagnosed with DN with nephrotic syndrome and treated in our hospital from January 2014 to December 2023 were selected. Patients were divided into the DN group and the DN with MCD group (DN+MCD group). Podocyte morphology’s diagnostic value was assessed by measuring foot process width and quantifying slit diaphragm changes via Nephrin immunohistochemical staining. This study pioneers developing a machine learning-powered diagnostic model based on renal electron microscopy imaging to differentiate DN cases with or without concurrent MCD.
Results: In 51 patients, DN+MCD patients exhibited wider podocyte foot processes and reduced Nephrin expression compared to DN. A total of 622 electron microscopy images were used for model establishment and internal validation, while 225 electron microscopy images were used for external validation. A model based on Mobilenetv2 was successfully established, achieving a maximum accuracy of 93.3% in differentiating whether DN is complicated by MCD using a single image. When at least 11 random images were input, stable reports were obtained with an accuracy of 98%. External validation showed that the model had good sensitivity and specificity in differentiating whether DN is complicated by MCD (100%, 83.33%).
Conclusion: Podocyte foot process morphology has diagnostic value in differentiating whether DN is complicated by MCD. Our AI model addresses the unmet clinical need for reliable differentiation between DN with and without concurrent MCD. Additionally, it establishes a foundational framework for AI-powered analysis of renal imaging data to improve disease diagnosis and prognosis prediction.
Keywords: diabetic nephropathy, minimal change disease, podocyte, foot process width, slit diaphragm, machine learning
Background
According to the International Diabetes Federation,1 the estimated number of diabetes patients worldwide reached 5.37 billion in 2021 and is projected to increase to 7.83 billion by 2045.1 Diabetes has become a serious global public health issue. Diabetic kidney damage includes diabetic nephropathy (DN), non-diabetic renal diseases (NDRD), and DN combined with NDRD. DN is the most common chronic microvascular complication of diabetes mellitus. Proteinuria and progressive renal function decline are the main features of DN, with pathological changes primarily occurring in the glomerulus. When DN is accompanied by nephrotic syndrome (NS), it is difficult to distinguish whether DN is complicated by minimal change disease (MCD) due to the lack of immune complex deposition and specific structural changes in MCD. NS caused by DN results in persistent massive proteinuria, whereas NS caused by MCD leads to the disappearance of massive proteinuria. Currently, the presence of MCD in DN patients with NS is primarily judged based on patient prognosis, leading to delayed clinical assessment by physicians. This implies that in clinical practice, clinicians often recognize that the massive proteinuria in DN patients with concurrent MCD is attributable to MCD only after its spontaneous remission. By this time, the patients’ kidneys have already sustained significant damage from prolonged proteinuria. Studies demonstrate that severe proteinuria is the most critical clinical factor contributing to renal function decline and increased all-cause mortality in DN patients.2 Glucocorticoid therapy, which is highly effective for MCD, can shorten the duration of severe proteinuria if promptly administered to DN patients with comorbid MCD. There is an urgent need for a pathological method to predict whether DN is complicated by MCD. Podocyte injury plays a crucial role in the pathogenesis of many kidney diseases, and the pattern of foot process effacement varies in different kidney diseases. The increase in foot process width (FPW) is an essential indicator for measuring podocyte injury.3 Machine learning, a branch of artificial intelligence, enables computer systems to learn and improve performance through data and algorithms automatically, and has been widely applied in fields such as image recognition and natural language processing. Neural networks are a primary method in medical image recognition. By learning from image datasets (χ) and clinical conclusions (y), they aim to identify the optimal mapping function (χ, y; w) (where w represents weight parameters) to model the relationship between inputs χ and outputs y. Through hierarchical feature induction and refinement, neural networks extract clinically relevant patterns from raw data, ultimately supporting diagnostic or prognostic prediction tasks.4 Through individual measurements of FPW and staining for slit diaphragm (SD), we found that FPW has significant diagnostic value for distinguishing whether DN is complicated by MCD. We have also established an artificial intelligence model that can differentiate whether DN is complicated by MCD by identifying the structural changes in the foot process region in electron microscopy images. The most significant contribution of this study is the development of a reliable method to differentiate between DN with and without comorbid MCD. This breakthrough resolves a longstanding clinical dilemma: when DN patients present with severe proteinuria, clinicians can now determine whether the proteinuria stems from DN itself or concurrent MCD, thereby informing therapeutic decisions.
Materials and Methods
Diagnostic Significance of Podocyte Foot Process Morphology in DN with or without MCD
Study Subjects
A cohort of 51 patients diagnosed with DN presenting with concurrent NS was selected from the China-Japan Friendship Hospital between January 2014 and December 2023. The cohort included 35 males and 16 females. Inclusion criteria included clinical features consistent with NS and pathological diagnosis of DN. Exclusion criteria included hematologic disorders, immune system diseases, tumors, and the presence of immune complex deposition in renal tissue. The diagnosis of DN was based on the pathological classification established by the International Society of Nephrology in 2010.5 Diagnostic criteria for NS: 24-hour urine protein quantification (24UPr) >3.5 g coupled with serum albumin (ALB) <30 g/L. Approval received from China-Japan Friendship Hospital Ethics Committee (2024-KY-129), compliant with the Declaration of Helsinki.
Data Collection
Demographic characteristics such as gender and age were recorded, and urine routine, 24UPr, ALB, serum creatinine (Scr), fasting blood glucose, blood lipids, and glycated hemoglobin test results were collected from the hospital’s electronic medical records system for one year after renal biopsy. The ALB, Scr, and lipid profile data in this study were obtained from the electronic medical record system of the China-Japan Friendship Hospital. Specifically, the laboratory measured ALB using the bromocresol green method, Scr via enzymatic assays, and lipid profiles through enzymatic methods. All these approaches are standardized clinical laboratory protocols, and their results are recognized for clinical reliability.
Grouping
Among the study subjects, those who developed NS within less than three months after renal biopsy and had 24UPr ≤1g/24h without receiving steroid or immunosuppressive therapy for one year after the diagnosis of DN were classified as the DN+MCD group. The DN group was determined based on the absence of statistically significant differences in the decline in 24UPr levels within one year.
Podocyte FPW and SD Integrity
Observation and Measurement of Podocyte FPW by Transmission Electron Microscopy
The renal tissue was fixed in glutaraldehyde, prepared into semi-thin sections, stained with toluidine blue, and ultrathin sections were cut at 70 nm and collected on copper grids, followed by staining with uranyl acetate and lead citrate. The podocyte foot processes of the glomeruli from both patient groups were observed under a transmission electron microscope (TEM, JEM-1400, JEOL, Japan) at 20,000X magnification. At least four different FP at the capillary loop position of the glomeruli were photographed for each patient, and the FPW was measured.
SD Integrity of Podocyte Foot Processes
Nephrin is a transmembrane protein of the SD, as shown in Figure 1. Nephrin immunohistochemical staining was performed on paraffin sections of renal biopsies from both patient groups. The 2μm paraffin sections were dewaxed in water after antigen retrieval with EDTA for 40 minutes, followed by permeabilization with TritonX-100 for 10 minutes and blocking with sheep serum antibody for 30 minutes. Subsequently, Nephrin antibody (1:1000, 22912-1-AP, Proteintech, Wuhan, China) was added and incubated overnight at 4°C, followed by DAB staining, counterstaining with hematoxylin, dehydration, clearing, and mounting. Immunohistochemical quantitative analysis was conducted using Image J.
 |
Figure 1 Position of Podocytes in the Glomerulus and the Cytoskeletal Structure of Podocytes. The right panel illustrates the fundamental components of a glomerulus, including mesangial cells, capillary endothelial cells, podocytes, and the basement membrane. Fenestrated endothelial cells, the basement membrane, and podocytes constitute the filtration barrier. The left panel depicts the ultrastructural architecture of the glomerular filtration barrier. Within podocytes, microtubules, intermediate filaments, and actin filaments serve as the primary cytoskeletal network, maintaining both these cells’ morphological integrity and functional stability. The FP of podocytes are connected to the basement membrane, and their width is referred to as the FPW. Adjacent FP form the SD, which contains the transmembrane protein Nephrin. The podocyte cell body contains microtubules and intermediate filaments, and the morphological changes of FP mainly depend on actin. Abbreviations: FP, foot process; FPW, foot process width; SD, slit diaphragm. |
Deep Learning of Renal Biopsy Electron Microscopy Images
Training Dataset
The training dataset was created using 622 electron microscopy images from renal biopsies of the DN and DN+MCD groups, comprising 398 images from the DN group and 224 images from the DN+MCD group.
Model Design
We attempted two approaches to achieve better model recognition performance and generalization ability. One approach involved designing a convolutional neural networks (CNN) model with a smaller parameter count directly for image recognition tasks. The other approach involved using a well-performing pre-trained model as the base model and then adding network layers to the base model for image recognition tasks, as shown in Figure 2. The design and implementation of these models were based on the 2.13.0 version of the TensorFlow platform.
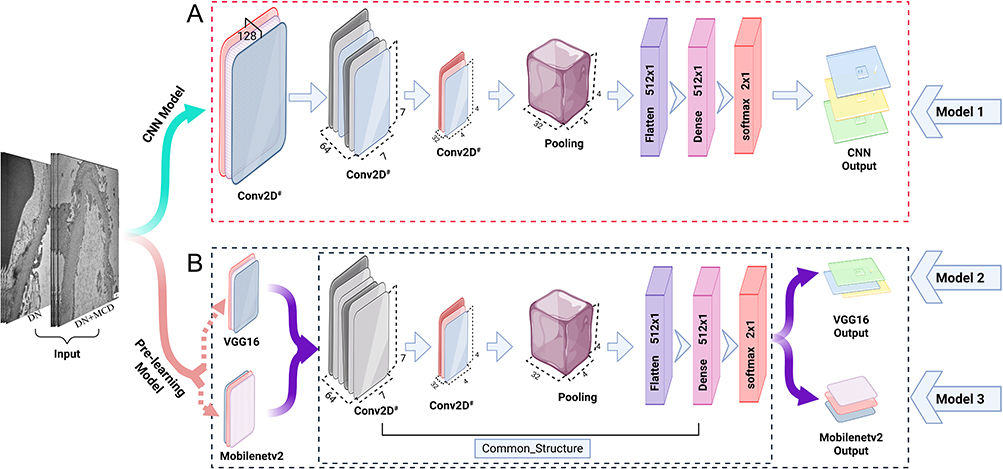 |
Figure 2 Structure of the CNN Model and Pre-trained Model. (A) The CNN model design structure comprises three convolutional layers, a pooling layer, flattening of multidimensional data to one-dimensional data, a fully connected layer, and a softmax layer. A dropout layer was added to the network layers to enhance the model’s generalisation ability. Conv2D, a 2D convolutional neural network layer, employs the subscript “#” to denote variable channel numbers across different layers. In this model design, the first three convolutional layers (left to right) are configured with 128, 64, and 32 channels, respectively. (B) Pre-trained models Mobilenetv2 and VGG16 were used as base models, and the same structure of network layers was added on top of the base models. The network layers on top of the base model include two convolutional layers (configured with 64 and 32 channels), a pooling layer, flattening of multidimensional data to one-dimensional data, a fully connected layer, a softmax layer, and a dropout layer in the network layers. The symbol “#” denotes variable channel numbers. Abbreviations: CNN, convolutional neural networks; Conv2D, 2D convolutional neural network layer; Mobilenetv2, Mobile Network Version 2; VGG16, Visual Geometry Group 16. |
Model Training
Combining the dataset and model design, image augmentation was performed during model training to reduce overfitting and improve validation accuracy. This included random scaling, rotation, flipping, contrast variation, skewing, translation, and adding artifacts to enhance the model’s variability and generalization ability. To assess overfitting, 20% of the random subset of the reserved dataset was used for validation testing, while the remaining 80% formed the training set for online learning. The iterative process continued until the training set data was fully learned, with each of the three models undergoing 50 rounds of iterative training.
Compilation Packages and Cloud-Based Applications
The three models were successfully trained on the complete dataset, and the relevant code and dataset were shared on the GitHub code hosting platform at the following address: https://github.com/warriorZH/DN_MCD.
Evaluation of Model Performance and Effectiveness
The accuracy and loss functions of the three models were calculated on the training dataset to evaluate convergence. Similarly, the accuracy and loss functions were calculated on the validation dataset to assess recognition performance and the degree of overfitting. The parameters of the three successfully trained models on the training and validation sets were compared to select the optimal model. The critical recognition areas of the optimal model were subjected to heatmap visualization analysis to evaluate whether the machine model’s recognition areas corresponded to the actual areas.
Determination of the Minimum Number of Electron Microscopy Images for Stable Differentiation of DN with MCD
As a single electron microscopy image cannot represent the overall microstructural characteristics of the glomerulus, a multi-input module was added to the optimal model to allow multiple images to be input at once. The number of images required for stable reporting of whether DN is combined with MCD was determined by sequentially selecting 1, 3, 5, 7, 9… electron microscopy images for each patient and inputting them into the model according to the rules above. The minimum number of electron microscopy images required for stable reporting of whether DN is combined with MCD was determined when the accuracy of all patient reports reached 98%.
External Validation of Model Accuracy
Patients diagnosed with DN with nephrotic syndrome and treated at Hebei University Affiliated Hospital between January 2014 and December 2023 were selected for external validation of the model’s accuracy. The patients were divided into the DN external validation group and the DN+MCD external validation group based on the grouping criteria established during model development. Electron microscopy images were observed and captured at 20,000X magnification, with at least four different FP from the capillary loop position of the glomerulus being photographed for each patient. Each capillary loop was photographed with 1–3 images, and the total number of electron microscopy images for each patient was no less than 11.
Statistical Analysis
Differences in general data and clinical laboratory test indicators were assessed using the Fisher exact probability method or chi-square test for categorical data, independent sample t-test for normally distributed data, and Mann–Whitney U-test for non-normally distributed data. Analysis of the test indicators during the follow-up period for the two patient groups involved analyzing 24UPr, serum ALB, and Scr at 3, 6, 9, and 12 months for each group. Within-group analysis was conducted using ANOVA variance analysis, the between-group analysis involved independent sample t-tests, and pairwise comparisons were corrected using Bonferroni correction. Data analysis was performed using SPSS 22.0 and R language 4.4.0, and the results were visualized using GraphPad Prism 9.5.1.
Results
Analysis of Baseline Data and Follow-Up Results for the Two Patient Groups
51 patients with DN accompanied by NS meeting the criteria were included, with 17.65% having MCD. The screening and grouping process is illustrated in Figure 3A. There were 42 patients in the DN group and 9 patients in the DN+MCD group, with 12 patients requiring dialysis treatment within one year, all of whom were from the DN group. The DN group and DN+MCD group showed significant differences in the prevalence of hypertension and glycated haemoglobin, as indicated in Table 1.
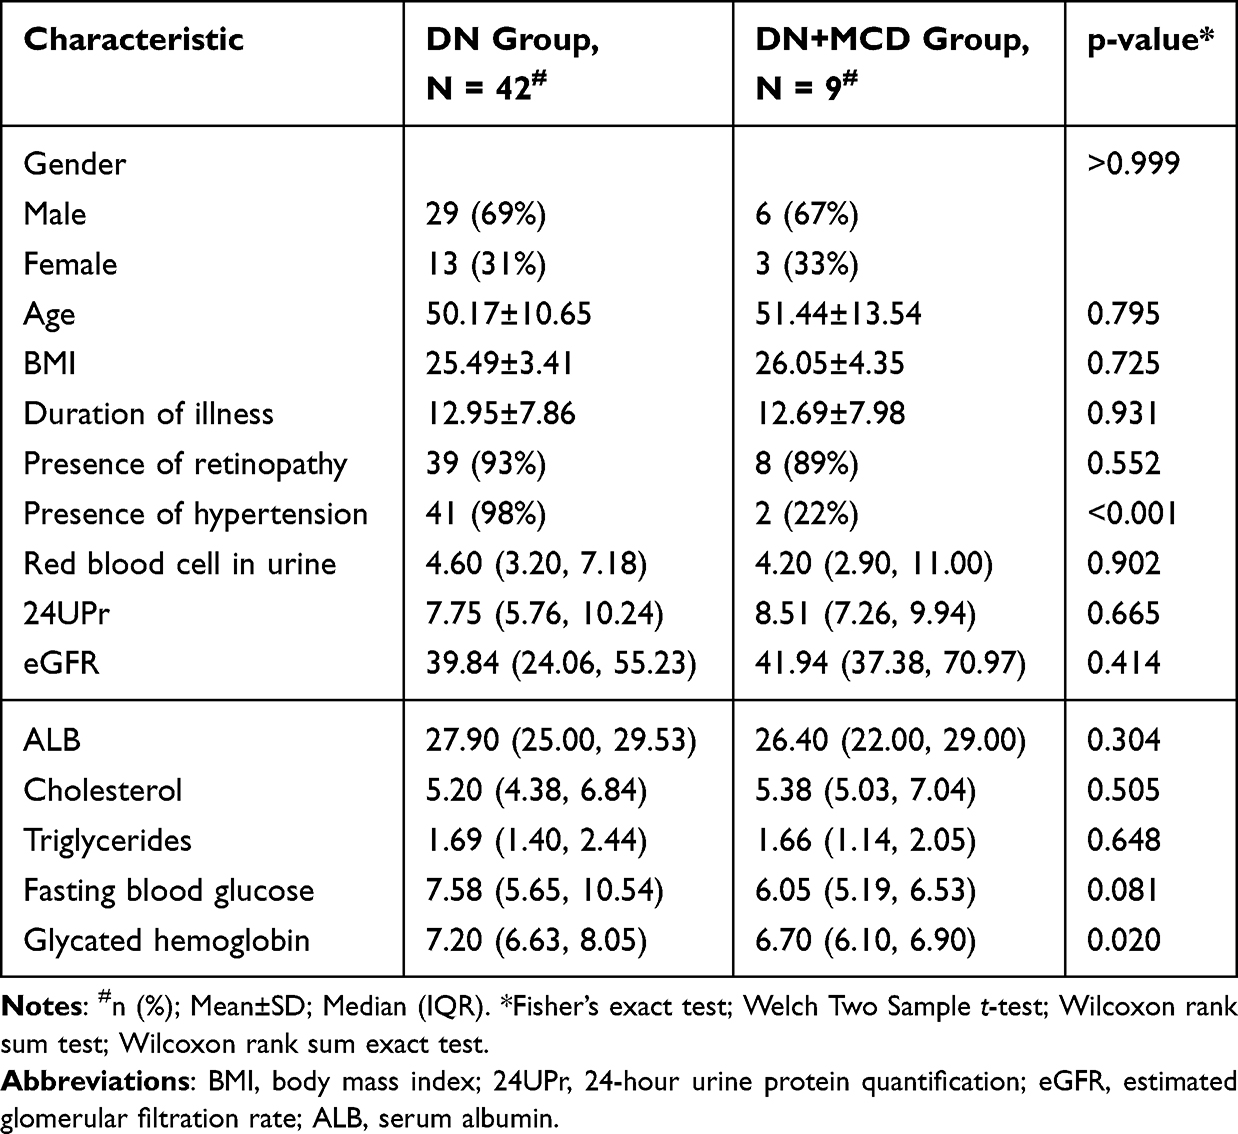 |
Table 1 Clinical Baseline Data of DN and DN+MCD Patient Groups |
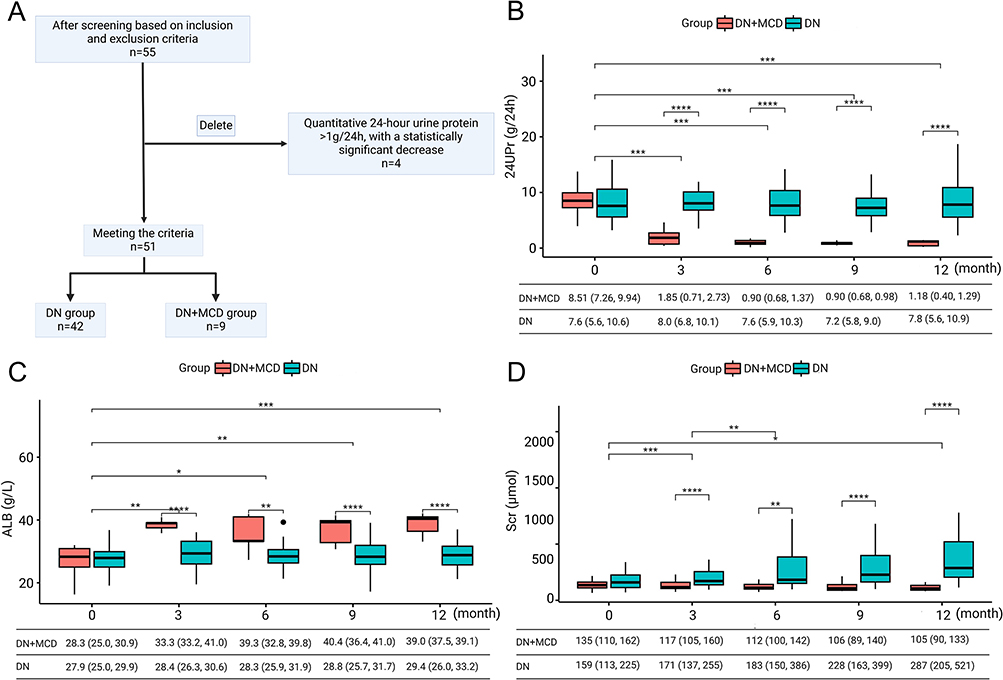 |
Figure 3 Patient Enrollment Process and Changes in 24UPr, ALB, and Scr During Follow-Up in the Two Patient Groups. (A) Flowchart of patient screening and grouping. (B) Patients in the DN+MCD group showed a reduction in 24UPr to below 1 g within 3 months in most cases. (C) ALB levels in the DN+MCD group returned to the normal range within 3 months for the majority of patients. (D) Scr levels remained stable in the DN+MCD group, whereas DN patients with persistent proteinuria exhibited progressive renal function decline. *P<0.05, **P<0.01, ***P<0.001, ****P<0.0001. Abbreviations: 24UPr, 24-Hour Urinary Protein; ALB, Serum Albumin; Scr, Serum Creatinine. |
During the follow-up period, the analysis of the examination indicators for the two patient groups revealed that there were statistically significant differences in 24UPr and serum ALB within the DN+MCD group. The 24UPr decreased to below 1g/24h, while ALB increased to above 40g/L. These two indicators did not show statistically significant differences within the DN group, as detailed in Figure 3B and C. These findings suggest that massive proteinuria attributed to MCD may tend to undergo spontaneous remission, with 24UPr often decreasing to <1 g within 3 months. Additionally, there were statistically significant differences in Scr within the DN group, with Scr increasing from 159 (113, 225) μmol/L to 287 (205, 521) μmol/L. However, in the DN+MCD group, there were no statistically significant differences in Scr, as shown in Figure 3D. Between the DN+MCD and DN groups, except for month 0, 24UPr, ALB, and Scr all exhibited statistically significant differences, as depicted in Figure 3B–D. These findings suggest that with the remission of MCD-induced massive proteinuria, the risk of further deterioration in renal function in DN decreases, accompanied by stabilized Scr levels. In contrast, due to the lack of remission in DN-associated massive proteinuria, persistent proteinuria remains a critical risk factor for renal dysfunction, leading to progressive kidney function decline in DN patients.
Analysis of FPW in the Two Patient Groups
Due to factors such as glomerular sclerosis, 11 patients’ electron microscopy images did not meet the criterion of having more than 4 FP per glomerular capillary loop. Ultimately, FPW measurements were obtained for 32 patients in the DN group and 8 patients in the DN+MCD group. The process of measuring FP in the DN and DN+MCD groups is illustrated in Figure 4A and B. After obtaining the average FPW for each group, a comparison between the groups showed that the FPW for the DN group was 0.54 (0.49, 0.60), while for the DN+MCD group, it was 1.50 (1.31, 1.74), with a p-value < 0.001. The difference in FPW between the two groups was statistically significant, as shown in Figure 4E. The results indicate that the DN+MCD group has wider FPW compared to the DN group. The ROC curve analysis demonstrated the ability of FPW to identify the presence of MCD in DN, with an area under the ROC curve (AUC) of 0.7992, 95% CI (0.7862, 0.8123), and a P value < 0.0001. Further application of multiple model linear regression was used to eliminate the influence of age, gender, BMI, duration of illness, presence of diabetic retinopathy, and hypertension on the diagnostic value of FPW, as shown in Table 2. The ROC curve for FPW, after adjusting for covariates, demonstrated an AUC of 0.9532, 95% CI (0.9485, 0.9579), with a P value < 0.0001, indicating that FPW can effectively differentiate the presence of MCD in DN, as depicted in Figure 4F. FPW holds diagnostic value in distinguishing whether DN is complicated by MCD.
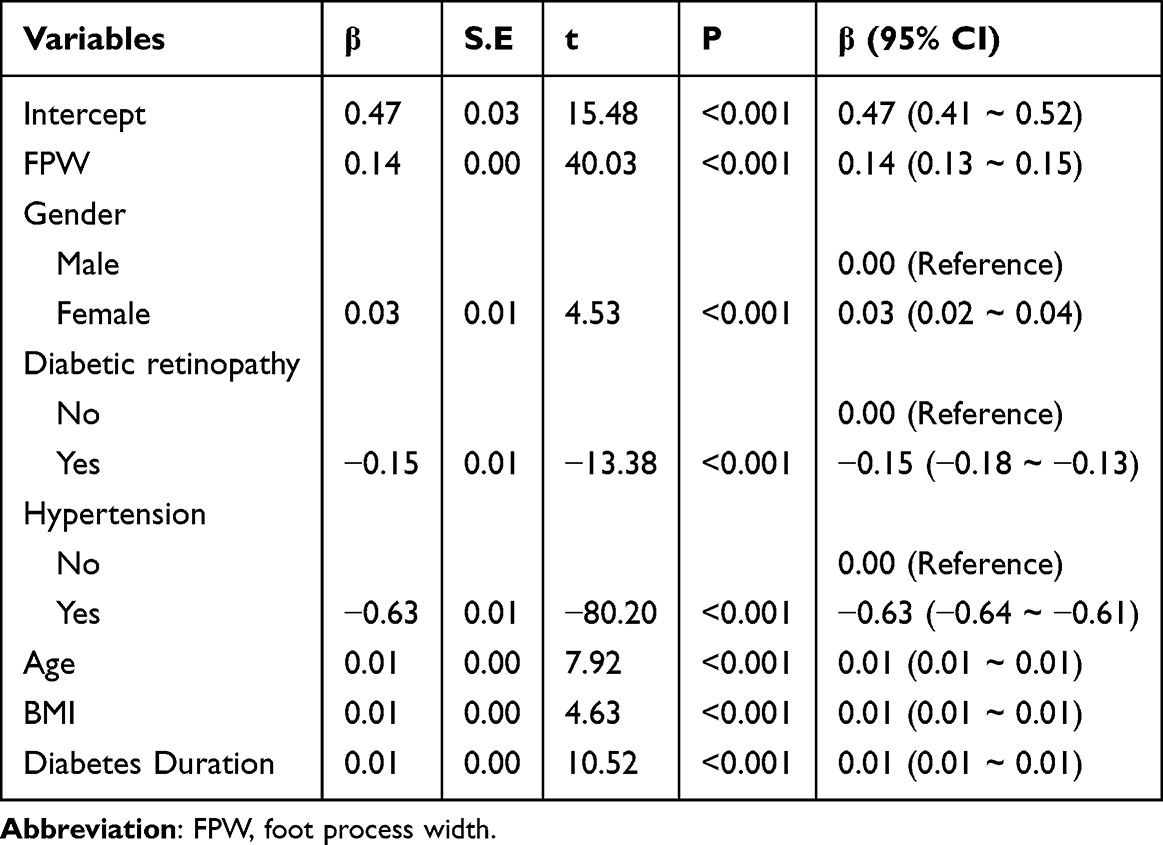 |
Table 2 Regression Analysis of Covariates That May Affect the Identification of MCD in DN by FPW After Adjustment |
 |
Figure 4 Structural Differences in FPW and Pathology Between the DN and DN+MCD Groups. (A) Representative image of the DN group. (B) Representative images of the DN+MCD group. Green arrows denote FP, and red numerals indicate FPW values in micrometres (µm). Measurement serial numbers precede each quantified value. (C and D) Immunohistochemical staining of Nephrin in the DN (C) and DN+MCD (D) groups, with green arrows highlighting regions of differential Nephrin expression. (E) Comparison of mean FPW between the two groups. The DN+MCD group exhibited significantly increased FPW compared to the DN group. (F) ROC curve analysis evaluating the diagnostic utility of FPW (unadjusted and adjusted for age, sex, BMI, disease duration, diabetic retinopathy, and hypertension) in discriminating DN with MCD from DN alone under nephrotic syndrome. (G) Quantitative comparison of AOD of Nephrin immunostaining. The DN+MCD group showed reduced Nephrin expression relative to the DN group. **P < 0.01; ***P < 0.001. Abbreviations: DN, diabetic nephropathy; MCD, minimal change disease; AOD, average optical density. |
Analysis of Differential Expression of Transmembrane Protein Nephrin in Renal Biopsy Tissues of the Two Groups
The immunohistochemical staining of Nephrin in the two patient groups is depicted in Figure 4C and D. After obtaining the average optical density (AOD) values for Nephrin expression in each group, a comparison between the groups revealed that the AOD value for the DN group was 0.1502, 95% CI (0.1278, 0.1726), and for the DN+MCD group, it was 0.0622, 95% CI (0.0529, 0.0715). The difference between the two groups was statistically significant, with P < 0.01, as shown in Figure 4G. These results indicate that the DN+MCD group has lower Nephrin expression levels and more severe damage to the SD’s structural integrity than the DN group.
Machine Learning
All three models achieved good convergence on the training dataset, maintaining an accuracy of over 90% and showing a favorable trend in loss convergence, as depicted in Figure 5A and B. However, there was a noticeable performance gap in the models on the validation dataset, with varying levels of accuracy. Among them, Mobilenetv2 demonstrated the best recognition performance, and there were distinct differences in the trend of loss variation. The loss trend of the CNN model indicated the occurrence of overfitting during model training, as shown in Figure 5C and D. After 50 rounds of iterative training, convergence was achieved on the training set, resulting in different test performances on the test set, as shown in Table 3. The model based on Mobilenetv2 exhibited the best performance, with the highest accuracy reaching 93.3%. When the number of test images increased to 11, the reliability of the determination of whether DN was combined with MCD reached an accuracy of 98%, as illustrated in Figure 5E. Visualization analysis of the parameters of the Mobilenetv2-based model using a heatmap revealed that the areas the model focused on for recognition were consistent with the actual observation areas, particularly near the junction of the FP and the basement membrane, as shown in Figure 5F.
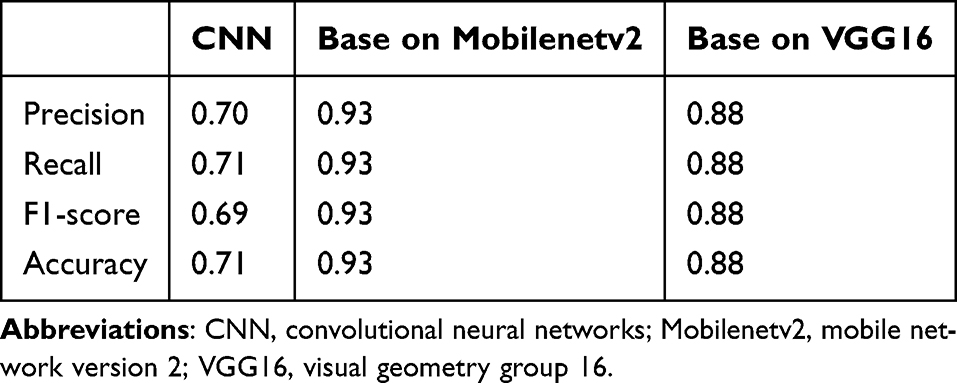 |
Table 3 Comparison of Test Set Performance of the Three Models |
 |
Figure 5 Development of a Machine Learning-Based Predictive Model to Distinguish DN with or Without MCD Using Electron Microscopic Images. (A and B) Trends of model accuracy and loss in the training dataset. The MobileNetV2-based model demonstrated optimal performance. (C and D) Trends of accuracy and loss in the validation dataset. The MobileNetV2-based model consistently exhibited robust performance. (E) Model accuracy in discriminating DN with or without MCD improves with an increasing number of input electron micrographs. (F) Overlay of original electron micrographs and model parameter heatmaps. Longer wavelengths exhibit higher recognition weights, with key regions localized near the FP and basement membrane interface (green arrow). (G) DN+MCD external validation cohort versus DN external validation cohort (P < 0.05). (H) DN cohort versus DN external validation cohort (P = 0.31). (I) DN+MCD cohort versus DN+MCD external validation cohort (P = 0.25). |
External Validation Results of Model Accuracy
Among 21 DN patients with NS who met the external validation criteria, 19.05% were found to have MCD. The external validation group consisted of 17 DN patients and 4 DN+MCD patients. Due to factors such as glomerular sclerosis, electron microscopy images of 5 patients did not meet the criterion, all of whom were from the DN external validation group. After obtaining the average FPW for the DN external validation group and the DN+MCD external validation group, a comparison between the groups revealed that the FPW for the DN external validation group was 0.54 (0.51, 0.57), while for the DN+MCD external validation group, it was 1.36 (1.13, 1.65), with p < 0.05. The difference in FPW between the DN group and the DN external validation group was not statistically significant when the model was established, with P=0.31. Similarly, the difference in FPW between the DN+MCD group and the DN+MCD external validation group was not statistically significant when the model was established, with P=0.25. A comparison of FPW between different groups is illustrated in Figure 5G–I. A total of 225 electron microscope images were used for validation, with 155 images from the DN external validation group and 70 images from the DN+MCD external validation group, meeting the minimum total sample size and positive sample size requirements of the BMJ external validation model.6 Based on the Mobilenetv2 model, the recognition of electron microscope images showed that 2 cases were misidentified in the DN external validation group, while the DN+MCD external validation group was completely correctly identified. The external validation dataset is shared on the GitHub code hosting platform (https://github.com/warriorZH/DN_MCD). Therefore, in the external validation data, the model’s sensitivity for predicting the presence of MCD in DN patients with NS was 100%, with a specificity of 83.33%.
Discussion
Following a one-year follow-up of patients diagnosed with DN and NS via renal biopsy over ten years at our hospital, it was found that 17.6% of DN patients also had MCD. Clinical data indicated that the levels of glycated haemoglobin and the presence of hypertension have discriminatory values in distinguishing whether DN is combined with MCD. This study analyzed the differences in renal tissue pathology between the two groups from three perspectives: changes in FPW, SD integrity, and deep learning of electron microscope images. The analysis results showed that the FPW of electron microscope images in the DN+MCD group was wider than that in the DN group, and the expression of the transmembrane protein Nephrin in the DN+MCD group was lower than that in the DN group, indicating a decrease in the number of SDs and indirectly supporting the significant fusion of FP and the increase in FPW in the DN+MCD group. A predictive model was successfully established through machine learning, suggesting the feasibility of using machine learning to differentiate whether DN is combined with MCD. Additionally, the visualization of the key recognition areas in machine learning showed that the recognition positions were mainly located near the junction of the FP and the basement membrane. Finally, the model was externally validated using renal biopsy-diagnosed DN patients with NS from an external hospital, demonstrating that the model has good sensitivity and specificity (100%, 83.33%) in distinguishing whether diabetic kidney disease is combined with minor lesions. Therefore, this study demonstrates that the morphological changes in FP have diagnostic value in determining whether DN is combined with MCD.
The podocytes are a core component of the glomerular filtration barrier, and their damage may stem from abnormalities in SD proteins, cytoskeletal proteins, adhesion proteins, GBM proteins, and nuclear proteins.7–9 Different pathological types of kidney diseases have different FPW, and after treatment, FPW gradually returns to normal with the recovery of the disease, indicating that FPW not only has diagnostic value for the classification of renal diseases but also has predictive value for the prognosis of the disease.10,11 Research has shown that the average FPW in healthy kidneys is 0.249±0.068 um.12 In untreated MCD, there is diffuse foot process fusion, with an FPW of 1600±440nm, while in relapsed MCD after prednisolone treatment, the diffuse foot process fusion is significantly less than in untreated MCD (FPW 920±200 nm).13 In diabetic kidney disease, during the period of microalbuminuria, the FPW is 663±110nm, while during the period of macroalbuminuria, the FPW is 724±210nm.14 The results of this study show that the FPW in DN is 0.54 (0.49, 0.60), while the width of the FP in cases of combined MCD is 1.50 (1.31, 1.74), similar to the results of previous studies. Our analysis indicates that FPW has diagnostic utility for differentiating these conditions. TEM-measured FPW at 20,000× magnification within the range of 0.54 μm (0.49–0.60 μm) may indicate isolated DN. Values exceeding this range likely signal DN complicated by primary glomerulopathies, such as MCD. Notably, the diagnostic thresholds for FPW are dependent on TEM magnification. Since the maximum resolvable FPW varies with magnification levels, altering the TEM magnification during measurement may require recalibration of the FPW reference intervals used for clinical diagnosis.
The FP are anchored to the glomerular basement membrane, and are linked by extracellular structures that are 35–45nm wide, known as slit SD. Nephrin is the first key protein identified to be located within the SD,15 and significant changes in SD are observed in cases of MCD. Direct observation of foot process SD via electron microscopy presents technical challenges, as linear images of the SD can only be seen when the thin section is at an appropriate angle. Additionally, the limited field of view in electron microscopy prevents an overall assessment of the SD. Therefore, in most studies, the assessment of SD damage is indirectly measured through the analysis of Nephrin expression to evaluate the extent of SD damage.16 Actin is one of the core components of the cytoskeleton of FP, and is predominantly present in the FP. It plays a dominant role in establishing and maintaining the unique structure of the FP.17
Nephrin plays a crucial role in the pathogenesis of MCD. IQ motif-containing GTPase-activating protein 1 (IQGAP1) is a scaffold protein that links the actin cytoskeleton and SD in FP. It interacts with Nephrin and regulates the maintenance of the actin cytoskeleton in FP, with actin primarily located in the FP. Recent studies have found that autoantibodies play a role in the pathogenesis of MCD. In serum samples from MCD patients, the levels of anti-Nephrin antibodies are significantly higher than in normal patients.18 The binding of Nephrin with autoantibodies may disrupt the integrity of SD and cytoskeletal organization.19 In contrast to MCD, the structural integrity of the foot process cytoskeleton in DN is highly dependent on the availability of ATP. Foot processes’ metabolic activity and function rely on efficient glucose oxidation to generate energy.20 Chronic hyperglycemia leads to progressive impairment of foot process glucose metabolism, significantly hindering mitochondrial ATP production.21 Impaired mitochondrial ATP synthesis significantly disrupts the balance between cytoskeletal assembly and disassembly, particularly affecting actin cytoskeleton and microtubules, ultimately leading to cytoskeletal rearrangement.22,23 Therefore, the causes of foot process changes in MCD and DN are different, and Nephrin’s differential expression can be used to distinguish between MCD and DN. Annika Wernerson et al found that the expression of Nephrin decreases in areas where FP disappear.24 This study found that the expression of Nephrin in the DN+MCD group decreased compared to the DN group, which is consistent with previous research results.
This study demonstrates that morphological changes in FP have diagnostic value in determining whether DN is combined with MCD. We designed multiple machine learning models and compared their performance. The results showed that the Mobilenetv2 model can effectively predict whether DN patients with NS are also combined with MCD, thus proving the feasibility of machine learning in this field. We provided a potential optimal machine learning design pattern, which can objectively identify common differential features in images and reduce the omissions caused by manual recognition. However, this study has some limitations, primarily due to the limited number of research samples and the damage caused to specimens during the fixation and staining processes in electron microscopy sample preparation. Multicenter studies can address the issue of limited sample size. With the development of cryo-electron microscopy technology, cryo-preparation can better preserve tissue morphology and provide higher-quality electron microscope images. Cryo-substitution can save the cost of preserving cryo-preparation samples while ensuring high-quality electron microscope images. We look forward to further research to improve the research outcomes in this field.
Conclusions
Podocyte foot process morphology has diagnostic value in differentiating whether DN is complicated by MCD. There is no reliable method to differentiate whether DN patients with massive proteinuria are complicated with MCD. Our study demonstrates that podocyte foot process morphology differences provide promising diagnostic potential to address this clinical challenge. Furthermore, the artificial intelligence model we developed enables rapid, convenient, and reliable analysis of patient renal biopsy electron microscopy images, significantly reducing the workload of manual measurements. This lays the foundation for intelligent recognition of renal imaging to assist in disease diagnosis and prognosis prediction.
Abbreviations
MCD, minimal change disease; DN, diabetic nephropathy; NDRD, non-diabetic renal diseases; NS, nephrotic syndrome; FPW, foot process width; SD, slit diaphragm; 24UPr, 24-hour urine protein quantification; ALB, serum albumin; Scr, serum creatinine; AI, Artificial Intelligence; CNN, convolutional neural networks; Mobilenetv2, mobile network version 2.
Data Sharing Statement
The repository containing the code for analysis, model definition, and data sets is available at the following git repository https://github.com/warriorZH/DN_MCD.
Ethical Statement
The studies involving humans were approved by the ethics committee of China-Japan Friendship Hospital (Approval Number: 2024-KY-129) and complied with the Declaration of Helsinki. All patients participating in the study have signed informed consent forms.
Funding
This work was supported by grants from the National High Level Hospital Clinical Research Funding and Elite Medical Professionals Project of China-Japan Friendship Hospital (ZRJY2023-GG06), National Natural Science Foundation of China (82300815), and China Health Promotion Foundation (DKD-MBD project, 2018-HX-86).
Disclosure
The authors have no conflicts of interest to declare for this work.
References
1. Sun H, Saeedi P, Karuranga S, et al. IDF Diabetes Atlas: global, regional and country-level diabetes prevalence estimates for 2021 and projections for 2045. Diabet Res Clin Pract. 2022;183:109119. doi:10.1016/j.diabres.2021.109119
2. Shimizu M, Furuichi K, Toyama T, et al. Long-term outcomes of Japanese type 2 diabetic patients with biopsy-proven diabetic nephropathy. Diabetes Care. 2013;36(11):3655–3662. doi:10.2337/dc13-0298
3. Unnersjö-Jess D, Butt L, Höhne M, et al. Deep learning-based segmentation and quantification of podocyte foot process morphology suggests differential patterns of foot process effacement across kidney pathologies. Kidney Int. 2023;103(6):1120–1130. doi:10.1016/j.kint.2023.03.013
4. Dinsdale NK, Bluemke E, Sundaresan V, Jenkinson M, Smith SM, Namburete AIL. Challenges for machine learning in clinical translation of big data imaging studies. Neuron. 2022;110(23):3866–3881. doi:10.1016/j.neuron.2022.09.012
5. Tervaert TW, Mooyaart AL, Amann K, et al. Pathologic classification of diabetic nephropathy. J Am Soc Nephrol. 2010;21(4):556–563. doi:10.1681/asn.2010010010
6. Riley RD, Snell KIE, Archer L, et al. Evaluation of clinical prediction models (part 3): calculating the sample size required for an external validation study. BMJ. 2024;384:e074821. doi:10.1136/bmj-2023-074821
7. Ahmadian E, Eftekhari A, Atakishizada S, et al. Podocytopathy: the role of actin cytoskeleton. Biomed Pharmacother. 2022;156:113920. doi:10.1016/j.biopha.2022.113920
8. Ozawa S, Matsubayashi M, Nanaura H, et al. Proteolytic cleavage of Podocin by Matriptase exacerbates podocyte injury. J Biol Chem. 2020;295(47):16002–16012. doi:10.1074/jbc.RA120.013721
9. Zeng L, Szeto CC. Urinary podocyte markers in kidney diseases. Clin Chim Acta. 2021;523:315–324. doi:10.1016/j.cca.2021.10.017
10. Smerkous D, Mauer M, Tøndel C, et al. Development of an automated estimation of foot process width using deep learning in kidney biopsies from patients with Fabry, minimal change, and diabetic kidney diseases. Kidney Int. 2024;105(1):165–176. doi:10.1016/j.kint.2023.09.011
11. Hu YF, Tan Y, Yu XJ, et al. Podocyte involvement in renal thrombotic microangiopathy: a clinicopathological study. Am J Nephrol. 2020;51(9):752–760. doi:10.1159/000510141
12. Siegerist F, Ribback S, Dombrowski F, et al. Structured illumination microscopy and automatized image processing as a rapid diagnostic tool for podocyte effacement. Sci Rep. 2017;7(1):11473. doi:10.1038/s41598-017-11553-x
13. van den Berg JG, van den Bergh Weerman MA, Assmann KJ, Weening JJ, Florquin S. Podocyte foot process effacement is not correlated with the level of proteinuria in human glomerulopathies. Kidney Int. 2004;66(5):1901–1906. doi:10.1111/j.1523-1755.2004.00964.x
14. Dalla Vestra M, Masiero A, Roiter AM, Saller A, Crepaldi G, Fioretto P. Is podocyte injury relevant in diabetic nephropathy? Studies in patients with type 2 diabetes. Diabetes. 2003;52(4):1031–1035. doi:10.2337/diabetes.52.4.1031
15. Kestilä M, Lenkkeri U, Männikkö M, et al. Positionally cloned gene for a novel glomerular protein--nephrin--is mutated in congenital nephrotic syndrome. Mol Cell. 1998;1(4):575–582. doi:10.1016/s1097-2765(00)80057-x
16. Pereira LHM, da Silva CA, Monteiro M, et al. Podocin and uPAR are good biomarkers in cases of Focal and segmental glomerulosclerosis in pediatric renal biopsies. PLoS One. 2019;14(6):e0217569. doi:10.1371/journal.pone.0217569
17. Ye Q, Lan B, Liu H, Persson PB, Lai EY, Mao J. A critical role of the podocyte cytoskeleton in the pathogenesis of glomerular proteinuria and autoimmune podocytopathies. Acta Physiol. 2022;235(4):e13850. doi:10.1111/apha.13850
18. Chebotareva N, Vinogradov A, Birukova Y, et al. A pilot study of anti-nephrin antibodies in podocytopaties among adults. Nephrology. 2024;29(2):86–92. doi:10.1111/nep.14249
19. Watts AJB, Keller KH, Lerner G, et al. Discovery of autoantibodies targeting nephrin in minimal change disease supports a novel autoimmune etiology. J Am Soc Nephrol. 2022;33(1):238–252. doi:10.1681/asn.2021060794
20. Mohandes S, Doke T, Hu H, Mukhi D, Dhillon P, Susztak K. Molecular pathways that drive diabetic kidney disease. J Clin Invest. 2023;133(4). doi:10.1172/jci165654
21. Forbes JM, Thorburn DR. Mitochondrial dysfunction in diabetic kidney disease. Nat Rev Nephrol. 2018;14(5):291–312. doi:10.1038/nrneph.2018.9
22. Solomon T, Rajendran M, Rostovtseva T, Hool L. How cytoskeletal proteins regulate mitochondrial energetics in cell physiology and diseases. Philos Trans R Soc Lond B Biol Sci. 2022;377(1864):20210324. doi:10.1098/rstb.2021.0324
23. Oosterheert W, Klink BU, Belyy A, Pospich S, Raunser S. Structural basis of actin filament assembly and aging. Nature. 2022;611(7935):374–379. doi:10.1038/s41586-022-05241-8
24. Wernerson A, Dunér F, Pettersson E, et al. Altered ultrastructural distribution of nephrin in minimal change nephrotic syndrome. Nephrol Dial Transplant. 2003;18(1):70–76. doi:10.1093/ndt/18.1.70
 © 2025 The Author(s). This work is published and licensed by Dove Medical Press Limited. The
full terms of this license are available at https://www.dovepress.com/terms
and incorporate the Creative Commons Attribution
- Non Commercial (unported, 4.0) License.
By accessing the work you hereby accept the Terms. Non-commercial uses of the work are permitted
without any further permission from Dove Medical Press Limited, provided the work is properly
attributed. For permission for commercial use of this work, please see paragraphs 4.2 and 5 of our Terms.
© 2025 The Author(s). This work is published and licensed by Dove Medical Press Limited. The
full terms of this license are available at https://www.dovepress.com/terms
and incorporate the Creative Commons Attribution
- Non Commercial (unported, 4.0) License.
By accessing the work you hereby accept the Terms. Non-commercial uses of the work are permitted
without any further permission from Dove Medical Press Limited, provided the work is properly
attributed. For permission for commercial use of this work, please see paragraphs 4.2 and 5 of our Terms.
Recommended articles
Integrated Analysis of Single-Cell RNA-Seq and Bulk RNA-Seq Combined with Multiple Machine Learning Identified a Novel Immune Signature in Diabetic Nephropathy
Peng YL, Zhang Y, Pang L, Dong YF, Li MY, Liao H, Li RS
Diabetes, Metabolic Syndrome and Obesity 2023, 16:1669-1684
Published Date: 7 June 2023
Machine Learning-Based Predictive Modeling of Diabetic Nephropathy in Type 2 Diabetes Using Integrated Biomarkers: A Single-Center Retrospective Study
Zhu Y, Zhang Y, Yang M, Tang N, Liu L, Wu J, Yang Y
Diabetes, Metabolic Syndrome and Obesity 2024, 17:1987-1997
Published Date: 10 May 2024
A Machine Learning Model for Predicting Diabetic Nephropathy Based on TG/Cys-C Ratio and Five Clinical Indicators
Zhou D, Shao L, Yang L, Chen Y, Zhang Y, Yue F, Gu W, Li S, Li S, Wei J
Diabetes, Metabolic Syndrome and Obesity 2025, 18:955-967
Published Date: 31 March 2025
Comprehensive Analysis and Experimental Validation of Immune-Related Biomarkers and Immune Microenvironment in Diabetic Nephropathy
Zhou W, Zeng Z, Li X, Yang M
Journal of Inflammation Research 2025, 18:13711-13726
Published Date: 3 October 2025