Back to Journals » Diabetes, Metabolic Syndrome and Obesity » Volume 16
Urinary PART1 and PLA2R1 Could Potentially Serve as Diagnostic Markers for Diabetic Kidney Disease Patients
Authors Ye Q, Xu G ![]() , Yuan H, Mi J, Xie Y, Li H, Li Z, Huang G, Chen X
, Yuan H, Mi J, Xie Y, Li H, Li Z, Huang G, Chen X ![]() , Li W, Yang R
, Li W, Yang R
Received 6 November 2023
Accepted for publication 8 December 2023
Published 27 December 2023 Volume 2023:16 Pages 4215—4231
DOI https://doi.org/10.2147/DMSO.S445341
Checked for plagiarism Yes
Review by Single anonymous peer review
Peer reviewer comments 3
Editor who approved publication: Dr Konstantinos Tziomalos
Qinglin Ye,1,* Guiling Xu,1,* Hao Yuan,2,3 Junhao Mi,2,3 Yuli Xie,2,3 Haoyu Li,1 Zhejun Li,1 Guanwen Huang,1 Xuesong Chen,1 Wei Li,1 Rirong Yang2,3
1Department of Nephrology, The Second Affiliated Hospital of Guangxi Medical University, Nanning, 530005, People’s Republic of China; 2Centre for Genomic and Personalized Medicine, Guangxi key Laboratory for Genomic and Personalized Medicine, Guangxi Collaborative Innovation Center for Genomic and Personalized Medicine, Guangxi Medical University, Nanning, 530021, People’s Republic of China; 3Department of Immunology, School of Basic Medical Sciences, Guangxi Medical University, Nanning, 530021, People’s Republic of China
*These authors contributed equally to this work
Correspondence: Rirong Yang, Centre for Genomic and Personalized Medicine, Guangxi key Laboratory for Genomic and Personalized Medicine, Guangxi Collaborative Innovation Center for Genomic and Personalized Medicine, Department of Immunology, School of Basic Medical Sciences, Guangxi Medical University, Nanning, Guangxi, 530021, People’s Republic of China, Fax +86 0771 5317061, Email [email protected]; [email protected] Wei Li, Department of Nephrology, The Second Affiliated Hospital of Guangxi Medical University, Nanning, 530005, People’s Republic of China, Email [email protected]
Background: Diabetic kidney disease (DKD) is a chronic renal disease which could eventually develop into renal failure. Though albuminuria and estimated glomerular filtration rate (eGFR) are helpful for the diagnosis of DKD, the lack of specific biomarkers reduces the efficiency of therapeutic interventions.
Methods: Based on bulk-seq of 56 urine samples collected at different time points (including 11 acquired from DKD patients and 11 from healthy controls), in corporation of scRNA-seq data of urine samples and snRNA-seq data of renal punctures from DKD patients (retrieved from NCBI GEO Omnibus), urine-kidney specific genes were identified by Multiple Biological Information methods.
Results: Forty urine-kidney specific genes/differentially expressed genes (DEGs) were identified to be highly related to kidney injury and proteinuria for the DKD patients. Most of these genes participate in regulating glucagon and apoptosis, among which, urinary PART1 (mainly derived from distal tubular cells) and PLA2R1 (podocyte cell surface marker) could be used together for the early diagnosis of DKD. Moreover, urinary PART1 was significantly associated with multiple clinical indicators, and remained stable over time in urine.
Conclusion: Urinary PART1 and PLA2R1 could be shed lights on the discovery and development of non-invasive diagnostic method for DKD, especially in early stages.
Keywords: diabetic kidney disease, urine, non-invasive, diagnosis, biomarker
Graphical Abstract:

Introduction
Diabetic kidney disease (DKD) is a prevalent microvascular complication of diabetes and a leading cause of mortality in diabetic patients. Early symptoms of DKD are often atypical, with chronic progressive and irreversible development leading to eventual renal failure.1 Early diagnosis and prevention are crucial to delay the onset and progression of DKD. Currently, eGFR and proteinuria are the primary indicators of DKD progression.2 However, albuminuria and albumin excretion rates have low sensitivity, with only about half of patients exhibiting progressive renal decline having albuminuria.3 Furthermore, kidney damage can occur before the onset of microalbuminuria.4 While eGFR and proteinuria lack specificity, eGFR data is not always readily available.5 Therefore, it is essential to explore new biomarkers for DKD to improve prediction based on eGFR.
Urine, flowing through the kidney and urinary tract system, presents a compelling avenue for clinical research due to its potential to contain shed cells from the kidney and urinary tract epithelium. This makes urine an attractive subject for investigation.6 Moreover, as a direct product of the kidney, urine serves as a valuable indicator for detecting kidney injury. Compared to blood, urine offers a more accessible and amplified platform for identifying changes in substances, thereby enabling the easier display of disease-related information within the body.7,8 By leveraging urine biomarkers, which provide a non-invasive and convenient means of auxiliary diagnosis for Diabetic Kidney Disease (DKD), early identification of DKD becomes feasible, facilitating timely personalized treatment interventions.
In this study, we conducted bulk RNA-seq and downstream analysis on urinary cells of diabetic kidney disease (DKD), including the first morning urinary cells, second urinary cells, and random urinary cells. Additionally, we combined kidney single-cell RNA-seq data and urine single-cell RNA-seq data of DKD to explore and identify urine-kidney specific differential genes. Utilizing three machine learning techniques, we constructed and screened DKD-associated urine-kidney hub genes, namely PART1 and PLA2R1. Prostate androgen-regulated transcript 1 is along non-coding RNA. It is associated with inflammatory conditions such as cancer,9 vertebral disc degeneration,10 and osteoarthritis.11 The Phospholipase A2 Receptor 1 (PLA2R1) is associated with cellular senescence, damage and inflammation.12–14 Similarly, diabetic kidney disease is also associated with inflammation.15 Many cytokines and predictors, such as Kidney injury molecule,16 omentin17, prognostic nutritional index,18 and neuregulin,19 are decreased and many inflammatory markers, including C-reactive protein,20 serum uric acid,21 monocyte/lymphocyte ratio,22 and uric acid/HDL cholesterol ratio,23 are increased in diabetic kidney injury. Thus studying PART1 and PLA2R1 in diabetic kidney disease is reasonable.
Interestingly, our findings revealed a connection between the pathogenesis of DKD and the ceRNA regulatory network. This deepened our understanding of the disease and provided valuable insights for the exploration of potential drug targets. It is important to note that while conventional RNA sequencing can detect changes in gene expression between cell populations, it was unable to identify genes that differed between cells.24 On the other hand, single-cell sequencing at the individual cell level, such as ScRNA-seq, allowed for the classification and identification of new cell types, contributing to our understanding of cell heterogeneity in complex tissues and diseases.25,26 By exploring DKD from a single-cell perspective, we can gain a more comprehensive understanding of the disease and potentially discover novel “urine-kidney specific biomarkers”. Moreover, it is worth mentioning that previous urine-related studies have primarily focused on morning urinary cells. However, in our study, we hypothesized that the urinary cells in the second morning urinary cells may better reflect the function and status of the kidney as they are shed after the first morning urinary cells has “cleaned” the urinary system’s epithelial cells.
Materials and Methods
Study Cohort for Urinary Cells Bulk RNA-Seq and Urine Samples Processing
The flow chart of this study is shown in Figure 1. This study was approved by the ethics commission of Guangxi Medical University Ethics Committee and was performed under the ethical principles of the Declaration of Helsinki (approval number: (2022-KY (0623)). All patients provided written and verbal informed consent. The inclusion criteria for this study were patients with Diabetic Kidney Disease (DKD) as defined in the Expert Consensus on the Clinical Diagnosis of Diabetic Kidney Disease in Chinese Adults.27 Exclusion criteria included kidney damage due to factors such as hypertensive nephropathy, lupus nephritis, drug-induced kidney injury, and tumor or cachexia.
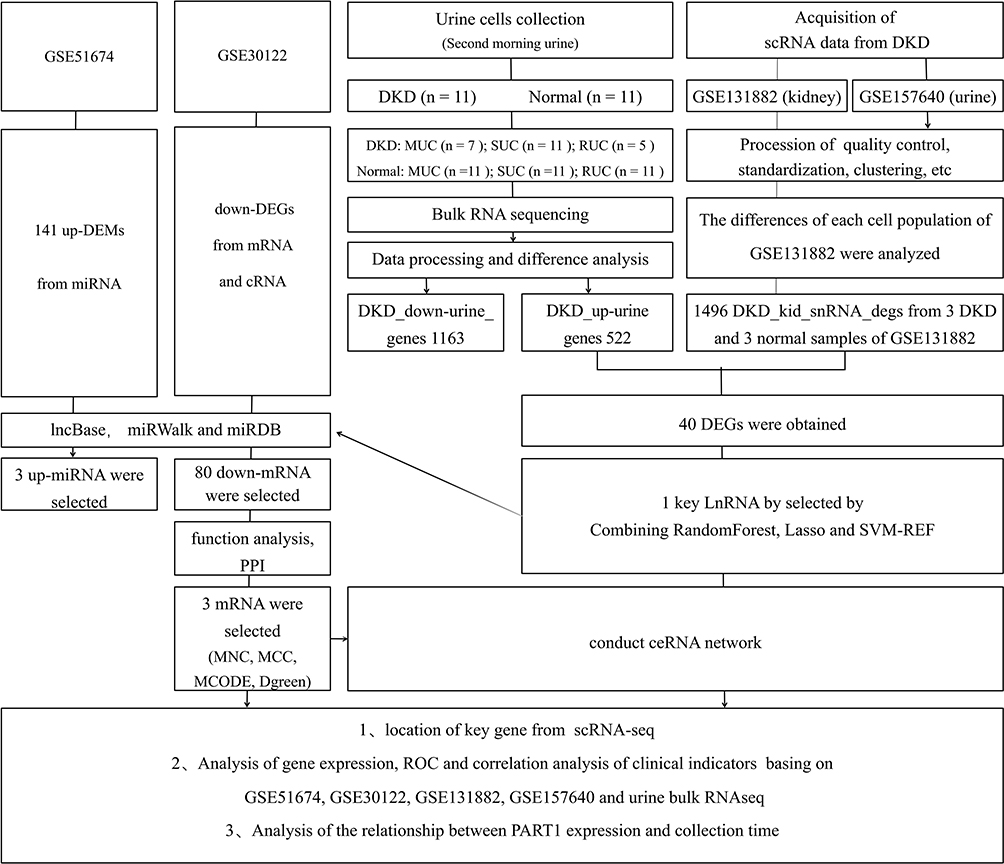 |
Figure 1 Workflow Diagram. |
Urinary cell samples were collected from 11 patients diagnosed with DKD at the Second Affiliated Hospital of Guangxi Medical University, along with 11 healthy individuals matched for age and sex. Three types of urine samples were collected from each participant: first morning urinary cells, secondary urinary cells (the second urine when patients wake up in the morning), and random urinary cells.
The urine samples were immediately transported on ice to the laboratory for processing. All procedures were performed on ice or at 4°C. The samples were centrifuged and the supernatant discarded. Deposits, mainly urinary cells, were retained. The urinary cells were then suspended in 1x Dulbecco’s PBS (DPBS) and centrifuged again at 490g for 5 minutes. This process was repeated twice.
The entire process of RNA capture to library construction is performed from urinary cells using the AccuraCode® HTP OneStep RNAseq Kit, following the manufacturer’s protocol. Cell lysis and RNA capture were performed using Cell Lysis Buffer. OneStep Buffer was used for cDNA amplification and purification. Finally, bulk RNA-Seq was performed on a total of 56 urine samples.
Pre-Processing of Urinary Cells Bulk RNA-Seq Dataset
The batch effect of the data was processed, and standardization by removing more than 20% of genes with an expression value of 0. And differential expression analysis were performed using the “DESeq2” package (13). Genes that were significantly differentially expressed with |log2 Fold Change| > 1 and P value < 0.05 were selected for downstream analysis.
Acquisition of Data and Processing
The kidney sn-RNAseq dataset GSE13188228 of DKD, containing 3 human diabetic kidney samples and 3 controls. Additionally, we downloaded the urine sc-RNAseq dataset GSE15764029 of DKD, containing samples from five subjects at two different occasions using both spot and 24-hour urine. These datasets were downloaded from the GEO database (https://www.ncbi.nlm.nih.gov/).30 Then, Seurat package31 was performed to read expression profile and quality control (nFeature_RNA > 200 and nFeature_RNA < 2500 and percent.mt < 15). The data were normalized and homogenized in turn. Then, “FindAllMarkers” function was used to identify cell-type markers. The limma package32 was employed to identify genes that were significantly differentially expressed between the DKD group and the normal group (|logFoldChange(logFC)| > 1, P value < 0.05).
Additionally, the GSE5167433 dataset, which includes 6 DKD kidney tissues and 4 normal kidney tissues, and the GSE3012234 dataset, which includes 10 DKD kidney tissues and 24 normal kidney tissues, were also downloaded from the GEO database. The GSE51674 dataset is a microRNA dataset.
Bioinformatics Analysis of 40 Urine-Kidney Differentially Expressed Genes
Urinary cells bulk RNA-seq data were analyzed from the secondary urinary cells, including 11 patients with DKD and 11 normal individuals, resulting in the identification of 522 upregulated genes (up-urine). Additionally, a total of 1496 differentially expressed genes of kidney single nucleus RNAseq (kid-scRNA-degs) were obtained originating from 12 clusters. The intersection of DKD up-urine genes with DKD scRNA-kid-degs was determined using a Venn diagram, resulting in the identification of 40 urine-kidney differentially expressed genes (urine-kid-degs). Gene Ontology (GO) annotation and Kyoto Encyclopedia of Genes and Genomes (KEGG) pathway enrichment analysis of these 40 genes were performed using the Database for Annotation, Visualization, and Integrated Discovery (DAVID; https://david.ncifcrf.gov/home.jsp).
Machine Learning
To identify candidate hub urinary biomarkers of DKD, three machine learning algorithms were employed. The least absolute shrinkage and selection operator (LASSO) algorithm, implemented through the “glmnet” package, was used to filter variables and improve prediction performance.35,36 The random forest (RF) algorithm, an ensemble method based on decision trees, was used to screen candidate biomarkers with high accuracy.37 The support vector machine-recursive feature elimination (SVM-RFE) method38 was used to find optimal variables. The hub urinary biomarkers of DKD were selected by intersecting the markers identified by these three machine learning algorithms.
PART1 and PLA2R1 Expression in Different Time Points and Clinical Correlation Analysis in Urine of DKD
Clinical information from the study cohort was obtained from the Second Affiliated Hospital of Guangxi Medical University and visualized using the “ggpubr” package.39 The expression of key genes was assessed across three time points in urinary cells to understand the relationship between hub urinary biomarkers and time in urine of DKD. ROC analysis was performed to evaluate their diagnostic value.
Analysis and Prediction of the Differentially miRNA and mRNA
PLA2R1, a diagnostic and prognostic biomarker of membranous nephropathy (MN), is now widely recognized and utilized.40 Consequently, PART1, exhibiting the highest correlation with clinical indicators, was selected as a promising urinary biomarker of DKD to further analyze and explore. Next, differential expression analysis of promising GSE51674 (DEMs) and GSE30122 (DEGs) was performed using the GEO2R online analysis tool accessible within the GEO database. The screening criteria for differently expressed genes between DKD and normal samples were |log2 Fold change| > 1 and P value < 0.05. To enhance results accuracy, LncRRIsearch (http://rtools.Cbrc.jp/LncRRIsearch/) was used to predict the interaction between PART1 and miRNAs. miRWalk (http://mirwalk.umm.uniheidelberg.de/) and miRDB (http://www.mirdb.org/) were used to predict the interaction between miRNAs and mRNAs.
Protein–Protein Interaction Network and Enrichment Analysis
Targeted miRNAs were intersected with up-DEMs from GSE51674 to identify critical miRNAs. Similarly, targeted mRNAs were intersected with down-DEGs from GSE30122 to identify critical mRNAs. The resulting networks were visualized using Cytoscape software.41 GO annotation and KEGG pathway analysis of the 80 candidate mRNAs were performed using the “clusterProfiler” package.42
Acquisition and Analysis of Key lncRNA- miRNA–mRNA Interaction Networks
Important mRNAs in the protein-protein interaction network were explored using the Molecular Complex Detection (MCODE) algorithm in Cytoscape. Additionally, the top 10 node genes were identified using the Maximal Clique Centrality (MCC), Maximum Neighborhood Component (MNC), and “Degree” methods. Critical mRNAs were obtained by overlapping these four methods. The expression levels of important mRNAs in GSE131882 were explored, and clinical information from GSE30122 containing 4 normal controls and 6 DKD patients was obtained from Nephroseq V5 (http://v5.nephroseq.org/) for further analysis.
Verification and Localization of PART1 and BCL2
The Nephroseq V5 tool was used to explore the expression of PART1 with other tissues of DKD. Urine scRNA-seq and kidney snRNA-seq datasets were analyzed to determine the source of PART1 and BCL2 in urine of DKD.
Statistical Analysis
Statistical analyses were conducted using GraphPad Prism 9 software and R version 3.6.3. Differences between the two groups were compared by unpaired Student’’s s t-test. TimeROC curve analysis was employed to assess diagnostic value, with p < 0.05 considered statistically significant. The text provides a detailed description of the data acquisition, processing, analysis methods, and statistical analysis used in the study.
Results
Characteristics of the Urinary Cells Bulk RNA-Seq Cohort
A total of 56 urine samples, including morning urinary cells, second morning urinary cells, and random urine, were collected from 11 patients and 11 healthy individuals for the purpose of performing bulk RNA-Seq. The clinical and demographic information of the participants is presented in Table 1.
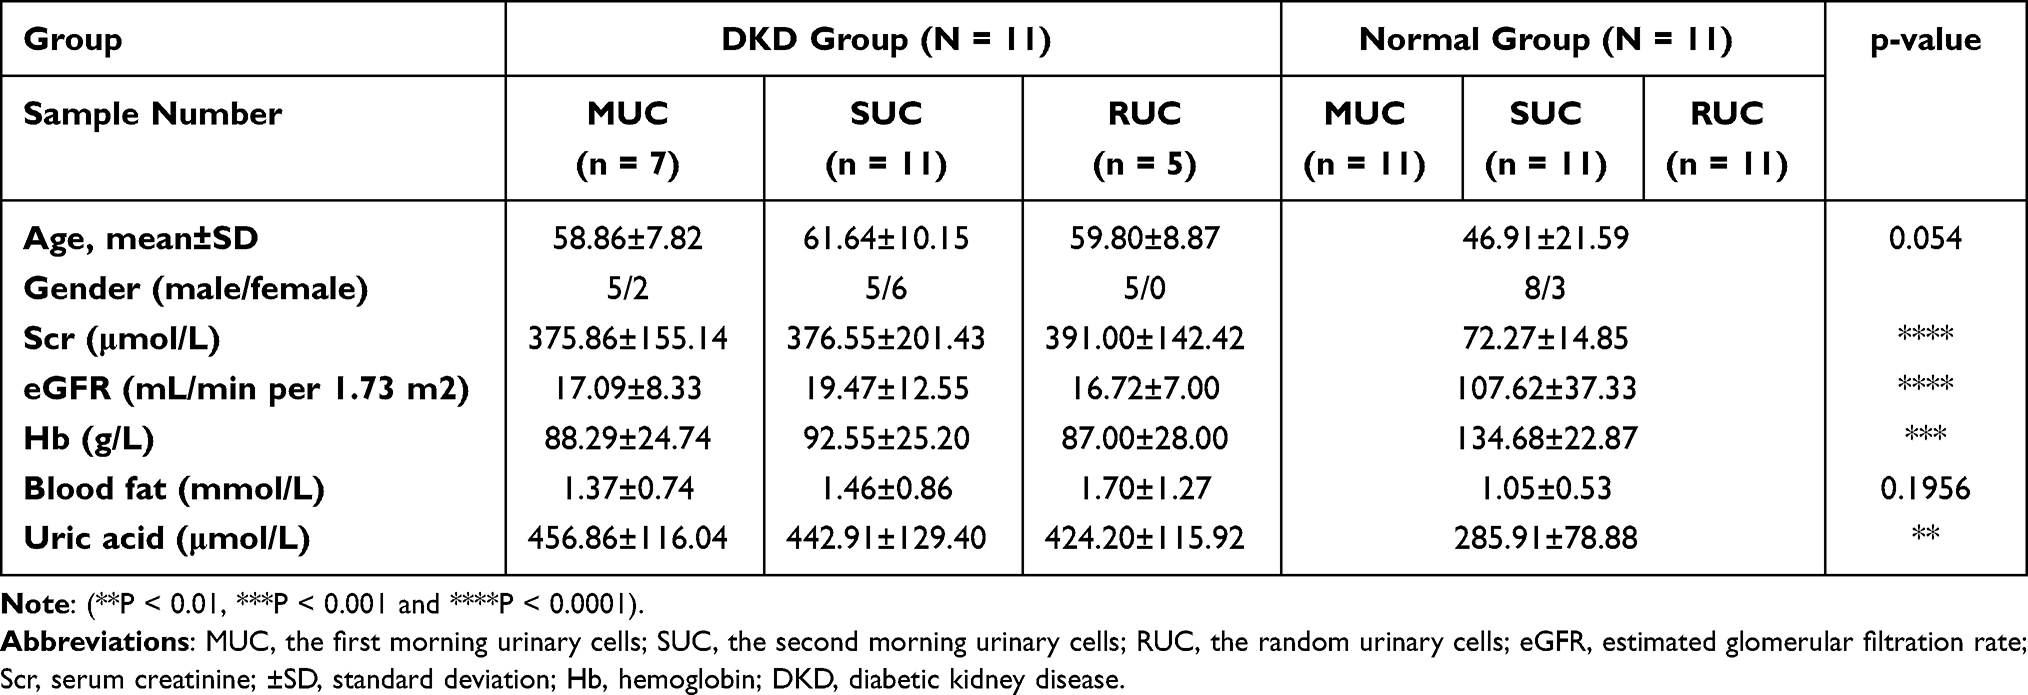 |
Table 1 Characteristics of Participants |
The Second Morning Urinary Cells Bulk RNA-Seq Analysis of DKD
In comparison with normal samples, we identified 1685 differentially expressed urinary genes (uDEGs) in the urinary cells of DKD. Among these, 522 genes were upregulated, and 1163 genes were downregulated. The top 40 uDEGs were visualized using a hierarchical cluster map (Figure 2A), and the distribution of uDEGs was displayed in a volcano plot (Figure 2B). To facilitate diagnosis and prediction in urine, we focused on the 522 upregulated urinary genes (up-urine) for downstream analysis (Supplementary Tables S1 and 2).
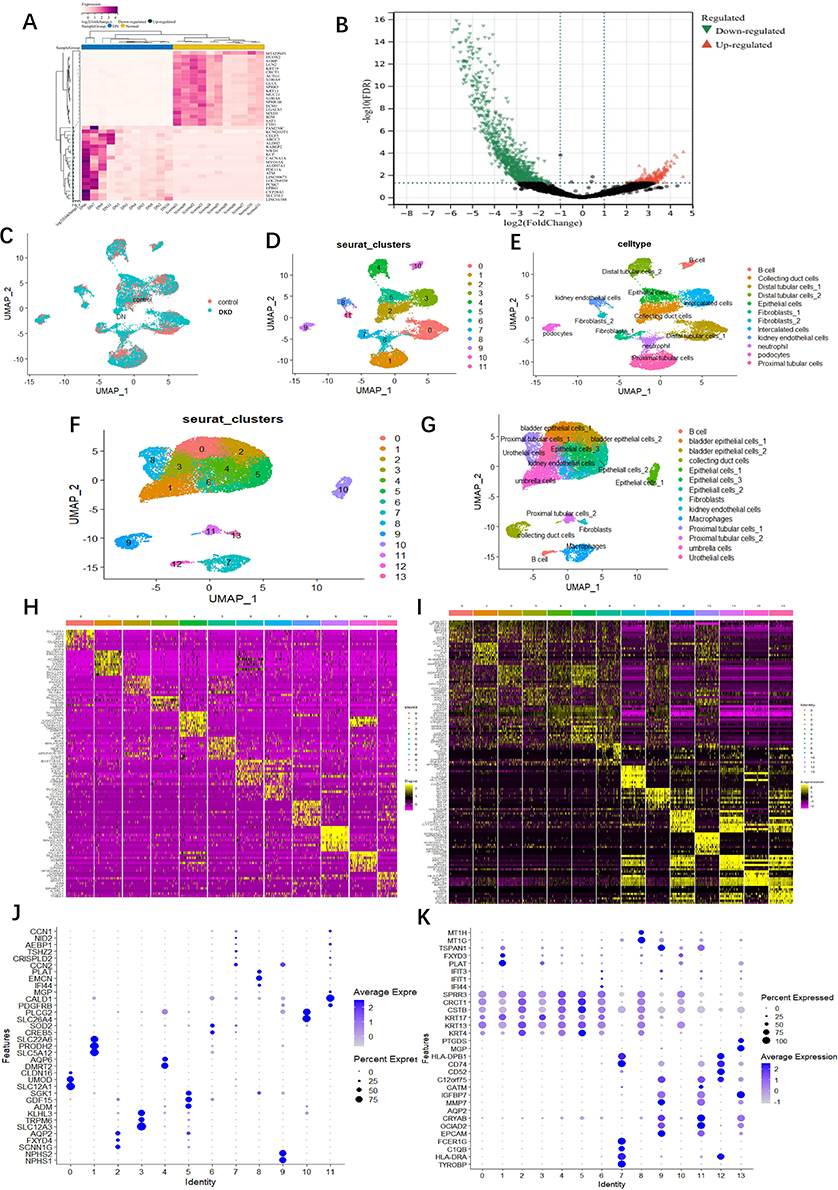 |
Figure 2 Analysis of urine bulking RNA-seq data and two scRNA-seq data from DKD. (A) Expression heatmap of the top 40 urine-DEGs. (B) Volcano plot of urine- DEGs between DKD patients and control. (C) Sample source of each cell cluster analyzed by UMAP. Blue indicates the DKD origin and pink shows the cells originated from normal. (D and E) UMAP plots of DKD kidney snRNA-seq data from GSE131882 reveal 12 individual cell clusters and cell types (cluster 0 and 4: Distal tubular cells; cluster 1: Proximal tubular cells; cluster 2: Collecting duct cells; cluster 3: Intercalated cells; cluster 5: Epithelial cells; cluster 6: Neutrophil; cluster 7 and 11: Fibroblasts; cluster 8: Kidney endothelial cells; cluster 9: Podocytes; cluster 10: B cell). (F and G) UMAP plots of DKD urine scRNA-seq data from GSE157640 reveal 14 individual cell clusters and cell types (cluster 0 and 2: Bladder epithelial cells; cluster 1: Umbrella cells; cluster 3: Urothelial cells; cluster 4, 5 and 10: Epithelial cells; cluster 6: Kidney endothelial cells; cluster 7: Macrophages; cluster 8 and 11: Proximal tubular cells; cluster 9: Collecting duct cell; cluster 12: B cell; cluster 13: Fibroblasts). Principal component heatmap plot revealing 10 most highly expressed genes in each of clusters (vertical columns), including (H) GSE131882 and (I) GSE157640. Each row representing 1 gene, with high expression (yellow), intermediate expression (purple), and low expression (black). Bubble dot plots of the top cell-type-specific differentially expressed genes in the (J) DKD kidney snRNA-seq data from GSE131882 and (K) DKD urine scRNA-seq data from GSE157640. The size of the dot indicates the expression percentage and the darkness of the color indicates average expression. |
Kidney snRNA-Seq and Urine scRNA-Seq Analysis of DKD
To deepen our understanding of the cellular diversity of DKD and explore “urine-kidney specific biomarkers”, we analyzed urine scRNA-seq and kidney snRNA-seq of DKD. Following quality control, we identified 12 cell clusters in the kidney snRNA-seq of DKD (Figure 2C–E) and 14 cell clusters in the urine scRNA-seq of DKD (Figure 2F and G). The top 10 marker genes from both datasets were visualized using cluster heatmaps (Figure 2H and I). The two datasets of marker genes are listed in Figure 2J and K (Supplementary Figure S1 and 2), respectively.
In addition, we conducted a further analysis of the differential genes in the 12 cell clusters between the DKD group and the normal group using kidney snRNA-seq data. We obtained a total of 1496 differential kidney genes in DKD (scRNA-kid-degs) from the 12 cell clusters Supplementary Tables S3–5
Pathways Enrichment Analysis of 40 Urine-Kidney Differentially Expressed Genes
We obtained 40 urine-kidney differentially expressed genes by intersecting the 1496 scRNA-kid-degs and the 522 up-urine genes of DKD using a Venn diagram (Figure 3A). To explore the functional annotation of these 40 genes, we performed KEGG and GO enrichment analyses (Figure 3B and C). The KEGG pathway analysis revealed that these genes may be involved in pathways such as the apelin signaling pathway, arginine and proline metabolism, and the glucagon signaling pathway, all of which are relevant to the pathogenesis of DKD, for example, apelin signaling pathway is associated with vascular function and the regulation of blood pressure;43 alterations in arginine and proline metabolism could impact NO production.44 In DKD, impaired NO production can lead to endothelial dysfunction,45 vasoconstriction, and reduced renal blood flow; in diabetes, particularly in the context of insulin resistance, there is an imbalance between insulin and glucagon, leading to elevated blood glucose levels. Elevated glucagon levels can promote gluconeogenesis (the production of glucose from non-carbohydrate sources)46 and glycogenolysis (breakdown of stored glycogen), contributing to hyperglycemia. Persistent hyperglycemia is a major driver of DKD development.47
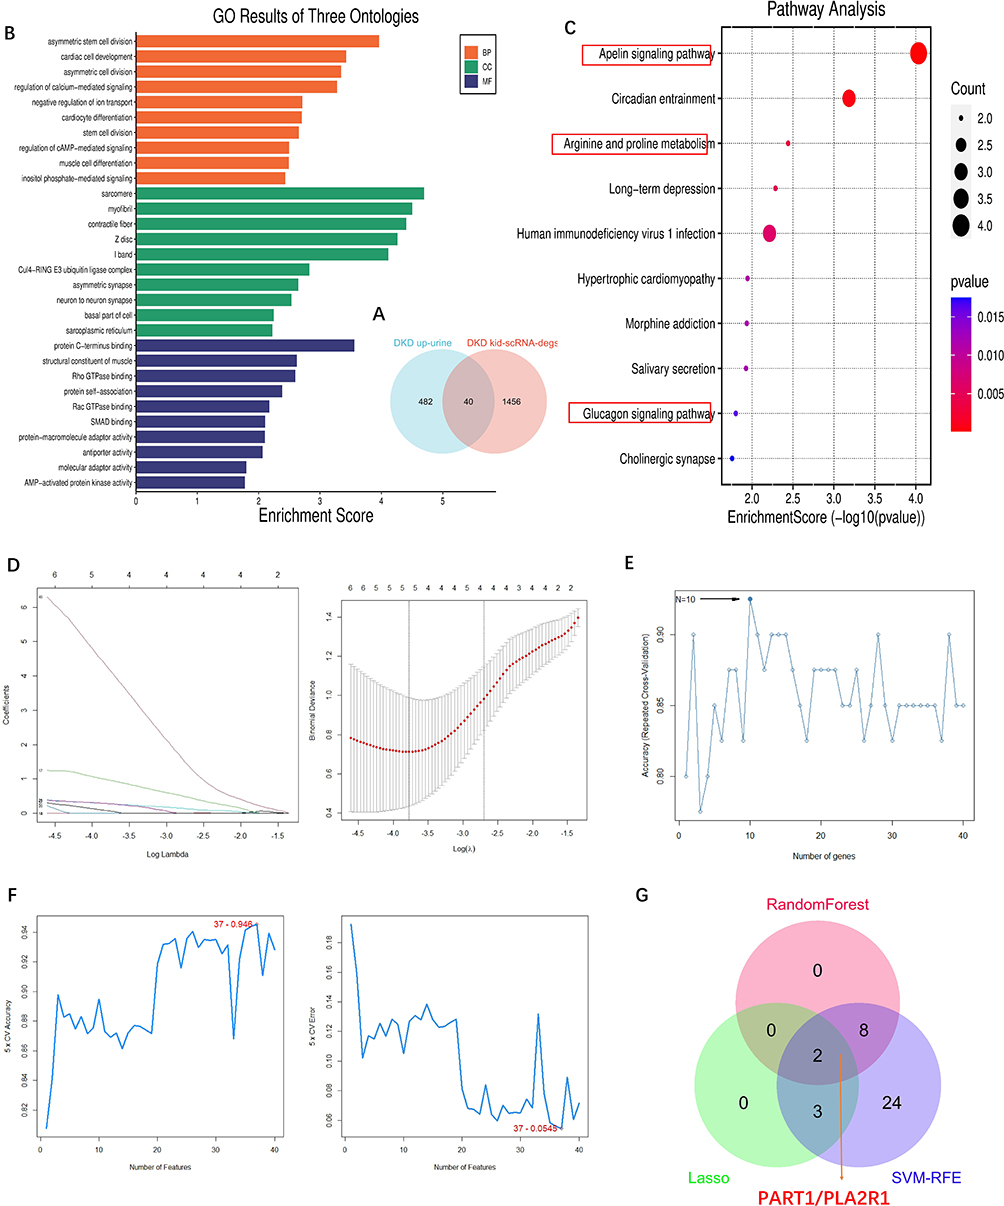 |
Figure 3 Screening and analysis of upregulated urine-DEGs and obtained key DKD urine biomarkers. (A) Venn diagram of 40 upregulated urine-DEGs. Obtained based on the intersection all DKD kid-scRNA-degs and DKD up-urine DEGs. (B) GO enrichment analysis of EP-Genes in BP, CC, and MF processes (BP, biological process; CC, cellular component; MF, molecular function). (C) KEGG enrichment analysis of 40 upregulated urine-DEGs. In the dot plot, the color represents the p-value, and the size of the spots represents the gene number.The red boxes indicated pathways associated with the development of DKD. (D–F) DKD urine key genes selection by (D) Lasso, (E) RandomForest and (F) SVM-RFE. (G) Venn diagram shows 2 urine key genes such as PART1 and PLA2R1 were obtained by the intersection of 3 machine-learning (Lasso, RandomForest and SVM-RFE). |
Acquisition of Hub Urinary Biomarkers of DKD
To identify potential urinary biomarkers of DKD, we employed three algorithms, namely LASSO, RF, and SVM-RFE (Supplementary Table S6). The LASSO regression algorithm identified 5 potential candidate biomarkers (Figure 3D), while the RF algorithm identified 10 potential candidates (Figure 3E). Based on the SVM-RFE algorithm, 37 potential candidate biomarkers were identified (Figure 3F). By overlaying the candidate biomarkers from LASSO, RF, and SVM-RFE, PART1 and PLA2R1 were identified as the hub urinary biomarkers of DKD (Figure 3G).
Correlation Analysis of the Hub Urinary Biomarkers of DKD with the Clinical Features in Urine
We investigated the relationship between PART1 and PLA2R1 with clinical features (Figure 4A). The results indicated that PART1 expression in urine was significantly negatively correlated with estimated glomerular filtration rate (eGFR) and hemoglobin (Hb) and positively correlated with serum creatinine (Scr) and urine acid. The expression level of PART1 in urine was correlated with several clinical indicators. The clinical correlation analysis of PLA2R1 was consistent with PART1. A ROC analysis demonstrated that PART1 and PLA2R1 had the same AUC values (area under the curve [AUC]=0.864) (Figure 4B). These results suggested that PLA2R1 and PART1 had a stronger correlation with clinical indicators of DKD. However, PLA2R1 is widely recognized as a diagnostic and prognostic biomarker of MN. We chose PART1, which is less studied and as a final hub urinary biomarker of DKD, to further analysis. Urinary PART1 was highly expressed in the DKD group (Figure 4C). Furthermore, we analyzed the stability of urinary PART1 expression at different times (Figure 4D), showing that urinary PART1 expression levels had no significant difference among morning urinary cells (MUC), the second morning urinary cells (SUC), and random urinary cells (RUC). Interestingly, urinary PART1 expression was significantly upregulated in SUC and RUC in DKD group.
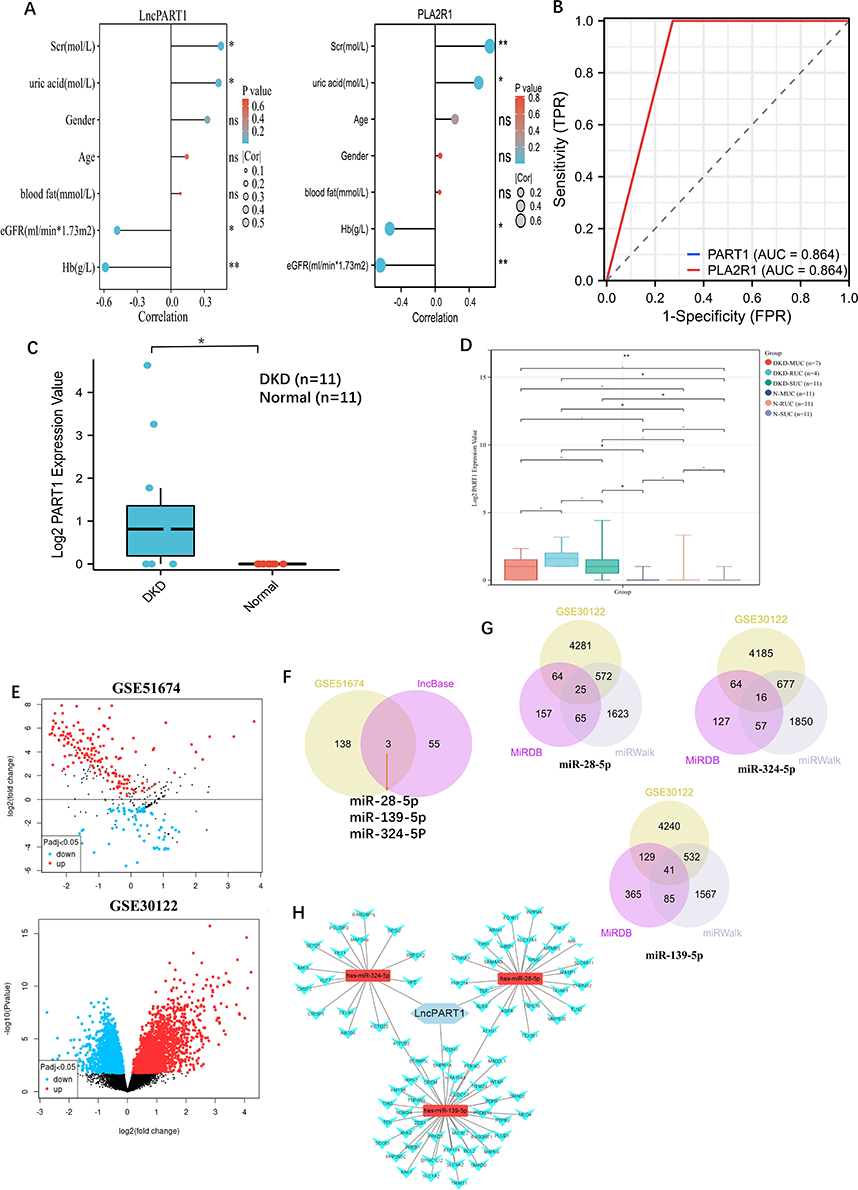 |
Figure 4 Urinary PART1/PLA2R1 analysis in urine from DKD and set up ceRNA network. (A) Correlation analysis of urinary PART1and PLA2R1 expression with the clinicopathological features, including estimated glomerular filtration rate (eGFR), age, serum creatinine (Scr), hemoglobin (Hb), bloom fat and gender. (B) The diagnostic value of Urinary PART1 and PLA2R1 in the urine of DKD. (C) The expression level of PART1 between DKD and normal in urine. (D) Analysis of PART1 expression at different time periods including the first morning urinary cells (MUC), second morning urinary cells (SUC) and random urinary cells (RUC).(E) Volcano plot of DEMs between 6 DKD patients and 4 control from GSE51674, and DEGs between 10 DKD patients and 12 control from GSE30122 (volcano plot from GEO2R online tool at NCBI GEO Omnibus). (F) Three miRNA were obtained by intersecting upregulate difference miRMA (DEMs) from GSE51674 and targeted miRNAs based lncBase.(G) 80 overlapped mRNA DEGs (mDEGs) were obtained by intersecting downregulate difference mRMA (down-DEGs) from GSE30122 and targeted mRNAs based miRWalk and miRDB. (H) Triple regulatory network of the 80 overlapped DEGs, 3 overlapped DEMs, and lncPART1. (*P < 0.05, **P < 0.01 and ns: no significant difference). |
Prediction and Identification of miRNAs and mRNAs Between DKD Tissues and Normal Tissues
Based on p-value < 0.05 and |log2FC| > 1, we identified 702 differentially expressed miRNAs (DEMs) from the GSE51674 dataset, including 141 upregulated and 561 downregulated genes. Additionally, based on p-value < 0.05, more differentially expressed genes (DEGs) were obtained. And downregulated differentially expressed genes (DEGs) were screened from the GSE30122 dataset (Figure 4E). It was more helpful for downstream exploration and analysis. We identified 3 miRNAs that interact with PART1 using LncBase, which intersected with the 141 upregulated DEMs from GSE30122 (Figure 4F). Similarly, we identified 80 potential mRNAs that interact with the 3 miRNAs by intersecting with the downregulated DEGs from GSE30122 (Figure 4G).
Construction of the ceRNA Network and Functional Enrichment of Overlapped mRNAs
Utilizing the expression regulation of PART1, the 3 miRNAs, and the 80 overlapped mRNAs shown in Table 2, we constructed a network (Figure 4H). To understand the regulatory relationships and biological functions of the 80 mRNAs related to DKD, we constructed a PPI network (Figure 5A) and performed GO and KEGG pathway enrichment analyses (Figure 5B and C). Notably, KEGG pathway analysis revealed that the 80 mRNAs were mainly enriched in pathways such as the AGE-RAGE signaling pathway in diabetic complications, autophagy, apoptosis, and the TGF-β signaling pathway. These findings further suggest that renal cell damage may be associated with autophagy/apoptosis, and injured kidney cells may be shed into urine as DKD progresses.
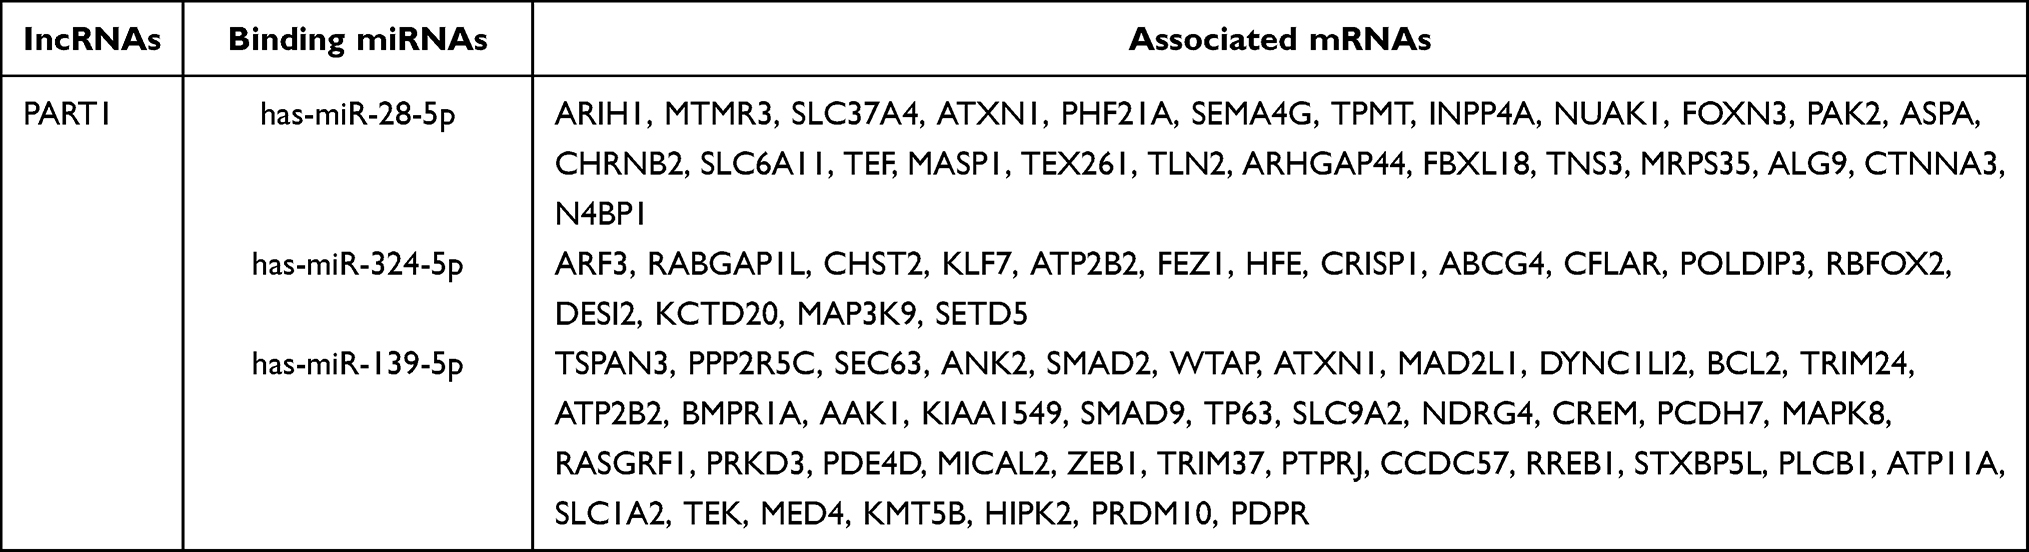 |
Table 2 lncRNAs, miRNAs and mRNAs in the ceRNA Network |
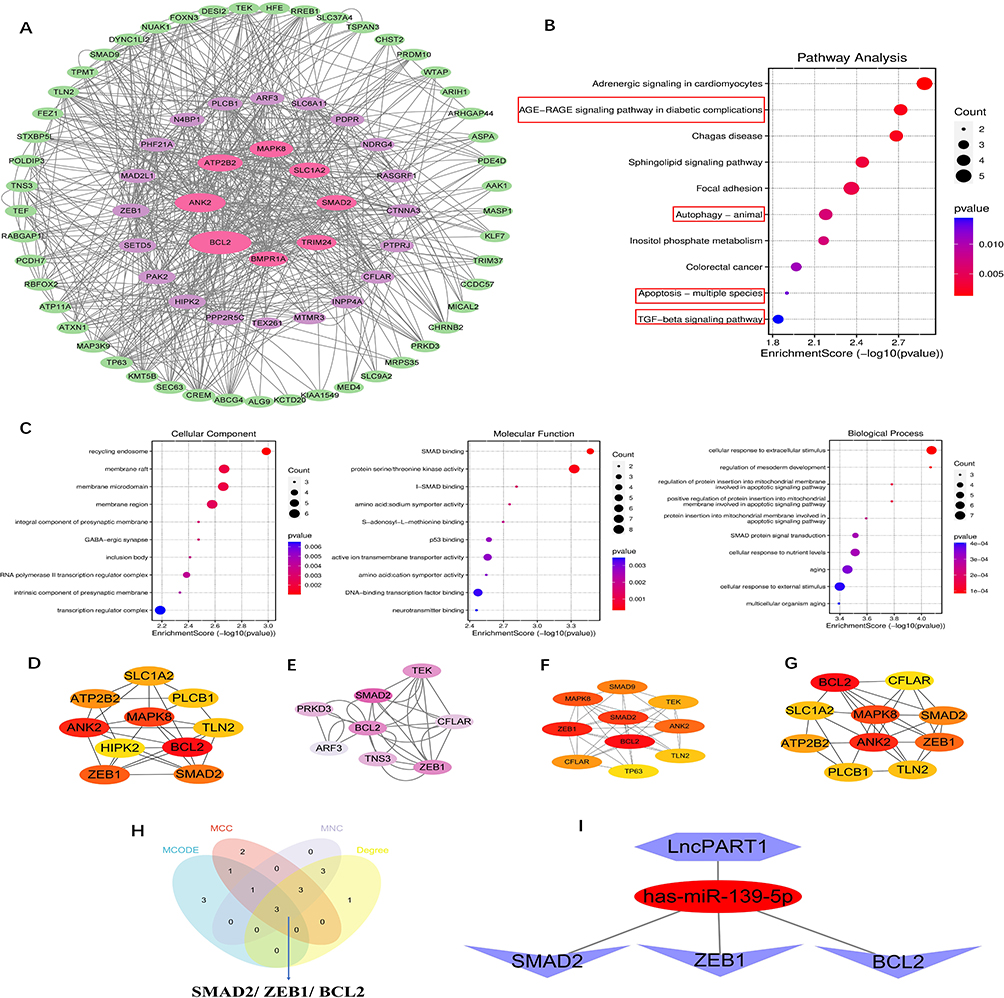 |
Figure 5 Analysis of overlapped mDEGs and screening of key mRNA. (A) Construction of the PPI network of 80 overlapped DEGs by STRING database. (B) KEGG enrichment analysis of 80 overlapped mDEGs. The red boxes indicated pathways associated with the development of DKD. (C) GO enrichment analysis of overlapped mDEGs in BP, CC, and MF processes (BP, biological process; CC, cellular component; MF, molecular function). In the dot plot, the color represents the p-value, and the size of the spots represents the gene number. (D) Top 10 genes were selected according to the score calculated by the Degree method. (E) Total of 8 candidate genes were identified from 80 overlapped mDEGs basing on the score sorted by the MCODE method using Cytoscape. (F) Top 10 genes were obtained by calculating the scores according to the MCC method. (G) Top 10 genes were obtained by calculating the scores according to the MNC method. (H) Venn diagram shows 3 mRNA were obtained by the intersection of the methods (MCC, Degree, MNC and MCODE). (I) The important components of ceRNA network were identified by expression regulation. |
Construction of LnPART1 - miRNA-139-5p - BCL2
Using four methods in Cytoscape (Figure 5D–G), namely Dgreen, MCODE, MCC, and MNC, we screened BCL2, SMAD2, and ZEB1 as candidate mRNAs from the 80 overlapped mRNAs (Figure 5H). According to the regulatory mechanism of the ceRNA network (Figure 5I), we further explored the expression levels of BCL2, SMAD2, and ZEB1 between the DKD group and the Normal group from GSE131882. The results showed that only BCL2 expression level, which was consistent with PART1, was significantly different and lowly expressed in the distal tubule cells cluster of the DKD group (Figure 6A and B). BCL2 was identified as a key mRNA, and we constructed the PART1-miRNA-139-5p-BCL2 network. Additionally, we found that BCL2 and PART1 were primarily derived from distal cells by analyzing kidney snRNA-seq data (Figure 6C–E). To pinpoint the source of urinary PART1 in DKD, we analyzed urine scRNA-seq data and found that urinary PART1 was mainly derived from epithelial cells and renal cells (Figure 6F and G).
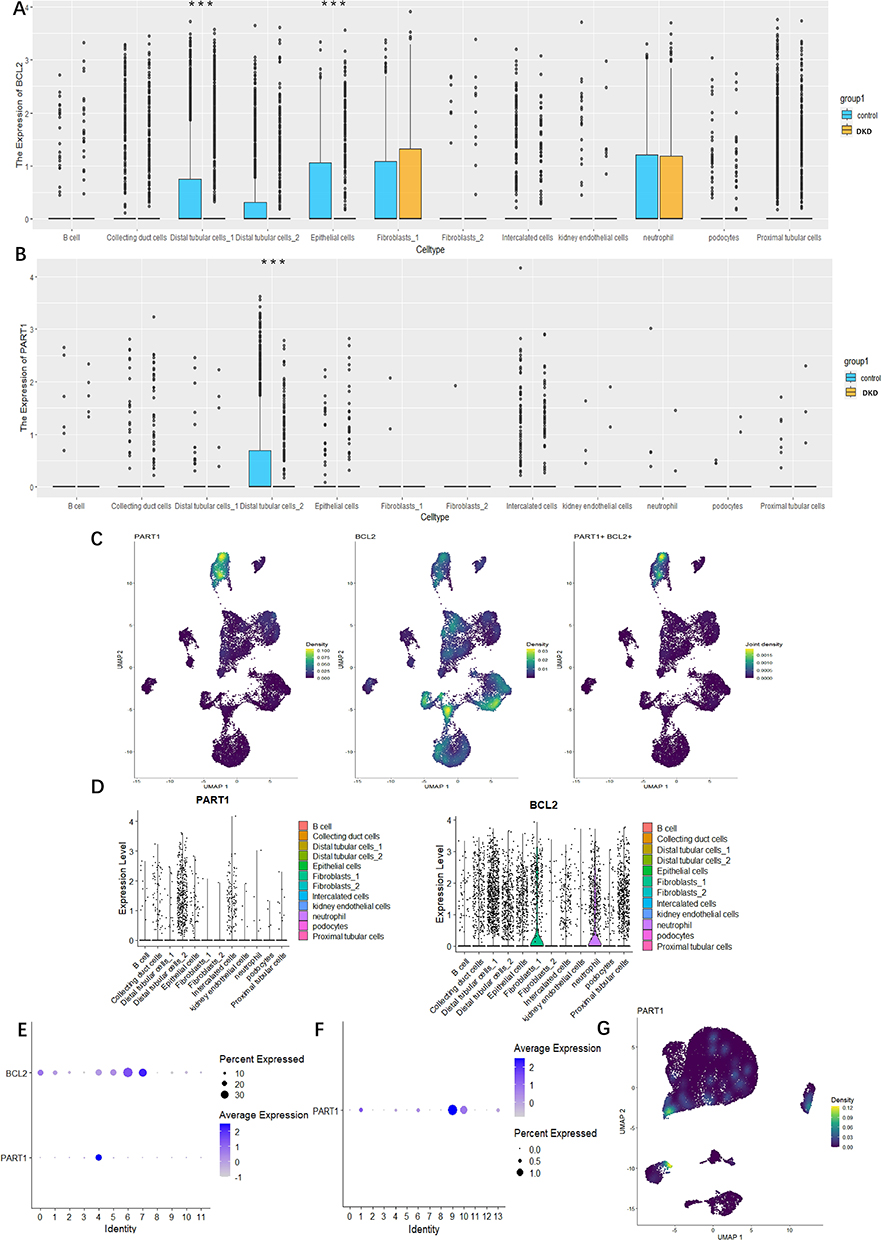 |
Figure 6 PART1 of analyzing and locating based on scRNA-seq datasets from GSE131882 and GSE157640, respectively. (A) Box plots showing the the expression of BCL2 between DKD group and Normal group from GSE131882. (B) Box plots showing the the expression of BCL2 between DKD group and normal group from GSE131882. (C) UMAP plots showing the the expression of PART1, BCL2 and PART1+ and BCL2+ between 3 kidney tissues of DKD and 3 normal kidney tissues of DKD from GSE131882. (D) The violin plots showing the distribution and expression of PART1 and BCL2 in each cell type from GSE131882. (E and F) Bubble dot plots showing PART1 expressing in (E) kidney snRNA-seq of DKD from GSE131882 and (F) urine scRNA-seq of DKD from GSE157640, respectively. The size of the dot indicates the expression percentage and the darkness of the color indicates average expression. (G) Visualization of PART1 expression across all single cells in the UMPA plot of urne scRNA-seq from GSE157640. (***P < 0.001). |
Validation of Key ceRNA Network Between DKD Kidney Tissues and Normal Kidney Tissues
The expression levels of PART1, miRNA-139-5p, and BCL2 from the triple regulatory network are shown in Figures 7A–C. Furthermore, we found that the expression levels of PART1 and BCL2 were positively correlated with eGFR in kidney tissue from DKD (Figure 7D and E). These results demonstrate that the low expression of PART1 and BCL2 predicts the degree of renal tubular damage and the progression of DKD. Finally, to gain insight into the relationship between PART1 and renal tubular cells, we explored the expression levels of PART1 in comparison to other tissues using the Nephroseq database. The results showed that, compared to other tissues, PART1 was significantly down-regulated in the renal pelvis and renal medulla (Figure 7F and G).
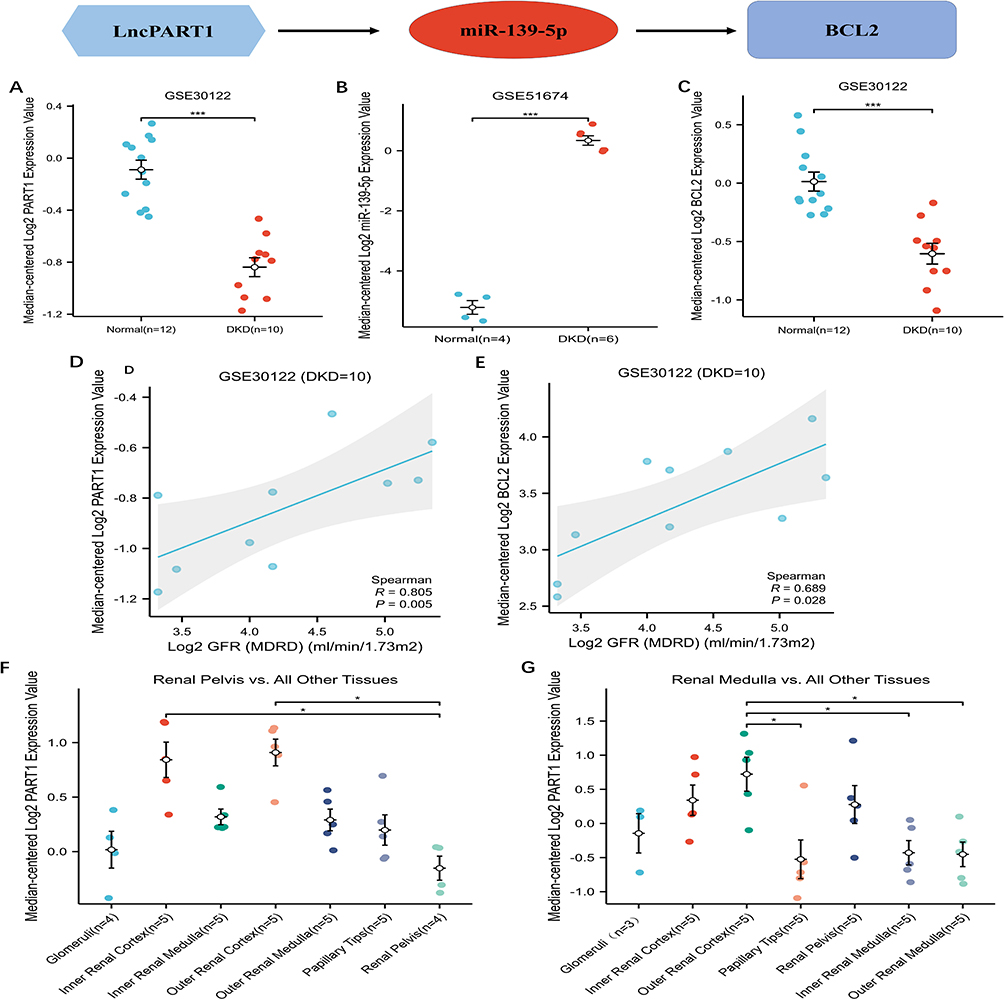 |
Figure 7 Analysis and verify of the key genes of ceRNA network. (A–C) The expression levels of (A) PART1 from GES30122, (B) has-miR139-5p from GSE51674 and (C) BCL2 from GSE30122. (D and E) The diagnostic value of (D) PART1 and (E) BCL2 according to AUC value in ROC curve based on GSE30122. (F) The expression of PART1 between renal pelvis and all other renal tissue based on nephroseq V5. (G) The expression of PART1 between renal medulla and all other renal tissue based on nephroseq V5. (*P < 0.05 and ***P < 0.001). |
Discussion
Our findings suggest that urinary PART1, located in tubule cells, strongly correlates with DKD progression, making it an effective indicator of disease advancement and a potential biomarker for diabetic-induced renal tubular injury.
One novel aspect of our study is our focus on the second morning urinary cells, as previous studies primarily collected morning urinary cells alone. We collected second morning urinary cells samples for bulk RNA-seq and subsequent analysis. Integrating the sequencing results with kidney single-nucleus RNA sequencing (snRNA-seq) allowed us to identify urinary PART1 and PLA2R1 as urine-kidney-specific biomarkers. Applying the competing endogenous RNA (ceRNA) regulatory mode, we constructed a potential PART1-miR-139-5p-BCL2 regulatory network using various approaches.
Prostate Androgen-Regulated Transcript 1 (PART1), a less-studied gene in kidney disease, plays a dual role in cancer, regulating cell proliferation and apoptosis through various mechanisms.48 On the one hand, PART1 is highly expressed in pancreatic cancer, pancreatic cancer49 and other tumors,50 promoting tumor development; On the other hand, PART1 is down-regulated in tumors such as tongue squamous cell carcinoma51 and gastric cancer,51 and has a protective effect. However, PART1 has been poorly studied in kidney disease. Whether it be associated with the progression of kidney disease. Whether it can be used as a biomarker for kidney disease. PART1 is worth further exploration and discovery. Therefore, in our study, we found a strong correlation between clinical indicators of DKD and urinary PART1, which further suggests the reliability of urinary PART1 as an auxiliary indicator of DKD. Another, bioinformatics analysis revealed that mRNAs targeting PART1 are associated with apoptosis. Previous studies have demonstrated that downregulation of PART1 can promote apoptosis in prostate and bladder cancer cells.9,50 Conversely, BCL2 is an anti-apoptotic protein,52 and research has shown that high glucose-induced apoptosis in renal tubular cells can be facilitated by miR-503, leading to the inhibition of BCL2.53 Our results elucidate a potential mechanism for the PART1-miR-139-5p-BCL2 axis in DKD, providing a possible molecular basis for kidney injury and suggesting a regulatory axis that leads to tubular cell apoptosis in DKD. Furthermore, PART1 was found to be decreased in kidney tissues and elevated in urine in DKD, likely due to an increased proportion of urinary kidney cells in patients with renal diseases compared to healthy individuals.29 Therefore, PART1 downregulation likely occurs as the disease progresses, while upregulated miR-139-5p may promote apoptosis of renal tubular cells by inhibiting BCL2, leading to their shedding into the urine. Eventually, PART1 expression levels may be elevated in the urine of DKD.
In DKD, tubular dysregulation may precede or occur concurrently with glomerular changes.54 Hyperglycemia is more likely to damage tubular cells, particularly affecting mitochondrial function.55 Our analysis of single-cell sequencing indicates that PART1 is primarily derived from renal tubular cells. We hypothesize that elevated urinary PART1 in DKD patients may signify the activation of apoptotic mechanisms in renal tubular cells, suggesting a significant role for urinary PART1 in detecting renal injury caused by diabetes. Furthermore, our findings show that PART1 is lowest in the renal medulla compared to other tissues. Diabetes is known to predispose individuals to acute renal failure,56,57 and renal medullary hypoxia characterizes acute renal failure.58 Hyperglycemia may affect renal medullary structure by activating NOS3.45 These results suggest a potential association between PART1, hyperglycemia, and the pathogenesis of DKD, although further research is needed to elucidate the precise underlying mechanism.
Our study innovatively collected a total of 56 urine samples at different time points, demonstrating that urinary PART1 expression remains stable over time. This flexibility in urine sample collection without temporal constraints is beneficial for medical professionals and patients seeking disease detection and monitoring.
Additionally, the elevated urinary PLA2R1 in DKD has piqued our interest. Phospholipase A2 receptor (PLA2R1) antibody is highly specific for membranous nephropathy (MN) and has been widely used for MN diagnosis.59 However, recent studies have cautioned against relying solely on positive PLA2R1 testing for DKD diagnosis, as it may lead to false-positive MN diagnoses in diabetic patients.60 Our study indicates high PLA2R1 expression in the urine of DKD patients. Therefore, caution is advised when interpreting positive PLA2R1 results in diabetic patients to avoid incorrect treatment plans.
Our study has certain limitations, as it employed a cross-sectional design, limiting its ability to assess the prognostic value of urinary PART1. Future research should consider a comprehensive prospective cohort study with extended follow-up periods. Furthermore, we need to confirm whether the PART1-miRNA-139-5p-BCL2 ceRNA network indeed regulates apoptosis and how it leads to tubular cell apoptosis and shedding into the urine.
In conclusion, we have identified urinary PART1 as a potential diagnostic, monitoring biomarker, and therapeutic target for the early detection of DKD. The PART1-miRNA-139-5p-BCL2 network offers a more comprehensive understanding of the complex gene interactions underlying DKD and its molecular mechanisms driving disease progression. In the future, we aim to further validate the use of urinary PART1 as a liquid biopsy tool and a treatment target for DKD.
Conclusion
Urinary PART1, primarily derived from distal tubular cells, can serve as non-invasive markers without temporal constraints. It is mainly associated with the regulation of apoptosis in tubule cells through lncPART1-miR-139-5p-BCL2. The interpretation of positive PLA2R1 results in diabetic patients should be approached with caution to ensure accurate treatment regimens.
Data Sharing Statement
The data that support the findings of this study are openly available in NCBI’s Gene Expression Omnibus. The original contributions presented in this study are included in the article/Supplementary Material, further inquiries can be directed to the corresponding authors.
Acknowledgments
This work was supported by the National Natural Science Foundation of China (NO.82260575), and Guangxi Medical and Health Appropriate Technology Development and Promotion Application Project (No. S2020018).
Disclosure
The authors report no conflicts of interest in this work.
References
1. Zhai Y, Cao X, Liu S, Shen Y. The diagnostic value of lipoprotein-associated phospholipase A2 in early diabetic nephropathy. Ann Med. 2023;55(2):2230446. doi:10.1080/07853890.2023.2230446
2. ElSayed NA, Aleppo G, Aroda VR, et al. 2. classification and diagnosis of diabetes: standards of care in diabetes-2023. Diabetes Care. 2023;46(Suppl 1):S19–S40. doi:10.2337/dc23-S002
3. Krolewski AS. Progressive renal decline: the new paradigm of diabetic nephropathy in type 1 diabetes. Diabetes Care. 2015;38(6):954–962. doi:10.2337/dc15-0184
4. Rigalleau V, Lasseur C, Raffaitin C, et al. Normoalbuminuric renal-insufficient diabetic patients: a lower-risk group. Diabetes Care. 2007;30(8):2034–2039. doi:10.2337/dc07-0140
5. Colhoun HM, Marcovecchio ML. Biomarkers of diabetic kidney disease. Diabetologia. 2018;61(5):996–1011. doi:10.1007/s00125-018-4567-5
6. Wang Y, Zhao Y, Zhao Z, et al. Single-cell RNA-Seq analysis identified kidney progenitor cells from human urine. Protein Cell Apr. 2021;12(4):305–312. doi:10.1007/s13238-020-00816-5
7. Li M, Zhao M, Gao Y. Changes of proteins induced by anticoagulants can be more sensitively detected in urine than in plasma. Sci China Life Sci. 2014;57(7):649–656. doi:10.1007/s11427-014-4661-y
8. Gao Y. Urine-an untapped goldmine for biomarker discovery? Sci China Life Sci. 2013;56(12):1145–1146. doi:10.1007/s11427-013-4574-1
9. Hu X, Feng H, Huang H, et al. Downregulated long noncoding RNA PART1 inhibits proliferation and promotes apoptosis in bladder cancer. Technol Cancer Res Treat. 2019;18:1533033819846638. doi:10.1177/1533033819846638
10. Gao D, Hao L, Zhao Z. Long non-coding RNA PART1 promotes intervertebral disc degeneration through regulating the miR‑93/MMP2 pathway in nucleus pulposus cells. Int J Mol Med. 2020;46(1):289–299. doi:10.3892/ijmm.2020.4580
11. Lu C, Li Z, Hu S, Cai Y, Peng K. LncRNA PART-1 targets TGFBR2/Smad3 to regulate cell viability and apoptosis of chondrocytes via acting as miR-590-3p sponge in osteoarthritis. J Cell Mol Med. 2019;23(12):8196–8205. doi:10.1111/jcmm.14690
12. Augert A, Payré C, de Launoit Y, Gil J, Lambeau G, Bernard D. The M-type receptor PLA2R regulates senescence through the p53 pathway. EMBO Rep. 2009;10(3):271–277. doi:10.1038/embor.2008.255
13. Griveau A, Wiel C, Le Calvé B, et al. Targeting the phospholipase A2 receptor ameliorates premature aging phenotypes. Aging Cell. 2018;17(6):e12835. doi:10.1111/acel.12835
14. Loffredo S, Borriello F, Iannone R, et al. Group V secreted phospholipase A(2) induces the release of proangiogenic and antiangiogenic factors by human neutrophils. Front Immunol. 2017;8:443. doi:10.3389/fimmu.2017.00443
15. Kocak MZ, Aktas G, Erkus E, Duman TT, Atak BM, Savli H. Mean platelet volume to lymphocyte ratio as a novel marker for diabetic nephropathy. J Coll Physicians Surg Pak. 2018;28(11):844–847. doi:10.29271/jcpsp.2018.11.844
16. Kin Tekce B, Tekce H, Aktas G, Sit M. Evaluation of the urinary kidney injury molecule-1 levels in patients with diabetic nephropathy. Clin Invest Med. 2014;37(6):E377–E383. doi:10.25011/cim.v37i6.22242
17. Tekce H, Tekce BK, Aktas G, Alcelik A, Sengul E. Serum omentin-1 levels in diabetic and nondiabetic patients with chronic kidney disease. Exp Clin Endocrinol Diabetes. 2014;122(8):451–456. doi:10.1055/s-0034-1375674
18. Aktas G. Association between the prognostic nutritional index and chronic microvascular complications in patients with type 2 diabetes mellitus. J Clin Med. 2023;12:18.
19. Kocak MZ, Aktas G, Atak BM, et al. Is Neuregulin-4 a predictive marker of microvascular complications in type 2 diabetes mellitus? Eur J Clin Invest. 2020;50(3):e13206. doi:10.1111/eci.13206
20. Bilgin S, Kurtkulagi O, Atak Tel BM, et al. Does C-reactive protein to serum albumin ratio correlate with diabEtic nephropathy in patients with Type 2 dIabetes MEllitus? The CARE TIME study. Prim Care Diabetes. 2021;15(6):1071–1074. doi:10.1016/j.pcd.2021.08.015
21. Kocak MZ, Aktas G, Duman TT, Atak BM, Savli H. Is uric acid elevation a random finding or a causative agent of diabetic nephropathy? Rev Assoc Med Bras. 2019;65(9):1155–1160. doi:10.1590/1806-9282.65.9.1156
22. Kocak MZ, Aktas G, Duman TT, et al. Monocyte lymphocyte ratio as a predictor of diabetic kidney injury in type 2 diabetes mellitus; the MADKID study. J Diabetes Metab Disord. 2020;19(2):997–1002. doi:10.1007/s40200-020-00595-0
23. Aktas G, Yilmaz S, Kantarci DB, et al. Is serum uric acid-to-HDL cholesterol ratio elevation associated with diabetic kidney injury? Postgrad Med. 2023;135(5):519–523. doi:10.1080/00325481.2023.2214058
24. Zhou LT, Lv LL, Qiu S, et al. Bioinformatics-based discovery of the urinary BBOX1 mRNA as a potential biomarker of diabetic kidney disease. J Transl Med. 2019;17(1):59. doi:10.1186/s12967-019-1818-2
25. Hwang B, Lee JH, Bang D. Single-cell RNA sequencing technologies and bioinformatics pipelines. Exp Mol Med. 2018;50(8):1–14. doi:10.1038/s12276-018-0071-8
26. Schreibing F, Kramann R. Mapping the human kidney using single-cell genomics. Nat Rev Nephrol. 2022;18(6):347–360. doi:10.1038/s41581-022-00553-4
27. Sun YH, Chen K, Chen X, et al. Expert consensus on the management of diabetic patients with cardiovascular diseases. Zhonghua Nei Ke Za Zhi. 2021;60(5):421–437. doi:10.3760/cma.j.cn112138-20201208-00999
28. Wilson PC, Wu H, Kirita Y, et al. The single-cell transcriptomic landscape of early human diabetic nephropathy. Proc Natl Acad Sci U S A. 2019;116(39):19619–19625. doi:10.1073/pnas.1908706116
29. Abedini A, Zhu YO, Chatterjee S, et al. Urinary single-cell profiling captures the cellular diversity of the kidney. J Am Soc Nephrol. 2021;32(3):614–627. doi:10.1681/asn.2020050757
30. Barrett T, Wilhite SE, Ledoux P, et al. NCBI GEO: archive for functional genomics data sets--update. Nucleic Acids Res. 2013;41:D991–D995. doi:10.1093/nar/gks1193
31. Yip SH, Sham PC, Wang J. Evaluation of tools for highly variable gene discovery from single-cell RNA-seq data. Brief Bioinform. 2019;20(4):1583–1589. doi:10.1093/bib/bby011
32. Tan Z, Chen X, Zuo J, Fu S, Wang H, Wang J. Comprehensive analysis of scRNA-Seq and bulk RNA-Seq reveals dynamic changes in the tumor immune microenvironment of bladder cancer and establishes a prognostic model. J Transl Med. 2023;21(1):223. doi:10.1186/s12967-023-04056-z
33. Conserva F, Barozzino M, Pesce F, et al. Urinary miRNA-27b-3p and miRNA-1228-3p correlate with the progression of kidney fibrosis in diabetic nephropathy. Sci Rep. 2019;9(1):11357. doi:10.1038/s41598-019-47778-1
34. Woroniecka KI, Park AS, Mohtat D, Thomas DB, Pullman JM, Susztak K. Transcriptome analysis of human diabetic kidney disease. Diabetes. 2011;60(9):2354–2369. doi:10.2337/db10-1181
35. Friedman J, Hastie T, Tibshirani R. Regularization paths for generalized linear models via coordinate descent. J Stat Softw. 2010;33(1):1–22.
36. Yang C, Delcher C, Shenkman E, Ranka S. Machine learning approaches for predicting high cost high need patient expenditures in health care. Biomed Eng Online. 2018;17(Suppl 1):131. doi:10.1186/s12938-018-0568-3
37. Ellis K, Godbole S, Marshall S, Lanckriet G, Staudenmayer J, Kerr J. Identifying active travel behaviors in challenging environments using GPS, accelerometers, and machine learning algorithms. Front Public Health. 2014;2:36. doi:10.3389/fpubh.2014.00036
38. Sanz H, Valim C, Vegas E, Oller JM, Reverter F. SVM-RFE: selection and visualization of the most relevant features through non-linear kernels. BMC Bioinf. 2018;19(1):432. doi:10.1186/s12859-018-2451-4
39. Cheng Q, Chen X, Wu H, Du Y. Three hematologic/immune system-specific expressed genes are considered as the potential biomarkers for the diagnosis of early rheumatoid arthritis through bioinformatics analysis. J Transl Med. 2021;19(1):18. doi:10.1186/s12967-020-02689-y
40. van de Logt AE, Fresquet M, Wetzels JF, Brenchley P. The anti-PLA2R antibody in membranous nephropathy: what we know and what remains a decade after its discovery. Kidney Int. 2019;96(6):1292–1302. doi:10.1016/j.kint.2019.07.014
41. Shannon P, Markiel A, Ozier O, et al. Cytoscape: a software environment for integrated models of biomolecular interaction networks. Genome Res. 2003;13(11):2498–2504. doi:10.1101/gr.1239303
42. Yu G, Wang LG, Han Y, He QY. clusterProfiler: an R package for comparing biological themes among gene clusters. Omics. 2012;16(5):284–287. doi:10.1089/omi.2011.0118
43. Girault-Sotias PE, Gerbier R, Flahault A, de Mota N, Llorens-Cortes C. Apelin and vasopressin: the yin and yang of water balance. Front Endocrinol. 2021;12:735515. doi:10.3389/fendo.2021.735515
44. Blachier F, Davila AM, Benamouzig R, Tome D. Channelling of arginine in NO and polyamine pathways in colonocytes and consequences. Front Biosci. 2011;16(4):1331–1343. doi:10.2741/3792
45. Lee DL, Sasser JM, Hobbs JL, et al. Posttranslational regulation of NO synthase activity in the renal medulla of diabetic rats. Am J Physiol Renal Physiol. 2005;288(1):F82–F90. doi:10.1152/ajprenal.00127.2004
46. Perry RJ, Zhang D, Guerra MT, et al. Glucagon stimulates gluconeogenesis by INSP3R1-mediated hepatic lipolysis. Nature. 2020;579:7798):279–283. doi:10.1038/s41586-020-2074-6
47. Yang J, Liu Z. Mechanistic pathogenesis of endothelial dysfunction in diabetic nephropathy and retinopathy. Front Endocrinol. 2022;13:816400. doi:10.3389/fendo.2022.816400
48. Ran R, Gong CY, Wang ZQ, et al. Long non‑coding RNA PART1: dual role in cancer. Hum Cell. 2022;35(5):1364–1374. doi:10.1007/s13577-022-00752-y
49. Hu X, Zhang L, Tian J, Ma J. Long non-coding RNA PART1 predicts a poor prognosis and promotes the malignant progression of pancreatic cancer by sponging miR-122. World J Surg Oncol. 2021;19(1):122. doi:10.1186/s12957-021-02232-3
50. Sun M, Geng D, Li S, Chen Z, Zhao W. LncRNA PART1 modulates toll-like receptor pathways to influence cell proliferation and apoptosis in prostate cancer cells. Biol Chem. 2018;399(4):387–395. doi:10.1515/hsz-2017-0255
51. Zhang S, Cao R, Li Q, Yao M, Chen Y, Zhou H. Comprehensive analysis of lncRNA-associated competing endogenous RNA network in tongue squamous cell carcinoma. PeerJ. 2019;7:e6397. doi:10.7717/peerj.6397
52. Yip KW, Reed JC. Bcl-2 family proteins and cancer. Oncogene. 2008;27(50):6398–6406. doi:10.1038/onc.2008.307
53. Li Q, Liang X, Wang Y, et al. miR-139-5p inhibits the epithelial-mesenchymal transition and enhances the chemotherapeutic sensitivity of colorectal cancer cells by downregulating BCL2. Sci Rep. 2016;6:27157. doi:10.1038/srep27157
54. Ahmad AA, Draves SO, Rosca M. Mitochondria in diabetic kidney disease. Cells. 2021;10:11.
55. Czajka A, Malik AN. Hyperglycemia induced damage to mitochondrial respiration in renal mesangial and tubular cells: implications for diabetic nephropathy. Redox Biol. 2016;10:100–107. doi:10.1016/j.redox.2016.09.007
56. Leblanc M, Kellum JA, Gibney RT, Lieberthal W, Tumlin J, Mehta R. Risk factors for acute renal failure: inherent and modifiable risks. Curr Opin Crit Care. 2005;11(6):533–536. doi:10.1097/01.ccx.0000183666.54717.3d
57. James MT, Grams ME, Woodward M, et al. A meta-analysis of the association of estimated GFR, albuminuria, diabetes mellitus, and hypertension with acute kidney injury. Am J Kidney Dis. 2015;66(4):602–612. doi:10.1053/j.ajkd.2015.02.338
58. Brezis M, Rosen S. Hypoxia of the renal medulla--its implications for disease. N Engl J Med. 1995;332(10):647–655. doi:10.1056/nejm199503093321006
59. Beck LH, Bonegio RG, Lambeau G, et al. M-type phospholipase A2 receptor as target antigen in idiopathic membranous nephropathy. N Engl J Med. 2009;361(1):11–21. doi:10.1056/NEJMoa0810457
60. Zhang H, Zhu Y, Hu Z, Liu Q. Serum anti-phospholipase A2 receptor antibody in pathological diagnosis of type 2 diabetes mellitus patients with proteinuria. Sci Rep. 2023;13(1):16608. doi:10.1038/s41598-023-43766-8
 © 2023 The Author(s). This work is published and licensed by Dove Medical Press Limited. The
full terms of this license are available at https://www.dovepress.com/terms
and incorporate the Creative Commons Attribution
- Non Commercial (unported, 3.0) License.
By accessing the work you hereby accept the Terms. Non-commercial uses of the work are permitted
without any further permission from Dove Medical Press Limited, provided the work is properly
attributed. For permission for commercial use of this work, please see paragraphs 4.2 and 5 of our Terms.
© 2023 The Author(s). This work is published and licensed by Dove Medical Press Limited. The
full terms of this license are available at https://www.dovepress.com/terms
and incorporate the Creative Commons Attribution
- Non Commercial (unported, 3.0) License.
By accessing the work you hereby accept the Terms. Non-commercial uses of the work are permitted
without any further permission from Dove Medical Press Limited, provided the work is properly
attributed. For permission for commercial use of this work, please see paragraphs 4.2 and 5 of our Terms.