Back to Journals » Journal of Inflammation Research » Volume 16
Time-Series Expression Profile Analysis of Post-Traumatic Joint Contracture in Rats at the Early Stages of the Healing Process
Authors Zhang Y ![]() , Wu Z, Lu S, Lin M, Yue X, Wang Z, Cai B
, Wu Z, Lu S, Lin M, Yue X, Wang Z, Cai B
Received 7 December 2022
Accepted for publication 9 March 2023
Published 15 March 2023 Volume 2023:16 Pages 1169—1181
DOI https://doi.org/10.2147/JIR.S400557
Checked for plagiarism Yes
Review by Single anonymous peer review
Peer reviewer comments 2
Editor who approved publication: Dr Adam Bachstetter
Yuxin Zhang,1– 3,* Zhigang Wu,1,* Shenji Lu,2 Minghui Lin,1 Xiaokun Yue,4 Zengguang Wang,4 Bin Cai1,2
1Department of Rehabilitation Medicine, Hainan Western Central Hospital, Danzhou, Hainan, People’s Republic of China; 2Department of Rehabilitation Medicine, Shanghai Ninth People’s Hospital, Shanghai Jiao Tong University School of Medicine, Shanghai, People’s Republic of China; 3Department of Oral Surgery, Shanghai Ninth People’s Hospital, Shanghai Jiao Tong University School of Medicine; College of Stomatology, Shanghai Jiao Tong University; National Center for Stomatology; National Clinical Research Center for Oral Diseases; Shanghai Key Laboratory of Stomatology, Shanghai, People’s Republic of China; 4Shanghai Key Laboratory of Orthopedic Implants, Department of Orthopaedic Surgery, Shanghai Ninth People’s Hospital, Shanghai Jiao Tong University School of Medicine, Shanghai, People’s Republic of China
*These authors contributed equally to this work
Correspondence: Yuxin Zhang; Bin Cai, Department of Rehabilitation Medicine, Hainan Western Central Hospital, No. 2, Fubo East Road, Nada Town, Danzhou, Hainan, 571700, People’s Republic of China, Tel +86-21-53315248, Email [email protected]; [email protected]
Objective: This study aimed to characterize the gene expression profile at the early stages of the healing process of post-traumatic joint contracture (PTJC).
Methods: Twelve rats were used for PTJC model establishment and were divided into four groups according to the sampling time: S0d, S3d, S7d and S2w. Transcriptome sequencing was performed on fibrotic joint capsule samples in four groups followed by bioinformatics analyses including differentially expressed genes (DEGs) screening, Short Time-series Expression Miner (STEM) analysis, network construction, and pathway analysis. Five important genes were validated by qRT-PCR.
Results: A total of 1171, 1052 and 793 DEGs were screened in S3d vs S0d, S7d vs S0d, and S2w vs S0d comparison groups, respectively. A total of 383 overlapping genes were screened out, which were significantly enriched in some inflammatory functions and pathways. Through STEM analysis, three clusters were identified, including 105, 57 and 57 DEGs, respectively. Then, based on the cluster genes, 10 genes, such as Il6, Timp1, Cxcl1, Cxcr4 and Mmp3, were further selected after PPI and pathway analyses. The expression levels of Il6, Timp1, Cxcl1, Cxcr4 and Mmp3 were validated by qRT-PCR.
Conclusion: The present study screened out several genes with significant changes in expression levels at the early stages of the healing process in PTJC, such as Il6, Timp1, Cxcl1, Cxcr4 and Mmp3. Our study offers a valuable contribution to the understanding pathomechanism of PTJC.
Keywords: post-traumatic joint contracture, transcriptome sequencing, Short Time-series Expression Miner analysis, joint capsule fibrosis
Introduction
Post-traumatic joint contracture (PTJC) is the most common musculoskeletal complication after surgery or joint injury, which is characterized by the loss of active and passive range of motion (ROM) of the mobile joints and limited social participation, often resulting in lifelong dysfunction.1 Contracture not only leads to the limitation of motor function but also induces osteoarthritis and muscle atrophy, which aggravates the loss of function of patients. It is generally believed that joint capsule fibrosis caused by excessive inflammation is the pathogenic basis of PTJC.2,3 As a result, non-steroidal anti-inflammatory drugs are widely applied to relieve inflammation in PTJC.4,5 However, the application of these drugs has been greatly limited due to their limited efficacy and inevitable side effects. Thus, it is particularly important to explore the molecular mechanism of PTJC to provide novel therapeutic targets for PTJC.
Many clinical and basic studies have indicated that the over-activated inflammatory response is an important step leading to joint capsule fibrosis.2,4 The expression levels of inflammation factors, such as α-smooth muscle actin (α-SMA), transforming growth factor (TGF)-GF, tryptase, collagen I and III, and matrix metalloproteinase (MMP)-9 were found to be significantly increased in the contracture group compared to the control group.6,7 In addition, our previous studies demonstrated that macrophage migration inhibitory factor was increased in posterior joint capsule following PTJC and promoted joint capsule fibroblast proliferation and inflammation by regulating mitogen-activated protein kinase/nuclear factor (NF)-κB pathway.8,9 However, the gene expression changes at the early stages of PTJC remain unclear. The gene expression analysis using microarray combined with bioinformatics analyses may help identify gene expression programs that contribute to the pathophysiology of joint capsule fibrosis formation. For instance, gene expression microarray analyses have suggested that many inflammatory genes are up-regulated soon after injury in rabbit models of joint contracture.10 Recently, Morrey et al, based on gene expression microarray analysis, reported that the progression of contractures is associated with the modulation of genes that mediate inflammatory responses, epithelial-to-mesenchymal transition, and extracellular matrix (ECM) remodeling.11 In spite of these findings, the expression levels of genes that change over time with the progression of PTJC are still unclear.
In this study, we intended to identify genes changing with the progression of PTJC at the early stages of the healing process. For this purpose, PTJC model of knee joint was established in rats. Then, the gene expression levels in tissue samples of 0, 3, 7, 14 days were detected using high throughput sequencing technology. The genes with significant changes in the expression level over time were screened based on time-series analysis, and the mechanism correlation analysis was performed according to the fluctuation characteristics of gene changes.
Materials and Methods
Animals
Adult male Sprague Dawley rats (200–250 g in weight) were used for model construction. The rats were purchased from Shanghai SIPPR-Bk Lab Animal Co., Ltd., and raised in specific-pathogen-free laboratory animal facilities at 23 ± 1 °C with free access to food and water. The animal study was carried out in compliance with the ARRIVE guidelines and approved by the Institution of Animal Care and Use Committee (IACUC) of the Ninth People’s Hospital Affiliated to Shanghai Jiao Tong University School of Medicine.
Establishment of the PTJC Model
A total of 12 rats at same age were used for model establishment, which were randomly divided into 4 groups (n = 3 for each group): control group, model group (3 days), model group (7 days), and model group (2 weeks). In detail, the healthy male SD rats in the model group were anesthetized intraperitoneally, and the surface hair of the right knee was removed and disinfected with iodophor. An incision was made along the inner edge of the patella, and the patella was turned over. The anterior and posterior cruciate ligaments were cut, and the posterior joint capsule was torn, followed by drilling with a Kirschner needle (1 mm in diameter) at the distal femur and proximal tibia. Then, the femur and tibia were fixed at 135° of flexion with sterilized wire in an “orifice” pattern, and the wound was sutured. The rats in the control group were anesthetized, shaved, disinfected, and made incision on skin and muscle as the model group. Then, the incision was sutured. In order to eliminate the influence of the age difference of rats on the results, we performed the PTJC operation on the rats in reverse chronological order. The PTJC rats in the first batch were regarded as the S2w group, and 7 days later, PTJC model was established by the same researcher and was regarded as the S7d group, and so on. At the end of 2 weeks, the rats in the control group underwent sham operation. All rats were then euthanized and joint capsule samples were collected.
Transcriptome Sequencing
The joint capsule samples were collected and sequenced using Illumina Hiseq 2000. In detail, total RNA was extracted from 12 samples and mixed in equal amounts to form a total RNA mixing pool. After qualification, mRNA was enriched with magnetic beads with Oligo (dT), and subsequently broken into short fragments by fragmentation buffer. One-stranded cDNA was synthesized with six-base random hexamers using mRNA as template, followed by the addition of buffer, DNA polymerase I and dNTPs to synthesize double-stranded cDNA. The double-stranded cDNA was then purified using AMPu re XP beads, followed by end-repairing, A-tailed ligation, adapter ligation, and fragment size selection with AMPu re XP beads. The cDNA library was obtained by PCR enrichment.
Processing of Raw Sequencing Data
Raw image data were transformed into sequenced reads by base calling analysis using Illumina CASAVA version 2.20 software,12 and the results were stored in FASTQ file format. Then FASTX was used to filter the unqualified sequence data that contained low quality and low end mass, obtaining high-quality sequence data (clean reads). Then, Hierarchical Indexing for Spliced Alignment of Transcript (HISAT) version 0.1.6 software13 was used for genomic mapping analysis. Parameter was set to mismatch = 2, and default for the rest of the parameters. The genomic positioning results of all sequencing reads data were put together and assembled with Cufflinks version 2.2.1,14 and then compared with Cuffcompare and known gene models to obtain the expression levels of coding genes in each sample.
Distribution and Comparative Analysis of Expression Abundance Among Samples
We applied several methods to evaluate the correlation between samples based on the expression abundance of each sample. First, the cor function in R3.6.1 was used to calculate the Pearson correlation coefficient between pairwise samples. The closer the correlation coefficient was to 1, the higher the similarity of expression patterns between samples.15 Additionally, the psych package version 1.7.8 was used to conduct principal component analysis for all samples based on expression abundance.
Screening of Significantly Differentially Expressed Genes (DEGs)
According to the time point of sample collection, the samples were divided into the following comparison groups: S3d vs S0d, S7d vs S0d, and S2w d vs S0d. Then, limma package version 3.34.716 in R3.6.1 was used to screen the significantly differentially expressed genes (DEGs) between each comparison group, and FDR < 0.05 and |Log2FC| > 0.5 were used as the thresholds. For the expression levels of DEGs screened in each comparison group, pheatmap version 1.0.817,18 in R3.6.1 was used for hierarchical clustering. Then, the DEGs in each comparison group were compared, and overlapping DEGs in the comparison group at three time points (namely, genes whose expression level continued to change significantly with the change of time) were selected. These overlapping DEGs were annotated with GO (Gene Ontology) biological process and KEGG (Kyoto Encyclopedia of Genes and Genomes) signaling pathway enrichment analyses based on DAVID version 6.8,19,20 and p < 0.05 was selected as the threshold of enrichment significance.
Short Time-Series Expression Miner (STEM) Analysis
For overlapping DEGs obtained in the previous step, significant similarity clustering of expression patterns was performed using Short Time-series Expression Miner (STEM) version 1.3.11.21 The similarity threshold was 0.8, and significance threshold was P < 0.05. DEGs in different trend clusters were used for further analysis.
Construction of Interaction Network and Analysis of Network Topology
The protein–protein interaction (PPI) relationship between DEGs that were significantly clustered in different trend clusters obtained in the previous step was searched using STRING22 version 11.0, and the interaction network was constructed using Cytoscape 3.9.0.23 Then, the topological properties of network nodes were analyzed using CentiScaPe version 2.2,24 a plug-in of Cytoscape 3.9.0, and genes with important connection roles in the network were screened. Hub genes were screened by calculating the following four parameters: average shortest PathLength,25 degree, betweenness centrality, and closeness centrality.26
Pathway Analysis of Gene in the Interaction Network
For the genes included in the PPI network, KEGG signaling pathway enrichment analysis was performed using DAVID 6.8. P value <0.05 was selected as the threshold of enrichment significance. Then, the DEGs significantly involved in KEGG signaling pathway were compared with the hub genes obtained from the network topology, and the top 10 DEGs with important network topology in KEGG signaling pathway genes were selected as the important genes.
Expression Levels of Important Genes
For the important genes, the expression levels of corresponding genes at different time points were extracted from the sequencing samples. Then, the independent dataset GSE85051 was downloaded from the NCBI GEO27 database, which was a data set related to knee injury. A total of 60 samples were included, of which 18 samples were selected (11 knee injury tissues and 7 normal knee tissues), and the expression levels of corresponding important genes were selected. The differences in their expression levels between injured and normal knee tissues were compared.
qRT-PCR Assay
In order to verify the reliability of RNA-seq data, we established PTJC model in another five rats and measured the expression levels of Il6, Timp1, Cxcl1, Cxcr4, and Mmp3 in joint capsule samples of PTJC and control rats (n = 5) by qRT-PCR. Total RNA was extracted using RNAiso Plus (TAKARA, China). The purity and concentration of RNA were detected using spectrophotometer. The cDNA was synthesized with PrimeScript™RT Master Mix (Perfect Real Time) (TaKaRa, China). qRT-PCR was carried out using Power SYBR Green PCR Master Mix (Thermo, USA). The reaction procedures included 95°C for 10 min, 40 cycles of 95°C for 15s and 60°C for 60s, and melting conditions of 95°C for 15s, 60°C for 60s, and 95°C for 15s. The primers are listed in Table 1.
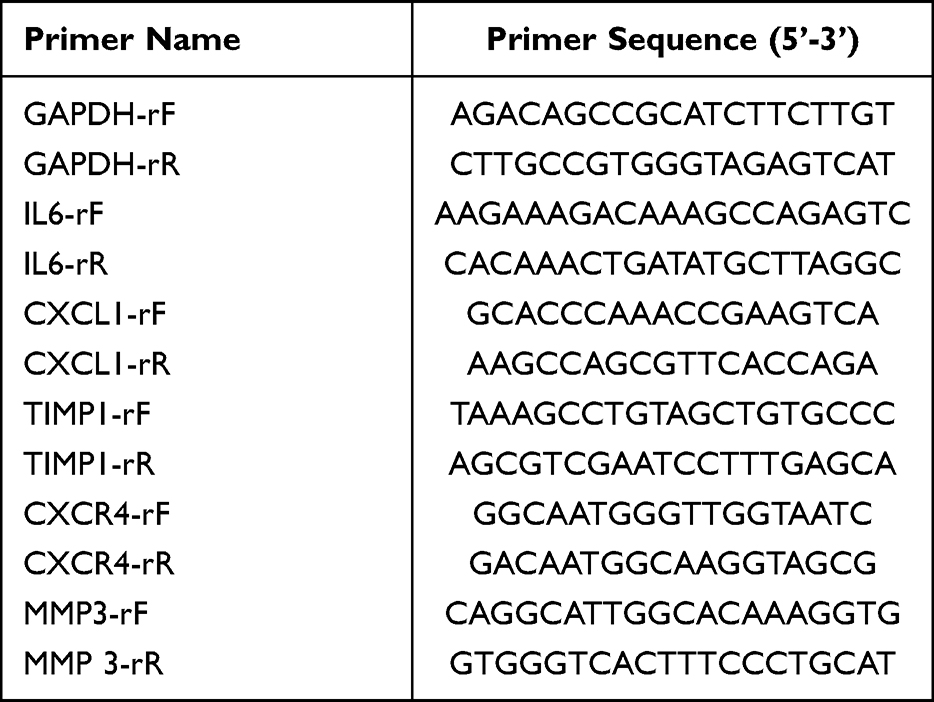 |
Table 1 Primers Used in the Study |
Statistical Analysis
Statistical analysis was conducted using GraphPad prism 5 (GraphPad Software, San Diego, CA, USA). P < 0.05 was the screening criteria for significant difference.
Results
Screening of DEGs in Each Comparison Group
A total of 1171, 1052 and 793 DEGs that met the threshold conditions were screened in S3d vs S0d, S7d vs S0d, and S2w vs S0d comparison groups, respectively. The volcano plots of these DEGs are shown in Figure 1A–C. Hierarchical cluster analysis showed that the DEGs could separate the PTJC samples from control samples in S3d vs S0d, S7d vs S0d, and S2w vs S0d comparison groups (Figure 1D–F), suggesting the robustness of DEGs. After comparing the DEGs in three groups, 383 overlapping genes were identified (Figure 2A). Enrichment analysis on 383 overlapping DEGs revealed 23 significantly correlated biological processes, such as inflammatory response, cellular response to interleukin-1, extracellular matrix organization, and response to lipopolysaccharide (Figure 2B), and 14 KEGG signaling pathways, such as cytokine–cytokine receptor interaction, TNF signaling pathway, and JAK-STAT signaling pathway (Figure 2C, Table S1).
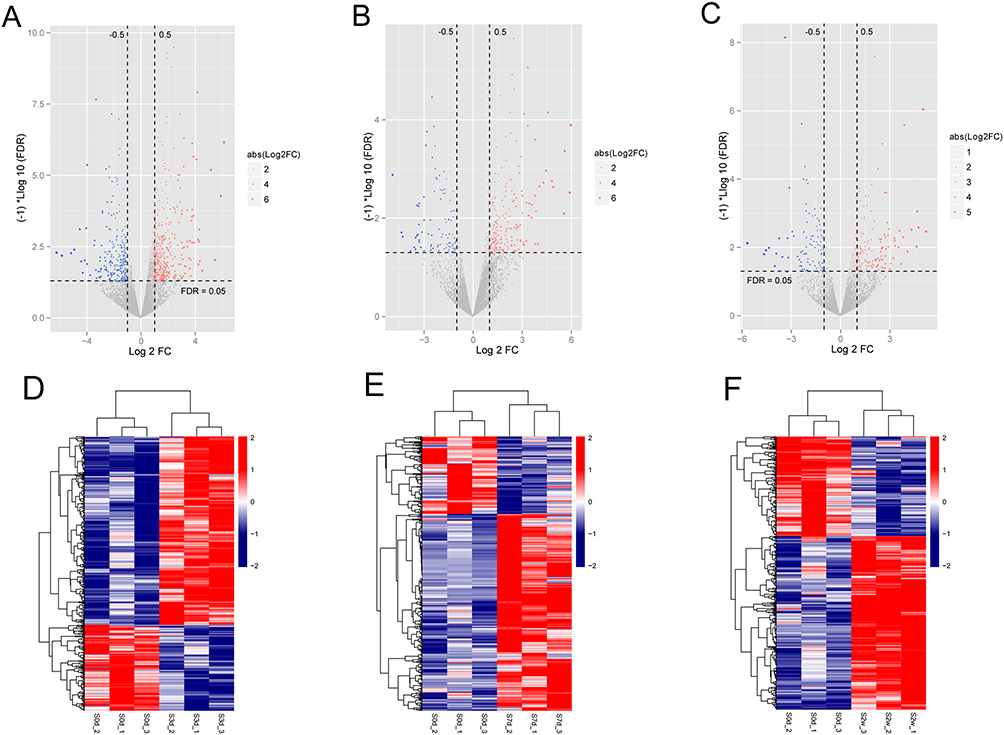 |
Figure 1 Identification of differentially expressed genes (DEGs) in the progression of post-traumatic joint contracture (PTJC). (A–C) Volcano plots for DEGs in S3d vs S0d (A), S7d vs S0d (B) and S2w vs S0d (C). Red and blue dots represent significantly up- and down-regulated DEGs; horizontal dotted line indicates FDR < 0.05; the vertical dotted line indicates |log2FC| > 0.5. (D–F) Hierarchical clustering heat map based on expression levels of DEGs in S3d vs S0d (D), S7d vs S0d (E) and S2w vs S0d (F) showed the DEGs could separate the PTJC samples from control samples. The number at the right part of heat map corresponds to |log2FC|. |
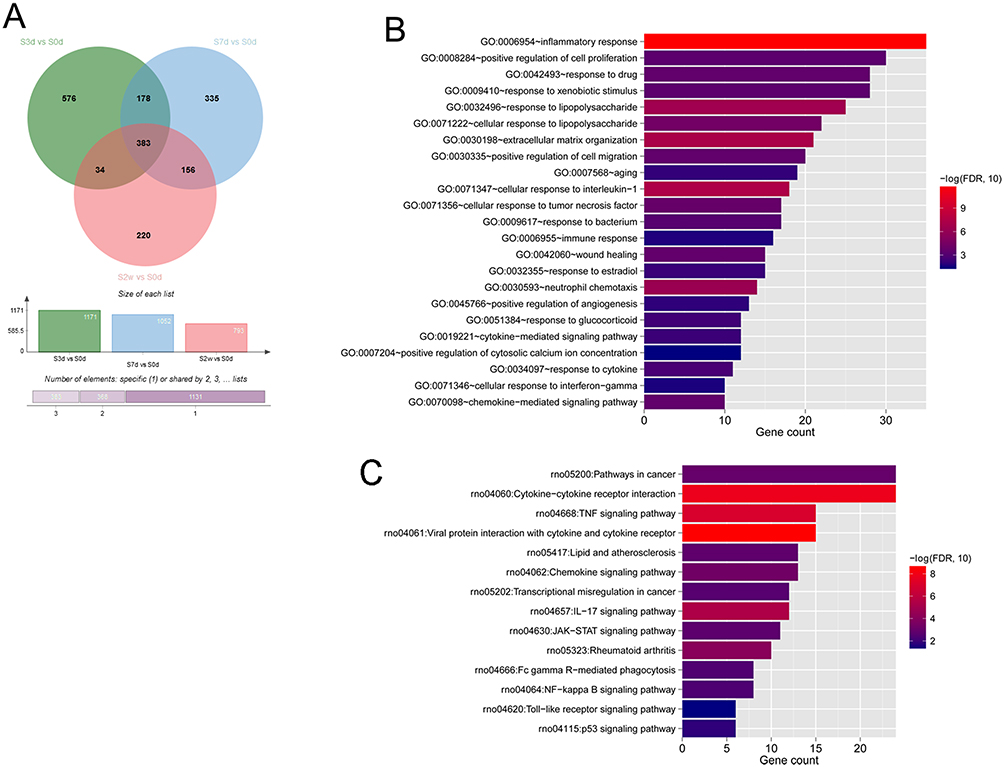 |
Figure 2 Functional enrichment analyses of the 383 overlapping DEGs among the three comparison groups. (A) Venn diagram for comparison of three comparison groups of DEGs sets. (B and C) Gene Ontology biological process (B) and Kyoto Encyclopedia of Genes and Genomes signaling pathway (C) enrichment analyses of the 383 overlapping DEGs in three groups. The horizontal axis represents the number of DEGs involved in the term, the vertical axis represents the term name, and the color represents the significant correlation (the closer to the red, the more significant). |
STEM Analysis
For the 383 DEGs obtained in the previous step, genes with significantly similar expression patterns of time-series expression profiles were clustered by STEM software. A total of three significant expression pattern clusters were obtained, cluster 8, 9 and 11, as shown in Figure 3A, which contained 105, 57 and 57 DEGs, respectively. Then, the genes in three clusters were performed biological process and KEGG signaling pathway analyses, and a total of 20, 22 and 18 significantly related GO biological processes (Figure 3B), as well as 12, 4 and 1 significantly related KEGG signaling pathways were obtained, respectively (Figure 3C).
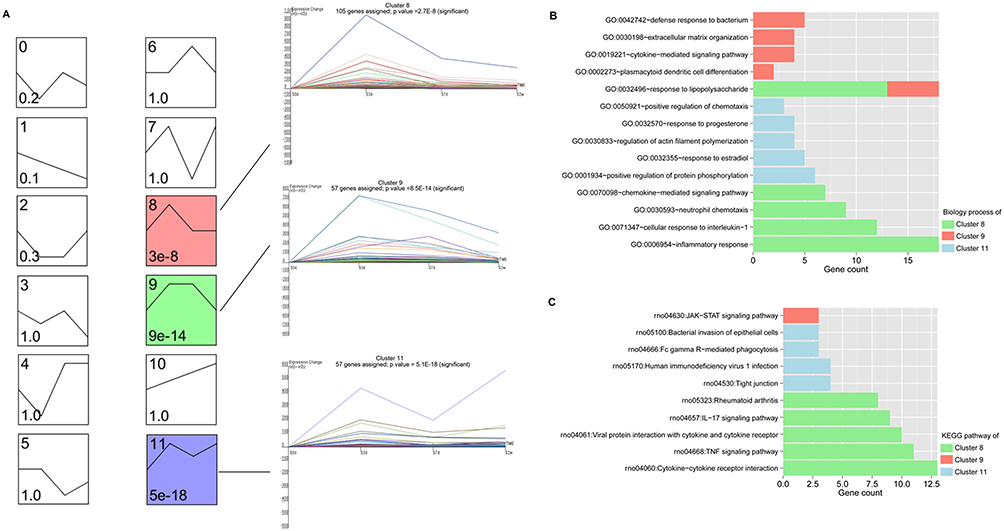 |
Figure 3 Short Time-series Expression Miner (STEM) expression profiling analysis of overlapping DEGs. (A) Cluster map of STEM expression profiling analysis. Each small square represents a different set of clustered genes obtained by STEM. The number in the upper left corner of the small square indicates the number of the clustered gene set. The black broken lines in the squares indicate the trend of expression of all genes in the gene set. The numbers in the lower left corner indicate the significance P value of gene expression similarity in this cluster gene set. (B and C) The significantly correlated GO biological process (B) and KEGG signaling pathway (C) enrichment analysis of the DEGs contained in the three clusters. The horizontal axis represents the number of DEGs participating in the item, and the vertical axis represents the item name, and the color represents different clusters. |
Construction of PPI Networks and Identification of Key Genes
The protein interaction connections between 219 DEGs contained in the three clusters were searched in the STRING dataset. The interaction connections with a connection score higher than 0.4 were retained, and 425 pairs of interaction connections were obtained to construct the interaction network (Figure 4A). The network contained 152 gene nodes. The centrality parameter of each node in the network was calculated using Cytoscape CentiScaPe plug-in, and the top 20 nodes according to the node degrees from high to low is shown in Table 2.
 |
Table 2 Topology of Network Nodes |
 |
Figure 4 Protein–protein interaction (PPI) network and pathway enrichment analysis of the 152 nodes in the PPI network. (A) PPI network of genes in the three significant clusters. Different colors indicate DEGs from different clusters, the size of nodes indicates the degree of nodes, and larger nodes indicate higher degree of nodes. (B) KEGG signaling pathways of DEGs in the PPI network. The horizontal axis represents the number of DEGs involved in the item, the vertical axis represents the item name, and the color represents the significant correlation (the closer to the red, the more significant). |
Pathway Analysis of Gene in the Interaction Network
The genes in the PPI network were performed pathway enrichment analysis and 12 KEGG signaling pathways were identified, such as pathways in cancer, cytokine–cytokine receptor interaction, and TNF signaling pathway (Figure 4B). The 12 KEGG signaling pathways involved 43 DEGs. These genes were compared with the important hub genes obtained from the PPI network, and the top 10 DEGs that were important in the network topology structure were selected as the important genes, including interleukin-6 (Il6), TIMP metallopeptidase inhibitor 1 (Timp1), C-X-C motif chemokine ligand 1 (Cxcl1), C-X-C motif chemokine receptor 4 (Cxcr4), matrix metallopeptidase 3 (Mmp3), serpin family E member 1 (Serpine1), thrombospondin 1 (Thbs1), Cxcl2, heme oxygenase 1 (Hmox1), and Cxcl6.
Validation of Expression Levels of Important Genes Through Independent Dataset
For the 10 important DEGs obtained in the previous step, their expression levels at different time points were extracted from the sequencing samples. As shown in Figure 5A, all of the 10 important genes were from cluster 8. The expression levels of these 10 genes were gradually decreased after S3d, which indicated that the expression levels of the 10 genes were significantly increased after trauma. Then, we extracted the expression levels of the corresponding 10 genes from the corresponding samples of GSE85051 and compared their expression levels in the knee joint damage and control samples. As shown in Figure 5B, except for Thbs1, the expression levels of the other 9 genes were significantly up-regulated in knee joint injury samples.
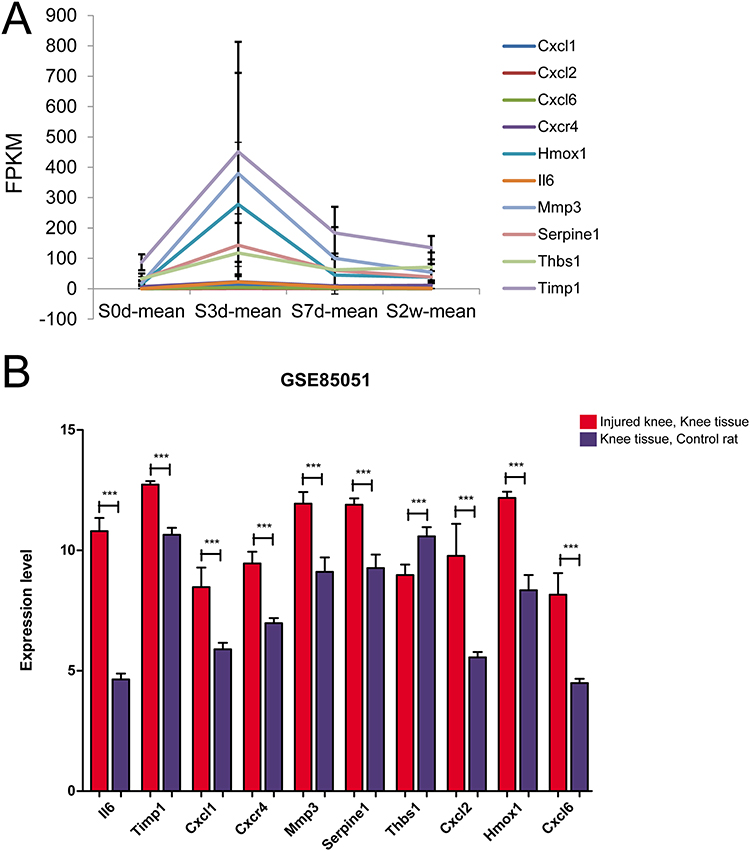 |
Figure 5 Validation of DEGs in an independent dataset. (A) The expression fluctuation of 10 important DEGs in the sequencing data. (B) The expression levels of 10 important DEGs in GSE85051 knee injury and control samples. ***P < 0.001, compared with control rat. |
qRT-PCR Validation
Further, the mRNA expression levels of five genes associated inflammation and ECM were validated in by qRT-PCR. As shown in Figure 6, the five genes were all up-regulated in model groups compared with control, which is consistent with transcriptome sequencing.
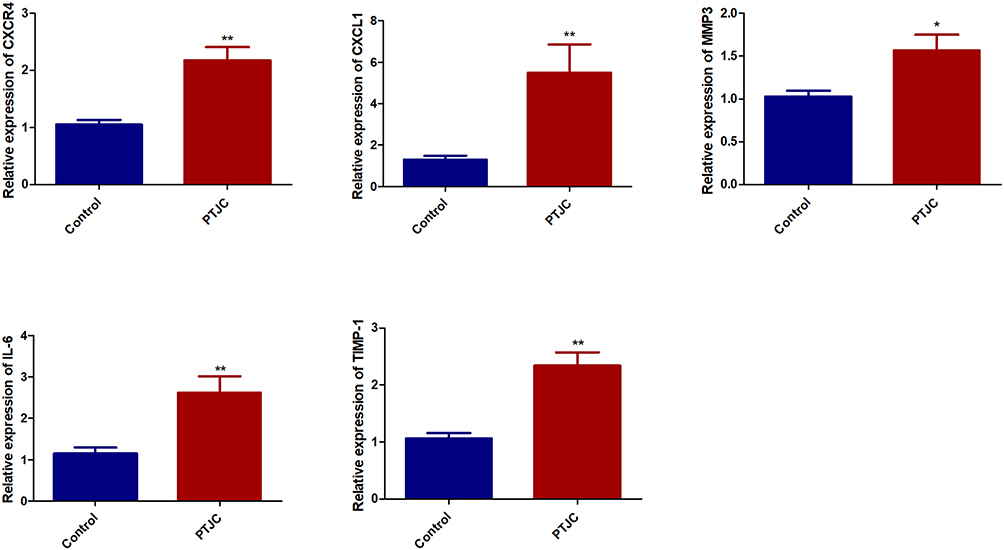 |
Figure 6 Validation of DEGs in PTJC model. The mRNA expression levels of Il6, Timp1, Cxcl1, Cxcr4 and Mmp3 in model and control groups were detected by qRT-PCR. *P < 0.05, **P < 0.01, compared with control group. |
Discussion
In this study, the numerous DEGs were identified between model and control groups. The overlapping genes of three comparison groups were significantly enriched in some inflammatory functions and pathways. Through STEM analysis, three clusters were identified. Then, based on the cluster genes, 10 genes, such as Il6, Timp1, Cxcl1, Cxcr4 and Mmp3, were further selected after PPI and pathway analyses. The expression levels of these genes were validated through independent dataset and qRT-PCR.
It is well known that inflammation is the pathogenic basis and early event of joint capsule fibrosis.2 The present study also suggested that the overlapping genes of three comparison groups were associated with some inflammatory functions and pathways, such as inflammatory response, JAK-STAT signaling pathway, TNF signaling pathway, NF-κB signaling pathway, chemokine signaling pathway and IL-17 signaling pathway. A large number of cytokines signal through the JAK-STAT pathway.28 Therefore, mutations in JAK and STAT cause a variety of inflammatory and autoimmune diseases.29 Currently, the role of JAK-STAT signaling pathway in PTJC or arthrofibrosis has not been reported to our best knowledge. Thus, we speculated that JAK-STAT signaling pathway may be involved in the progression of PTJC through inflammatory response. The underlying mechanism remains to be studied.
Ten important DEGs were identified by integrating the hub nodes of PPI network and the DEGs in the key KEGG signaling pathways. Excessive inflammation results in intra-articular adhesion formation and joint capsular fibrosis. During the process, posterior joint capsule inflammation, thickness, ECM deposition, collagen hyperplasia are represented.30 Five genes associated with inflammation and ECM were further validated by qRT-PCR, including Il6, Timp1, Cxcl1, Cxcr4, and Mmp3. IL-6 is a multifunctional cytokine secreted by a variety of cells in an inflammatory environment. It has been shown to increase expression in a variety of chronic inflammatory and fibrotic diseases such as tumors, periarthritis of shoulder, and pulmonary fibrosis.31,32 Additionally, it can act on target cells in the form of autocrine or paracrine to induce the activation of STAT3 (signal transducer and activator of transcription 3),32 and regulate the production of anti-apoptotic related proteins, leading to prolonged cell survival and proliferative lesions.33 In the present study, Il6 was found participated in several pathways, such as “cytokine–cytokine receptor interaction”, “TNF signaling pathway”, “IL-17 signaling pathway” and “JAK-STAT signaling pathway” and its expression level peaked on S3d and then decreased gradually, which was consistent with previous studies. For instance, Dendyningrat et al34 reported that the high levels of Il-6 and TNF-α secreted by chondrocytes in the first week following anterior cruciate ligament injury. Cuellar et al35 proved that the peak concentrations of Il-6 synovial fluid levels can reach two- to threefold at 72 h after injury. Therefore, Il6 may serve as a biomarker indicating the arthrofibrosis formation of PTJC.
Chemokines are a class of small heparin-binding chemotactic cytokines, which recruit leukocytes to the inflammation sites.36 Growing evidence has demonstrated that chemokines and their receptors are associated with tissue fibrosis.37–39 In this study, chemokine signaling pathway was found being dysregulated during PTJC and several chemokines, including Cxcl1 and Cxcr4 were significantly upregulated in PTJC. Cxcl1 is a pro-inflammatory factor, which is principally expressed in neutrophils, macrophages and epithelial cells.40 Cxcl1 and Cxcr4 are involved in the pathogenesis of fibrosis in several organs, and could increase fibrosis by affecting the functions of inflammatory cells, fibroblasts and endothelial cells.40–44 Therefore, agents targeting chemokine might lead to treatment of patients with arthrofibrosis.
It has been reported that increased expressions of tissue inhibitors of metalloproteinases (TIMPs) and matrix metalloproteinases (MMPs) are associated with tissue remodeling mediated by fibroblasts. Tissue remodeling is effective in creating a functional barrier between or within organs, but aberrant repair and remodeling result in tissue fibrosis.39 In the present study, Timp1 and Mmp3 were up-regulated and we speculated that their increased expression may be associated with the abnormal tissue remodeling of arthrofibrosis in PTJC. Our results did not completely agree with the study of Sun et al, who demonstrated that MMP-1 and MMP-13 were significantly increased in PTJC group, while TIMP-13 was significantly decreased.3 Therefore, further investigations on the expression of TIMPs are still warranted.
Some limitations in this study should be noted. First, the sample size for RNA-seq in each time points is relative small due to limited fund. Second, only tissues at three time points were investigated and the latest time point was 2 weeks post-injury. This time point represents the relatively early stages of the healing process. However, the healing of injured joints includes crucial late stages such as tissue remodeling. Therefore, our study focused only on expression patterns at the early stages of the healing process and further studies are still warranted to validate our results.
In conclusion, the present study screened out several genes with significant changes on expression patterns at the early stages of the healing process in PTJC, such as Il6, Timp1, Cxcl1, Cxcr4 and Mmp3. Our study offers a valuable contribution to the understanding pathomechanism of PTJC.
Data Sharing Statement
The data that support the findings of this study are available from the corresponding author upon reasonable request.
Ethical Approval Statement
The animal study was reviewed and approved by the Institution of Animal Care and Use Committee (IACUC) of the Ninth People’s Hospital Affiliated to Shanghai Jiao Tong University School of Medicine.
Author Contributions
All authors made a significant contribution to the work reported, whether that is in the conception, study design, execution, acquisition of data, analysis and interpretation, or in all these areas; took part in drafting, revising or critically reviewing the article; gave final approval of the version to be published; have agreed on the journal to which the article has been submitted; and agree to be accountable for all aspects of the work.
Funding
This study was supported by the Hainan Provincial Natural Science Foundation of China (No. 821MS148, 823QN364), the Natural Science Foundation of Shanghai (No. 22ZR1437600), Shanghai Rehabilitation Medicine Clinical Medical Research Center (No. 21MC1930200); the National Natural Science Foundation of China (No. 92048205).
Disclosure
The authors report no conflicts of interest in this work.
References
1. Reiter AJ, Schott HR, Castile RM, et al. Females and males exhibit similar functional, mechanical, and morphological outcomes in a rat model of posttraumatic elbow contracture. Research Support, N I H, extramural research support, Non-U S Gov’t. J Orthop Res. 2021;39(9):2062–2072. doi:10.1002/jor.24918
2. Kaneguchi A, Ozawa J, Kawamata S, Yamaoka K. Development of arthrogenic joint contracture as a result of pathological changes in remobilized rat knees. Research Support, Non-U S Gov’t. J Orthop Res. 2017;35(7):1414–1423. doi:10.1002/jor.23419
3. Sun Y, Li F, Fan C. Effect of pERK2 on extracellular matrix turnover of the fibrotic joint capsule in a post-traumatic joint contracture model. Exp Ther Med. 2016;11(2):547–552. doi:10.3892/etm.2015.2948
4. Chen AF, Lee YS, Seidl AJ, Abboud JA. Arthrofibrosis and large joint scarring. Research support, U S Gov’t, Non-P H S Review. Connect Tissue Res. 2019;60(1):21–28. doi:10.1080/03008207.2018.1517759
5. Campbell TM, Trudel G, Wong KK, Laneuville O. Genome wide gene expression analysis of the posterior capsule in patients with osteoarthritis and knee flexion contracture. Comparative study research support, Non-U S Gov’t. J Rheumatol. 2014;41(11):2232–2239. doi:10.3899/jrheum.140079
6. Monument MJ, Hart DA, Befus AD, Salo PT, Zhang M, Hildebrand KA. The mast cell stabilizer ketotifen reduces joint capsule fibrosis in a rabbit model of post-traumatic joint contractures. Inflamm Res. 2012;61(4):285–292. doi:10.1007/s00011-011-0409-3
7. Zhang Y, Wang Z, Zong C, et al. Platelet-rich plasma attenuates the severity of joint capsule fibrosis following post-traumatic joint contracture in rats. Front Bioeng Biotechnol. 2022;10:1078527. doi:10.3389/fbioe.2022.1078527
8. Zhang Y, Lu S, Fan S, et al. Macrophage migration inhibitory factor activates the inflammatory response in joint capsule fibroblasts following post-traumatic joint contracture. Aging. 2021;13(4):5804–5823. doi:10.18632/aging.202505
9. Zhang Y, Liu Z, Wang K, et al. Macrophage migration inhibitory factor regulates joint capsule fibrosis by promoting TGF-β1 production in fibroblasts. Int J Biol Sci. 2021;17(7):1837–1850. doi:10.7150/ijbs.57025
10. Morrey ME. Early Gene Expression and the Role of Substance P in Joint Contracture Formation: A Microarray, Bioinformatics, and Biomechanical Investigation in a Rabbit Model of Arthrofibrosis. College of Medicine-Mayo Clinic; 2012.
11. Morrey ME, Abdel MP, Riester SM, et al. Molecular landscape of arthrofibrosis: microarray and bioinformatic analysis of the temporal expression of 380 genes during contracture genesis. Gene. 2017;610:15–23. doi:10.1016/j.gene.2017.01.025
12. Shringarpure SS, Mathias RA, Hernandez RD, et al. Using genotype array data to compare multi- and single-sample variant calls and improve variant call sets from deep coverage whole-genome sequencing data. Bioinformatics. 2017;33(8):1147–1153. doi:10.1093/bioinformatics/btw786
13. Pertea M, Kim D, Pertea GM, Leek JT, Salzberg SL. Transcript-level expression analysis of RNA-seq experiments with HISAT, StringTie and Ballgown. Research support, N I H, extramural research support, U S Gov’t, Non-P H S. Nat Protoc. 2016;11(9):1650–1667. doi:10.1038/nprot.2016.095
14. Trapnell C, Roberts A, Goff L, et al. Differential gene and transcript expression analysis of RNA-seq experiments with TopHat and Cufflinks. Research support, N I H, extramural research support, non-U S Gov’t research support, U S Gov’t, Non-P H S. Nat Protoc. 2012;7(3):562–578. doi:10.1038/nprot.2012.016
15. Adler J, Parmryd I. Quantifying colocalization by correlation: the Pearson correlation coefficient is superior to the Mander’s overlap coefficient. Research Support, Non-U S Gov’t. Cytometry A. 2010;77(8):733–742. doi:10.1002/cyto.a.20896
16. Ritchie ME, Phipson B, Wu D, et al. limma powers differential expression analyses for RNA-sequencing and microarray studies. Research support, Non-U S Gov’t. Nucleic Acids Res. 2015;43(7):20. doi:10.1093/nar/gkv007
17. Wang L, Cao C, Ma Q, et al. RNA-seq analyses of multiple meristems of soybean: novel and alternative transcripts, evolutionary and functional implications. Research support, Non-U S Gov’t. BMC Plant Biol. 2014;14(169):1471–2229. doi:10.1186/1471-2229-14-169
18. Eisen MB, Spellman PT, Brown PO, Botstein D. Cluster analysis and display of genome-wide expression patterns. Research support, U S Gov’t, P H S. Proc Natl Acad Sci U S A. 1998;95(25):14863–14868. doi:10.1073/pnas.95.25.14863
19. Huang W, Sherman BT, Lempicki RA. Systematic and integrative analysis of large gene lists using DAVID bioinformatics resources. Research Support, N I H, extramural. Nat Protoc. 2009;4(1):44–57. doi:10.1038/nprot.2008.211
20. Huang W, Sherman BT, Lempicki RA. Bioinformatics enrichment tools: paths toward the comprehensive functional analysis of large gene lists. Research support, N I H, extramural. Nucleic Acids Res. 2009;37(1):1–13. doi:10.1093/nar/gkn923
21. Ghandhi SA, Sinha A, Markatou M, Amundson SA. Time-series clustering of gene expression in irradiated and bystander fibroblasts: an application of FBPA clustering. Research support, N I H, extramural research support, U S Gov’t, P H S. BMC Genomics. 2011;12(2):1471–2164. doi:10.1186/1471-2164-12-2
22. Szklarczyk D, Gable AL, Nastou KC, et al. Correction to “The STRING database in 2021: customizable protein-protein networks, and functional characterization of user-uploaded gene/measurement sets”. Nucleic Acids Res. 2021;49(18):10800. doi:10.1093/nar/gkab835
23. Shannon P, Markiel A, Ozier O, et al. Cytoscape: a software environment for integrated models of biomolecular interaction networks. Research support, Non-U S Gov’t research support, U S Gov’t, non-P H S research support, U S Gov’t, P H S. Genome Res. 2003;13(11):2498–2504. doi:10.1101/gr.1239303
24. Scardoni G, Petterlini M, Laudanna C. Analyzing biological network parameters with CentiScaPe. Research Support, Non-U S Gov’t. Bioinformatics. 2009;25(21):2857–2859. doi:10.1093/bioinformatics/btp517
25. Jeong H, Mason SP, Barabási AL, Oltvai ZN. Lethality and centrality in protein networks. Nature. 2001;411(6833):41–42. doi:10.1038/35075138
26. Brown KS, Hill CC, Calero GA, et al. The statistical mechanics of complex signaling networks: nerve growth factor signaling. Research support, N I H, extramural research support, U S Gov’t, non-P H S research support, U S Gov’t, P H S. Phys Biol. 2004;1(3–4):184–195. doi:10.1088/1478-3967/1/3/006
27. Edgar R, Domrachev M, Lash AE. Gene expression omnibus: NCBI gene expression and hybridization array data repository. Nucleic Acids Res. 2002;30(1):207–210. doi:10.1093/nar/30.1.207
28. Clark JD, Flanagan ME, Telliez JB. Discovery and development of Janus kinase (JAK) inhibitors for inflammatory diseases. Research support, Non-U S Gov’t review. J Med Chem. 2014;57(12):5023–5038. doi:10.1021/jm401490p
29. Banerjee S, Biehl A, Gadina M, Hasni S, Schwartz DM. JAK-STAT signaling as a target for inflammatory and autoimmune diseases: current and future prospects. Review. Drugs. 2017;77(5):521–546. doi:10.1007/s40265-017-0701-9
30. Lake SP, Castile RM, Borinsky S, Dunham CL, Havlioglu N, Galatz LM. Development and use of an animal model to study post-traumatic stiffness and contracture of the elbow. J Orthop Res. 2016;34(2):354–364. doi:10.1002/jor.22981
31. Cho CH, Lho YM, Hwang I, Kim DH. Role of matrix metalloproteinases 2 and 9 in the development of frozen shoulder: human data and experimental analysis in a rat contracture model. J Shoulder Elbow Surg. 2019;28(7):1265–1272. doi:10.1016/j.jse.2018.11.072
32. Liu X, Das AM, Seideman J, et al. The CC chemokine ligand 2 (CCL2) mediates fibroblast survival through IL-6. Am J Respir Cell Mol Biol. 2007;37(1):121–128. doi:10.1165/rcmb.2005-0253OC
33. Hodge DR, Hurt EM, Farrar WL. The role of IL-6 and STAT3 in inflammation and cancer. Review. Eur J Cancer. 2005;41(16):2502–2512. doi:10.1016/j.ejca.2005.08.016
34. Dendyningrat IGAG, Suyasa IK, Astawa P, Ridia KGM. Green tea extract resulted in a lower value of IL-6 and TNF-α expressions on rabbit model with Anterior Cruciate Ligament (ACL) rupture. Indonesia J Biomed Sci. 2018;25(1). doi:10.1186/s12929-018-0489-2
35. Cuellar VG, Cuellar JM, Golish SR, Yeomans DC, Scuderi GJ. Cytokine profiling in acute anterior cruciate ligament injury. Arthroscopy. 2010;26(10):1296–1301. doi:10.1016/j.arthro.2010.02.011
36. Sahin H, Trautwein C, Wasmuth HE. Functional role of chemokines in liver disease models. Research Support, Non-U S Gov’t Review. Nat Rev Gastroenterol Hepatol. 2010;7(12):682–690. doi:10.1038/nrgastro.2010.168
37. Seki E, De Minicis S, Gwak GY, et al. CCR1 and CCR5 promote hepatic fibrosis in mice. Research support, N I H, extramural research support, Non-U S Gov’t. J Clin Invest. 2009;119(7):1858–1870. doi:10.1172/jci37444
38. Berres ML, Koenen RR, Rueland A, et al. Antagonism of the chemokine Ccl5 ameliorates experimental liver fibrosis in mice. Research support, Non-U S Gov’t. J Clin Invest. 2010;120(11):4129–4140. doi:10.1172/JCI41732
39. Sahin H, Wasmuth HE. Chemokines in tissue fibrosis. Biochim Biophys Acta. 2013;1832(7):1041–1048. doi:10.1016/j.bbadis.2012.11.004
40. Wu CL, Yin R, Wang SN, Ying R. A review of CXCL1 in cardiac fibrosis. Front Cardiovasc Med. 2021;8:674498. doi:10.3389/fcvm.2021.674498
41. Shi W-P, Ju D, Li H, et al. CD147 promotes CXCL1 expression and modulates liver fibrogenesis. Int J Mol Sci. 2018;19(4):1145. doi:10.3390/ijms19041145
42. Furuse S, Fujii H, Kaburagi Y, et al. Serum concentrations of the CXC chemokines interleukin 8 and growth-regulated oncogene-alpha are elevated in patients with systemic sclerosis. J Rheumatol. 2003;30(7):1524–1528.
43. Mehrad B, Burdick MD, Strieter RM. Fibrocyte CXCR4 regulation as a therapeutic target in pulmonary fibrosis. Int J Biochem Cell Biol. 2009;41(8–9):1708–1718. doi:10.1016/j.biocel.2009.02.020
44. Sung Y-C, Liu Y-C, Chao P-H, et al. Combined delivery of sorafenib and a MEK inhibitor using CXCR4-targeted nanoparticles reduces hepatic fibrosis and prevents tumor development. Theranostics. 2018;8(4):894. doi:10.7150/thno.21168
 © 2023 The Author(s). This work is published and licensed by Dove Medical Press Limited. The
full terms of this license are available at https://www.dovepress.com/terms
and incorporate the Creative Commons Attribution
- Non Commercial (unported, 3.0) License.
By accessing the work you hereby accept the Terms. Non-commercial uses of the work are permitted
without any further permission from Dove Medical Press Limited, provided the work is properly
attributed. For permission for commercial use of this work, please see paragraphs 4.2 and 5 of our Terms.
© 2023 The Author(s). This work is published and licensed by Dove Medical Press Limited. The
full terms of this license are available at https://www.dovepress.com/terms
and incorporate the Creative Commons Attribution
- Non Commercial (unported, 3.0) License.
By accessing the work you hereby accept the Terms. Non-commercial uses of the work are permitted
without any further permission from Dove Medical Press Limited, provided the work is properly
attributed. For permission for commercial use of this work, please see paragraphs 4.2 and 5 of our Terms.