Back to Journals » Journal of Inflammation Research » Volume 15
The Construction of ITP Diagnostic Modeling Based on the Expressions of Hub Genes Associated with M1 Polarization of Macrophages
Authors Wang MJ ![]() , Song Y, Guo XQ, Wei D, Cao XT, Sun Y, Xu YG, Hu XM
, Song Y, Guo XQ, Wei D, Cao XT, Sun Y, Xu YG, Hu XM
Received 7 March 2022
Accepted for publication 6 September 2022
Published 20 October 2022 Volume 2022:15 Pages 5905—5915
DOI https://doi.org/10.2147/JIR.S364414
Checked for plagiarism Yes
Review by Single anonymous peer review
Peer reviewer comments 2
Editor who approved publication: Professor Ning Quan
Ming-Jing Wang,1,2,* Ying Song,1,2,* Xiao-Qing Guo,1,* Diu Wei,1,2 Xin-Tian Cao,1,3 Yan Sun,1,3 Yong-Gang Xu,1 Xiao-Mei Hu1
1Department of Hematology, Xiyuan Hospital, China Academy of Chinese Medical Sciences, Beijing, 100091, People’s Republic of China; 2Graduate School, China Academy of Chinese Medical Sciences, Beijing, 100700, People’s Republic of China; 3Graduate School, Beijing University of Chinese Medicine, Beijing, 100029, People’s Republic of China
*These authors contributed equally to this work
Correspondence: Xiao-Mei Hu; Yong-Gang Xu, Department of Hematology, Xiyuan Hospital, China Academy of Chinese Medical Sciences, No. 1 Xiyuancaochang, Haidian District, Beijing, 100091, People’s Republic of China, Tel +86 010-6283-5361, Email [email protected]; [email protected]
Purpose: Primary immune thrombocytopenia (ITP) is an immune disease with a diagnosis of exclusion, since no validated biomarkers have been identified. In this study, we explored biomarkers associated with the development of ITP from an immune perspective to inform the clinical diagnosis.
Patients and Methods: Differentially expressed genes (DEGs) between normal and ITP samples were analyzed using limma package. Random forest algorithm and LASSO regression were further used to screen for DEGs associated with ITP. The expression of these hub genes was validated by PCR. The relationship between DEGs and immunity was explored by enrichment analysis. Immune cell infiltration in ITP was analyzed by CIBERSORT and ssGSEA, and the relationship between DEGs and infiltrating immune cells was analyzed by Spearman’s rank correlation analysis. Finally, a diagnostic model related to DEGs was constructed by the neural network, and its efficiency was detected by the ROC curve.
Results: After screening the GEO database and validation by PCR analysis, The expression of CTH and TAF8 were higher and while OSBP2 expression was lower in ITP patients compared to normal subjects (P< 0.05). GO enrichment analysis showed that these DEGs were associated with inflammatory immune-related diseases, and KEGG analysis showed that they mainly regulated signaling pathways such as JAK-STAT. CIBERSORT and ssGSEA analyses showed that these DEGs were mainly associated with macrophage M1 polarization. The expression of CTH and TAF8 were positively correlated with M1 expression, while OSBP2 was negatively correlated with M1 expression. The ROC curve showed high accuracy of the neural network model [AUC= 0.939, 95% CI (0.8– 1)].
Conclusion: Our results suggest that CTH, TAF8, and OSBP2 can be used as effective diagnostic biomarkers of ITP.
Keywords: primary immune thrombocytopenia, diagnostic biomarkers, macrophage M1 polarization, immune cell infiltration, bioinformatics
Introduction
Primary immune thrombocytopenia (ITP) is an acquired autoimmune bleeding disorder characterized by an isolated decrease in peripheral platelet count with no apparent cause, resulting in skin and mucosal bleeding, or in severe cases, visceral or intracranial bleeding.1,2 The pathogenesis of ITP is closely related to immunity, mainly due to the loss of autoantigen immune tolerance of platelets, which further leads to abnormal activation of humoral and cellular immunity.3–5 Additionally, inflammation is closely related to immune disorders, and immune cells such as Th22, Th17, Th1, and TFH, and immune factors including IL-22, IL-17A, and INF-γ, contribute to the pro-inflammatory features of ITP patients and ITP progression.6
Macrophages are one of the three phagocytic cell types in addition to granulocytes (neutrophils, eosinophils, and basophils) and dendritic cells (DCs). Macrophages act as effector cells to engulf platelets and stimulate autoantibodies against platelet production.7 Macrophage activation plays a critical role in tissue homeostasis as well as in inflammation and disease progression.8,9 Currently, macrophages are classified into two subtypes based on their function and activation: classically activated M1-like macrophages and alternatively activated M2-like macrophages. M1-like macrophages promote inflammation and inhibit the formation of megakaryocytes, whereas M2-like macrophages counter inflammation and promote megakaryocyte formation.10,11
The balance of M1 and M2 plays a key role in maintaining normal immune function, and has been proven to participate in the pathogenesis of ITP.12 M1 polarization is characterized by the production of large amounts of pro-inflammatory cytokines, such as Th1 and interferon INF-γ, which in turn damage megakaryocytes and affect platelet production. Conversely, reducing the number of pro-inflammatory M1 subpopulation cells increases platelet counts.13,14 The proportion of M2-like macrophages is significantly increased, along with a rising platelet count, in ITP after treatment with high-dose dexamethasone and eltrombopag (ELT).15,16
Currently, there is still a lack of direct diagnostic biomarkers for ITP.17 Since macrophage polarization is important in the pathogenesis of ITP, it is necessary to screen for genes associated with macrophage polarization in order to establish a diagnostic model for ITP.
As the application of sequencing technology expands and deepens, and the amount of biological data grows, bioinformatics has been widely used for the screening of disease biomarkers and the construction of diagnostic models.18–20 This work aimed to analyze the relationship between immune cells, related immune infiltration, and ITP as well as screen for effective biological indicators in the diagnosis of ITP, which could provide implications for the clinical diagnosis of ITP.
Materials and Methods
Dataset Collection
Gene expression profiling of the ITP and normal samples were downloaded from the GSE43177 dataset in the GEO (http://www.ncbi.nlm.nih.gov/geo) database. The raw data were normalized and are presented in Supplementary Figure 1.
Screening of Hub Genes
We first screened for differentially expressed genes (DEGs) in normal and ITP samples using ‘limma’ package with filter criteria of p< 0.05 and |logFC|>1. Then, two algorithms, Support Vector Machine-Recursive Feature Elimination (SVM-RFE) analysis and Least Absolute Shrinkage and Selector Operation (LASSO) analysis were performed to identify the hub genes related to ITP by “kernlab”, “caret”, “glmnet”, and “e1071” packages.
Functional Enrichment Analysis
Disease Ontology (DO) enrichment, Gene Ontology (GO) enrichment, and Kyoto Encyclopedia of Genes and Genomes (KEGG) functional analyses were performed to uncover the underlying expression perturbations among these clusters by the R package “clusterProfiler” with the cutoff value of P < 0.05.
Evaluation of Immune Cell Subtype
The single sample gene set enrichment analysis (ssGSEA) was introduced to quantify the relative abundance of immune cell types in the ITP microenvironment. The deconvolution approach CIBERSORT (http://cibersort.stanford.edu/) was used to estimate the abundances of distinct leukocyte subsets with the gene expression profile of ITP. The results of CIBERSORT and ssGSEA were visualized using the R packages “corplot”, “vioplot”, “ggplot2”, and “glment”.
Correlation Analysis Between Hub Genes and Immune Cells
The association of the identified hub genes with the levels of infiltrating immune cells was explored using Spearman’s rank correlation analysis in R software. The “limma”, “reshape2”, “ggpubr”, and “ggExtra” package were used to analyze and visualize the hub genes and immune cells.
Construction of Diagnostic Model
The diagnostic model was constructed based on the results of neural networks. The Neuralnet and NeuralNetTools packages of R tools were used to build and visualize the neural networks. A neural network is a simplified model that simulates the way the human brain processes information. This model works by simulating a large number of interconnected processing units in an abstract form similar to neurons. These processing units are located in layers. Neural networks typically contain three parts: an input layer with units representing input fields; one or more hidden layers; and an output layer with one or more units representing target fields. These units are connected by variable connection strengths (or weights). The input data is displayed in the first layer, and its values are propagated from neuron to neuron in the next layer. The final result is the output from the output layer.
Analysis of the Predictive Value of Biomarkers
ROC analysis was performed to predict the diagnostic effectiveness of biomarkers by “survival”, “survminer”, and “timeROC” packages. The area under the ROC curve (AUC) value was utilized to determine the diagnostic effectiveness in discriminating ITP from control samples in the GSE43177 dataset.
Validation by the Collection Clinical Sample
A total of 50 ITP patients and 20 normal samples were collected from the Xiyuan Hospital of China Academy of Chinese Medical Sciences, the basic clinical manifestations of these 50 patients were present in the Supplementary Table 1. This study was approved by the Medical Ethics Committee of the Xiyuan Hospital of China Academy of Chinese Medical Sciences (NO. 2015XLA108), informed consents were obtained from patients or their families and complies with the Declaration of Helsinki.
Quantitative Real-Time PCR
The total RNA was extracted from peripheral blood mononuclear cells of ITP patients using the TRIzol™ reagent (Ambion) according to the manufacturer’s instructions. Reverse transcription was performed using the Transcriptor First Strand cDNA Synthesis Kit (Tiangen, China), and subsequently, the cDNA was collected and stored at −80℃. Quantitative Real-Time PCR was detected by the ABI StepOnePlus™ Real-Time PCR System with Tower (United States) under the following conditions: 95℃ for 15 min, followed by 40 cycles of 10s at 95℃, and 30s at 60℃. The primer sequences of three hub genes are shown in Supplementary Table 2. Each experiment was performed in triplicate, and the relative expression of mRNA was normalized to the endogenous expression level of GAPDH through the 2–Δ Δ Ct method.
Results
Identification of Hub Gene Related to ITP
Expression variance analysis was performed with the limma package, using p<0.05 and |logFC|>1 as filtering criteria, to obtain 52 DEGs between normal and ITP samples, and the results are shown in Figure 1A. Based on these 52 DEGs, SVM-RFE analysis (Figure 1B and Supplementary Table 3) and LASSO analysis (Figure 1C and Supplementary Table 3) were performed to identify the key genes related to ITP; thus, the intersection of the SVM-RFE and LASSO regression analysis presented three common key genes (CTH, OSBP2, and TAF8) which were obtained for further analysis (Figure 1D). We noticed that the expression of CTH and TAF8 was higher, while OSBP2 was lower, in the ITP sample compared with the normal sample (Figure 1A).
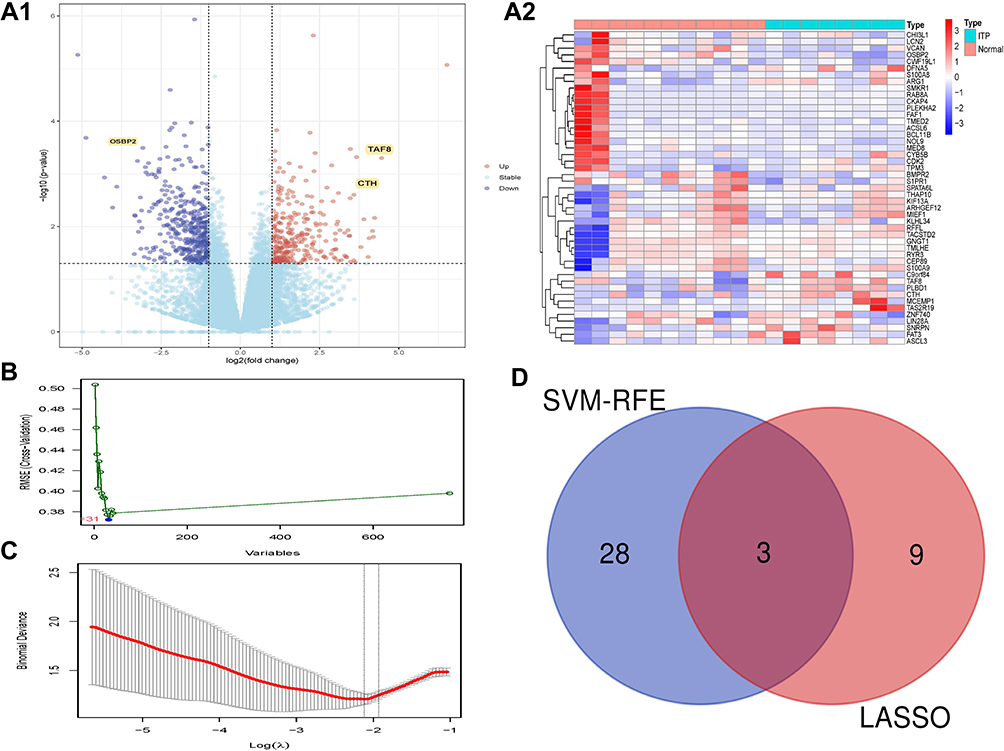 |
Figure 1 Identification of DEGs. (A) The results of DEGs. (A1) The Volcano plot of DEGs; (A2) The Heatmap of DEGs. (B) The results of SVM-RFE analyses. (C) The results of LASSO analyses. (D) The Venn diagram of the intersections of LASSO regression analysis and SVM-RFE analyses. Abbreviations: DEGs, differentially expressed genes; LASSO, least absolute shrinkage and selector operation; SVM-RFE, support vector machines-recursive feature elimination. |
Validation of Hub Genes
The above results revealed that the expression of CTH, OSBP2, and TAF8 was meaningful for the identification of ITP. We then examined the expression of these three genes in the peripheral blood of 50 ITP patients and 20 healthy controls (HCs) for validation. The results seen in Figure 2 show that the expression of CTH and TAF8 was higher in ITP patients than HCs (CTH: 1.4±0.25 vs 0.35±0.14 and TAF8: 1.49±0.29 vs 0.66±0.16, respectively) while OSBP2 expression was lower in ITP patients than HCs (1.05±0.21 vs 1.29±0.34, respectively), which was consistent with the above results.
 |
Figure 2 The expressions of hub genes in HCs and ITP groups. Yellow represents the ITP samples, blue represents the HCs samples. Abbreviations: HCs, healthy controls; ITP, primary idiopathic thrombocytopenia. |
Functional Enrichment Analysis
To better understand the role of DEGs in ITP, we then performed functional enrichment analysis. The results of DO enrichment analysis showed that DEGs were mainly associated with inflammatory immune-related diseases (Figure 3A). The results of GO enrichment analysis showed that the function of DEGs mainly focused on the regulation of vasculature development, cytokine activity, and leukocyte migration (Figure 3B), indicating that ITP might have a strong relationship with vasculature and inflammation-related factors. The results of KEGG analysis also demonstrated that these genes mainly regulate inflammation-related pathways (Figure 3C), such as the JAK-STAT signaling pathway, cytokine-cytokine receptor interaction, and Toll-like receptor signaling pathway.
 |
Figure 3 Functional enrichment analysis of DEGs. (A) The results of DO analysis. (B) The results of GO analysis. (C) The results of KEGG analysis. Abbreviations: DEGs, differentially expressed genes; DO, disease ontology; GO, gene ontology; KEGG, Kyoto Encyclopedia of Genes and Genome. |
Immune Cell Infiltration in ITP Sample
The CIBERSORT and ssGSEA analyses were performed to explore the immune microenvironment of ITP (p < 0.05). The results of the CIBERSORT analysis are presented in a histogram (Supplementary Figure 2) and a violin plot (Figure 4A), demonstrating that memory B cells, activated NK cells, M0 macrophages, and M1 macrophages were the main infiltrating immune cells. The results of ssGSEA analysis indicated that macrophages and type1 T helper cells were higher, while activated CD8 T cells, mast cells, and plasma cytodendritic cells were lower, in the ITP sample compared with those in the normal sample (Figure 4B). Subsequently, the correlation of three hub genes (CTH, OSBP2, and TAF8) and those immune cells obtained from the results of ssGSEA were evaluated (Figure 4C), demonstrating that CTH, OSBP2, and TAF8 had a closed relationship with macrophages. Specifically, the expressions of CTH (Figure 5A1 and Figure 5) and TAF8 (Figure 5A3 and Figure 5) were positively correlated with M1, while OSBP2 expression was negatively correlated with M1 (Figure 5A2 and Figure 5).
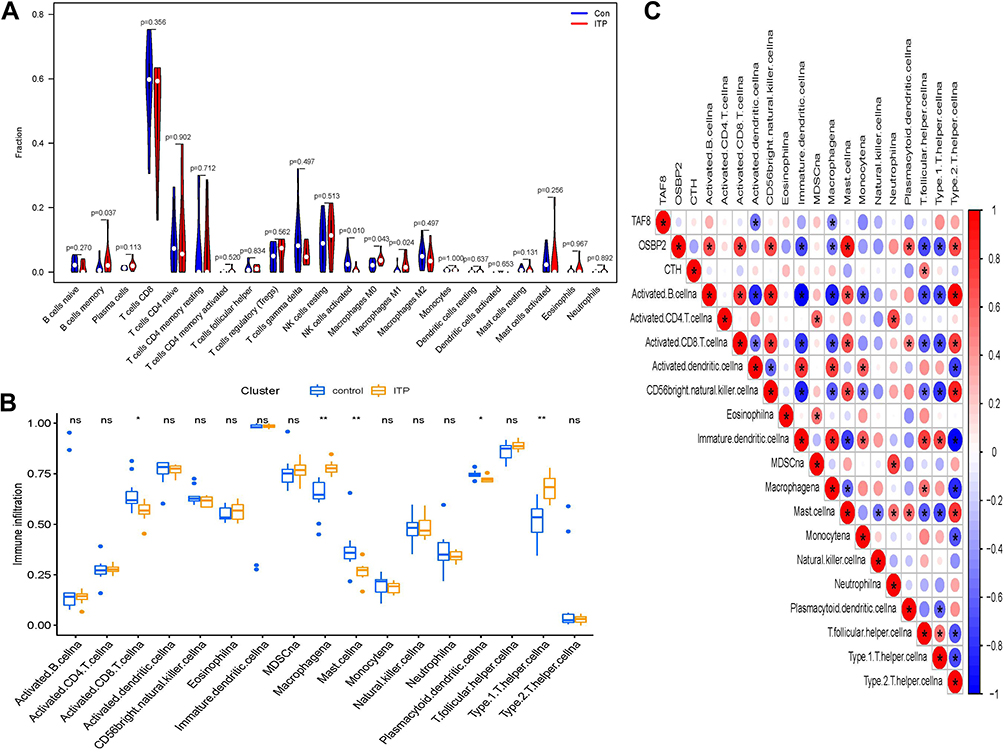 |
Figure 4 Immune cell infiltration analysis. (A) The results of CIBERSORT. (B) The results of ssGSEA analysis, *p<0.05, **p<0.01. (C) Correlation analysis based on the results of ssGSEA analysis. Blue represents negative correlation; red represents positive correlation. |
 |
Figure 5 Correlation analysis of immune cells and hub genes. (A1) Correlation analysis of CTH and immune cells. (A2) Correlation analysis of OSBP2 and immune cells. (A3) Correlation analysis of TAF8 and immune cells. (B1) The relationship of CTH and M1 macrophages. (B2) The relationship of OSBP2 and M1 macrophages. (B3) The relationship of TAF8 and M1 macrophages. |
Diagnostic Effectiveness of Biomarkers for ITP
To clarify whether the hub genes could be used as markers to distinguish healthy individuals from ITP patients, we constructed a neural network model, which contains three layers, the input layer, the hidden layer, and the output layer. In the input layer, the expressions of three hub genes of all ITP and healthy samples in the GSE43177 dataset were input and present in three neurons (I1-I3). In the hidden layer, there are five neurons representing five logistic regression operations (H1-H5). After that, two neurons were output indicating that these data were classified into two categories (O1, O2). The neurons in the hidden layer and the output layer are expressed by the activation function. To prevent excessive deviation of the regression coefficients of the function, the initial value of the bias unit (B1, B2) is set to 1, the detail were showed in Supplementary Figure 3.
Overall, the results present good discrimination between ITP patients and healthy individuals. (Figure 6A). Subsequently, the accuracy of the model was evaluated with ROC curves. As shown in Figure 6B, the model had high accuracy [AUC=0.939, 95% CI (0.8–1)], indicating that the three hub genes could be used as biomarkers for the diagnosis of ITP.
 |
Figure 6 Diagnostic effectiveness of the biomarkers for ITP. (A) The neural network model. (B) ROC analysis was used to validate the diagnostic effectiveness of the biomarkers for ITP. The blue circles represent neurons. |
Discussion
ITP is an autoimmune disease characterized by thrombocytopenia.21 Innate and adaptive immune responses play an integral role in the pathogenesis of ITP. A growing number of studies have shown that the immune microenvironment created by the activation of complex interactions among immune cells and immune infiltration is the main cause of thrombocytopenia in ITP patients.22 Currently, ITP is a diagnosis of exclusion, since effective biomarkers have not been established for diagnosis, resulting in clinical difficulties in diagnosis and misdiagnosis. Therefore, scholars have been dedicated to exploring the pathogenesis of ITP and searching for potential biomarkers, and the development of bioinformatics has provided an effective analysis method for this endeavour.23 In this study, we used a comprehensive, objective, and validated bioinformatics approach to screen core genes associated with the regulation of immune cell infiltration and to identify validated biomarkers for the diagnosis of ITP.
Initially, the DEGs between ITP patients and HCs were identified by the limma package, and functional enrichment analysis was performed to better understand the biological functions of these DEGs in ITP. The results showed that DEGs were mainly associated with inflammatory immune-related diseases, suggesting that ITP may have a strong relationship with the vascular system and inflammation-related factors, and act through pathways such as the JAK-STAT signaling pathway, cytokine-cytokine receptor interactions, and Toll-like receptor signaling.
Subsequently, SVM-RFE and LASSO analysis were performed to screen feature genes of ITP. The SVM-RFE analysis is a powerful feature selection algorithm in bioinformatics. SVM-REF can construct feature-ranking coefficients based on the weight vectors generated by the samples, and remove the feature with the smallest ranking coefficient in each iteration to obtain a decreasing ranking of all feature attributes. When the number of relevant features of the disease is large, this method can avoid the errors caused by overfitting. LASSO regression analysis is another method used to screen for disease characteristic variables.24 LASSO regression incorporates a regular term to reduce the weight of features without useful information for the purpose of reducing overfitting.24 Based on these two analysis methods, CTH, OSBP2, and TAF8 were obtained as the key genes of ITP.
The CTH gene encodes a cytoplasmic enzyme in the transsulfuration pathway, which is derived from methionine, can be converted to cysteine, and is associated with glutathione synthesis. CTH is thought to be an influential factor in platelet activation and platelet aggregation.25,26 It is also closely associated with immunity and inflammation and was found to be one of the downstream effector molecules of glucocorticoids.27,28 The TAF8 gene is a component of the universal transcription factor II D (TFIID), which plays a central role and is associated with the survival of embryonic stem cells. The deficiency of TAF8 in mouse embryonic stem cells leads to an overall reduction in cell death and transcription.29,30 The OSBP2 gene is involved in immunity, reproduction, and growth.31 Mutations in OSBP2 enhance the hematopoietic differentiation potential of pluripotent stem cells induced by juvenile granulocytic leukemia.32 In conclusion, these three genes are associated with immune function, cell differentiation, and inflammation, and help reveal the pathogenesis of ITP.
Subsequently, CIBERSORT and ssGSEA analyses were performed to explore the immune microenvironment of ITP. Type1 T helper cells, M0 macrophages, and M1 macrophages were found to be the major infiltrating immune cells. Macrophages have an effect on autoantibody-mediated platelet clearance in ITP.33 M1 and M2 macrophages have distinct phenotypes and unique characteristics; M1-like macrophages inhibit megakaryopoiesis, while M2-like macrophages promote megakaryopoiesis.13 The imbalance of M1 and M2 macrophage polarization is a novel mechanism in the pathogenesis of ITP.34 Research reveals a significant increase in the number of M1 macrophages in the spleen of ITP patients.35 M1 polarization can further lead to an increase in type 1 T helper cells, and Th1 polarization is closely related to ITP.36–38 Th1 polarization was a result of M1 polarization, thus, M1 polarization may lead to ITP, and both the predominant phenotype of M1-polarized macrophages and the elevated ratio of T helper 1 and T helper 2 lymphocytes (Th1/Th2) can contribute to the development of ITP.39,40
Therefore, the results of the CIBERSORT and ssGSEA analyses in this study are consistent with the results of previous studies. We also noted that high expression of CTH and TAF8 in ITP patients positively correlated with M1 cell expression, whereas low expression of OSBP2 in ITP patients negatively correlated with M1 cell expression. It is reported that the expression of CTH leads to defective macrophage activation.41 TAF8 was one of the TATA Box Binding Protein (TBP)-Associated Factors, which was found to be involved in macrophage-mediated inflammatory responses.42,43 OSBP2 belongs to a big family, which constitutes sterol and phosphoinositide binding/transfer proteins in eukaryotes from yeast to man, they were also proved to be related to macrophage migration.44 Finally, these results suggest that the abnormal expression of these three genes in ITP patients may be associated with M1 polarization.In summary, we believe that CTH, TAF8, and OSBP2 genes can be used as diagnostic markers for ITP; therefore, a diagnostic model of ITP was constructed by means of a neural network, and the accuracy of the model was evaluated by the ROC curve.
Neural networks are a machine learning technology that is based on many neurons called activation units, each of which is a learning model. These activation units can adopt a number of features as input to provide a logical output.45–47 The results show that our model has high accuracy, indicating that the three pivotal genes can be used as biomarkers for the diagnosis of ITP.
However, this study has certain limitations. First, the original data sample size was small and the amount of data available in the database on gene sequencing in ITP patients was limited. Secondly, this study only analyzed data from a bioinformatic approach, and further specific in vitro and in vivo functional experiments are needed to validate the data. Finally, this study only analyzed the relevant biological indicators from a single perspective and lacked multi-omics tests.
Overall, our study provides insights into the immune cells and immune infiltration associated with ITP, as well as identified validated diagnostic biomarkers for ITP (CTH, OSBP2, and TAF8) and witnessed the significant differences of biomarkers between ITP patients and HCs by clinical specimens. The expression of these three genes in ITP patients may be associated with M1 polarization. Therefore, this study may provide new implications for the diagnosis and immune mechanisms of ITP.
Conclusion
Based on the GEO dataset, we comprehensively analyzed and validated the gene expression profiles associated with ITP patients. We clarified CTH, TAF8, and OSBP2 as new diagnostic biomarkers for ITP. These markers are also proved to be associated the immune infiltration, which have good diagnostic value. Overall, we provide a potential clinical diagnostic model of the ITP in this study, which is helpful for ITP clinical practice. However, more clinical practices are still needed for further validation.
Acknowledgments
We thank all of our colleagues who contributed to this manuscript. We thank the company of Charlesworth Author Services, for English checking. Ming-Jing Wang, Ying Song, and Xiao-Qing Guo are co-first authors for this study.
Funding
This study was supported by the National Program on Key Basic Research Project (2015CB554403).
Disclosure
The authors declare that the research was conducted in the absence of any commercial or financial relationships that could be construed as a potential conflict of interest.
References
1. Tsuda H, Tsuji T, Tsuji M, et al. Life-threatening bleeding episodes in primary immune thrombocytopenia: a single-center retrospective study of 169 inpatients. Ann Hematol. 2017;96(11):1915–1920. doi:10.1007/s00277-017-3095-6
2. Moulis G, Palmaro A, Montastruc JL, et al. Epidemiology of incident immune thrombocytopenia: a nationwide population-based study in France. Blood. 2014;124(22):3308–3315. doi:10.1182/blood-2014-05-578336
3. Zufferey A, Kapur R, Semple JW. Pathogenesis and therapeutic mechanisms in Immune Thrombocytopenia (ITP). J Clin Med. 2017;6(2):16. doi:10.3390/jcm6020016
4. Cines DB, Bussel JB, Liebman HA, et al. The ITP syndrome: pathogenic and clinical diversity. Blood. 2009;113(26):6511–6521. doi:10.1182/blood-2009-01-129155
5. Khodadi E, Asnafi AA, Shahrabi S, et al. Bone marrow niche in immune thrombocytopenia: a focus on megakaryopoiesis. Ann Hematol. 2016;95(11):1765–1776. doi:10.1007/s00277-016-2703-1
6. Wang Q, Li J, Yu TS, et al. Disrupted balance of CD4+ T-cell subsets in bone marrow of patients with primary immune thrombocytopenia. Int J Biol Sci. 2019;15(13):2798–2814. doi:10.7150/ijbs.33779
7. Xu P, Jiang Y, Zuo H, et al. Vincristine-loaded platelets coated with anti-CD41 mAbs: a new macrophage targeting proposal for the treatment of immune thrombocytopenia. Biomater Sci. 2019;7(11):4568–4577. doi:10.1039/C9BM01026B
8. Chen Y, Zhang X. Pivotal regulators of tissue homeostasis and cancer: macrophages. Exp Hematol Oncol. 2017;6:23. doi:10.1186/s40164-017-0083-4
9. Laskin DL, Sunil VR, Gardner CR, et al. Macrophages and tissue injury: agents of defense or destruction? Annu Rev Pharmacol Toxicol. 2011;51(1):267–288. doi:10.1146/annurev.pharmtox.010909.105812
10. Mantovani A, Sica A, Locati M. Macrophage polarization comes of age. Immunity. 2005;23(4):344–346. doi:10.1016/j.immuni.2005.10.001
11. Liu YC, Zou XB, Chai YF, et al. Macrophage polarization in inflammatory diseases. Int J Biol Sci. 2014;10(5):520–529. doi:10.7150/ijbs.8879
12. Chang Y, Chen X, Tian Y, et al. Downregulation of microRNA-155-5p prevents immune thrombocytopenia by promoting macrophage M2 polarization via the SOCS1-dependent PD1/ PDL1 pathway. Life Sci. 2020;257:118057. doi:10.1016/j.lfs.2020.118057
13. Murray PJ, Wynn TA. Protective and pathogenic functions of macrophage subsets. Nat Rev Immunol. 2011;11(11):723–737. doi:10.1038/nri3073
14. Zhao Y, Xu P, Guo L, et al. Tumor necrosis factor-α blockade corrects monocyte/macrophage imbalance in primary immune thrombocytopenia. Thromb Haemost. 2021;121(6):767–781. doi:10.1055/s-0040-1722186
15. Shao X, Wu B, Cheng L, et al. Distinct alterations of CD68+CD163+ M2-like macrophages and myeloid-derived suppressor cells in newly diagnosed primary immune thrombocytopenia with or without CR after high-dose dexamethasone treatment. J Transl Med. 2018;16(1):48. doi:10.1186/s12967-018-1424-8
16. Di Paola A, Palumbo G, Merli P, et al. Effects of eltrombopag on in vitro macrophage polarization in pediatric immune thrombocytopenia. Int J Mol Sci. 2020;22(1):97. doi:10.3390/ijms22010097
17. Rodeghiero F, Stasi R, Gernsheimer T, et al. Standardization of terminology, definitions and outcome criteria in immune thrombocytopenic purpura of adults and children: report from an international working group. Blood. 2009;113(11):2386–2393. doi:10.1182/blood-2008-07-162503
18. Zhao X, Zhang L, Wang J, et al. Identification of key biomarkers and immune infiltration in systemic lupus erythematosus by integrated bioinformatics analysis. J Transl Med. 2021;19(1):35. doi:10.1186/s12967-020-02698-x
19. Yan H, Zheng G, Qu J, et al. Identification of key candidate genes and pathways in multiple myeloma by integrated bioinformatics analysis. J Cell Physiol. 2019;234(12):23785–23797. doi:10.1002/jcp.28947
20. Feng WY, Zhong YG. Role of Th 1- and Th 2- chemokine receptor in the diagnosis and prognosis of primary immune thrombocytopenia. Clin Lab. 2019;65(6). doi:10.7754/Clin.Lab.2018.180915
21. Yu TS, Wang HY, Zhao YJ, et al. Abnormalities of bone marrow B cells and plasma cells in primary immune thrombocytopenia. Blood Adv. 2021;5(20):4087–4101. doi:10.1182/bloodadvances.2020003860
22. Long D, Chen Y, Wu H, et al. Clinical significance and immunobiology of IL-21 in autoimmunity. J Autoimmun. 2019;99:1–14. doi:10.1016/j.jaut.2019.01.013
23. Fan Z, Wang X, Li P, et al. Systematic Identification of lncRNA-Associated ceRNA Networks in Immune Thrombocytopenia. Comput Math Methods Med. 2020;2020:6193593. doi:10.1155/2020/6193593
24. Wu TT, Chen YF, Hastie T, et al. Genome-wide association analysis by lasso penalized logistic regression. Bioinformatics. 2009;25(6):714–721. doi:10.1093/bioinformatics/btp041
25. Wang Y, Zhao Z, Shi S, et al. Calcium sensing receptor initiating cystathionine-gamma-lyase/hydrogen sulfide pathway to inhibit platelet activation in hyperhomocysteinemia rat. Exp Cell Res. 2017;358(2):171–181. doi:10.1016/j.yexcr.2017.06.013
26. Martelli A, Testai L, Breschi MC, et al. Hydrogen sulphide: novel opportunity for drug discovery. Med Res Rev. 2012;32(6):1093–1130. doi:10.1002/med.20234
27. Yao Y, Zhang X, Chen HP, et al. MicroRNA-186 promotes macrophage lipid accumulation and secretion of pro-inflammatory cytokines by targeting cystathionine γ-lyase in THP-1 macrophages. Atherosclerosis. 2016;250:122–132. doi:10.1016/j.atherosclerosis.2016.04.030
28. Zhu XY, Liu SJ, Liu YJ, et al. Glucocorticoids suppress cystathionine gamma-lyase expression and H2S production in lipopolysaccharide-treated macrophages. Cell Mol Life Sci. 2010;67(7):1119–1132. doi:10.1007/s00018-009-0250-9
29. Trowitzsch S, Viola C, Scheer E, et al. Cytoplasmic TAF2-TAF8-TAF10 complex provides evidence for nuclear holo-TFIID assembly from preformed submodules. Nat Commun. 2015;6:6011. doi:10.1038/ncomms7011
30. Demény MA, Soutoglou E, Nagy Z, et al. Identification of a small TAF complex and its role in the assembly of TAF-containing complexes. PLoS One. 2007;2(3):e316. doi:10.1371/journal.pone.0000316
31. Zhao QB, Liao RR, Sun H, et al. Identifying genetic differences between dongxiang blue-shelled and white leghorn chickens using sequencing data. G3. 2018;8(2):469–476. doi:10.1534/g3.117.300382
32. Shigemura T, Matsuda K, Kurata T, et al. Essential role of PTPN11 mutation in enhanced haematopoietic differentiation potential of induced pluripotent stem cells of juvenile myelomonocytic leukaemia. Br J Haematol. 2019;187(2):163–173. doi:10.1111/bjh.16060
33. Wynn TA, Chawla A, Pollard JW. Macrophage biology in development, homeostasis and disease. Nature. 2013;496(7446):445–455. doi:10.1038/nature12034
34. Zhao HY, Zhang YY, Xing T, et al. M2 macrophages, but not M1 macrophages, support megakaryopoiesis by upregulating PI3K-AKT pathway activity. Signal Transduct Target Ther. 2021;6(1):234. doi:10.1038/s41392-021-00627-y
35. Feng Q, Xu M, Yu YY, et al. High-dose dexamethasone or all-trans-retinoic acid restores the balance of macrophages towards M2 in immune thrombocytopenia. J Thromb Haemost. 2017;15(9):1845–1858. doi:10.1111/jth.13767
36. Mills CD, Kincaid K, Alt JM, et al. M-1/M-2 macrophages and the Th1/Th2 paradigm. J Immunol. 2000;164(12):6166–6173. doi:10.4049/jimmunol.164.12.6166
37. Hu JG, Shi LL, Chen YJ, et al. Differential effects of myelin basic protein-activated Th1 and Th2 cells on the local immune microenvironment of injured spinal cord. Exp Neurol. 2016;277:190–201. doi:10.1016/j.expneurol.2016.01.002
38. Anderson CF, Mosser DM. Cutting edge: biasing immune responses by directing antigen to macrophage Fc gamma receptors. J Immunol. 2002;168(8):3697–3701. doi:10.4049/jimmunol.168.8.3697
39. Panitsas FP, Theodoropoulou M, Kouraklis A, et al. Adult chronic idiopathic thrombocytopenic purpura (ITP) is the manifestation of a type-1 polarized immune response. Blood. 2004;103(7):2645–2647. doi:10.1182/blood-2003-07-2268
40. Krausgruber T, Blazek K, Smallie T, et al. IRF5 promotes inflammatory macrophage polarization and TH1-TH17 responses. Nat Immunol. 2011;12(3):231–238. doi:10.1038/ni.1990
41. Gobert AP, Latour YL, Asim M, et al. Bacterial pathogens hijack the innate immune response by activation of the reverse transsulfuration pathway. mBio. 2019;10(5):e02174–e02219. doi:10.1128/mBio.02174-19
42. Tjitro R, Campbell LA, Basova L, et al. Modeling the function of TATA box binding protein in transcriptional changes induced by HIV-1 tat in innate immune cells and the effect of methamphetamine exposure. Front Immunol. 2019;9:3110. doi:10.3389/fimmu.2018.03110
43. Delgado M, Ganea D. Vasoactive intestinal peptide and pituitary adenylate cyclase-activating polypeptide inhibit nuclear factor-kappa B-dependent gene activation at multiple levels in the human monocytic cell line THP-1. J Biol Chem. 2001;276(1):369–380. doi:10.1074/jbc.M006923200
44. Weber-Boyvat M, Zhong W, Yan D, et al. Oxysterol-binding proteins: functions in cell regulation beyond lipid metabolism. Biochem Pharmacol. 2013;86(1):89–95. doi:10.1016/j.bcp.2013.02.016
45. Kriegeskorte N, Golan T. Neural network models and deep learning. Curr Biol. 2019;29(7):R231–R236. doi:10.1016/j.cub.2019.02.034
46. Barrett DG, Morcos AS, Macke JH. Analyzing biological and artificial neural networks: challenges with opportunities for synergy? Curr Opin Neurobiol. 2019;55:55–64. doi:10.1016/j.conb.2019.01.007
47. Kaul P, Lall B. Riemannian curvature of deep neural networks. IEEE Trans Neural Netw Learn Syst. 2020;31(4):1410–1416. doi:10.1109/TNNLS.2019.2919705
 © 2022 The Author(s). This work is published and licensed by Dove Medical Press Limited. The
full terms of this license are available at https://www.dovepress.com/terms
and incorporate the Creative Commons Attribution
- Non Commercial (unported, 3.0) License.
By accessing the work you hereby accept the Terms. Non-commercial uses of the work are permitted
without any further permission from Dove Medical Press Limited, provided the work is properly
attributed. For permission for commercial use of this work, please see paragraphs 4.2 and 5 of our Terms.
© 2022 The Author(s). This work is published and licensed by Dove Medical Press Limited. The
full terms of this license are available at https://www.dovepress.com/terms
and incorporate the Creative Commons Attribution
- Non Commercial (unported, 3.0) License.
By accessing the work you hereby accept the Terms. Non-commercial uses of the work are permitted
without any further permission from Dove Medical Press Limited, provided the work is properly
attributed. For permission for commercial use of this work, please see paragraphs 4.2 and 5 of our Terms.
Recommended articles
Identification and Clinical Correlation Analysis of IFI44 in Systemic Lupus Erythematosus Combined with Bioinformatics and Immune Infiltration Analysis
Wang Y, Ma C, Ma Z, Yang M, Pu J, Ma X, Wu X, Peng L, Huo Z, Dang J
Journal of Inflammation Research 2023, 16:3219-3231
Published Date: 1 August 2023
Network Analysis of Osteoarthritis Progression Using a Steiner Minimal Tree Algorithm
Xie Y, Shao F, Ji Y, Feng D, Wang L, Huang Z, Wu S, Sun F, Jiang H, Miyamoto A, Wang H, Zhang C
Journal of Inflammation Research 2024, 17:3201-3209
Published Date: 18 May 2024
Integrated Bioinformatics Analysis for Revealing CBL is a Potential Diagnosing Biomarker and Related Immune Infiltration in Parkinson’s Disease
Chen Y, Tu Y, Yan G, Ji X, Chen S, Niu C, Liao P
International Journal of General Medicine 2024, 17:2371-2386
Published Date: 22 May 2024
Identifying the Potential Diagnostic Gene Biomarkers and Forecasting the Potential Therapeutic Agents for Advanced Diabetic Nephropathy Based on Pyroptosis and Ferroptosis
Dai Q, Huang S, Fang Y, Ding X
Journal of Inflammation Research 2024, 17:5763-5779
Published Date: 29 August 2024
Causal Implication of CD52-Driven Immune Dysregulation in Sarcopenic Obesity: Integrating Mendelian Randomization and Multiomics Profiling
Xuekelati S, Abulitifu Y, Maimaitiwusiman Z, Xu L, Guo S, Xu Q, Ke J, Wang H
Clinical Interventions in Aging 2026, 21:570497
Published Date: 16 February 2026