Back to Journals » Journal of Inflammation Research » Volume 16
Identification and Clinical Correlation Analysis of IFI44 in Systemic Lupus Erythematosus Combined with Bioinformatics and Immune Infiltration Analysis
Authors Wang Y ![]() , Ma C, Ma Z
, Ma C, Ma Z ![]() , Yang M
, Yang M ![]() , Pu J, Ma X, Wu X, Peng L, Huo Z, Dang J
, Pu J, Ma X, Wu X, Peng L, Huo Z, Dang J
Received 30 May 2023
Accepted for publication 17 July 2023
Published 1 August 2023 Volume 2023:16 Pages 3219—3231
DOI https://doi.org/10.2147/JIR.S419880
Checked for plagiarism Yes
Review by Single anonymous peer review
Peer reviewer comments 2
Editor who approved publication: Professor Ning Quan
Yuan Wang,1– 3 Chengfeng Ma,1,2 Zhanbing Ma,1,2 Mengyi Yang,1,2 Jing Pu,1,2 Xiuhui Ma,1,2 Xi Wu,1,2 Liang Peng,1,2 Zhenghao Huo,1,2,* Jie Dang1,2,*
1School of Basic Medicine, Ningxia Medical University, Yinchuan, Ningxia, People’s Republic of China; 2Key Laboratory of Fertility Preservation and Maintenance of the Ministry of Education, Ningxia Medical University, Yinchuan, Ningxia, People’s Republic of China; 3Department of Dermatology, General Hospital of Ningxia Medical University, Yinchuan, Ningxia, People’s Republic of China
*These authors contributed equally to this work
Correspondence: Jie Dang; Zhenghao Huo, Department of Medical Genetics and Cell Biology, School of Basic Medicine, Ningxia Medical University, 1160 Shengli Street, Yinchuan, Ningxia, 750001, People’s Republic of China, Tel/Fax +86-951-6980049, Email [email protected]
Purpose: Systemic lupus erythematosus (SLE) is a chronic autoimmune disease that can cause systemic damage to multiple organs. This study aims to analyze the value and function of IFI44 in the diagnosis and pathology of SLE by bioinformatics and immune infiltration analysis.
Patients and Methods: GSE49454 and GSE65391 of SLE were obtained from the GEO dataset, and R software was employed to identify DEGs and investigate their functions. The PPI network was utilized to identify hub genes associated with SLE. CIBERSORT was used to assess differences in immune cell infiltration in SLE patients and controls. ROC curve analysis was performed to evaluate the diagnostic value of IFI44 in SLE. The expression of IFI44 in PBMCs was detected by RT-qPCR, and the correlation between IFI44 expression and SLE-related clinical indicators was analyzed.
Results: A total of 65 DEGs were identified from the GSE49454 and GSE65391 databases. Through PPI analysis, IFI44 and RSAD2 were identified as significantly aberrantly expressed in SLE patients. SLE patients and controls showed a significant difference in the proportion of immune cell infiltration. IFI44 expression was positively correlated with activated DCs, monocytes, PCs, neutrophils, and activated memory CD4+T cells, while negatively correlated with M0 and CD8+T cells. The expression of IFI44 was significantly higher in SLE patients (P< 0.01), especially in male patients (P=0.0376). ROC curve analysis demonstrated that IFI44 had a high diagnostic value for SLE. Correlation analysis indicated that IFI44 expression was correlated with levels of RBC, HGB, HCT, IgA, ESR, UPRO, C3, C4, and ENA in SLE patients.
Conclusion: IFI44 may play a role in the pathogenesis of SLE by influencing the immune microenvironment of SLE patients, and thus has the potential to serve as a diagnostic marker and therapeutic target for SLE.
Keywords: systemic lupus erythematosus, IFI44, bioinformatics, immune cell infiltration, sexual dimorphism
Introduction
Systemic lupus erythematosus (SLE) is an autoimmune disease in which the immune system attacks the body’s own tissues, causing widespread inflammation and tissue damage in affected organs. SLE is most commonly diagnosed between the ages of 20 and 30, with a male-to-female ratio of 1:9.1 Incidence and prevalence of SLE vary widely among different geographic regions, with the highest reported rates in North America and the lowest in Africa and Australia.2 Although the exact cause of SLE is not well understood, it is known to involve a complex interaction of environmental, genetic, and epigenetic factors.3 Treatment for SLE patients depends on the presentation and activity of the disease, with the ultimate goal of achieving remission or reducing disease activity through various immunoregulatory and immunosuppressive therapies.
Strong activation of complement and production of type I interferon (IFN) are key factors in the pathogenesis of SLE. Type I IFN promote immune response activation to nucleic acids and their associated proteins, resulting in autoantibody production, immune complex formation, and organ inflammation.4 Patients with elevated type I IFN signatures are more likely to develop lupus nephritis, which is inflammation of the kidneys that can lead to impaired function and kidney failure.5 Several cross-sectional studies have shown that IFN markers are associated with disease activity and severe SLE involving the kidneys, hematopoietic system, and nervous system.6 The level of ISG15, a marker of IFN activation, is significantly higher in SLE patients compared to healthy controls and is associated with SLE disease activity index and serositis.7 Studies have also demonstrated significantly higher expression of IFIT4 mRNA and protein in PBMCs and monocytes of SLE patients compared to healthy controls. Additionally, there is a positive correlation between IFIT4 expression and anti-nuclear antibody (ANA), anti-dsDNA, and anti-SM autoimmune antibody in SLE.8 Shen et al found that IFI44, USP18, and RASD2 were highly expressed in SLE patients and had good diagnostic ability for systemic lupus erythematosus.9 In a recently published article, Zhang et al found that the expression of IFI44L was significantly elevated in SLE and was closely related to the novel polymorphism rs273259 of IFI44L. Their study confirmed that the rs273259 AG genotype could significantly promote the expression of IFI44L.10
As a result, treatments aimed at targeting type I IFN have been proposed. In recent years, Anifrolumab, an antibody against the type I IFN receptor, has shown promising results in patients with high expression of IFN-related genes, particularly in Asians who are genetically predisposed to such high expression.6 Furthermore, some scholars have suggested that stratified treatment of SLE based on differences in IFN-related gene expression may facilitate the implementation of precision medicine approaches.11
Currently, the diagnosis and treatment of SLE largely rely on clinical manifestations and laboratory indicators. However, due to the differences in individual patients and genetic backgrounds, the sensitivity and specificity of their diagnosis are low, which cannot meet the requirements of precision treatment. Recently, a growing body of literature suggests that systematic bioinformatics analysis and clinical validation have led to the identification of several biomarkers with important reference values for the early diagnosis and treatment of SLE. In our study, differentially expressed genes were obtained from two datasets, then hub genes were obtained by protein-protein interaction (PPI) network analysis, and their correlation with immunoinfiltrating cells and laboratory indicators in SLE patients was determined by clinical correlation analysis. The hub gene IFI44, which was found to be significantly overexpressed in SLE through analysis of SLE gene expression databases GSE49454 and GSE65391, exhibited a significant correlation with SLE clinical laboratory indicators and demonstrated good diagnostic value. Human IFI44L and IFI44 are part of the newly discovered IFN inducer family and are closely associated with various viral infections. Although the structure and function of IFI44L and IFI44 are not extensively studied, it has been confirmed that they are among the induction genes of IFN-α, and their mRNA levels can reflect the plasma activity of IFN-α in SLE patients.12 Our study aims to further investigate the role and potential mechanisms of IFI44 in the pathogenesis of SLE, which may lay the foundation for a deeper understanding of SLE pathogenesis and the identification of new diagnostic and therapeutic markers.
Materials and Methods
Access to GEO Datasets
The expression profile of “Systemic lupus erythematosus” was searched in the GEO database. Studies that met the following criteria were included:1) whole-genome expression data for SLE, 2) data sets with more than 5 samples in the same platform, and 3) data sets with complete sample information. Finally, GSE49454 and GSE65391 were obtained, which consist of 157 and 924 SLE patients, and 20 and 72 healthy control samples, respectively. These datasets were based on the Agilent GPL10558 platform (Illumina HumanHT-12 V4.0 expression bead chip).
Identification of DEGs
R version 4.1.3 was used for processing raw data and screening differentially expressed genes (DEGs). The “limma” package was utilized to identify DEGs in SLE patients compared to healthy controls. The threshold criteria for significance were set as |log2FC|≥1 and P<0.05. Venn online tool (http://bioinformatics.psb.ugent.be/webtools/Venn/) was used to draw Venn diagrams to identify overlapping DEGs between different datasets, which were then retained for further analysis.
Functional Enrichment Analysis of DEGs
To determine the functions of overlapping DEGs, an enrichment analysis was performed on Gene Ontology (GO) and the Kyoto Encyclopedia of Gene and Genomes (KEGG). GO is a major bioinformatic tool for gene annotation that uses a highly structured vocabulary comprising three main categories: biological processes (BP), cellular components (CC), and molecular functions (MF). KEGG is a database for associating related genes by pathways. Related biological functions and signaling pathways were analyzed using GO/KEGG enrichment and analyzed again with the cluster Profiler package, with P< 0.05 considered statistically significant.
Construction of PPI Network and Identification and Validation of Hub Genes
STRING (http://string-db.org; version 10.5) was used to perform functional interaction analysis and construct a protein-protein interaction (PPI) network. A confidence score of >0.4 was considered statistically significant. The resulting PPI network was visualized using Cytoscape software to facilitate better visualization and interpretation of the interactions between proteins. To identify key genes in the PPI network, the Cytoscape plugin CytoHubba was used. CytoHubba provides various methods for detecting key genes or nodes in a network based on different centrality measures, including Betweenness, Stress, Radiality, Eccentricity, Degree of Node Connection (Degree), Density of Maximum Neighbourhood Component (DMNC), Edge Percolated Component (EPC), Maximum Clique Centrality (MCC), Closeness node connection closeness (Closeness), Maximum Neighbourhood Component (MNC), and BottleNeck. For each method, the top 20 genes with the highest scores were extracted, and the intersection of these genes from all 11 methods was taken to identify the key genes in the PPI network, which are likely to play important roles in the pathogenesis of SLE.
Immune Cell Composition
The CIBERSORT algorithm was utilized to calculate the ratios of various immune cells in SLE patients and healthy controls based on the gene expression matrix. The R package “ggboxplot” was used to visualize the proportions of 22 immune cell types in SLE patients and healthy controls. Pearson correlation test was used to analyze the correlation between 22 immune cells and key genes, and the results were visualized using the “ggplot2” R package.
Clinical and Laboratory Diagnosis of SLE
The research proposal has been approved by the Ethics Committee of Ningxia Medical University (approval number: 061-2019) and is in line with the Declaration of Helsinki. Informed consent was obtained from all participants, including 24 patients with SLE (with a mean age of 37.6±12.96 years) and 23 healthy controls (with a mean age of 35.7±10.85 years), who were recruited from the Department of Rheumatology and Immunology at Ningxia Medical University General Hospital between June 2020 and 2021.SLE patients were diagnosed according to the criteria of the American College of Rheumatology (1997), which is a widely accepted classification criterion for SLE. Patients with a history of other autoimmune diseases, hematological-related diseases, malignant tumors, and the use of immunosuppressants and hormones were excluded. The global disease activity of SLE patients was assessed using the SLE Disease Activity Index (SLEDAI) score. There were 16 participants with SLEDAI≥9 and 8 participants with SLEDAI < 9. The clinical data of SLE patients may include White blood cell count (WBC), Red blood cell count (RBC), Hemoglobin level (HGB), Platelet count (PLT), Red blood cell distribution width (RDW-SD), Red blood cell-specific volume (HCT), Mean corpuscular volume (MCV), Mean corpuscular hemoglobin (MCH), Mean corpuscular hemoglobin concentration (MCHC), Complement Component 3 (C3), Complement Component 4 (C4), Immunoglobulin G (IgG), Immunoglobulin A (IgA), Immunoglobulin M (IgM), C-reactive protein (CRP), Erythrocyte sedimentation rate (ESR), Anti-cardiolipin antibody (ACA), Anti-dsDNA antibody, Antinuclear antibody (ANA), Anti-Sm antibody, Anti-U1RNP antibody, Anti-SSA antibody, Anti-SSB antibody, Anti-Jo-1 antibody, Anti-SCL-70 antibody, Anti-Rib antibody, Anti-Ro antibody, Urine protein (UPRO), Serum creatinine (CREA), Serum urea (UREA), SLEDAI score.
Detection of IFI44 Gene Expression by RT-qPCR
Peripheral blood from all subjects was collected in ethylene diamine tetraacetic acid (EDTA) tubes. PBMCs were isolated by centrifugation with Ficoll-Paque (Sigma-Aldrich) density gradient. Total RNA from PBMCs was extracted by TRizol reagent (Thermo Fisher Scientific, USA), and RNA concentration was assessed by Nanodrop 2000 spectrophotometry (Thermo Fisher Scientific, USA). Total RNA was reverse transcribed into cDNA using a reverse transcription kit (Thermo Fisher Scientific, USA). Real-time PCR quantification (RT-qPCR) was performed in Quantstudio M7 Flex Real-time PCR System (Applied Biosystems) using SYBR Green Real-time Quantitative PCR Kit (Thermo Fisher Scientific, USA). RT-qPCR primer sequences were IFI44 forward: 5′-GAAGGGAGTTGGTAAACGCTGGTG-3′, IFI44 reverse: 5′-TGGACCTCACAGGCTCACATCTC-3′; GAPDH forward: 5′-CAGGAGGCATTGCTGATGAT-3′, GAPDH reverse 5′-GAAGGCTGGGGCTCATTT-3′.
Statistical Analysis
The statistical analysis was performed using R version 4.1.3 for bioinformatics analysis. P-values or adjusted P-values <0.05 were considered statistically significant. Student’s t-test was used to compare the two sets of data, while Pearson and Spearman correlation tests were used for nonparametric variables. For the analysis of clinical and experimental data, SPSS 23.0 and GraphPad Prism 8 software were employed. A significance level of P-value <0.05 was considered statistically significant.
Results
Identification of DEGs
The high throughput analysis was performed on two microarray datasets, GSE49454 and GSE65391, after normalizing the chip results. In the GSE49454 series, 85 DEGs were identified between SLE patients and healthy controls, while in the GSE65391 series, 113 DEGs were identified. All DEGs were visualized using a volcano plot (Figure 1A and B). To further identify the key genes, a Venn map was plotted to obtain a total of 65 DEGs that were common in both datasets (Figure 1C).
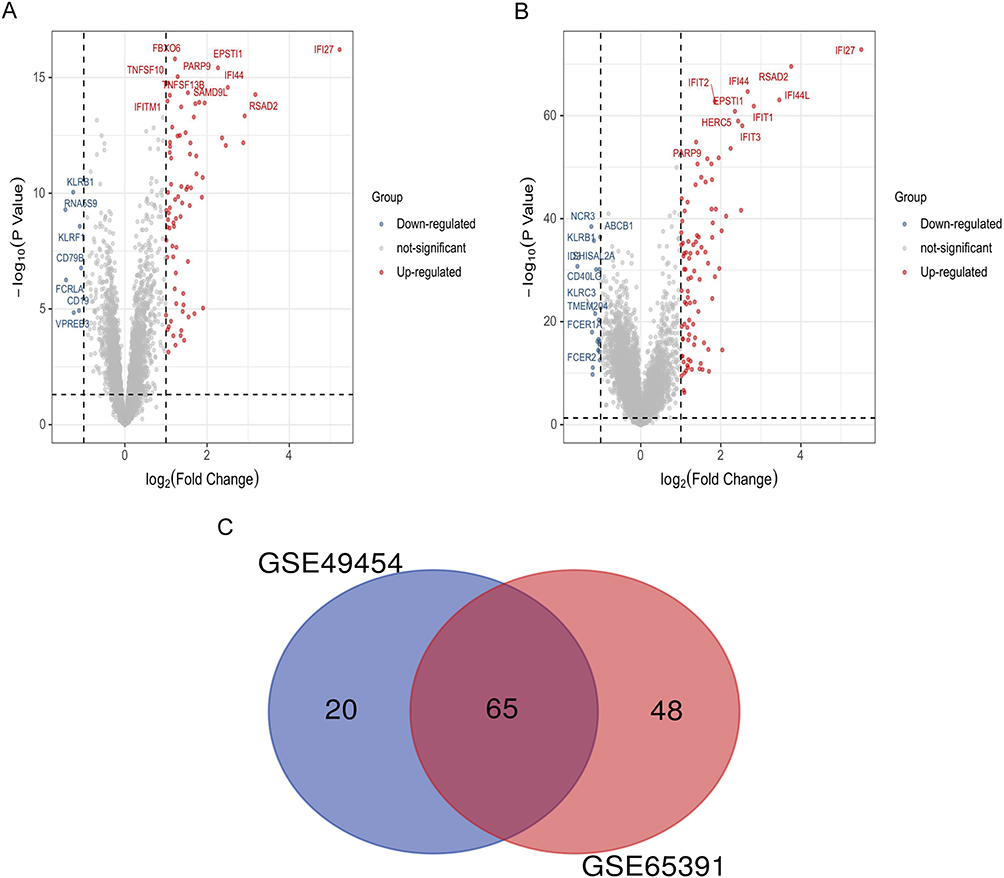 |
Figure 1 Identification of DEGs between SLE and healthy controls. (A) Volcano plot illustrating 85 DEGs identified in GSE49454. (B) Volcano plot illustrating 113 DEGs identified in GSE65391. (C) Venn map showing 65 overlapping DEGs between the two datasets. Abbreviations: DEG, Differentially Expressed Gene; SLE, systemic lupus erythematosus. |
GO and KEGG Pathway Enrichment Analysis
To gain insights into the potential biological functions of DEGs, GO term and KEGG pathway enrichment analyses were conducted. Enriched GO terms included virus response, type I interferon signaling pathway, and cellular response to type I interferon (Figure 2A). Moreover, enriched genes for specific GO terms are plotted through the gene-concept network (Figure 2B). Enriched KEGG pathways, including hepatitis, NOD-like receptor signaling pathway, and IL-17 signaling pathway (Figure 2C). The enriched genes for specific KEGG pathways were plotted in Figure 2D.
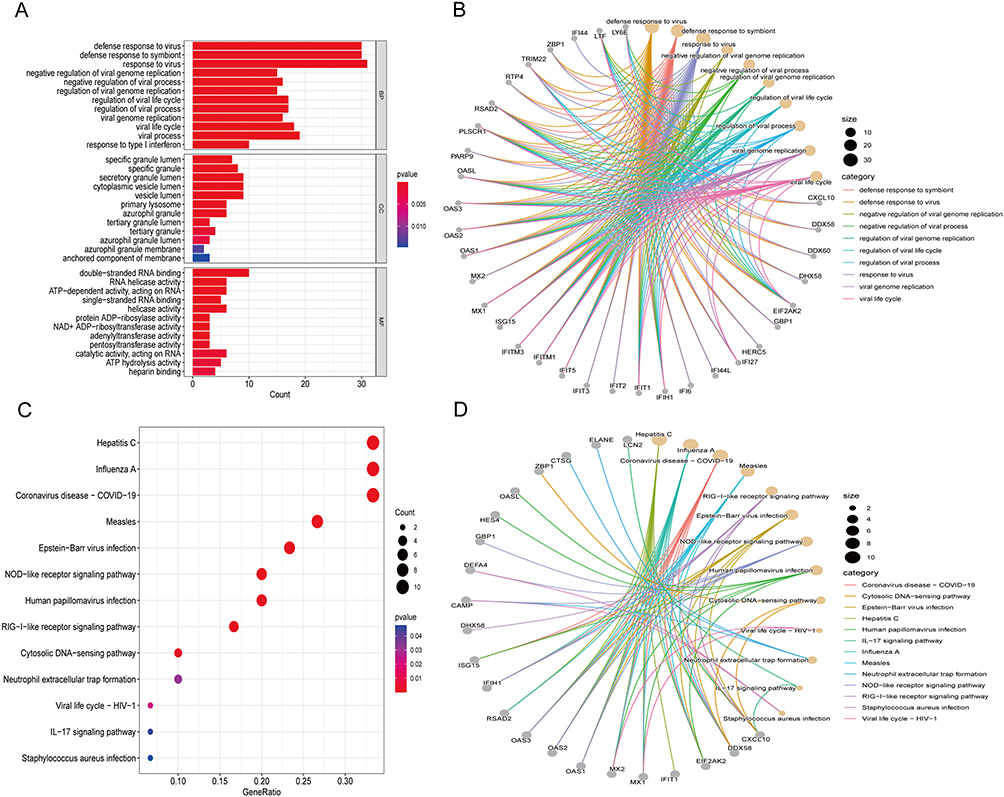 |
Figure 2 Functional enrichment based on DEGs. GO analysis for DEGs showing significant terms through (A) A bar plot and specific genes associated with these terms through (B) A gene-concept network. KEGG analysis for DEGs indicates enriched pathways via (C) A bubble plot and specific genes associated with these pathways through (D) A gene-concept network. Abbreviations: GO, Gene Ontology; BP, biological processes; CC, cellular components; MF, molecular functions; KEGG, Kyoto Encyclopedia of Genes and Genomes. |
PPI Network and Its Hub Modules
The PPI network was constructed to understand the interactions between DEGs (Figure 3A) and to further elucidate highly connected genes in the PPI network, 11 approaches were applied. According to the intersection of the first 20 genes in all 11 methods (Betweenness, Stress, Radiality, Eccentricity, Degree, DMNC, EPC, MCC, Closeness, MNC, and BottleNeck), we take the intersection of 11 methods to acquire two hub genes IFI44 and RSAD2 by drawing upset plots (Figure 3B). The first 20 genes obtained by each method are listed in Supplemental Table 1.
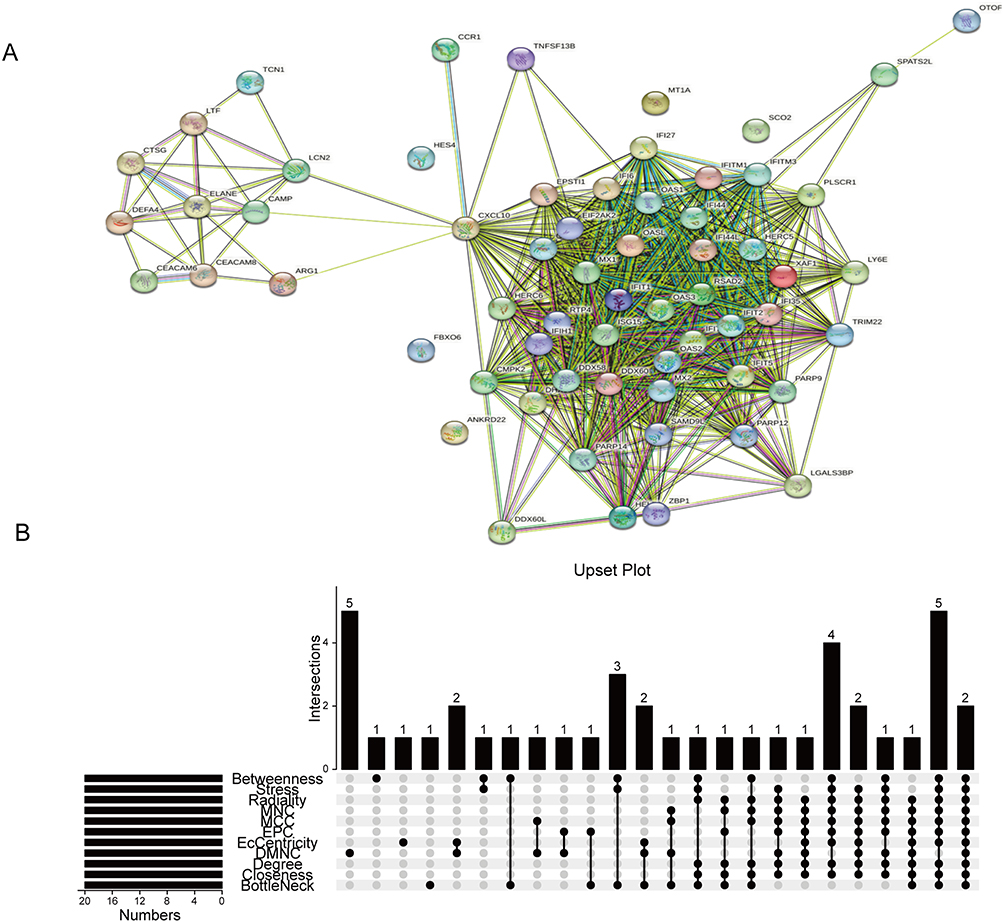 |
Figure 3 Identification of IFI44 and RSAD2 by cross-linking genes from 11 ranking methods in the PPI network. (A) The PPI network acquired from the STRING database. (B) Upset plot representing the intersection between 11 ranking methods. Abbreviations: PPI, protein-protein interaction; MNC, Maximum Neighborhood Component; MCC, Maximum Clique Centrality; EPC, Edge-Percolated Component; DMNC, Density of Maximum Neighborhood Component; Degree, Degree of Node Connection; Closeness, Closeness node connection closeness. |
Immune Cell Infiltration Results
Given that SLE is an autoimmune disease with immune cells playing crucial roles in disease progression, we analyzed to compare immune infiltration in SLE and healthy controls using gene expression data from GSE49454 and GSE65391. The infiltration of 22 types of immune cells in each sample was calculated using CIBERSORT. Our findings revealed significant differences in the infiltration of most immune cells between SLE and control samples (Figure 4A and B). Furthermore, we observed that the expression of IFI44 was positively correlated with activated dendritic cells (DCs), monocytes, plasma cells (PCs), neutrophils, and activated memory CD4+ T cells, while negatively correlated with macrophages (M0), CD8+ T cells, and gamma delta T cells (γδ T) in these two data (Figure 4C and D). These findings suggest that IFI44 may be involved in the development of SLE by aberrantly regulating the interaction between these immune cell types and the immune environment.
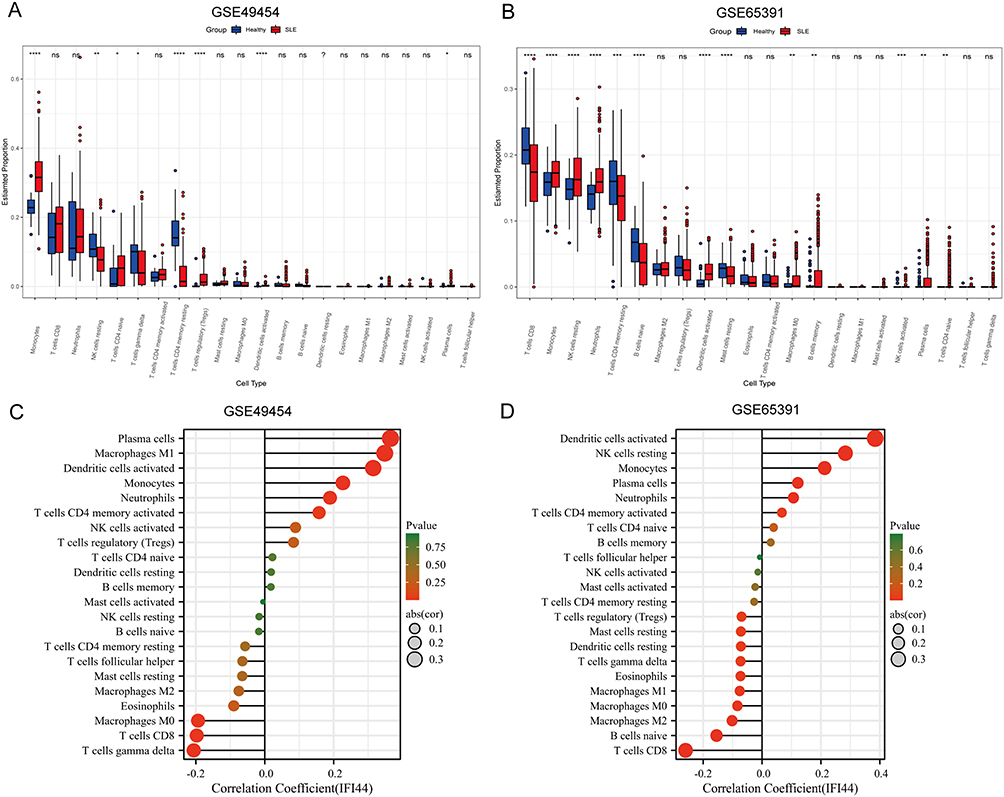 |
Figure 4 The relationship between diagnostic biomarkers and immune cell infiltration in SLE and healthy controls. Box plot of 22 types of immune cell infiltration in SLE and healthy controls in GSE49454 (A) and GSE65391 (B). The size of the dots represents the strength of the correlation between IFI44 expression and infiltrating immune cells in GSE49454 (C) and GSE65391 (D), with the color of the dots representing the corresponding P-values. Statistical significance was defined as P< 0.05. |
Analysis of IFI44 Expression and Clinical Indicators of SLE
We focused on analyzing the expression of IFI44 in SLE and its relationship with clinical indicators, building upon our previous bioinformatics analysis that suggested the potential role of IFI44 in SLE pathogenesis. RT-qPCR was conducted to analyze the expression of IFI44 in all subjects. The results revealed that IFI44 expression was significantly higher in the SLE patients compared to the healthy controls (P<0.01). Interestingly, the expression of IFI44 was significantly higher in male SLE patients compared to female SLE patients (P=0.0376), suggesting a potential association between IFI44 and sexual dimorphism in SLE (Figure 5A). Further analysis using ROC curve analysis showed that IFI44 had a high diagnostic value for SLE, with a sensitivity of 79.2%, specificity of 82.6%, and an area under the ROC curve (AUC) of 0.885 (95% CI: 0.786–0.984) (Figure 5B).
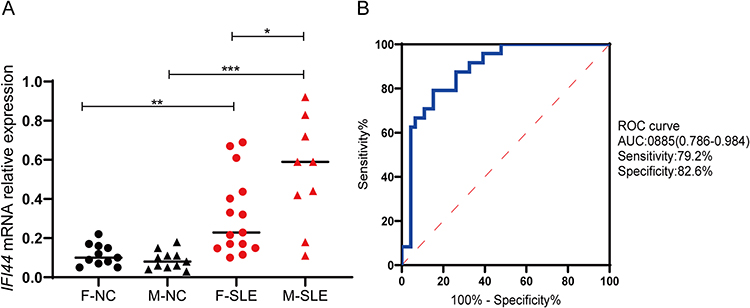 |
Figure 5 Relative expression in SLE patients and healthy controls. (A) The expression of IFI44 was significantly increased in SLE patients compared to healthy controls, and it was significantly upregulated in male patients (*P<0.05, **P<0.01, ***P <0.001). (B) The diagnostic value of IFI44 in SLE. Abbreviations: F, female; M, male; NC, healthy control; AUC, area under the curve. |
We also investigated the relationship between IFI44 expression level and laboratory indicators in SLE patients (Table 1). In all SLE patients, IFI44 expression showed negative correlations with IgA (rs=−0.454, P=0.026), RBC (rs=−0.505, P=0.012), HCT (rs=−0.463, P=0.023), and HGB (rs=−0.488, P=0.015), while exhibiting positive correlations with ESR (rs=0.442, P=0.031) and UPRO (rs=0.556, P=0.0048) (Figure 6A–F). In male SLE patients, IFI44 expression was negatively correlated with C3 (rs=−0.710, P=0.032) and C4 (rs=−0.732, P=0.025), and positively correlated with ESR (rs=0.703, P=0.035) and ANA (rs=0.730, P=0.026) (Figure 7A–D). In female SLE patients, IFI44 expression showed negative correlations with HGB (rs=−0.572, P=0.026) and HCT (rs=−0.549, P=0.034) (Figure 7E and F).
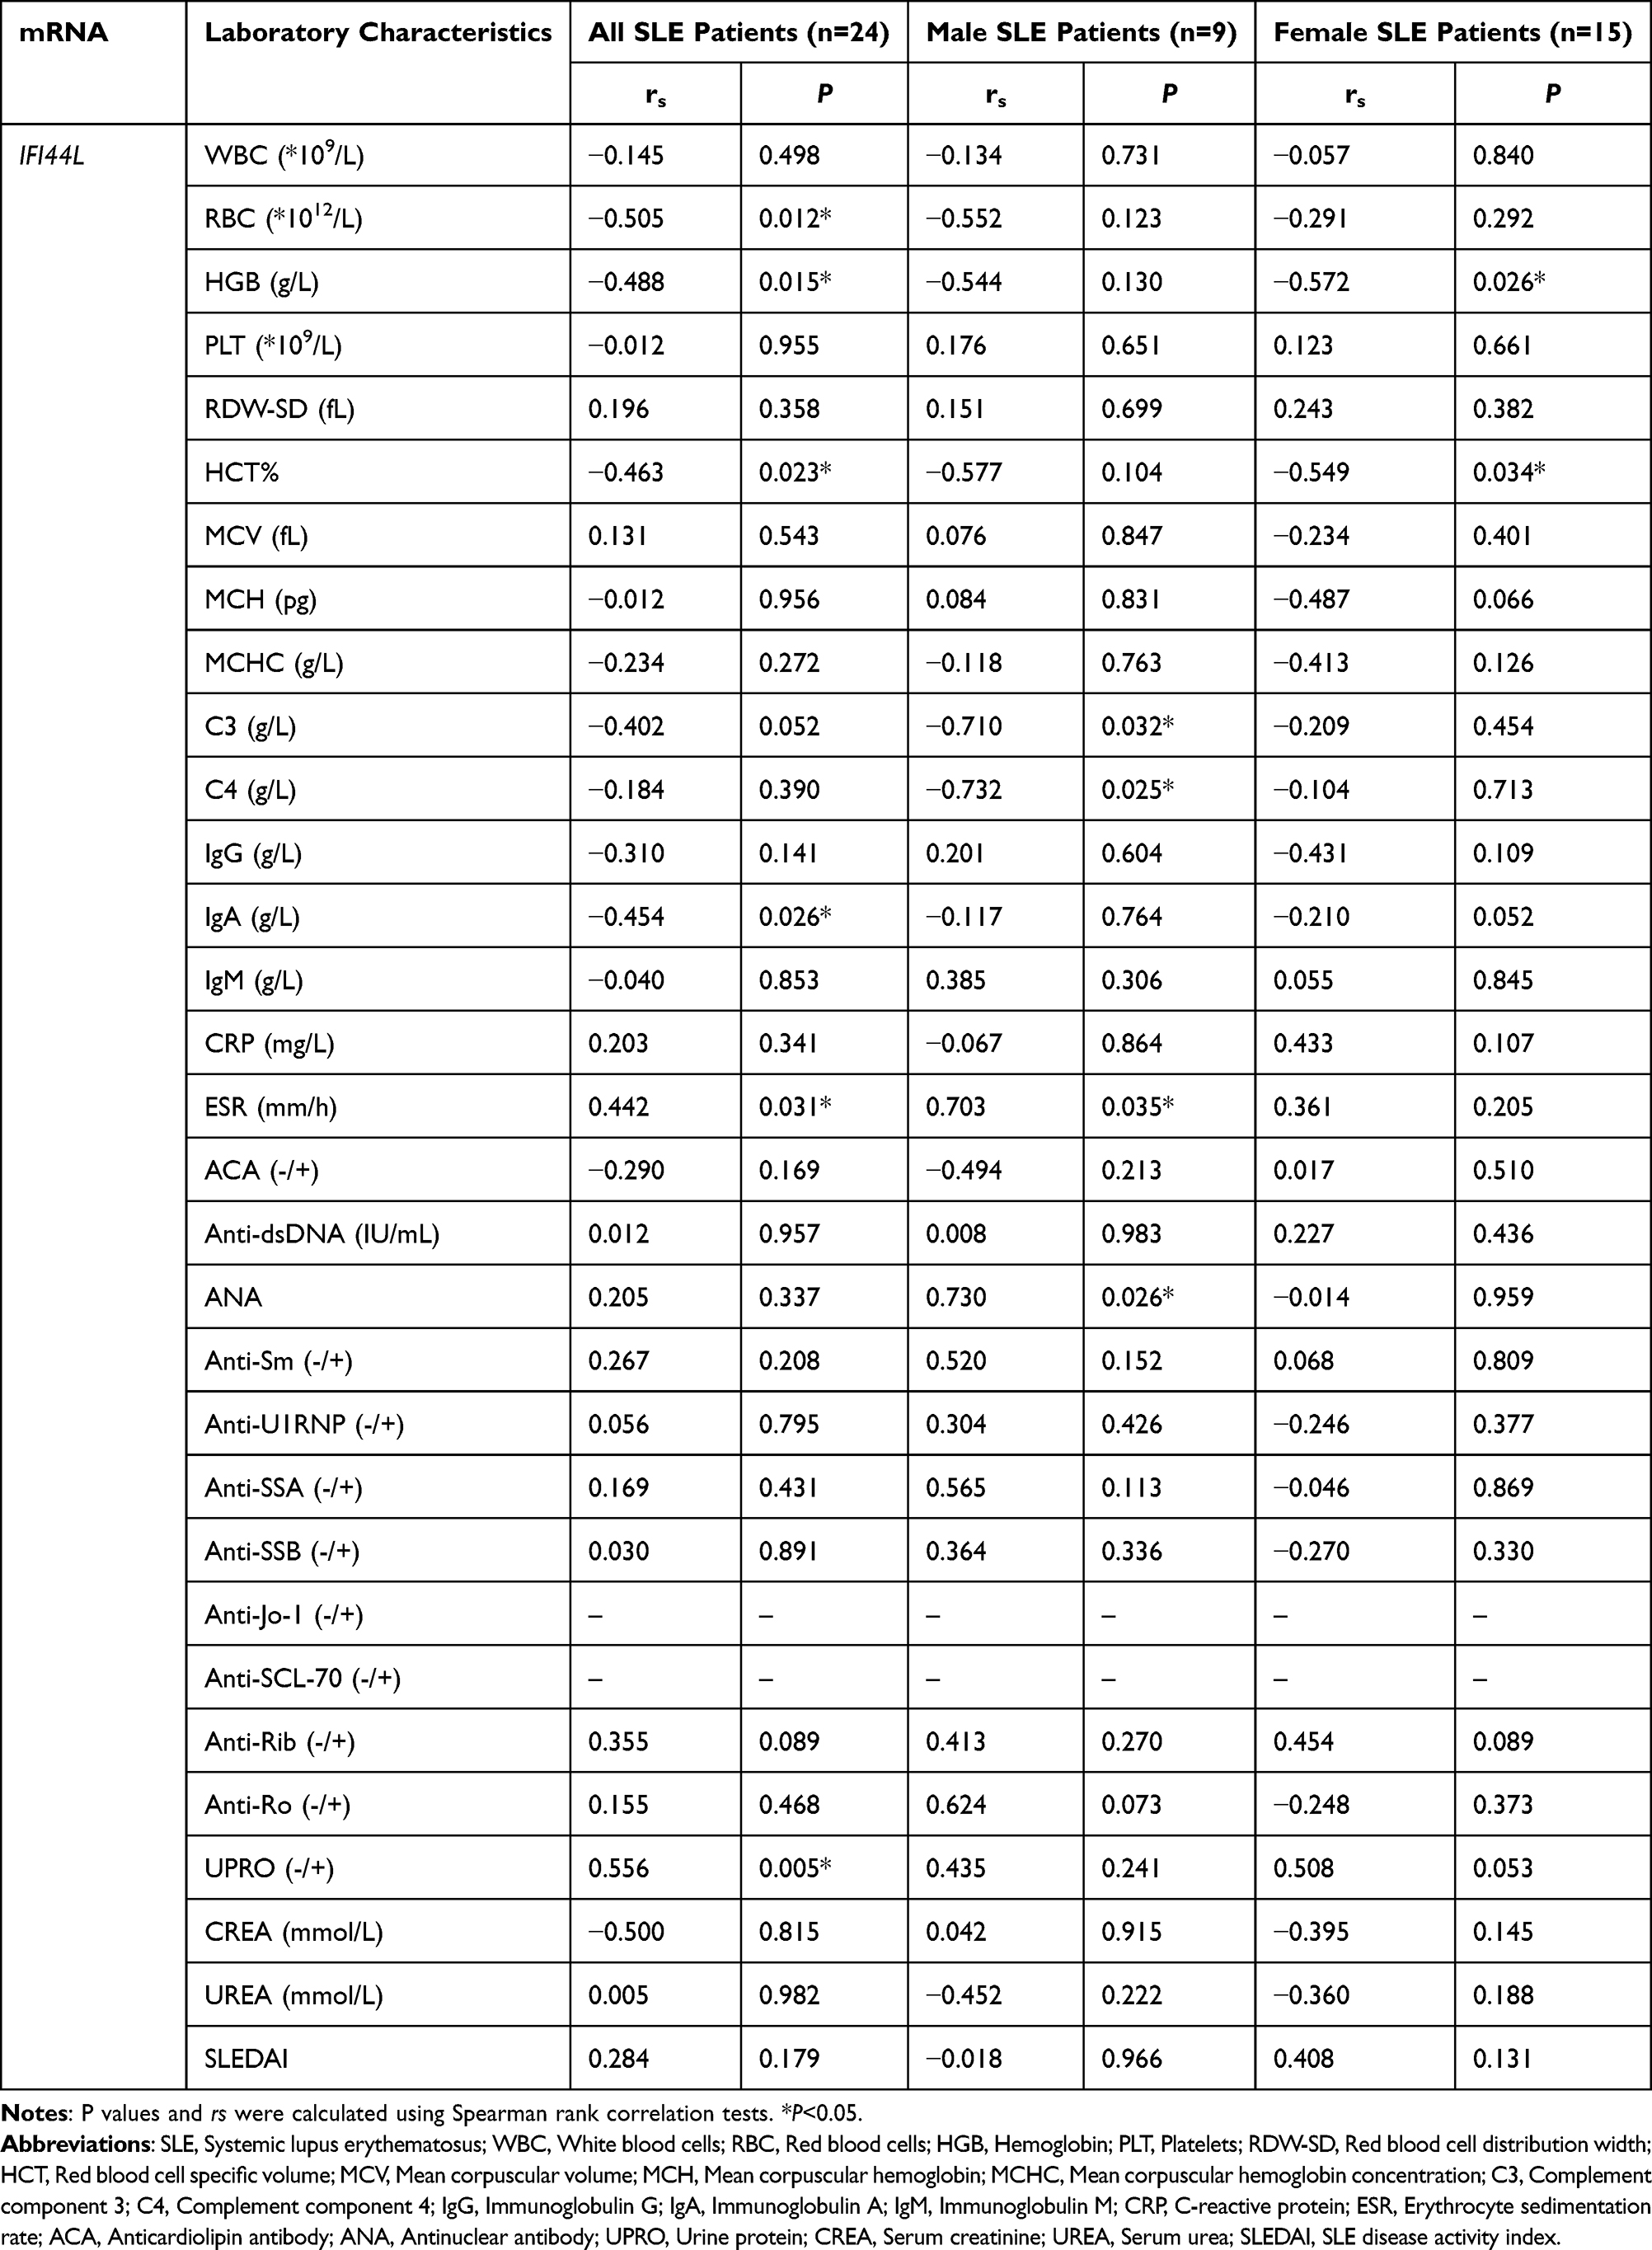 |
Table 1 Correlation Between Relative Expression of IFI44 and Clinical Indicators in SLE Patients |
 |
Figure 6 Correlation analysis of IFI44 expression level and clinical indicators in SLE patients. IFI44L had negative correlation with IgA, RBC, HCT, HGB (A–D), and had positive correlation with ESR and UPRO (E and F) in SLE patients. Abbreviations: IgA, Immunoglobulin A; RBC, Red blood cell count; HCT, Red blood cell-specific volume; HGB, Hemoglobin level; ESR, Erythrocyte sedimentation rate; UPRO, Renal function Urine protein. |
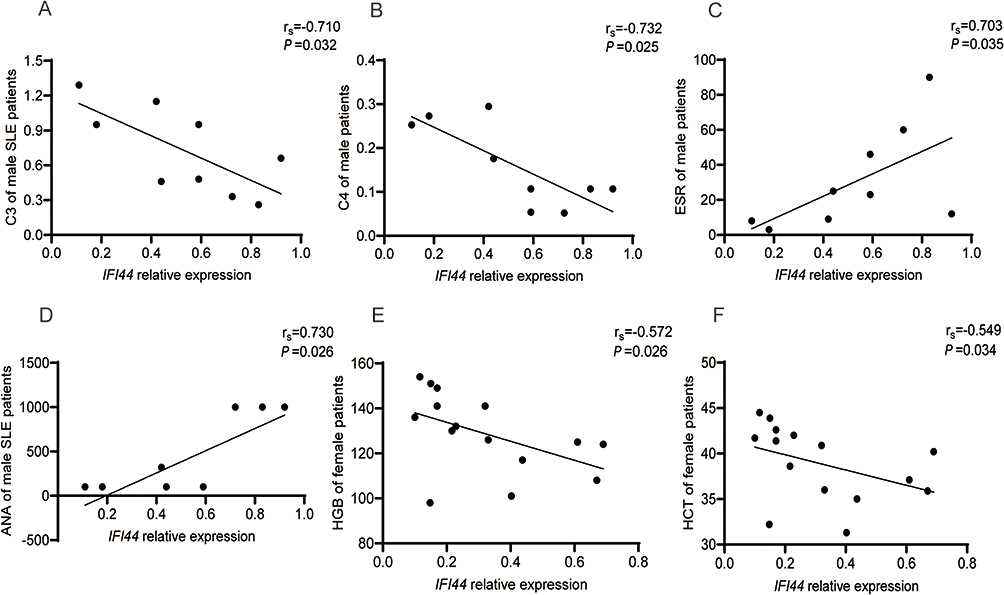 |
Figure 7 Correlation analysis of IFI44 expression level and clinical indicators in male (A–D) and in female (E and F) SLE patients. Abbreviations: C3, Complement Component 3; C4, Complement Component 4; ESR, Erythrocyte sedimentation rate; ANA, Antinuclear antibody; HGB, Hemoglobin level; HCT, Red blood cell-specific volume. |
Discussion
In our study, we collated and analyzed two sets of gene expression data using bioinformatics methods, resulting in a total of 65 DEGs, and two of them, IFI44 and RASD2 were identified as hub genes in SLE patients, which may involve in Neutrophil extracellular trap formation and IL-17 signaling pathway. Both IFI44 and RASD2 are known as IFN stimulating genes (ISGs), providing further evidence for the role of the type I IFN signaling pathway in SLE pathogenesis. Furthermore, we analyzed the differences in immunoinfiltrating cells between SLE patients and healthy controls using CIBERSORT and found that IFI44 may play a more prominent role in immunoinfiltration in SLE compared to RASD2, which is consistent with a study by Jiang et al.13
It is well established that IFN-α plays a crucial role in regulating autoimmune responses by affecting various immune cells and pathways.4 Also, ISGs may drive by IFN-α in enhancing the cytolytic activity of NK cells, increasing the killing of pathogens by macrophages, upregulating the expression of co-stimulatory molecules, improving the antigen-presenting ability of DCs, promoting IFN production by pDCs, enhancing lymphocyte homing ability, prolonging the survival time of CD4+T cells, augmenting the toxicity of CD8+ T cells, inhibiting apoptosis, and promoting B cell differentiation.14–17
In this study, we analyzed the relationship between IFI44 expression and 22 types of immune infiltrating cells, and found that IFI44 was significantly correlated with plasma cells, activated DCs, monocytes, and other immune cells. Furthermore, IFI44 showed a positive correlation with activated memory CD4+T cells and a negative correlation with CD8+T cells. These findings are consistent with a study by Pan et al, which demonstrated that IFI44 was associated with an increase in the number of CD4+T cells and a decrease in CD8+T cell infiltration in head and neck squamous cell carcinoma (HNSCC).18 These results suggest that IFI44 is closely involved in the regulation of CD4+ and CD8+T cells, and play a complex role in the immune dysregulation in SLE.
Previous studies have reported that IFI44 is a specific diagnostic indicator for lupus nephritis (LN) and can differentiate between active and inactive LN.9,19 To further investigate the relationship between IFI44 and SLE, we assessed IFI44 expression in PBMCs from SLE patients and controls. Our findings revealed that IFI44 expression was significantly higher in SLE patients compared to healthy controls. The ROC curve analysis also demonstrated that IFI44 had high diagnostic specificity and sensitivity for SLE. Interestingly, we observed a notable result that the expression of IFI44 was significantly higher in male SLE patients compared to female patients, which is consistent with our previous findings on IFI44L.20 IFI44 is located adjacent to IFI44L on chromosome 1, and shares 45% of amino acid sequence similarity,21 this research further supports the possibility of similar gene structure and function between IFI44 and IFI44L and also suggests a potential role of IFI44 in the sexual dimorphism of SLE.
Correlation analysis results demonstrated that the expression level of IFI44 in all SLE patients was negatively correlated with RBC, HGB, HCT, and IgA, and positively correlated with ESR and UPRO. In male SLE patients, IFI44 was negatively correlated with inflammatory markers C3 and C4, and positively correlated with ANA and ESR. However, in female SLE patients, IFI44 expression levels were only negatively correlated with HGB and HCT, and no significant correlation was found with inflammatory indicators. These findings further suggest that IFI44 may play distinct roles in the pathogenesis of SLE patients with different genders.
Elevated levels of IFN have been associated with anemia in SLE patients, with lower hemoglobin levels observed in patients with high IFN-α scores.22 Treatment with IFN-α-2a for chronic HCV infection has also been shown to have inhibitory effects on erythropoiesis.23 Autoantibodies, such as ANA, are positively correlated with high initial IFN levels, with different ANA staining patterns observed based on IFN levels.24,25 Complement proteins C3 and C4, which are used as indicators of SLE disease activity, have been found to be negatively correlated with ISGs, with hypocomplementemia being common in SLE patients with high ISG levels.26,27 ESR, a marker of inflammation, has been shown to be increased in SLE patients with higher IFN-α scores,28 and IgA, a major immunoglobulin involved in mucosal immunity, has been implicated in autoimmune diseases.29 IFN-γ has been shown to down-regulate IgA expression, but the relationship between IFN-α and IgA has not been well studied.30 Based on these findings, we propose that abnormal induction of IFI44 by interferon may contribute to the abnormalities in hematological and immunological clinical indicators observed in SLE patients. The relationship between IFI44 and clinical indicators may be mediated by the effects of interferon on various pathways, including erythropoiesis, autoantibody production, complement activation, and IgA expression.
SLE has been shown to exhibit significant sexual dimorphism in terms of morbidity and clinical manifestations. Estrogen has been documented to have an immunostimulatory effect, while androgens exhibit an immunosuppressive effect and participate in the occurrence of sexual dimorphism in autoimmune diseases.31–33 Studies on IFN-related genes have revealed that estrogen can bind to estrogen receptors (ESR 1/2) to activate the expression of type I IFN signaling genes, such as IRF4/5, and stimulate cells to secrete IFN-α, leading to phosphorylation of STAT1. Subsequently, through the induction of ISG expression, it activates B cells, resulting in the conversion of monocytes to functional dendritic cells and inducing an aberrant autoimmune response.34 Furthermore, upregulation of IFN-α/β expression can further promote ER α expression, expanding the effects of estrogen.35 The sex difference observed in IFI44L in SLE may be related to estrogen-induced IFI44L/BAFF.36 These studies suggest that ISGs and estrogen may be involved in the occurrence and development of sexual dimorphism in SLE through positive feedback pathways.37 Given the structural and functional similarities between IFI44 and IFI44L, we speculate that IFI44 may be involved in the formation of sexual dimorphism in SLE through similar mechanisms. Future, further studies are needed to elucidate the exact mechanisms underlying the association between IFI44 and clinical indicators in SLE patients, particularly in the context of gender differences and the role of interferon in SLE pathogenesis, which may have implications for the diagnosis, evaluation, and treatment of SLE.
The findings from our research suggest that abnormal expression of IFI44 in SLE patients may be closely related to clinical laboratory indicators, and these relationships may differ between genders. Indeed, our current work has provided valuable insights into the potential role of IFI44 in SLE and its association with clinical laboratory indicators and immune infiltration. The findings suggest that IFI44 may be a potential target for precise treatment of SLE. However, there are certain limitations in our study that need to be addressed in future experiments. First is the limited number of clinical validation samples. Expanding the sample size of SLE patients can help increase the statistical power and reliability of the results. Another limitation is the need for investigate the underlying mechanisms by which IFI44 influences immune infiltration and its impact on SLE disease activity. In future experiments, it is necessary to further expand the sample size of SLE patients and improve the correlation analysis.
Conclusion
We identified IFI44 that compared SLE to healthy controls by using the common bioinformatics methods that are currently in the diversity expression gene screening, and further analyzed and explored its possible involvement in SLE. Our study provides potential clues for the treatment of SLE; However, the regulatory mechanism of IFI44 still needs to be confirmed by further experiments.
Acknowledgments
We thank all the participants of the study. This work was supported by the National Natural Science Foundation of China (No.81960306; No.82060301).
Disclosure
The authors declare no conflicts of interest in this work.
References
1. Teruel M, Alarcón-Riquelme ME. The genetic basis of systemic lupus erythematosus: what are the risk factors and what have we learned. J Autoimmun. 2016;74:161–175. doi:10.1016/j.jaut.2016.08.001
2. Ameer MA, Chaudhry H, Mushtaq J, et al. An overview of Systemic Lupus Erythematosus (SLE) pathogenesis, classification, and management. Cureus. 2022;14(10):e30330. doi:10.7759/cureus.30330
3. Infante B, Mercuri S, Dello Strologo A, et al. Unraveling the link between interferon-α and systemic lupus erythematosus: from the molecular mechanisms to target therapies. Int J Mol Sci. 2022;23(24). doi:10.3390/ijms232415998
4. Salvi V, Gianello V, Busatto S, et al. Exosome-delivered microRNAs promote IFN-α secretion by human plasmacytoid DCs via TLR7. JCI Insight. 2018;3(10). doi:10.1172/jci.insight.98204
5. Demers-Mathieu V. Optimal selection of IFN-α-inducible genes to determine type I interferon signature improves the diagnosis of systemic lupus erythematosus. Biomedicines. 2023;11(3):864. doi:10.3390/biomedicines11030864
6. Siddiqi KZ, Wilhelm TR, Ulff-Møller CJ, Jacobsen S. Cluster of highly expressed interferon-stimulated genes associate more with African ancestry than disease activity in patients with systemic lupus erythematosus. A systematic review of cross-sectional studies. Transl Res. 2021;238:63–75. doi:10.1016/j.trsl.2021.07.006
7. Yuan Y, Ma H, Ye Z, Jing W, Jiang Z. Interferon-stimulated gene 15 expression in systemic lupus erythematosus: diagnostic value and association with lymphocytopenia. Z Rheumatol. 2018;77(3):256–262. doi:10.1007/s00393-017-0274-8
8. Huang X, Shen N, Bao C, Gu Y, Wu L, Chen S. Interferon-induced protein IFIT4 is associated with systemic lupus erythematosus and promotes differentiation of monocytes into dendritic cell-like cells. Arthritis Res Ther. 2008;10(4):R91. doi:10.1186/ar2475
9. Shen M, Duan C, Xie C, et al. Identification of key interferon-stimulated genes for indicating the condition of patients with systemic lupus erythematosus. Front Immunol. 2022;13:962393. doi:10.3389/fimmu.2022.962393
10. Zhang Q, Wu R, Tan Y, Huang J, Luo S. Novel polymorphism of IFI44L associated with the susceptibility and clinical characteristics of systemic lupus erythematosus in a Chinese population. Int Immunopharmacol. 2023;117:109979. doi:10.1016/j.intimp.2023.109979
11. Tanaka Y, Tummala R. Anifrolumab, a monoclonal antibody to the type I interferon receptor subunit 1, for the treatment of systemic lupus erythematosus: an overview from clinical trials. Mod Rheumatol. 2021;31(1):1–12. doi:10.1080/14397595.2020.1812201
12. Zhang B, Liu L, Zhou T, et al. A simple and highly efficient method of IFI44L methylation detection for the diagnosis of systemic lupus erythematosus. Clin Immunol. 2020;221:108612. doi:10.1016/j.clim.2020.108612
13. Jiang Z, Shao M, Dai X, Pan Z, Liu D. Identification of diagnostic biomarkers in systemic lupus erythematosus based on bioinformatics analysis and machine learning. Front Genet. 2022;13:865559. doi:10.3389/fgene.2022.865559
14. González-Navajas JM, Lee J, David M, Raz E. Immunomodulatory functions of type I interferons. Nat Rev Immunol. 2012;12(2):125–135. doi:10.1038/nri3133
15. Vazquez MI, Catalan-Dibene J, Zlotnik A. B cells responses and cytokine production are regulated by their immune microenvironment. Cytokine. 2015;74(2):318–326. doi:10.1016/j.cyto.2015.02.007
16. Thacker SG, Zhao W, Smith CK, et al. Type I interferons modulate vascular function, repair, thrombosis, and plaque progression in murine models of lupus and atherosclerosis. Arthritis Rheum. 2012;64(9):2975–2985. doi:10.1002/art.34504
17. Postal M, Vivaldo JF, Fernandez-Ruiz R, Paredes JL, Appenzeller S, Niewold TB. Type I interferon in the pathogenesis of systemic lupus erythematosus. Curr Opin Immunol. 2020;67:87–94. doi:10.1016/j.coi.2020.10.014
18. Pan H, Wang X, Huang W, et al. Interferon-induced protein 44 correlated with immune infiltration serves as a potential prognostic indicator in head and neck squamous cell carcinoma. Front Oncol. 2020;10:557157. doi:10.3389/fonc.2020.557157
19. Shen L, Lan L, Zhu T, et al. Identification and validation of IFI44 as key biomarker in lupus nephritis. Front Med. 2021;8:762848. doi:10.3389/fmed.2021.762848
20. Wang Y, Jia W, Ma Q, et al. Identification of IFI44L as a new candidate molecular marker for systemic lupus erythematosus. Clin Exp Rheumatol. 2023;41(1):48–59. doi:10.55563/clinexprheumatol/q3aa6s
21. Busse DC, Habgood-Coote D, Clare S, et al. Interferon-induced protein 44 and interferon-induced protein 44-like restrict replication of respiratory syncytial virus. J Virol. 2020;94(18). doi:10.1128/JVI.00297-20
22. Kirou KA, Lee C, George S, Louca K, Peterson MG, Crow MK. Activation of the interferon-alpha pathway identifies a subgroup of systemic lupus erythematosus patients with distinct serologic features and active disease. Arthritis Rheum. 2005;52(5):1491–1503. doi:10.1002/art.21031
23. Espinosa M, Arenas MD, Aumente MD, et al. Anemia associated with pegylated interferon-alpha2a and alpha2b therapy in hemodialysis patients. Clin Nephrol. 2007;67(6):366–373. doi:10.5414/cnp67366
24. Northcott M, Jones S, Koelmeyer R, et al. Type 1 interferon status in systemic lupus erythematosus: a longitudinal analysis. Lupus Sci Med. 2022;9(1):e000625. doi:10.1136/lupus-2021-000625
25. Choi MY, Fritzler MJ. Autoantibodies in SLE: prediction and the p value matrix. Lupus. 2019;28(11):1285–1293. doi:10.1177/0961203319868531
26. Coss SL, Zhou D, Chua GT, et al. The complement system and human autoimmune diseases. J Autoimmun. 2022:102979. doi:10.1016/j.jaut.2022.102979
27. Tanaka Y, Kusuda M, Yamaguchi Y. Interferons and systemic lupus erythematosus: pathogenesis, clinical features and treatments in interferon-driven disease. Mod Rheumatol. 2022. doi:10.1093/mr/roac140
28. Petri M, Orbai AM, Alarcón GS, et al. Derivation and validation of the systemic lupus international collaborating clinics classification criteria for systemic lupus erythematosus. Arthritis Rheum. 2012;64(8):2677–2686. doi:10.1002/art.34473
29. Ding L, Chen X, Cheng H, Zhang T, Li Z. Advances in IgA glycosylation and its correlation with diseases. Front Chem. 2022;10:974854. doi:10.3389/fchem.2022.974854
30. van Gool MMJ, van Egmond M. IgA and FcαRI: versatile players in homeostasis, infection, and autoimmunity. Immunotargets Ther. 2020;9:351–372. doi:10.2147/itt.S266242
31. Assad S, Khan HH, Ghazanfar H, et al. Role of sex hormone levels and psychological stress in the pathogenesis of autoimmune diseases. Cureus. 2017;9(6):e1315. doi:10.7759/cureus.1315
32. Moulton VR. Sex hormones in acquired immunity and autoimmune disease. Front Immunol. 2018;9:2279. doi:10.3389/fimmu.2018.02279
33. Moxley G, Posthuma D, Carlson P, et al. Sexual dimorphism in innate immunity. Arthritis Rheum. 2002;46(1):250–258. doi:10.1002/1529-0131(200201)46:1<250::Aid-art10064>3.0.Co;2-t
34. Hagman J. Critical functions of IRF4 in B and T lymphocytes. J Immunol. 2017;199(11):3715–3716. doi:10.4049/jimmunol.1701385
35. Panchanathan R, Shen H, Zhang X, Ho SM, Choubey D. Mutually positive regulatory feedback loop between interferons and estrogen receptor-alpha in mice: implications for sex bias in autoimmunity. PLoS One. 2010;5(5):e10868. doi:10.1371/journal.pone.0010868
36. Fan H, Zhao G, Ren D, Liu F, Dong G, Hou Y. Gender differences of B cell signature related to estrogen-induced IFI44L/BAFF in systemic lupus erythematosus. Immunol Lett. 2017;181:71–78. doi:10.1016/j.imlet.2016.12.002
37. Rubtsova K, Marrack P, Rubtsov AV. Sexual dimorphism in autoimmunity. J Clin Invest. 2015;125(6):2187–2193. doi:10.1172/jci78082
 © 2023 The Author(s). This work is published and licensed by Dove Medical Press Limited. The
full terms of this license are available at https://www.dovepress.com/terms
and incorporate the Creative Commons Attribution
- Non Commercial (unported, 3.0) License.
By accessing the work you hereby accept the Terms. Non-commercial uses of the work are permitted
without any further permission from Dove Medical Press Limited, provided the work is properly
attributed. For permission for commercial use of this work, please see paragraphs 4.2 and 5 of our Terms.
© 2023 The Author(s). This work is published and licensed by Dove Medical Press Limited. The
full terms of this license are available at https://www.dovepress.com/terms
and incorporate the Creative Commons Attribution
- Non Commercial (unported, 3.0) License.
By accessing the work you hereby accept the Terms. Non-commercial uses of the work are permitted
without any further permission from Dove Medical Press Limited, provided the work is properly
attributed. For permission for commercial use of this work, please see paragraphs 4.2 and 5 of our Terms.
Recommended articles
The Construction of ITP Diagnostic Modeling Based on the Expressions of Hub Genes Associated with M1 Polarization of Macrophages
Wang MJ, Song Y, Guo XQ, Wei D, Cao XT, Sun Y, Xu YG, Hu XM
Journal of Inflammation Research 2022, 15:5905-5915
Published Date: 20 October 2022
Network Analysis of Osteoarthritis Progression Using a Steiner Minimal Tree Algorithm
Xie Y, Shao F, Ji Y, Feng D, Wang L, Huang Z, Wu S, Sun F, Jiang H, Miyamoto A, Wang H, Zhang C
Journal of Inflammation Research 2024, 17:3201-3209
Published Date: 18 May 2024
Integrated Bioinformatics Analysis for Revealing CBL is a Potential Diagnosing Biomarker and Related Immune Infiltration in Parkinson’s Disease
Chen Y, Tu Y, Yan G, Ji X, Chen S, Niu C, Liao P
International Journal of General Medicine 2024, 17:2371-2386
Published Date: 22 May 2024
Causal Implication of CD52-Driven Immune Dysregulation in Sarcopenic Obesity: Integrating Mendelian Randomization and Multiomics Profiling
Xuekelati S, Abulitifu Y, Maimaitiwusiman Z, Xu L, Guo S, Xu Q, Ke J, Wang H
Clinical Interventions in Aging 2026, 21:570497
Published Date: 16 February 2026