
Back to Journals » Nature and Science of Sleep » Volume 18

The Clinical, Humanistic, and Economic Burden of Idiopathic Hypersomnia in the United States: Analysis of the National Health and Wellness Survey
Authors Drachenberg C, Cambron-Mellott MJ  , Yang L, Balkaran BL, Whalen M, Plante DT
Received 16 October 2025
Accepted for publication 19 May 2026
Published 27 June 2026 Volume 2026:18 568980
DOI https://doi.org/10.2147/NSS.S568980
Checked for plagiarism Yes
Review by Single anonymous peer review
Peer reviewer comments 3
Editor who approved publication: Prof. Dr. Ahmed BaHammam
Caroleen Drachenberg,1 M Janelle Cambron-Mellott,2 Lin Yang,2 Bridget L Balkaran,2 Marisa Whalen,3 David T Plante4
1Global Value & HEOR, Jazz Pharmaceuticals, Palo Alto, CA, USA; 2Oracle Life Sciences, Oracle Corporation, Austin, TX, USA; 3US Medical Affairs, Jazz Pharmaceuticals, Palo Alto, CA, USA; 4Department of Psychiatry, School of Medicine and Public Health, University of Wisconsin–Madison, Madison, WI, USA
Correspondence: Caroleen Drachenberg, Jazz Pharmaceuticals, 3170 Porter Drive, Palo Alto, CA, 94304, USA, Tel +1 628 222 8755, Email [email protected]
Purpose: Limited self-reported data on the real-world burden of idiopathic hypersomnia exist from a representative sample of the US general adult population. This study described the clinical, humanistic, and economic burden of adults with idiopathic hypersomnia compared to matched adults without idiopathic hypersomnia.
Patients and Methods: This cross-sectional study used 2021 and 2023 US National Health and Wellness Survey data. Propensity score matching (1:2) was performed for adults (≥ 18 years) who self-reported a physician diagnosis of idiopathic hypersomnia and adults without idiopathic hypersomnia (non-idiopathic hypersomnia cohort). Post matching, outcomes were compared between cohorts using cluster-robust regression models; P values for primary outcomes were not adjusted for multiplicity.
Results: Included were 163 adults with idiopathic hypersomnia (64.4% female, mean age 38.45 years) and 326 matched adults without idiopathic hypersomnia (66.0% female, mean age 39.60 years). The idiopathic hypersomnia cohort had higher prevalence of comorbidities (eg cardiovascular, cardiometabolic, sleep, psychiatric), higher mean Charlson comorbidity index scores (1.43 vs 0.34), and reported worse depression (PHQ-9) and anxiety (GAD-7) and poorer mental health, physical function (SF-36v2, RAND-36), and HRQoL (EQ-5D-5L, SF-6D, EQ-VAS) compared to the matched non-idiopathic hypersomnia cohort (P < 0.01). The idiopathic hypersomnia cohort reported more mean healthcare provider visits (13.34 vs 3.14), emergency department visits (0.88 vs 0.45), and hospitalizations (0.95 vs 0.35) in the past 6 months and higher annualized direct medical costs ($46,424.39 vs $14,700.21) than the matched non-idiopathic hypersomnia cohort (P < 0.05). The idiopathic hypersomnia cohort reported greater mean work productivity loss (49.07 vs 32.28) and activity impairment (48.22 vs 30.77), and annualized indirect costs ($15,269.22 vs $10,576.96) than the matched non-idiopathic hypersomnia cohort (P < 0.05).
Conclusion: This study highlights the substantial real-world burden, including comorbidity, HRQoL, and economic, of idiopathic hypersomnia compared to the matched non-idiopathic hypersomnia cohort.
Plain Language Summary: Idiopathic hypersomnia is a sleep disorder that causes extreme daytime sleepiness, even after a full night of sleep. In this large US survey study, adults with idiopathic hypersomnia were compared with similar adults who did not have the condition. The study found that people with idiopathic hypersomnia had more health problems, including higher levels of depression and anxiety, and reported lower overall physical and mental well‑being than people without the condition. People with idiopathic hypersomnia also described greater challenges in daily life, such as reduced energy, difficulty staying alert, and trouble completing everyday activities.
In addition, people with idiopathic hypersomnia used more healthcare services, had higher medical costs, and experienced greater work productivity loss than those without idiopathic hypersomnia. These findings suggest that idiopathic hypersomnia impacts many aspects of life, including health, work, finances, and day‑to‑day functioning, and they highlight the need for better support and treatment options for those living with this condition.
Keywords: comorbidities, healthcare resource use, indirect costs, direct medical costs, health-related quality of life, patient reported outcomes
Introduction
Idiopathic hypersomnia is a central disorder of hypersomnolence, characterized by excessive daytime sleepiness, sleep inertia, prolonged and unrefreshing naps, long sleep duration, unrefreshing sleep, and cognitive impairment.1,2 While the exact prevalence of idiopathic hypersomnia is unknown, the estimated prevalence ranges from 0.04% (37.0 cases per 100,000 people, based on insurance claims data)3 to 1.5% (based on the Wisconsin Sleep Cohort study),4 and research suggests that idiopathic hypersomnia is underdiagnosed.4 Symptoms of idiopathic hypersomnia typically present during adolescence or early adulthood and often persist, with up to one-third of people experiencing unexpected improvement or resolution from the disease.5–7
Idiopathic hypersomnia imposes a substantial burden on the affected individuals.8,9 Individuals with idiopathic hypersomnia are more likely to have had a motor vehicle accident in the past 5 years10 and are more likely to experience anxiety and depression compared with healthy controls.11 In addition, compared to individuals without idiopathic hypersomnia, those with idiopathic hypersomnia have higher rates of comorbid conditions, such as mood disorders, sleep apnea, headaches/migraines, and cardiovascular conditions.12–14 Idiopathic hypersomnia is associated with poorer health-related quality of life (HRQoL), daily functioning, cognition, mood, relationships, and work productivity, which collectively contribute to its humanistic burden (the impact of a health condition on overall well-being and everyday functioning from the patient’s perspective).8,15 Individuals with idiopathic hypersomnia also have higher health-related and social-transfer costs as well as lower levels of employment and income.9,16
Although previous studies have estimated the burden of idiopathic hypersomnia, there is limited understanding of this disease, especially among a representative sample of adults in the US. Limitations of the prior literature include small sample sizes,17 clinical samples (mostly limited in geography),11,17,18 non-US populations, lack of recent data,10,11,18 and studies with limited outcomes. Previous analyses of administrative claims databases found that individuals with idiopathic hypersomnia had high healthcare resource use (HCRU) and medical costs;16 however, data evaluating the economic burden of idiopathic hypersomnia are scarce in the US.14 Therefore, in the current study, we utilized cross-sectional patient-reported data to characterize the clinical, humanistic, and economic burden associated with idiopathic hypersomnia in a community-dwelling, geographically diverse sample of adults with idiopathic hypersomnia residing in the US compared to matched adults without idiopathic hypersomnia.
Materials and Methods
Study Design
This study was an observational, retrospective, cross-sectional analysis of an existing database of survey responses to the US National Health and Wellness Survey (NHWS) conducted in 2021 and 2023.19 De-duplicated data from both NHWS datasets were utilized in this analysis, with the most recent data from 2023 included for respondents who participated in both years.
Data Source
The NHWS is a nationally representative, cross-sectional, self-administered, online questionnaire survey designed to reflect the health of the general adult population (aged ≥18 years) in the US, with approximately 75,000 respondents per year.19 Potential respondents were recruited via an existing, general-purpose (ie not healthcare-specific) web-based consumer panel. The respondents were identified through participation in opt-in online survey panels. Quota sampling, stratified by sex, age, and race/ethnicity, was employed to ensure that the demographic composition of the NHWS sample represented the US adult population. More specifically, data from the US Census Bureau are used to identify the relative proportions of sex, age, and racial/ethnic groups in the US; these proportions are mimicked during the recruitment of panel members to ensure the final NHWS sample matches the demographic proportions. The 2023 NHWS protocol and questionnaire were reviewed by Pearl Institutional Review Board (Indianapolis, IN) and received exemption status according to 45 CFR 46.104(d)(2) Tests, Survey, Interviews on April 27, 2023 (IRB ID: 2023–0121). The 2021 NHWS protocol and questionnaire were reviewed by Pearl Institutional Review Board (Indianapolis, IN) and received exemption status according to FDA 21 CFR 56.104 and 45CFR46.104(b)(2): (2) Tests, Surveys, Interviews on February 4, 2021 (IRB ID: 21-KANT-248). All respondents provided informed consent electronically. Data collection occurred for NHWS 2021 from April through August 2021 and for NHWS 2023 from May through August 2023. This study complies with the principles outlined in the Declaration of Helsinki for all human or experimental investigations.
Participants
The study population consisted of adults (aged ≥18 years) residing in the US who participated in the US NHWS in 2021 or 2023. The study population was stratified into two cohorts based on idiopathic hypersomnia status. Respondents were included in the idiopathic hypersomnia cohort if they self-reported a physician diagnosis of idiopathic hypersomnia and self-reported experiencing idiopathic hypersomnia symptoms in the past 12 months. Respondents were included in the non-idiopathic hypersomnia cohort if they did not self-report a physician diagnosis of idiopathic hypersomnia and did not report experiencing idiopathic hypersomnia symptoms in the past 12 months. As narcolepsy, especially narcolepsy type 2, has many overlapping symptoms with idiopathic hypersomnia,20 respondents were excluded from the study if they self-reported a diagnosis of narcolepsy. Excluding individuals with narcolepsy from both cohorts minimizes the potential for differential misclassification between groups.
Variables
Sociodemographic and general health characteristics included age, sex, race/ethnicity, marital status, education, employment status, labor force participation, household income, health insurance, body mass index, smoking status, alcohol use, and exercise. Years since diagnosis of idiopathic hypersomnia and Epworth Sleepiness Scale (ESS) scores were also measured.21 The ESS measures the likelihood of falling asleep in eight scenarios on a 4-point scale (0=would never doze to 3=high chance of dozing).21,22 Items are summed to form a single measure (range: 0–24); higher scores represent greater daytime sleepiness. Scores of 0–10 indicate normal daytime sleepiness, whereas scores of 11–12, 13–15, and 16–24, are indicative of mild, moderate, and severe excessive daytime sleepiness, respectively. Sleep condition–specific clinical and treatment characteristics of the idiopathic hypersomnia cohort were captured as categorical and continuous variables in the sleep-condition module, which is administered to anyone who reported experiencing idiopathic hypersomnia, insomnia, narcolepsy, sleep apnea, or other sleep difficulties in the past 12 months. With the exception of self‑reported condition severity and current use of prescription medication to treat idiopathic hypersomnia (yes/no), the clinical and treatment characteristics are not specific to idiopathic hypersomnia for respondents who experienced more than one sleep condition in the past 12 months.
Comorbidity burden was assessed using the Charlson comorbidity index (CCI), a measure designed to predict mortality by assigning a weight to comorbidities based on their relative risk of mortality and computing a summary score.23,24 The updated index from Quan et al, 2011 was used in this study; it includes the following 12 conditions and weights (shown in parentheses): chronic pulmonary disease (1); diabetes with chronic complications (1); renal disease (1); rheumatologic disease (1); any malignancy, including leukemia and lymphoma (2); congestive heart failure (2); dementia (2); hemiplegia (2); mild liver disease (2); acquired immune deficiency syndrome/human immunodeficiency virus (4); moderate or severe liver disease (4); and metastatic solid tumor (6).24 A higher score indicates a greater comorbidity burden on the individual. A categorical variable was also created to understand the distribution of respondents with CCI of 0, 1, 2, and 3 or more (0=no comorbidities; 1=1 comorbidity with a weight of 1; 2=either 2 comorbidities with a weight of 1 or 1 comorbidity with a weight of 2; 3=at least 1 comorbidity with a weight of ≥3 or multiple comorbidities with weights summing to ≥3). Self-reported physician diagnoses of other comorbidities were also collected. Primary diagnosed comorbidity outcomes included cardiometabolic, emotional/mental health, liver, and renal conditions. All other diagnosed comorbidities were secondary outcomes.
Primary humanistic outcomes included depression and anxiety severity and were measured using the 9-item Patient Health Questionnaire (PHQ-9)25 and the 7-item Generalized Anxiety Disorder (GAD-7) assessment,26 respectively, each dichotomized (<10 and ≥10). Additionally, HRQoL and health utility measures included the 36-Item Short Form Health Survey Version 2 (SF-36v2) physical and mental component summary scores (PCS and MCS; 2021 NHWS only),27,28 the 36-Item RAND Short Form Health Survey (RAND-36) physical and mental health composite scores (PHC and MHC; 2023 NHWS only),29 the Short Form Six-Dimension (SF-6D) health utility index scores (2021 NHWS only),28,30 the 5-level EQ-5D version (EQ-5D-5L),31,32 and the EQ visual analog scale (EQ-VAS).33
Depression and anxiety symptoms experienced in the past two weeks were rated on a 4-point scale (0=not at all to 3=nearly every day). Higher scores (PHQ-9 range: 0–27, GAD-7 range: 0–21) indicate more severe depression/anxiety; scores ≥10 are generally indicative of major depressive disorder (PHQ-9) and generalized anxiety disorder (GAD-7). For the PHQ-9, the following score categories were used to define depression severity: mild (5–9), moderate (10–14), moderately severe (15–19), and severe (20–27).34 For the GAD-7, the following score categories were used to define anxiety severity: mild (5–9), moderate (10–14), and severe (15–21).26 The minimal clinically important difference (MCID) is 5 points for PHQ-935 and 4 points for GAD-7.36
The SF-36v2 is a generic health status instrument, including two health component summaries and eight health domains. The PCS and MCS scores are standardized to have a mean of 50 and a standard deviation (SD) of 10 for the US population (range: 0–100; higher scores indicate better HRQoL). Minimally important difference (MID) values for groups with mean T-scores of 30–40 were proposed for SF-36v2 component mean scores (2 for PCS; 3 for MCS); for higher T-score ranges, MID values tend to be higher.27
The RAND-36 is a multipurpose, generic HRQoL instrument measuring eight health concepts.29 PHC and MHC scores range from 0 to 100, with 50 as the population mean (SD: 10; higher scores indicate better HRQoL). Differences of 3–5 points indicate clinically meaningful differences.28,30
The SF-6D index is a preference-based single utility index that uses data from the SF-36v2 to calculate a health utility score and provides meaningful measures of health state classification.28,30 The SF-6D index scores on a theoretical 0–1 scale (higher scores indicate better HRQoL; MID: 0.041).37 Only 2021 NHWS participants have an SF-6D index score.
The EQ-5D-5L is a health state measure comprising the EQ-5D descriptive system and the EQ-VAS.31,32 The EQ-5D descriptive system calculates EQ-5D utility index scores where 0=health state equivalent to death and 1=perfect health. MID for the EQ-5D is 0.074.37 The EQ-VAS, which captures participants’ assessment of their health status, ranges from 0 to 100, with 0 indicating the “worst imaginable health state” and 100 representing the “best imaginable health state.” MCID/MID values for EQ-VAS range from 6.5 to 12.33,38–40
Primary economic outcomes included HCRU measures; total annual direct and indirect costs; and work productivity and activity impairment outcomes measured using the Work Productivity and Activity Impairment (WPAI) questionnaire.
HCRU included the total number of visits to healthcare providers (HCPs) in the past 6 months (inclusive of visits to primary care and specialty care providers), in aggregate and separately for the following specialties: neurologists, pulmonologists, psychiatrists, and psychologists/therapists, as well as the number of emergency department (ED) visits and hospitalizations in the past 6 months.
Direct medical costs were computed by annualizing the number of HCP visits, ED visits, and hospitalizations in the past 6 months and multiplying them by the respective unit costs from the 2021 Medical Expenditure Panel Survey (MEPS) data.41 Costs were derived as mean expenditure per event and stratified by age groups (18–44, 45–64, and ≥65 years). MEPS office-based physician visit costs were used to estimate costs for HCP visits, emergency room visit costs were used to estimate ED visit costs, and inpatient stay costs were used to estimate hospitalization costs. Annual direct medical costs were calculated for each visit type and aggregated to estimate total annual direct costs.
For analyses including the US 2023 NHWS data, costs were adjusted from 2021 to 2023 values using the Consumer Price Index (CPI) for Medical Care published by the US Bureau of Labor Statistics.42 CPI values were averaged across July to September 2021 and July to September 2023 to align with NHWS data collection periods. The rate of inflation was calculated by dividing the 2023 CPI by the 2021 CPI and applied to 2023 cost estimates.
Work productivity and activity impairment were measured using the WPAI questionnaire, a 6-item validated instrument with four metrics: absenteeism, presenteeism, overall work productivity loss, and activity impairment.43 Respondents who reported being full-time, part-time, or self-employed provided data on absenteeism, presenteeism, and overall work impairment, while activity impairment data were provided by all respondents.
Indirect costs associated with productivity impairment were calculated using age- and sex-adjusted wage estimates provided by the US Bureau of Labor Statistics.42 The latest wage data available were from 2021; data were inflated to 2023 for the US 2023 NHWS.42 Therefore, indirect costs were calculated using 2021 rates for 2021 data and 2023 rates for 2023 data. Total lost wages were estimated by multiplying hours missed due to absenteeism and presenteeism (in the last week) by hourly wage rates. Annual indirect costs were estimated by multiplying total lost wages by the average number of work weeks per year. Annual indirect costs due to absenteeism and presenteeism were reported individually and summed for total annual indirect costs.
Secondary humanistic outcomes included domain-level subscale scores from the SF-36v227,28 and RAND-36 instruments.29 Secondary economic outcomes included binary HCRU indicators (≥1 visit in the past 6 months by visit type), annualized direct costs by resource category (HCP visits, ED visits, and hospitalizations), and annualized indirect costs attributable to absenteeism and presenteeism.
Statistical Methods
Descriptive statistics were employed to characterize both the idiopathic hypersomnia and non-idiopathic hypersomnia cohorts. Frequencies and percentages were reported for categorical variables and means and SDs and medians, first quartiles, and third quartiles for continuous variables. Bivariate analyses compared sociodemographic and health characteristics between the idiopathic hypersomnia cohort and the full non-idiopathic hypersomnia cohort to identify covariates for propensity score matching. Independent samples t-tests were used for continuous variables and chi-square tests for categorical variables.
A 1:2 propensity score matching ratio was used to minimize the baseline differences in demographic and health characteristics between idiopathic hypersomnia and non-idiopathic hypersomnia cohorts. Propensity scores were estimated using a binary logistic regression model with idiopathic hypersomnia status (yes/no) as the dependent variable. The covariates used for matching were survey year (2021; 2023), sex (female; male), age (categorical: 18–24; 25–34; 35–44; 45–54; 55–64; ≥65 years), race (Asian or Asian American; Black or African American; White; any other race or origin or multi-race), marital status (married or living with partner; single, never married, divorced, separated, or widowed), education (4-year university degree or higher; less than 4-year university degree), annual household income (<$50,000; $50,000 to <$100,000; ≥$100,000 or decline to answer), insurance type (commercial; other type; uninsured), smoking status (never; former; current), and days exercising vigorously for ≥20 minutes within the previous month (0 days; ≥1 day). As no respondents in the idiopathic hypersomnia cohort selected “Decline to answer” for marital status or education, respondents without idiopathic hypersomnia who selected “decline to answer” for either of these questions were removed prior to running the matching analyses. Each idiopathic hypersomnia individual was then matched to two individuals without idiopathic hypersomnia using a 1:2 greedy nearest neighbor matching algorithm without replacement within a specific caliper distance (set to 0.2).44 A standardized mean difference (SMD) of <0.10 was used to indicate a good balance between the matched samples.
Post matching, outcomes were compared between cohorts using generalized estimating equations (GEEs) to account for within-cluster correlation from matching and to estimate cluster-robust standard errors. An appropriate distribution and link function were specified for each outcome. Humanistic outcomes (including HRQoL measures), number of HCP visits in the past 6 months, WPAI measures, and all cost outcomes were analyzed as continuous variables using a normal distribution with identity link. Alternative model specifications for skewed cost data were examined, and the normal distribution provided the best overall fit. Other HCRU measures (eg ED visits and hospitalizations) were analyzed using a negative binomial distribution with log link. Binary outcomes, including comorbidity prevalence, depression and anxiety severity (PHQ-9 and GAD-7 dichotomized as 0–9 vs ≥10), and binary HCRU indicators (0 vs ≥1 visit), were analyzed using a binomial distribution with log link.
Model-based estimates (means or proportions) with 95% confidence intervals (CIs) were reported. Effect size estimates included standardized mean differences (SMDs) for continuous outcomes and prevalence ratios (PRs) for negative binomial and binomial models, each with 95% CI.
Primary and secondary outcomes were prespecified within each burden domain (comorbidity, humanistic, economic) prior to analysis. For primary outcomes, P values < 0.05, two-tailed, were considered statistically significant. For secondary outcomes, adjustments for multiple testing were applied at the outcome-family level. Secondary comorbidity outcomes were evaluated using a Bonferroni-adjusted significance threshold of α < 0.0017. Secondary humanistic outcomes were evaluated using a Bonferroni-adjusted significance threshold of α < 0.0031. Secondary economic outcomes were evaluated using a Bonferroni-adjusted significance threshold of α < 0.0042. All statistical tests were two sided. An outlier sensitivity analysis was performed on models where there were extreme values (HCRU number in past 6 months, direct medical cost variables), where models were rerun excluding observations with extreme outlier values. All analyses were conducted using R 4.2.0, SAS 9.4, and SPSS 29.0.
Results
Prior to matching procedures, analyses included 163 adults with idiopathic hypersomnia and 141,345 individuals without idiopathic hypersomnia. After matching, the idiopathic hypersomnia cohort was compared to 326 individuals in the matched non–idiopathic hypersomnia cohort (Figure 1).
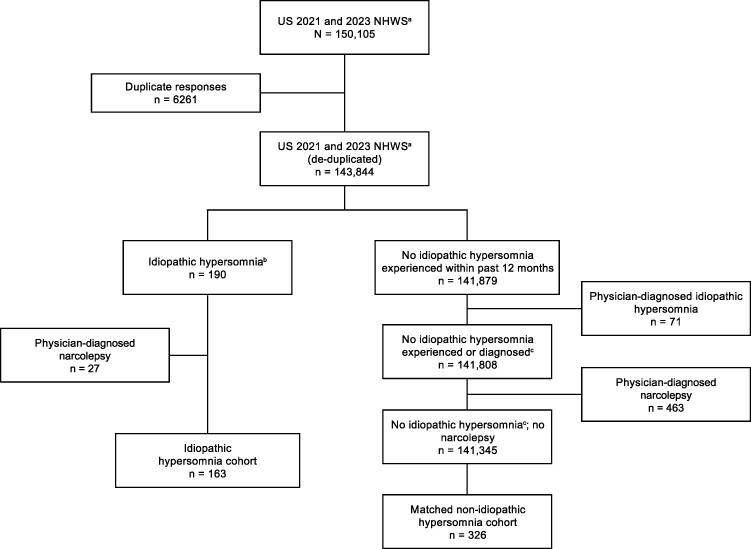 |
Figure 1 Study population in the 2021 or 2023 US NHWS survey. Abbreviations: NHWS, National Health and Wellness Survey; US, United States. Notes: aNHWS was reviewed by Pearl Institutional Review Board (Indianapolis, IN) and granted exemption status. bRespondents experienced idiopathic hypersomnia within the past 12 months and reported a physician diagnosis of idiopathic hypersomnia. cRespondents did not experience idiopathic hypersomnia within the past 12 months or report a physician diagnosis of idiopathic hypersomnia. |
Participant Characteristics
The mean (SD) age of adults with idiopathic hypersomnia was 38.45 (13.69) years; the majority were female (64.4%), White (79.8%), non-Hispanic (85.9%), and employed (66.3%). Fewer than half of adults with idiopathic hypersomnia were married/living with a partner (47.9%), had a four-year university degree or higher education (43.6%), or were commercially insured (49.1%) (Supplementary Table 1).
Before propensity score matching, the mean (SD) age of adults without idiopathic hypersomnia was 47.77 (17.65) years; the majority were White (72.0%), non-Hispanic (87.0%), and employed (61.2%). Over half of adults without idiopathic hypersomnia were female (54.9%), were married/living with a partner (58.3%), had a four-year university degree or higher education (52.3%), and were commercially insured (52.6%) (Supplementary Table 1).
Adults with idiopathic hypersomnia received a physician diagnosis of their condition a mean (SD) of 11.80 (12.02) years before they completed the NHWS. Less than half (44.2%) were currently taking prescription medication for the treatment of idiopathic hypersomnia, of which 69.4% (n=50, 30.7% of the total idiopathic hypersomnia cohort) were taking an alerting agent (stimulant or wakefulness-promoting) and 4.2% (n=3, 1.8% of the total idiopathic hypersomnia cohort) were taking an oxybate (Supplementary Table 2). Among adults with idiopathic hypersomnia, the mean (SD) ESS score was 12.69 (6.07), and the median ESS score was 14.00 (data not shown).
Prior to propensity score matching, differences were observed in all sociodemographic and general health characteristics between the idiopathic hypersomnia and non-idiopathic hypersomnia cohorts, except for ethnicity (Table 1 and Supplementary Table 1). After propensity score matching, covariates were well balanced between the two cohorts (all SMDs < 0.10) (Table 1). A love plot depicting covariate balance before and after matching is included as Supplementary Figure 1. The largest maximum empirical cumulative distribution function (eCDF) before matching was 0.164, which was for the covariate age, category ≥65 years. Post match, the largest maximum eCDF was 0.057, which was for the covariate race, category Black or African American.
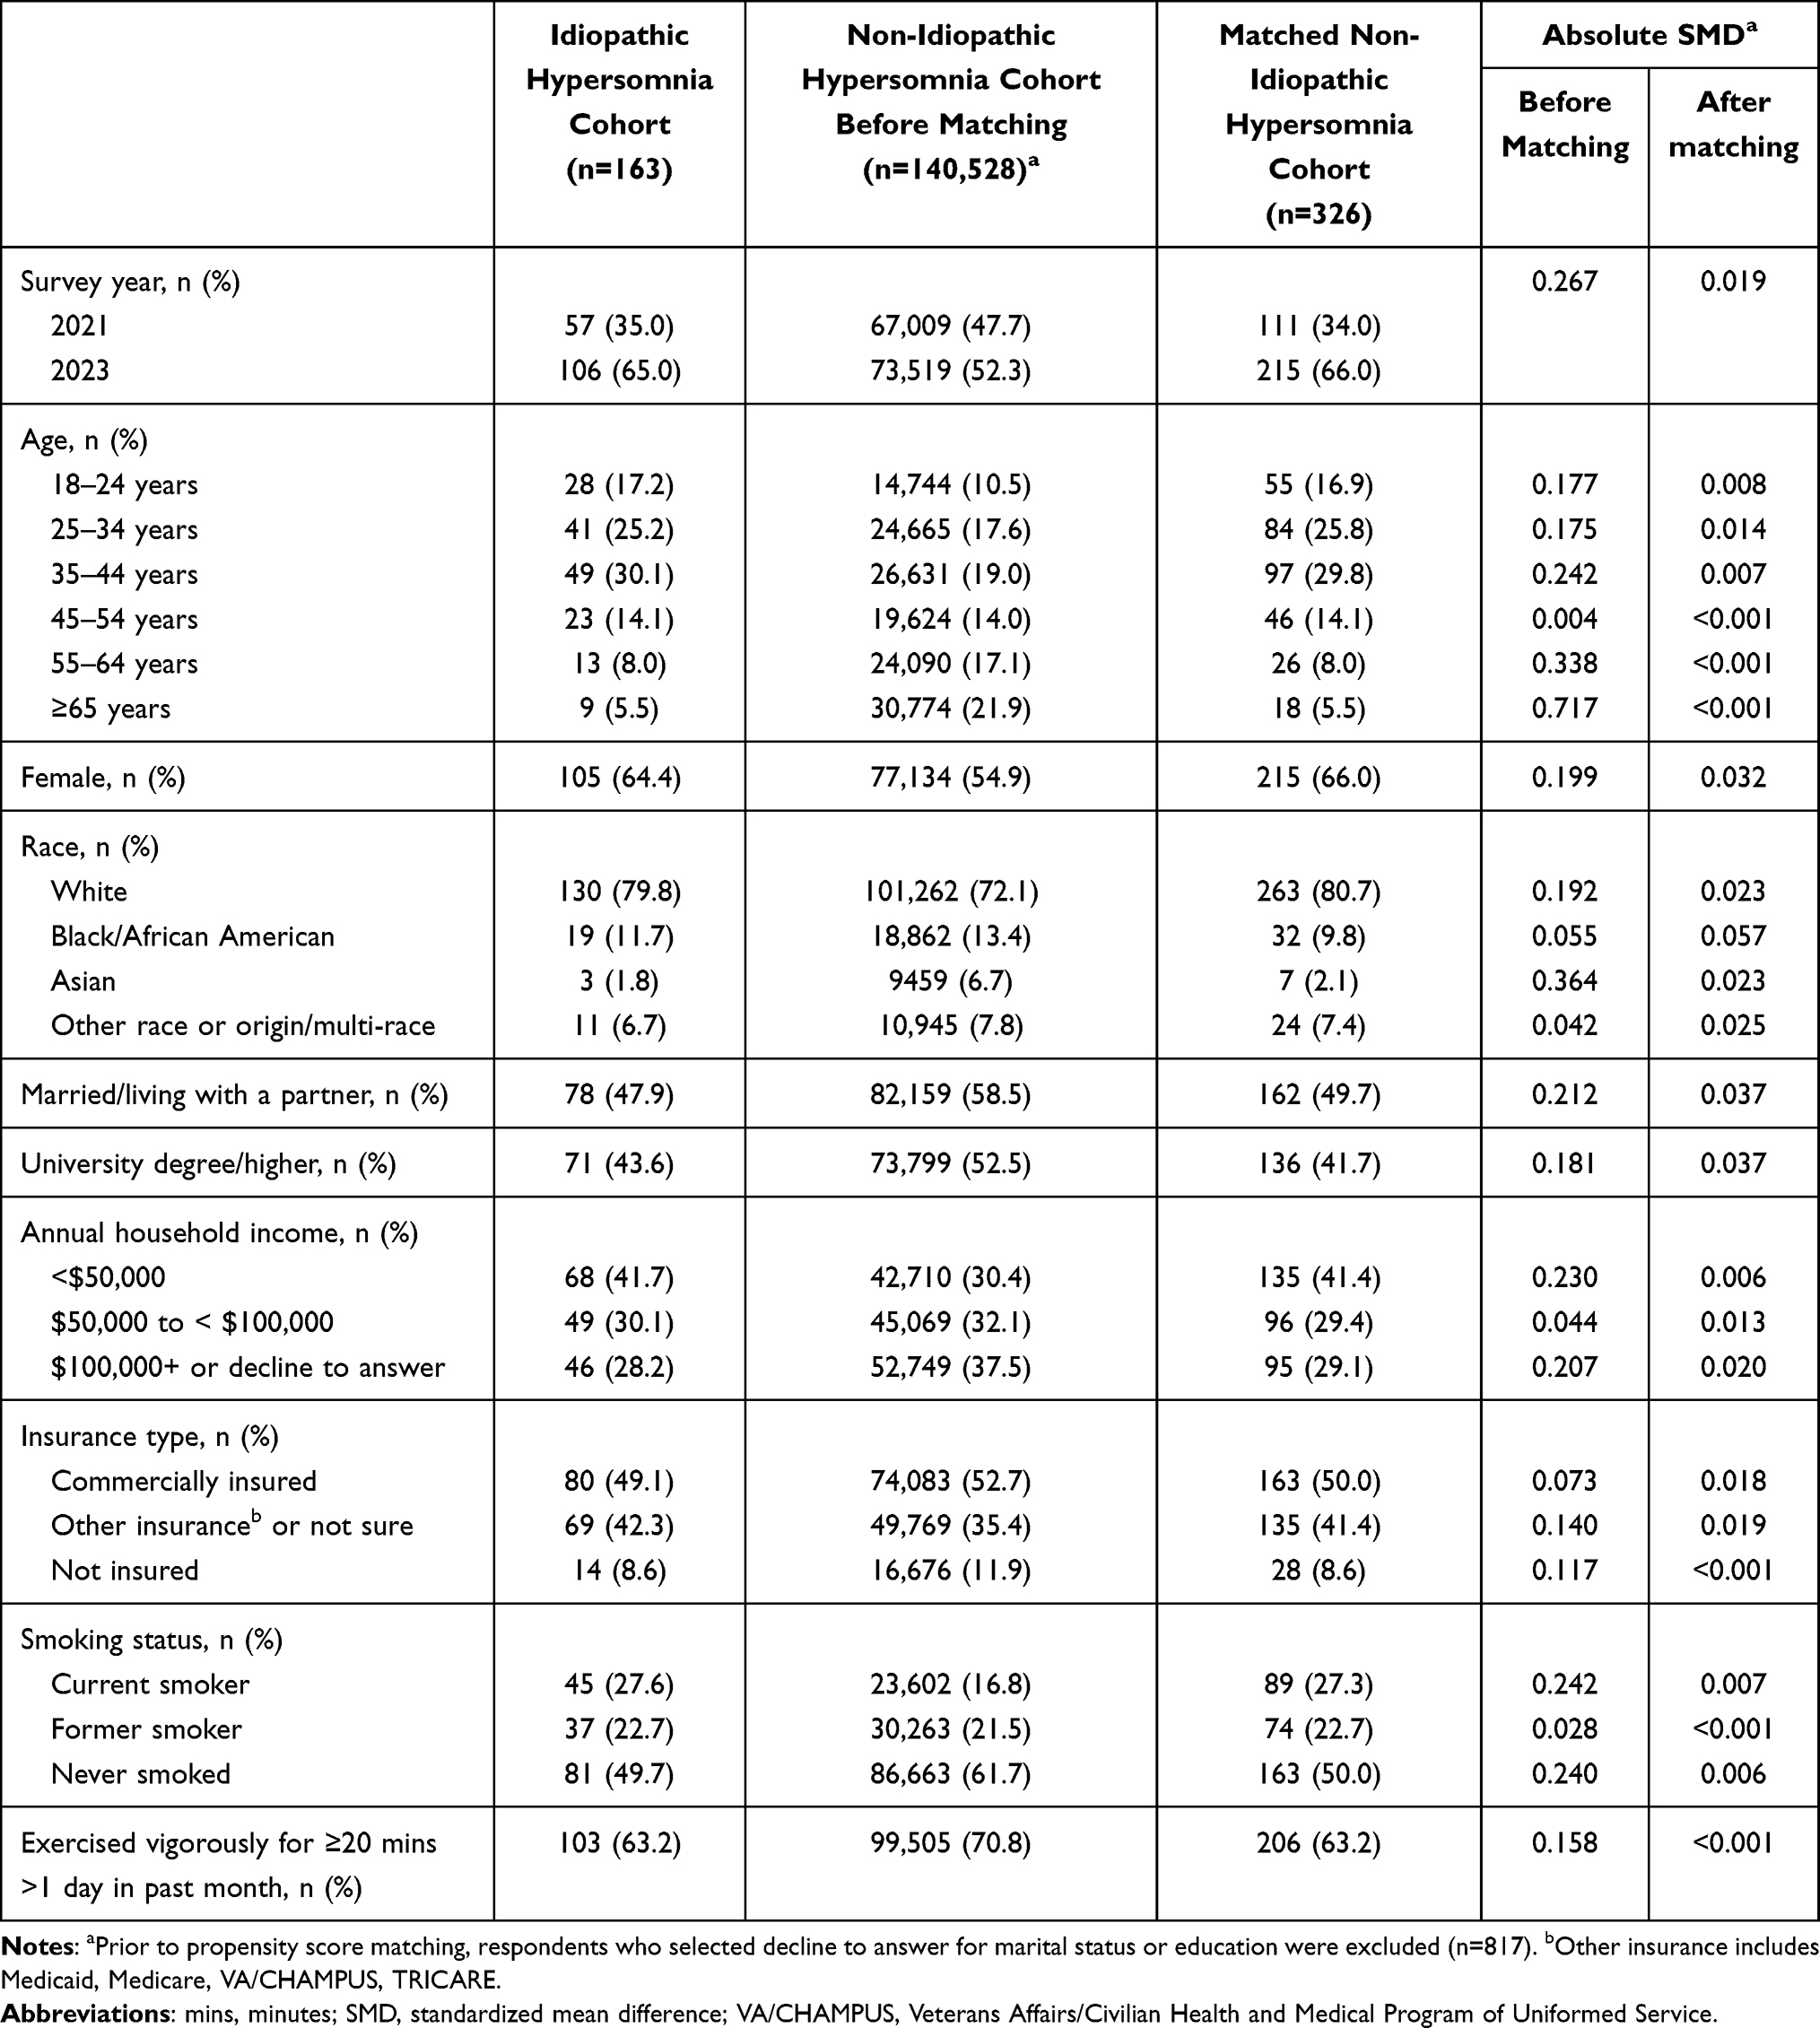 |
Table 1 Counts, Frequencies, and Standardized Mean Differences of Covariates Before and After Matching |
Relative to the matched non-idiopathic hypersomnia cohort, the idiopathic hypersomnia cohort had a higher body mass index (mean [SD]: 29.01 [8.57] vs 27.33 [7.23], P=0.030), higher CCI scores (mean [SD]: 1.43 [2.26] vs 0.34 [1.03], P < 0.001), and a higher proportion with CCI scores of 1 (11.0% vs 4.6%), 2 (15.3% vs 8.0%), or 3+ (20.9% vs 2.8%) (P < 0.001) (Table 2).
 |
Table 2 Additional Sociodemographic and Health Characteristics of Idiopathic Hypersomnia Cohort Versus Matched Non-Idiopathic Hypersomnia Cohort |
Comorbidity Burden
The prevalence of self-reported physician-diagnosed comorbidities among the idiopathic hypersomnia and matched non-idiopathic hypersomnia cohorts is shown in Table 3. The most prevalent comorbid conditions among the idiopathic hypersomnia cohort, all of which were more prevalent compared with the matched non-idiopathic hypersomnia cohort (all P < 0.001), were chronic pain (65.0% vs 29.4%, PR 2.21, 95% CI 1.83–2.26), depression (60.7% vs 30.7%, PR 1.98, 95% CI 1.64–2.38), anxiety (55.8% vs 26.7%, PR 2.09, 95% CI 1.67–2.62), generalized anxiety disorder (49.7% vs 16.6%, PR 3.00, 95% CI 2.26–3.97), headache or migraine (46.0% vs 16.0%, PR 2.88, 95% CI 2.18–3.81), pain (42.9% vs 16.3%, PR 2.64, 95% CI 2.02–3.45), and autoimmune disorders (42.3% vs 12.0%, PR 3.54, 95% CI 2.50–5.01) (Table 3). Other conditions that were more prevalent (≥20% of the sample) and higher among adults in the idiopathic hypersomnia cohort compared to adults in the matched non-idiopathic hypersomnia cohort included insomnia (38.7% vs 14.1%, PR 2.74, 95% CI 1.99–3.77, P < 0.001), attention deficit disorder (ADD)/attention deficit hyperactivity disorder (ADHD; 36.2% vs 8.3%, PR 4.37, 95% CI 2.93–6.52, P < 0.001), sleep apnea (30.7% vs 4.6%, PR 6.67, 95% CI 4.04–11.00, P < 0.001), post-traumatic stress disorder (PTSD; 30.1% vs 6.4%, PR 4.67, 95% CI 2.87–7.59, P < 0.001), high blood pressure (27.6% vs 16.6%, PR 1.67, 95% CI 1.18–2.35, P=0.003), high cholesterol (27.6% vs 15.0%, PR 1.84, 95% CI 1.32–2.55, P < 0.001), digestive conditions (25.2% vs 8.9%, PR 2.83, 95% CI 1.84–4.35, P < 0.001), social anxiety disorder (24.5% vs 7.7%, PR 3.20, 95% CI 2.07–4.94, P < 0.001), panic disorder (23.3% vs 5.2%, PR 4.47, 95% CI 2.56–7.79, P < 0.001), other sleep difficulties (23.3% vs 4.9%, PR 4.75, 95% CI 2.80–8.05, P < 0.001), asthma (21.5% vs 8.3%, PR 2.59, 95% CI 1.62–4.14, P < 0.001), and obsessive-compulsive disorder (20.2% vs 2.5%, PR 8.25, 95% CI 3.88–17.52, P < 0.001) (Table 3).
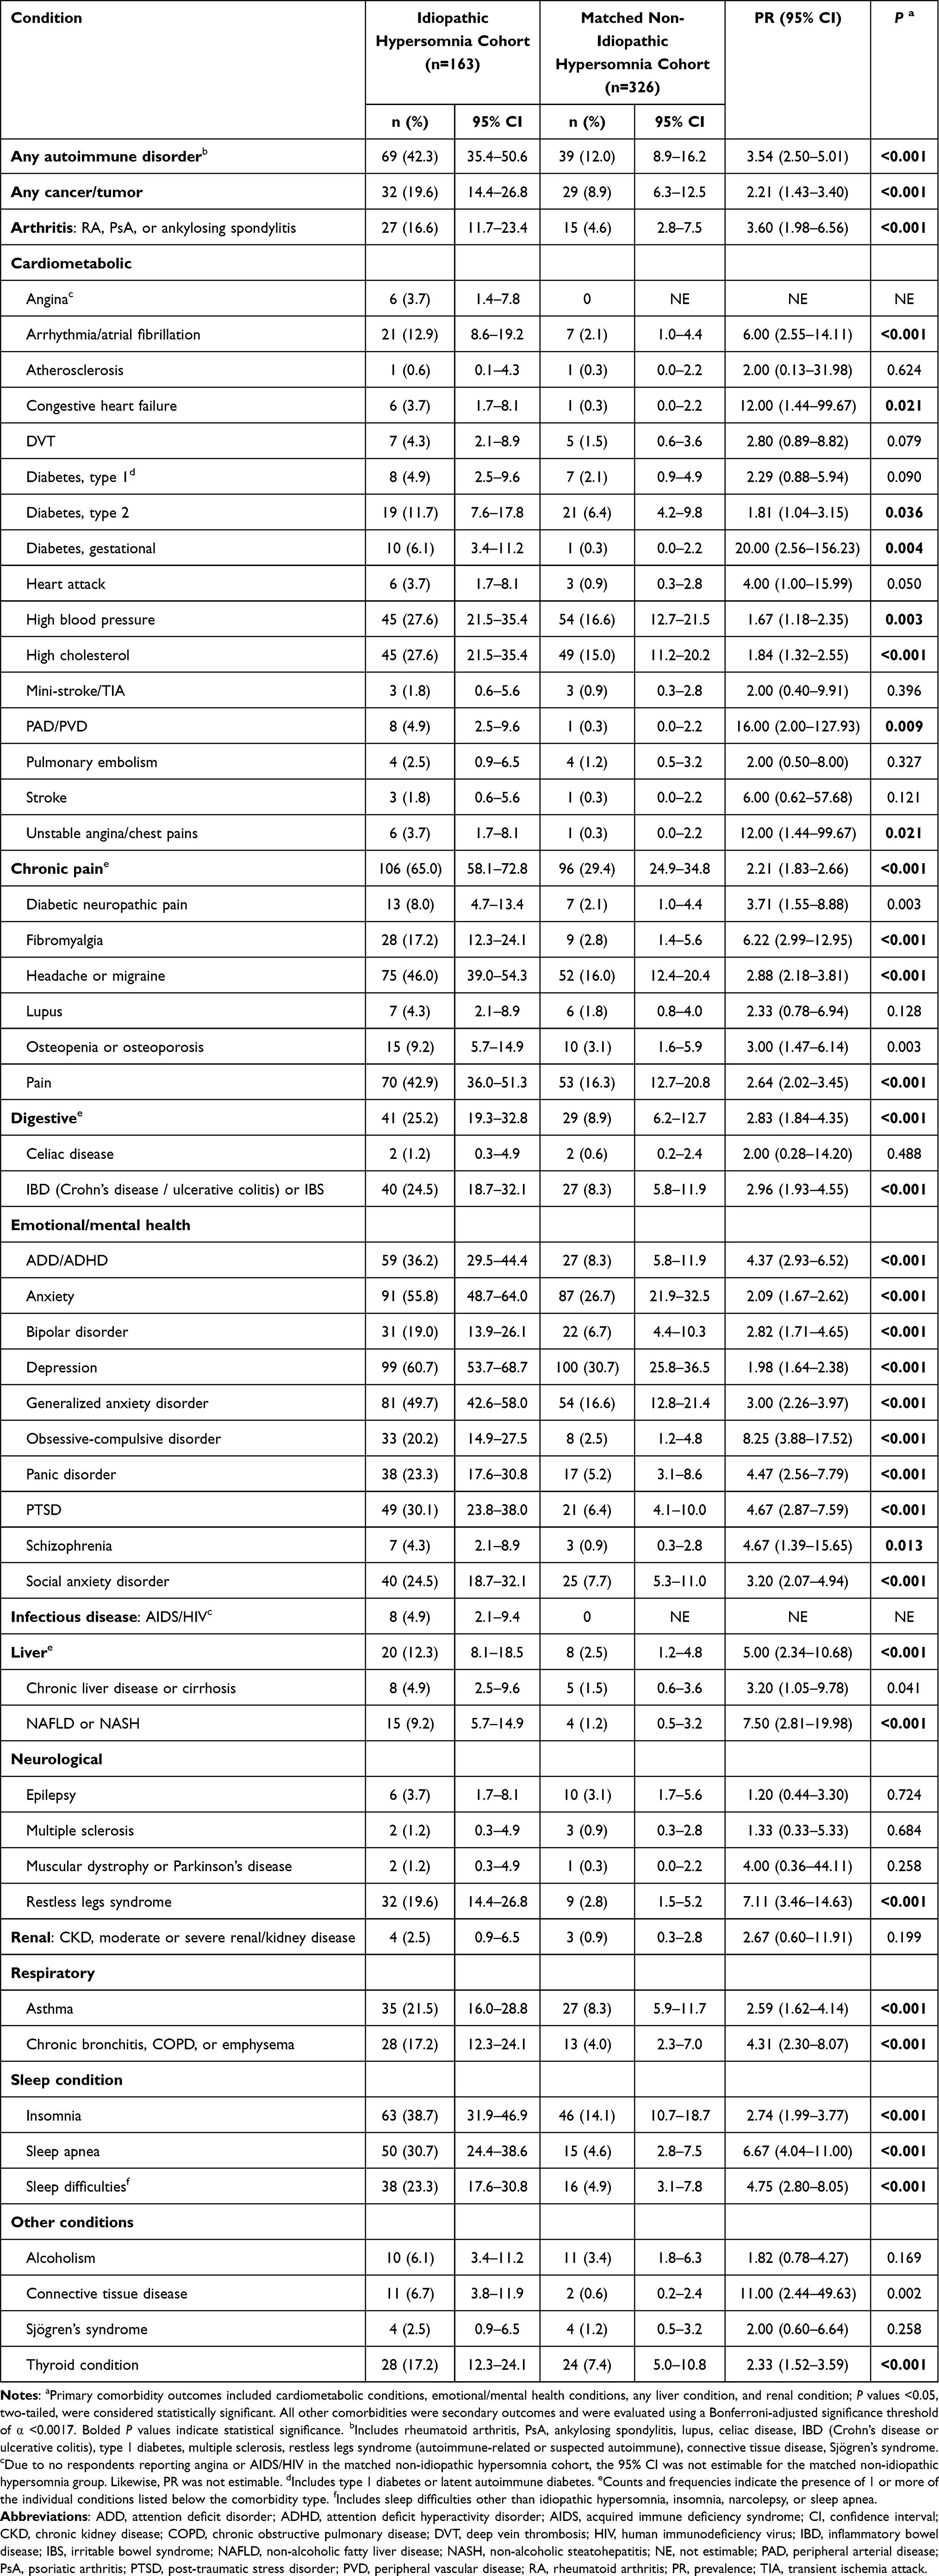 |
Table 3 Self-Reported Comorbidity Burden Diagnosed by a Physician Among Adults with Idiopathic Hypersomnia Versus Matched Non-Idiopathic Hypersomnia Cohort |
Humanistic Burden
Overall, a higher proportion (95% CI) of the idiopathic hypersomnia cohort reported PHQ-9 scores ≥10, indicating moderate levels of depression, compared to the matched non-idiopathic hypersomnia cohort (62.0% [54.9–69.9] vs 34.4% [29.2–40.5], PR 1.80, 95% CI 1.50–2.16, P < 0.001). Adults with idiopathic hypersomnia showed higher proportions (95% CI) of mild (26.4% [20.4–34.1] vs 19.6% [15.8–24.4]), moderate (30.1% [23.8–38.0] vs 14.4% [11.3–18.5]), moderately severe (17.8% [12.8–24.8] vs 13.5% [10.1–18.0]), and severe (14.1% [9.7–20.6] vs 6.4% [4.3–9.6]) depression based on PHQ-9 scores compared to the matched non-idiopathic hypersomnia cohort. The idiopathic hypersomnia cohort had significantly higher mean (95% CI) PHQ-9 scores (11.91 [10.92–12.91] vs 7.53 [6.63–8.42]; SMD 0.567, 95% CI 0.376–0.759, P < 0.001), indicative of moderate depression, compared to the matched non-idiopathic hypersomnia cohort (Figure 2A and Table 4).
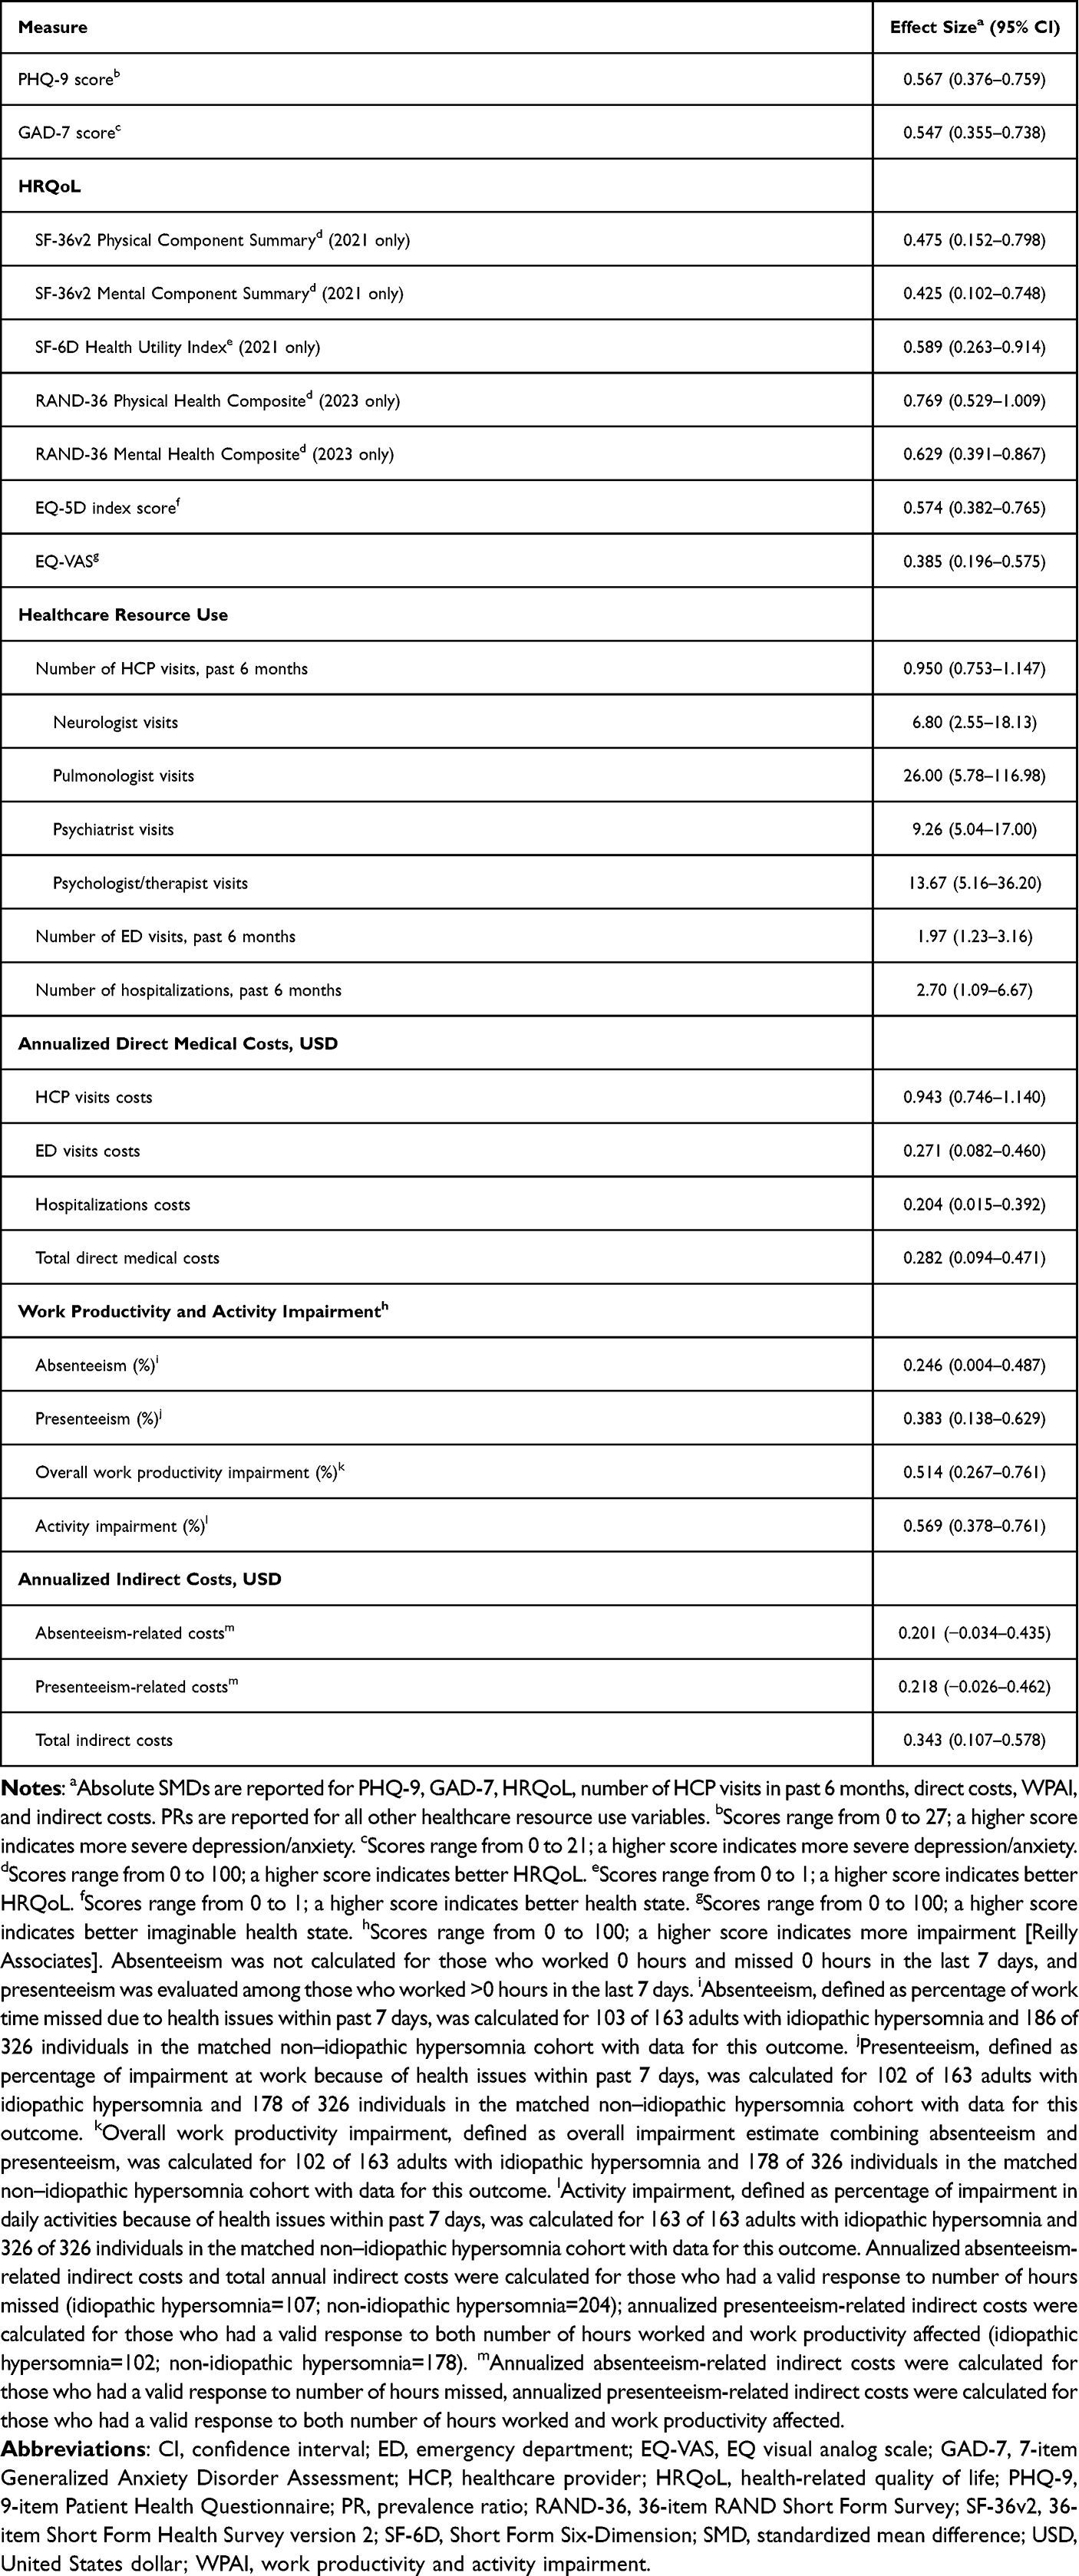 |
Table 4 Effect Sizes (Absolute Standardized Mean Differences) and 95% Confidence Intervals for Humanistic and Economic Outcomes Comparing Among Adults with Idiopathic Hypersomnia to the Matched Non-Idiopathic Hypersomnia Cohort |
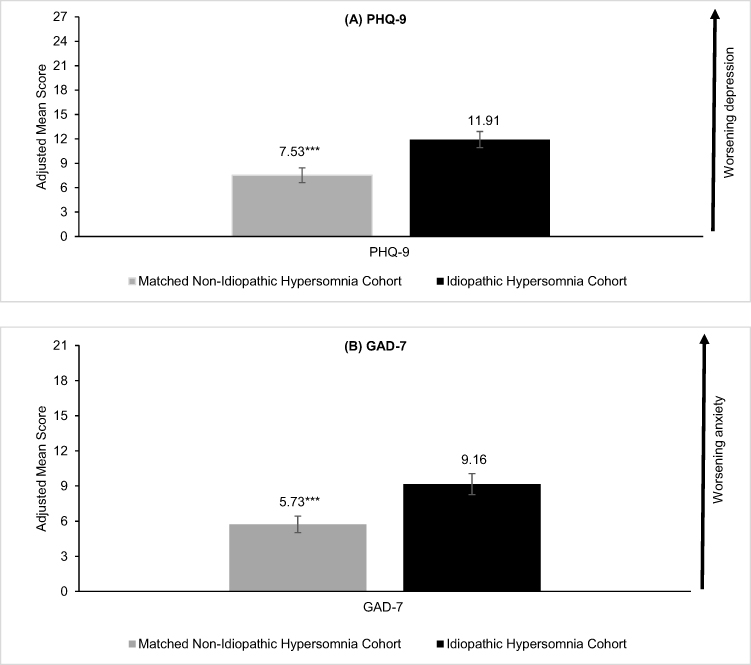 |
Figure 2 Depression and anxiety outcomes in adults with idiopathic hypersomnia versus matched non-idiopathic hypersomnia cohort. (A) PHQ-9 score. (B) GAD-7 score. Abbreviations: CI, confidence interval; GAD-7, 7-item Generalized Anxiety Disorder Assessment; PHQ-9, 9-item Patient Health Questionnaire. Notes: ***P < 0.001 is reported for comparisons between the idiopathic hypersomnia and matched non-idiopathic hypersomnia cohorts. Error bars represent 95% CI. |
Overall, a higher proportion (95% CI) of the idiopathic hypersomnia cohort reported GAD-7 scores ≥10, indicating moderate levels of anxiety, compared to the matched non-idiopathic hypersomnia cohort (43.6% [36.6–51.9] vs 23.3% [18.7–29.0], PR 1.87, 95% CI 1.43–2.45, P < 0.001). The idiopathic hypersomnia cohort exhibited higher proportions (95% CI) of mild (31.3% [24.9–39.3] vs 24.8% [20.4–30.3]), moderate (24.5% [18.8–32.1] vs 12.9% [9.6–17.3]), and severe (19.0% [13.9–26.1] vs 10.4% [7.6–14.4]) anxiety as measured by GAD-7 scores, compared to the matched non-idiopathic hypersomnia cohort. In addition, those with idiopathic hypersomnia had significantly higher mean (95% CI) GAD-7 scores (9.16 [8.26–10.06] vs 5.73 [5.03–6.43]; SMD 0.547, 95% CI 0.355–0.738, P < 0.001), indicative of mild anxiety, compared to the matched non-idiopathic hypersomnia cohort (Figure 2B and Table 4).
Compared to the matched non-idiopathic hypersomnia cohort, the idiopathic hypersomnia cohort reported poorer physical function, mental health function, and HRQoL. Specifically, adults with idiopathic hypersomnia had significantly lower mean (95% CI) PCS scores (45.09 [42.76–47.42] vs 49.93 [47.93–51.92]; SMD 0.475, 95% CI 0.152–0.798, P < 0.001, as measured by the SF-36v2 in 2021) (Figure 3A and Table 4) and PHC scores (36.80 [34.80–38.80] vs 44.95 [43.43–46.48]; SMD 0.733, 95% CI 0.494–0.972, P < 0.001, as measured by the RAND-36 in 2023) (Figure 3B and Table 4), as well as lower scores on the physical functioning, role-physical, bodily pain, and general health subscales for both measures (Supplementary Table 3). Likewise, adults with idiopathic hypersomnia reported significantly lower mean (95% CI) MCS scores (37.70 [34.27–41.13] vs 43.70 [40.99–46.41]; SMD 0.425, 95% CI 0.102–0.748, P=0.001, SF-36v2 in 2021) (Figure 3A and Table 4) and MHC scores (31.99 [29.94–34.04] vs 39.56 [37.88–41.25]; SMD 0.629, 95% CI 0.391–0.867, P < 0.001, RAND-36 in 2023) (Figure 3B and Table 4), as well as lower scores on the social functioning, role-emotional, and vitality subscales for both measures and the mental health subscale for the RAND-36 (Supplementary Table 3). The idiopathic hypersomnia cohort exhibited poorer HRQoL and health states compared to the matched non-idiopathic hypersomnia cohort, as demonstrated by lower mean (95% CI) SF-6D health utility scores (0.61 [0.58–0.63] vs 0.69 [0.66–0.72]; SMD 0.589, 95% CI 0.263–0.914, P < 0.001), EQ-5D index scores (0.68 [0.65–0.70] vs 0.79 [0.76–0.80]; SMD 0.574, 95% CI 0.382–0.765, P < 0.001), and EQ-VAS scores (63.67 [59.90–67.44] vs 73.00 [70.39–75.61]; SMD 0.385, 95% CI 0.196–0.575, P < 0.001) (Figure 3C and D, Table 4). The differences observed between the idiopathic hypersomnia and the matched non-idiopathic hypersomnia cohorts on these HRQoL measures exceed established clinically meaningful thresholds.
 |
Figure 3 HRQoL outcomes among adults with idiopathic hypersomnia versus matched non-idiopathic hypersomnia cohort. (A) SF-36v2.a (B) RAND-36.b (C) SF-6D Health Utilities Indexa and EQ-5D Index. (D) EQ-VAS. Abbreviations: CI, confidence interval; EQ-VAS, EQ visual analog scale; HRQoL, health-related quality of life; RAND-36, 36-item RAND Short Form Survey; SF-36v2, 36-item Short Form Health Survey version 2; SF-6D, Short Form Six-Dimension. Notes: aSF-36v2 completed by 2021 US NHWS respondents (Idiopathic Hypersomnia Cohort: n=57; Matched Non-Idiopathic Hypersomnia Cohort: n=111) bRAND-36 completed by 2023 US NHWS respondents (Idiopathic Hypersomnia Cohort: n=106; Matched Non-Idiopathic Hypersomnia Cohort: n=215). ***P < 0.001 is reported for comparisons between the idiopathic hypersomnia and matched non-idiopathic hypersomnia cohorts. Error bars represent 95% CI. |
Economic Burden
The idiopathic hypersomnia cohort had significantly more HCP visits in the past 6 months compared to the matched non-idiopathic hypersomnia cohort (mean [95% CI]: 13.34 [10.66–16.03] vs 3.14 [2.64–3.63]; SMD 0.950, 95% CI 0.753–1.147, P < 0.001), with a notably higher mean (95% CI) number of visits to neurologists (0.63 [0.29–1.33] vs 0.09 [0.05–0.17]; SMD 6.80, 95% CI 2.55–18.13, P < 0.001), pulmonologists (0.16 [0.09–0.28] vs 0.01 [0.00–0.02]; SMD 26.00, 95% CI 5.78–116.98, P < 0.001), psychiatrists (1.53 [0.92–2.56] vs 0.17 [0.10–0.26]; SMD 9.26, 95% CI 5.04–17.00, P < 0.001), psychologists/therapists (2.81 [2.03–3.89] vs 0.21 [0.08–0.50]; SMD 13.67, 95% CI 5.16–36.20, P < 0.001), as well as ED visits (0.88 [0.64–1.20] vs 0.45 [0.30–0.65]; SMD 1.97, 95% CI 1.23–3.16, P=0.005) and hospitalizations (0.95 [0.48–1.85] vs 0.35 [0.19–0.65]; SMD 2.70, 95% CI 1.09–6.67, P=0.031) (Figure 4A and Figure 4B, Table 4). A significantly higher percentage (95% CI) of individuals in the idiopathic hypersomnia cohort had at least one HCP visit in the past 6 months compared with individuals in the matched non-idiopathic hypersomnia cohort (97.6% [95.2–99.9] vs 74.9% [69.8–80.3], PR 1.30, 95% CI 1.21–1.40, P < 0.001), with a greater proportion also visiting neurologists, pulmonologists, psychiatrists, psychologists/therapists, visiting EDs, or being hospitalized during this period (Supplementary Table 4).
 |
Figure 4 HCRU and associated annualized direct medical costs in adults with idiopathic hypersomnia versus matched non–idiopathic hypersomnia cohort. (A) Mean number of total HCP visits within past 6 months. (B) Mean number of select specialist visits, ED visits, and hospitalizations within past 6 months. (C) Mean annualized direct medical costs. Abbreviations: CI, confidence interval; ED, emergency department; HCP, healthcare provider; HCRU, healthcare resource use. Notes: ***P < 0.001, **P < 0.01, and *P < 0.05 are reported for comparisons between the idiopathic hypersomnia and matched non-idiopathic hypersomnia cohorts. aHCP visits include general practitioner/family practitioner, internist, allergist, cardiologist, dentist, dermatologist, diabetologist, endocrinologist, gastroenterologist, geriatrician, gynecologist, hepatologist, infectious disease specialist, neurologist, nephrologist, nurse practitioner/physician assistant, obstetrician, oncologist, ophthalmologist, orthopedist, otolaryngologist, plastic surgeon, podiatrist, psychiatrist, psychologist/therapist, pulmonologist, respiratory therapist, rheumatologist, urologist, and other medical specialists. Error bars represent 95% CI. |
The idiopathic hypersomnia cohort showed significantly higher annualized mean (95% CI) direct medical costs compared to the matched non-idiopathic hypersomnia cohort, including costs for HCP visits ($10,575.63 [8422.62–12,728.64] vs $2470.94 [2084.00–2857.88]; SMD 0.943, 95% CI 0.746–1.140, P < 0.001), ED visits ($2533.41 [1737.22–3329.60] vs $1262.95 [783.20–1742.69]; SMD 0.271, 95% CI 0.082–0.460, P=0.005), hospitalizations ($33,315.35 [7327.42–59,303.29] vs $10,966.32 [4324.64–17,608.01]; SMD 0.204, 95% CI 0.015–0.392, P=0.101), and total direct medical costs ($46,424.39 [20,134.62–72,714.16] vs $14,700.21 [7589.51–21,810.91]; SMD 0.282, 95% CI 0.094–0.471, P=0.022) (Figure 4C and Table 4). Median (Q1–Q3) values for HCRU and cost outcomes further characterize the distribution of utilization and expenditures across cohorts, demonstrating right-skewed cost distributions with higher central tendencies among individuals with idiopathic hypersomnia (Supplementary Table 5).
The idiopathic hypersomnia cohort showed higher mean (95% CI) absenteeism (20.15 [15.18–25.11] vs 13.81 [10.09–17.52]; SMD 0.246, 95% CI 0.004–0.487, P=0.034), presenteeism (40.59 [34.97–46.21] vs 28.88 [24.26–33.50]; SMD 0.383, 95% CI 0.138–0.629, P < 0.001), overall work productivity impairment (49.07 [42.98–55.16] vs 32.28 [27.38–37.19]; SMD 0.514, 95% CI 0.267–0.761, P < 0.001), and activity impairment (48.22 [43.69–52.75] vs 30.77 [27.38–34.16]; SMD 0.569, 95% CI 0.378–0.761, P < 0.001) compared to the matched non-idiopathic hypersomnia cohort, indicating substantial impacts on both professional and daily activities (Figure 5A and Table 4). Compared to the matched non-idiopathic hypersomnia cohort, the idiopathic hypersomnia cohort also had higher total indirect costs due to overall work productivity impairment (mean [95% CI]: $15,269.22 [12,465.07–18,073.37] vs $10,576.96 [8784.28–12,369.65]; SMD 0.343, 95% CI 0.107–0.578, P=0.002) (Figure 5B and Table 4). Median indirect costs are presented in Supplementary Table 5.
 |
Figure 5 WPAI and associated annualized indirect costs among adults with idiopathic hypersomnia versus matched non-idiopathic hypersomnia cohort. (A) Work productivity and activity impairment. (B) Annualized indirect costs. Abbreviations: CI, confidence interval; WPAI, work productivity and activity impairment. Notes: ***P < 0.001, **P < 0.01, and *P < 0.05 are reported for comparisons between the idiopathic hypersomnia and matched non-idiopathic hypersomnia cohorts. aIn the last 7 days, absenteeism was not calculated for those who worked 0 hours and missed 0 hours, and presenteeism was evaluated among those who worked >0 hours. Absenteeism, defined as percentage of work time missed due to health issues within past 7 days, was calculated for 103 of 163 adults with idiopathic hypersomnia and 186 of 326 individuals in the matched non–idiopathic hypersomnia cohort with data for this outcome. bPresenteeism, defined as percentage of impairment at work because of health issues within past 7 days, was calculated for 102 of 163 adults with idiopathic hypersomnia and 178 of 326 individuals in the matched non–idiopathic hypersomnia cohort with data for this outcome. cOverall work productivity impairment, defined as overall impairment estimate combining absenteeism and presenteeism, was calculated for 102 of 163 adults with idiopathic hypersomnia and 178 of 326 individuals in the matched non–idiopathic hypersomnia cohort with data for this outcome. dActivity impairment, defined as percentage of impairment in daily activities because of health issues within past 7 days, was calculated for 163 of 163 adults with idiopathic hypersomnia and 326 of 326 individuals in the matched non–idiopathic hypersomnia cohort with data for this outcome. Annualized absenteeism-related indirect costs and total annual indirect costs were calculated for those who had a valid response to number of hours missed (idiopathic hypersomnia=107; non-idiopathic hypersomnia=204); annualized presenteeism-related indirect costs were calculated for those who had a valid response to both number of hours worked and work productivity affected (idiopathic hypersomnia=102; non-idiopathic hypersomnia=178). Error bars represent 95% CI. |
Sensitivity Analysis
After removal of extreme outliers, the results were consistent with the primary analysis, with higher mean (95% CI) healthcare utilization (HCP visits: 10.82 [9.34–12.30] vs 3.14 [2.64–3.63]; SMD 1.17, 95% CI 0.966–1.373, P < 0.001) and higher mean (95% CI) total direct medical costs (27,954.26 [20,347.95–35,560.57] vs 9317.71 [6682.19–11,953.22]; SMD 0.55, 95% CI 0.36–0.75, P < 0.001) observed in the idiopathic hypersomnia cohort compared with the matched non-idiopathic hypersomnia cohort (Supplementary Tables 6a and 6b).
Discussion
This cross-sectional study, using de-duplicated self-reported data from the 2021 and 2023 NHWS, builds on prior research that utilized administrative claims databases12 to highlight the significant comorbidity, humanistic, and economic burden among individuals with idiopathic hypersomnia compared with a matched sample of individuals without idiopathic hypersomnia in the US. Overall, results showed that idiopathic hypersomnia respondents had significantly higher comorbidity burden, poorer HRQoL, greater impairments in work productivity and activity, and higher HCRU and associated costs compared with matched respondents without idiopathic hypersomnia.
In the present study, adults with idiopathic hypersomnia had a significantly higher prevalence of physician-diagnosed comorbidities across various conditions compared with matched respondents without idiopathic hypersomnia, including cardiovascular and cardiometabolic (eg arrhythmia, type 2 diabetes, high cholesterol, high blood pressure), sleep (eg insomnia, sleep apnea), psychiatric (eg ADD/ADHD, anxiety, depression, PTSD), and other (eg headache/migraine, autoimmune and thyroid conditions, restless leg syndrome) comorbidities. Nearly two-thirds of the respondents reported chronic pain, and 42% reported autoimmune disorders. These findings align with claims-based studies that found higher prevalence of cardiovascular, cardiometabolic, sleep, psychiatric, and other comorbidities (eg headache/migraine, autoimmune, or renal) among those with idiopathic hypersomnia compared to matched individuals without idiopathic hypersomnia.13,14 In line with a recent study,12 nearly one-third of our study respondents had sleep apnea. However, the prevalence of several comorbidities, such as anxiety, depression, PTSD, and restless legs syndrome, reported in the current study are higher than earlier reports of individuals with idiopathic hypersomnia.8,45 The higher prevalence of comorbidities in individuals with idiopathic hypersomnia may compound the burden of this condition and worsen their HRQoL.
Idiopathic hypersomnia respondents reported significantly higher humanistic burden as evidenced by higher levels of depression and anxiety compared with the matched non-idiopathic hypersomnia cohort. It is notable that over 60% and 40% of adults with idiopathic hypersomnia had PHQ-9 and GAD-7 scale scores ≥10, which may indicate the presence of major depressive disorder and generalized anxiety disorder, respectively. Additionally, clinical visits to behavioral HCPs (eg psychiatrists and psychologists/therapists) accounted for approximately one-third of the number of HCP visits in the past 6 months, on average (mean number of psychologist visits [2.81] + mean number of psychiatrist visits [1.53]=4.34/mean number of HCP visits [13.34]=32.5%). These findings are in agreement with other studies that reported a substantial burden of depression and anxiety among those with idiopathic hypersomnia.8,46 In the Real-World Idiopathic Hypersomnia Outcomes study (ARISE), nearly 35% of the idiopathic hypersomnia respondents reported anxiety and 12% reported experiencing major depressive disorder.8 In another cross-sectional study, PHQ-9 scores were higher among idiopathic hypersomnia respondents compared to a healthy cohort.46 However, these studies utilized smaller sample sizes, thereby limiting the generalizability of the results to a broader population.
In addition, adults with idiopathic hypersomnia exhibited poorer physical function, mental health function, and HRQoL than the matched non-idiopathic hypersomnia cohort. Our findings corroborate previous research that reported diminished HRQoL and impairment in daily functioning in individuals with idiopathic hypersomnia.8,46 That the differences between these cohorts exceeded established MCIDs/MIDs indicates that the idiopathic hypersomnia cohort had clinically meaningful lower HRQoL compared to the non-idiopathic hypersomnia cohort.
Our study also demonstrated the economic burden of idiopathic hypersomnia. The number of hospitalizations, HCP visits, and ED visits in a 6-month period was significantly higher among the idiopathic hypersomnia cohort than among the matched non-idiopathic hypersomnia cohort. Total annualized direct medical costs were over 3 times greater among the idiopathic hypersomnia cohort than the matched non-idiopathic hypersomnia cohort. Further, employed adults in the idiopathic hypersomnia cohort had higher absenteeism, presenteeism, and overall work productivity impairment compared to the employed matched non-idiopathic hypersomnia cohort. Activity impairment was also higher among the idiopathic hypersomnia cohort than the matched non-idiopathic hypersomnia cohort. Greater work productivity impairment resulted in higher indirect costs among the idiopathic hypersomnia cohort compared with the matched non-idiopathic hypersomnia cohort. On average, employed adults with idiopathic hypersomnia reported work productivity impairment 49% of the time in the current study, which is similar to the rate found in the ARISE study (51%).8 Studies by Jennum et al in the Danish population reported higher total direct medical costs and indirect costs among individuals with idiopathic hypersomnia than among controls.9,16 Taken together, these findings signify the high economic burden of idiopathic hypersomnia. The present study, which utilizes US data, indicates that the costs of idiopathic hypersomnia are substantial and pose a significant burden on individuals with idiopathic hypersomnia, employers, and the healthcare system.
In the current study, less than half of the idiopathic hypersomnia cohort (44%) was taking a prescription medication for their idiopathic hypersomnia. While two-thirds of the treated adults with idiopathic hypersomnia were taking an alerting agent (stimulant or wakefulness-promoting drug), this represents less than one-third (31%) of the total idiopathic hypersomnia sample. Further, just three respondents were taking an oxybate for their idiopathic hypersomnia. These findings may suggest that the unmet need experienced by individuals with idiopathic hypersomnia could be addressed through optimizing treatment strategies. However, as there was no approved medication for the treatment of idiopathic hypersomnia until low-sodium oxybate was approved in August 2021,47–50 individuals with idiopathic hypersomnia only had the option of off-label medications. While off-label treatments may improve daytime alertness in other conditions, data regarding their effectiveness for the treatment of idiopathic hypersomnia are limited.51 This could be one reason we observed lower proportions of prescription medication usage in our study.
The overall study findings align with prior literature that idiopathic hypersomnia commonly exists with other burdensome comorbid conditions, which may result in daily life challenges due to poor HRQoL, work and activity impairment, and high HCRU and associated costs, thereby emphasizing the need to assess specific aspects of care, treatment, and comorbidities among this patient population. The underlying risk or increased prevalence of cardiovascular, cardiometabolic, and psychiatric comorbidities in individuals with idiopathic hypersomnia should be considered when selecting treatment.5
Strengths and Limitations
To the best of our knowledge, this study is the first to demonstrate multiple dimensions of patient-reported outcomes, including clinical, humanistic, and economic burden, among a geographically diverse sample of adults with idiopathic hypersomnia living in the US. The retrospective, cross‑sectional study design provided an efficient, population‑level snapshot of these dimensions and allowed for meaningful comparisons with matched controls in a real‑world context. The study is distinguished by its use of patient-reported outcomes to capture the direct experience and perspectives of community-dwelling adults with idiopathic hypersomnia, rather than relying on a clinical trial population, thereby increasing its generalizability. Almost two-thirds of the idiopathic hypersomnia cohort in our study were female, which is consistent with previous reports.11,12
The study was limited by its reliance on self-reported data, which may be influenced by recall bias or false reporting, whether deliberate or unintentional, and may also reflect respondents’ own perceptions and understanding of their conditions, which can contribute to misclassification or under‑/over‑estimation of certain outcomes. Although individuals with self‑reported narcolepsy were excluded, other central hypersomnolence disorders were not specifically excluded. Consequently, some respondents may have had overlapping hypersomnolence conditions, which could influence the observed estimates. Because the study design is cross‑sectional, causal relationships cannot be established, and future research could incorporate association or regression analyses to further explore the potential relationships among these variables. In addition, we were unable to disentangle potential effects of treatment on health outcomes among the idiopathic hypersomnia cohort. As the NHWS is conducted via the Internet, this study may not adequately represent individuals without Internet access or those uncomfortable using the Internet, as well as those who are institutionalized or have severe disabilities; there may be potential bias between respondents who participated and did not participate in the recontact survey. Furthermore, the survey was conducted during the COVID‑19 pandemic, and factors such as depression, anxiety, insomnia, and overall well‑being could have been equally affected in both cohorts.52,53 Another potential limitation of the study is that we measured all-cause HCRU, which limits our ability to solely attribute greater HCRU and associated direct medical costs to idiopathic hypersomnia. Furthermore, the greater HCRU and associated direct medical costs observed could be driven by the higher prevalence of comorbidities in the idiopathic hypersomnia cohort. Regardless of the cause of the greater burden, the higher prevalence of comorbidities in the idiopathic hypersomnia cohort demonstrates the burden of idiopathic hypersomnia compared to those without idiopathic hypersomnia.
Conclusion
This study underscores the substantial comorbidity, HRQoL, HCRU, direct medical cost, and work productivity and activity impairment burdens experienced by adults with idiopathic hypersomnia. The overall findings suggest that an unmet need exists among individuals with idiopathic hypersomnia, indicating the need to assess specific aspects of care, treatment, and comorbidities that contribute to this burden as well as the importance of accurate diagnosis and treatment. Careful attention to optimizing treatment strategies that consider the increased clinical burden in this vulnerable population is needed to minimize the consequences of this devastating disorder.
Abbreviations
CCI, Charlson comorbidity index; ED, emergency department; EQ-5D-5L, 5-level EQ-5D version; EQ-VAS, EQ visual analog scale; ESS, Epworth Sleepiness Scale; GAD-7, 7-item Generalized Anxiety Disorder Assessment; HCP, healthcare provider; HCRU, healthcare resource use; HRQoL, health-related quality of life; MCID, minimal clinically important difference; MCS, mental component summary; MHC, mental health composite; MID, minimally important difference; NHWS, National Health and Wellness Survey; PCS, physical component summary; PHC, physical health composite; PHQ-9, 9-item Patient Health Questionnaire; RAND-36, 36-Item RAND Short Form Survey; SD, standard deviation; SMD, standardized mean difference; SF-36v2, 36-item Short Form Health Survey version 2; SF-6D, Short Form Six-Dimension; WPAI, work productivity and activity impairment.
Data Sharing Statement
The data that support the findings of this study are available from Oracle Corporation. Restrictions apply to the availability of these data, which were used under license for this study. Deidentified, aggregated data are available from the corresponding author with the permission of Oracle Corporation. As the participants of this study did not give written consent for their individual-level data to be shared publicly, individual-level data will not be shared due to the sensitive nature of the research.
Ethical Approval and Informed Consent
The 2023 NHWS protocol and questionnaire were reviewed by Pearl Institutional Review Board (Indianapolis, IN) and received exemption status according to 45 CFR 46.104(d)(2) Tests, Survey, Interviews on April 27, 2023 (IRB ID: 2023-0121). The 2021 NHWS protocol and questionnaire were reviewed by Pearl Institutional Review Board (Indianapolis, IN) and received exemption status according to FDA 21 CFR 56.104 and 45CFR46.104(b)(2): (2) Tests, Surveys, Interviews on February 4, 2021 (IRB ID: 21-KANT-248). All respondents provided informed consent electronically before accessing the survey.
Acknowledgments
Medical writing and editing support were provided by Veeri Rajendra Babu, PhD; Ramu Periyasamy, PhD; and Aiman Lakdawala, MSc, CMPP® from Indegene Ltd., which was funded by Oracle Life Sciences in accordance with Good Publication Practice guidelines. The authors confirm that appropriate permission for use of the ESS was obtained.
The authors thank Vince Skroska of Oracle Life Sciences, for his role in acquiring the licenses for the for the validated patient-reported outcome measures (eg ESS scale) administered in the NHWS and used in our study, and Kathy Annunziata of Oracle Life Sciences, for her role in contributions to the content of the NHWS.
Author Contributions
C Drachenberg: Conceptualization; Funding acquisition; Methodology; Project administration; Supervision; Writing – original draft; Writing – review and editing
MJ Cambron-Mellott: Conceptualization; Methodology; Project administration; Supervision; Visualization; Writing – original draft; Writing – review and editing
L Yang: Formal analysis; Methodology; Validation; Writing – review and editing
BL Balkaran: Formal analysis; Methodology; Validation; Writing – review and editing
M Whalen: Conceptualization; Writing – review and editing
DT Plante: Methodology; Writing – review and editing
All authors gave final approval of the version to be published; agreed on the journal to which the article has been submitted; and agree to be accountable for all aspects of the work.
Funding
This study was funded by Jazz Pharmaceuticals.
Disclosure
C Drachenberg and M Whalen are full-time employees of Jazz Pharmaceuticals who in the course of this employment have received stock options exercisable for, and other stock awards of, ordinary shares of Jazz Pharmaceuticals, plc. MJ Cambron-Mellott, BL Balkaran, and L Yang are/were full-time employees of Oracle Life Sciences, which was paid by Jazz Pharmaceuticals to conduct this study. MJ Cambron-Mellott and BL Balkaran own stock in Oracle Corporation. DT Plante is a consultant and advisory board member for Jazz Pharmaceuticals. He has also served as a consultant/advisory board member for Alkermes, Apnimed, Harmony Biosciences, Centessa, and Takeda and consultant for Aditum Bio, LLC and Teva Pharmaceuticals (Australia).
Results that are included in this paper were presented at SLEEP 2024 (the 38th Annual Meeting of the Associated Professional Sleep Societies, LLC) as two poster presentations. The posters’ abstracts were submitted as late-breaking abstracts, which were published in a downloadable PDF of late-breaking abstracts from the Sleep 2024 conference (https://www.sleepmeeting.org/wp-content/uploads/2024/05/sleep-2024-late-breaking-abstracts.pdf), available on the SLEEP Meeting website (https://www.sleepmeeting.org/abstract-supplements/). In addition, these posters were presented as encore posters, one at AMCP Nexus 2024 and the other at Psych Congress 2024. The AMCP Nexus 2024 poster’s title and author names were published in a supplement of the Journal of Managed Care + Specialty Pharmacy: https://doi.org/10.18553/jmcp.2024.30.10-c.s1. None of the poster’s abstracts were published in any journal.
References
1. Thorpy MJ, Krahn L, Ruoff C, Foldvary-Schaefer N. Clinical considerations in the treatment of idiopathic hypersomnia. Sleep Med. 2024;119:488–23.
2. Dauvilliers Y, Bogan RK, Arnulf I, Scammell TE, St Louis EK, Thorpy MJ. Clinical considerations for the diagnosis of idiopathic hypersomnia. Sleep Med Rev. 2022;66:101709. doi:10.1016/j.smrv.2022.101709
3. Markt SC, Black J, Bogan RK, et al. Prevalence of diagnosed idiopathic hypersomnia among adults in the United States 2019–2023: analysis of healthcare claims. Sleep Adv. 2026;7(1):zpag011. doi:10.1093/sleepadvances/zpag011
4. Plante DT, Hagen EW, Barnet JH, Mignot E, Peppard PE. Prevalence and course of idiopathic hypersomnia in the Wisconsin Sleep Cohort study. Neurology. 2024;102(2):e207994. doi:10.1212/WNL.0000000000207994
5. Arnulf I, Thomas R, Roy A, Dauvilliers Y. Update on the treatment of idiopathic hypersomnia: progress, challenges, and expert opinion. Sleep Med Rev. 2023;69:101766. doi:10.1016/j.smrv.2023.101766
6. Kim T, Lee JH, Lee CS, Yoon IY. Different fates of excessive daytime sleepiness: survival analysis for remission. Acta Neurol Scand. 2016;134(1):35–41. doi:10.1111/ane.12504
7. Evangelista E, Lopez R, Dauvilliers Y. Update on treatment for idiopathic hypersomnia. Expert Opin Investig Drugs. 2018;27(2):187–192. doi:10.1080/13543784.2018.1417385
8. Stevens J, Schneider LD, Husain A, et al. Impairment in functioning and quality of life in patients with idiopathic hypersomnia: the Real World Idiopathic Hypersomnia Outcomes study (ARISE). Nat Sci Sleep. 2023;15:593–606. doi:10.2147/NSS.S396641
9. Jennum P, Ibsen R, Avlund K, Kjellberg J. Health, social and economic consequences of hypersomnia: a controlled national study from a national registry evaluating the societal effect on patients and their partners. Eur J Health Econ. 2014;15(3):303–311. doi:10.1007/s10198-013-0491-2
10. Pizza F, Jaussent I, Lopez R, et al. Car crashes and central disorders of hypersomnolence: a French study. PLoS One. 2015;10(6):e0129386. doi:10.1371/journal.pone.0129386
11. Vernet C, Arnulf I. Idiopathic hypersomnia with and without long sleep time: a controlled series of 75 patients. Sleep. 2009;32(6):753–759. doi:10.1093/sleep/32.6.753
12. Saad R, Prince P, Taylor B, Ben-Joseph RH. Characteristics of adults newly diagnosed with idiopathic hypersomnia in the United States. Sleep Epidemiol. 2023;3:100059. doi:10.1016/j.sleepe.2023.100059
13. Saad R, Lillaney P, Profant DA, et al. Cardiovascular burden of individuals diagnosed with idiopathic hypersomnia: Real-World Idiopathic Hypersomnia Total Health Model (CV-RHYTHM). Sleep Med. 2025;133:106587. doi:10.1016/j.sleep.2025.106587
14. Saad R, Markt SC, Lillaney P, et al. The clinical and economic burden of idiopathic hypersomnia: results from the Real-World Idiopathic Hypersomnia Total Health Model (RHYTHM) study. Nat Sci Sleep. 2025;17:1743–1755. doi:10.2147/NSS.S498432
15. Szklarzewicz J, Floege U, Gallego D, et al. The humanistic burden of immunoglobulin A nephropathy on patients and care-partners in the United States. Qual Life Res. 2025;34(2):353–363. doi:10.1007/s11136-024-03813-x
16. Jennum PJ, Ibsen M, Mettam S, et al. Clinical and socioeconomic burden among people with narcolepsy or idiopathic hypersomnia: a retrospective cohort analysis of the Danish National Patient Registry. Sleep Med. 2026;139:108690. doi:10.1016/j.sleep.2025.108690
17. Avis KT, Shen J, Weaver P, Schwebel DC. Psychosocial characteristics of children with central disorders of hypersomnolence versus matched healthy children. J Clin Sleep Med. 2015;11(11):1281–1288. doi:10.5664/jcsm.5186
18. Ozaki A, Inoue Y, Nakajima T, et al. Health-related quality of life among drug-naive patients with narcolepsy with cataplexy, narcolepsy without cataplexy, and idiopathic hypersomnia without long sleep time. J Clin Sleep Med. 2008;4(6):572–578. doi:10.5664/jcsm.27352
19. National Health and Wellness Survey (NHWS). 2024. Available at: https://www.oracle.com/life-sciences/.
20. Boulanger T, Pigeon P, Crawford S. Diagnostic challenges and burden of idiopathic hypersomnia: a systematic literature review. Sleep Adv. 2024;5(1):zpae059. doi:10.1093/sleepadvances/zpae059
21. Johns MW. A new method for measuring daytime sleepiness: the Epworth sleepiness scale. Sleep. 1991;14(6):540–545. doi:10.1093/sleep/14.6.540
22. Jones DW, Ferdinand KC, Taler SJ, et al. 2025 AHA/ACC/AANP/AAPA/ABC/ACCP/ACPM/AGS/AMA/ASPC/NMA/PCNA/SGIM guideline for the prevention, detection, evaluation and management of high blood pressure in adults: a report of the American college of cardiology/American heart association joint committee on clinical practice guidelines. Hypertension. 2025;82(10):e212–e316. doi:10.1161/HYP.0000000000000249
23. Charlson ME, Pompei P, Ales KL, MacKenzie CR. A new method of classifying prognostic comorbidity in longitudinal studies: development and validation. J Chronic Dis. 1987;40(5):373–383. doi:10.1016/0021-9681(87)90171-8
24. Quan H, Li B, Couris CM, et al. Updating and validating the Charlson Comorbidity Index and score for risk adjustment in hospital discharge abstracts using data from 6 countries. Am J Epidemiol. 2011;173(6):676–682. doi:10.1093/aje/kwq433
25. Kroenke K, Spitzer RL, Williams JB. The PHQ-9: validity of a brief depression severity measure. J Gen Intern Med. 2001;16(9):606–613. doi:10.1046/j.1525-1497.2001.016009606.x
26. Spitzer RL, Kroenke K, Williams JB, Löwe B. A brief measure for assessing generalized anxiety disorder: the GAD-7. Arch Internal Med. 2006;166(10):1092–1097. doi:10.1001/archinte.166.10.1092
27. Maruish ME. User’s Manual for the SF-36v2 Health Survey.
28. Brazier J, Roberts J, Deverill M. The estimation of a preference-based measure of health from the SF-36. J Health Econ. 2002;21(2):271–292. doi:10.1016/S0167-6296(01)00130-8
29. Hays RD, Sherbourne CD, Mazel RM. The RAND 36-Item Health Survey 1.0. Health Econom. 1993;2(3):217–227. doi:10.1002/hec.4730020305
30. Brazier J, Usherwood T, Harper R, Thomas K. Deriving a preference-based single index from the UK SF-36 Health Survey. J Clin Epidemiol. 1998;51(11):1115–1128. doi:10.1016/S0895-4356(98)00103-6
31. Herdman M, Gudex C, Lloyd A, et al. Development and preliminary testing of the new five-level version of EQ-5D (EQ-5D-5L). Qual Life Res. 2011;20(10):1727–1736. doi:10.1007/s11136-011-9903-x
32. EuroQol Research Foundation. EQ-5D-5L User Guide v4.0. 2025. Available from: https://euroqol-domain.ams3.digitaloceanspaces.com/wp-content/uploads/2025/01/12124516/EQ-5D-5L-Userguide-2025-04.pdf.
33. Pickard AS, Neary MP, Cella D. Estimation of minimally important differences in EQ-5D utility and VAS scores in cancer. Health Qual Life Outcomes. 2007;5:70. doi:10.1186/1477-7525-5-70
34. Kroenke K, Spitzer RL. The PHQ-9: a new depression diagnostic and severity measure. Psychiatr Ann. 2002;32(9):1–7. doi:10.3928/0048-5713-20020901-06
35. Löwe B, Unützer J, Callahan CM, Perkins AJ, Kroenke K. Monitoring depression treatment outcomes with the patient health questionnaire-9. Med Care. 2004;42(12):1194–1201. doi:10.1097/00005650-200412000-00006
36. Toussaint A, Hüsing P, Gumz A, et al. Sensitivity to change and minimal clinically important difference of the 7-item generalized anxiety disorder questionnaire (GAD-7). J Affect Disord. 2020;265:395–401. doi:10.1016/j.jad.2020.01.032
37. Walters SJ, Brazier JE. Comparison of the minimally important difference for two health state utility measures: EQ-5D and SF-6D. Qual Life Res. 2005;14(6):1523–1532. doi:10.1007/s11136-004-7713-0
38. Nolan CM, Longworth L, Lord J, et al. The EQ-5D-5L health status questionnaire in COPD: validity, responsiveness and minimum important difference. Thorax. 2016;71(6):493–500. doi:10.1136/thoraxjnl-2015-207782
39. Chen P, Lin KC, Liing RJ, Wu CY, Chen CL, Chang KC. Validity, responsiveness, and minimal clinically important difference of EQ-5D-5L in stroke patients undergoing rehabilitation. Qual Life Res. 2016;25(6):1585–1596. doi:10.1007/s11136-015-1196-z
40. Del Corral T, Fabero-Garrido R, Plaza-Manzano G, Navarro-Santana MJ, Fernández-de-Las-Peñas C, López-de-Uralde-Villanueva I. Minimal clinically important differences in EQ-5D-5L index and VAS after a respiratory muscle training program in individuals experiencing long-term post-COVID-19 symptoms. Biomedicines. 2023;11(9):2522. doi:10.3390/biomedicines11092522
41. Medical Expenditure Panel Survey (MEPS) Household Component (HC). 2024. Available from: https://datatools.ahrq.gov/meps-hc/?tab=use-expenditures-and-population&dash=12.
42. Consumer Price Index for all urban consumers: medical care in U.S. city average. 2024. Available from: https://fred.stlouisfed.org/series/CPIMEDSL.
43. Reilly MC, Zbrozek AS, Dukes EM. The validity and reproducibility of a work productivity and activity impairment instrument. PharmacoEconomics. 1993;4(5):353–365. doi:10.2165/00019053-199304050-00006
44. Austin PC. An introduction to propensity score methods for reducing the effects of confounding in observational studies. Multivar Behav Res. 2011;46(3):399–424. doi:10.1080/00273171.2011.568786
45. Schneider LD, Stevens J, Husain AM, et al. Symptom severity and treatment satisfaction in patients with idiopathic hypersomnia: the Real World Idiopathic Hypersomnia Outcomes Study (ARISE). Nat Sci Sleep. 2023;15:89–101. doi:10.2147/NSS.S386021
46. Wasling HB, Bornstein A, Wasling P. Quality of life and procrastination in post-H1N1 narcolepsy, sporadic narcolepsy and idiopathic hypersomnia, a Swedish cross-sectional study. Sleep Med. 2020;76:104–112. doi:10.1016/j.sleep.2020.10.014
47. Xywav®. (calcium, magnesium, potassium, and sodium oxybates) oral solution, CIII [prescribing information]. Palo Alto, CA: Jazz Pharmaceuticals, Inc.; 2025.
48. US Food and Drug Administration. Clinical review for Binosto, NDA 202344. 2012. Available from: https://www.accessdata.fda.gov/drugsatfda_docs/nda/2012/202344Orig1s000MedR.pdf.
49. US Food and Drug Administration. Quantitative labeling of sodium, potassium, and phosphorus for human over-the-counter and prescription drug products. Guidance for industry. 2022. Available from: https://www.fda.gov/regulatory-information/search-fda-guidance-documents/quantitative-labeling-sodium-potassium-and-phosphorus-human-over-counter-and-prescription-drug.
50. Szarfman A, Kuchenberg T, Soreth J, Lajmanovich S. Declaring the sodium content of drug products. N Engl J Med. 1995;333(19):1291. doi:10.1056/NEJM199511093331917
51. Trotti LM, Arnulf I. Idiopathic hypersomnia and other hypersomnia syndromes. Neurotherapeutics. 2021;18(1):20–31. doi:10.1007/s13311-020-00919-1
52. Ding W, Zhang Y, Wang MZ, Wang S. Post-pandemic mental health: understanding the global psychological burden and charting future research priorities. World J Psych. 2025;15(10):109502. doi:10.5498/wjp.v15.i10.109502
53. Wang S, Zhang Y, Ding W, et al. Mental health symptoms and associated factors for general population at the stable, recurrence, and end-of-emergency stages of the COVID-19 pandemic: a repeated national cross-sectional study. Epidemiol Psych Sci. 2025; 34:e50.
 © 2026 The Author(s). This work is published and licensed by Dove Medical Press Limited. The
full terms of this license are available at https://www.dovepress.com/terms
and incorporate the Creative Commons Attribution
- Non Commercial (unported, 4.0) License.
By accessing the work you hereby accept the Terms. Non-commercial uses of the work are permitted
without any further permission from Dove Medical Press Limited, provided the work is properly
attributed. For permission for commercial use of this work, please see paragraphs 4.2 and 5 of our Terms.
© 2026 The Author(s). This work is published and licensed by Dove Medical Press Limited. The
full terms of this license are available at https://www.dovepress.com/terms
and incorporate the Creative Commons Attribution
- Non Commercial (unported, 4.0) License.
By accessing the work you hereby accept the Terms. Non-commercial uses of the work are permitted
without any further permission from Dove Medical Press Limited, provided the work is properly
attributed. For permission for commercial use of this work, please see paragraphs 4.2 and 5 of our Terms.
Recommended articles


A Patient Reported Outcome Ontology: Conceptual Issues and Challenges Addressed by the Patient-Reported Outcomes Measurement Information System® (PROMIS®)
Cella D, Hays RD
Patient Related Outcome Measures 2022, 13:189-197
Published Date: 15 August 2022
The Humanistic and Economic Burden of COPD Patients in Urban China: A Propensity Score Matching Study
Dou L, Zheng Y, Feng J, Huang Z, Qin F, Gao M, Li S
International Journal of Chronic Obstructive Pulmonary Disease 2025, 20:2993-3004
Published Date: 27 August 2025
Impact of Comorbidity Clusters on Quality of Life in Chronic Heart Failure
Zhang L, Wang Y, Yuan N, Zhang Y, Yan J, Zhang L, Xiong W, Ma S, Zhang Y, Tian J
Vascular Health and Risk Management 2026, 22:577759
Published Date: 18 February 2026