Back to Journals » OncoTargets and Therapy » Volume 14
TFF-1 Functions to Suppress Multiple Phenotypes Associated with Lung Cancer Progression
Authors Minegishi K, Dobashi Y ![]() , Tsubochi H, Hagiwara K, Ishibashi Y, Nomura S
, Tsubochi H, Hagiwara K, Ishibashi Y, Nomura S ![]() , Nakamura R
, Nakamura R ![]() , Ohmoto Y, Endo S
, Ohmoto Y, Endo S
Received 10 June 2021
Accepted for publication 24 August 2021
Published 10 September 2021 Volume 2021:14 Pages 4761—4777
DOI https://doi.org/10.2147/OTT.S322697
Checked for plagiarism Yes
Review by Single anonymous peer review
Peer reviewer comments 2
Editor who approved publication: Dr Federico Perche
Kentaro Minegishi,1 Yoh Dobashi,2,3 Hiroyoshi Tsubochi,1 Koichi Hagiwara,4 Yuko Ishibashi,5,6 Sachiyo Nomura,7 Ritsuko Nakamura,8 Yasukazu Ohmoto,9 Shunsuke Endo1
1Department of Thoracic Surgery, Saitama Medical Center, Jichi Medical University, Saitama, Japan; 2Department of Medicine, Saitama Medical Center, Jichi Medical University, Saitama, Japan; 3Department of Pathology, School of Medicine, International University of Health and Welfare, Tochigi, Japan; 4Division of Pulmonary Medicine, Department of Medicine, Jichi Medical University, Tochigi, Japan; 5Department of Breast and Endocrine Surgery, Graduate School of Medicine, The University of Tokyo, Tokyo, Japan; 6Division of Breast Surgery, Hospital of the National Center for the Global Health and Medicine, Tokyo, Japan; 7Department of Gastrointestinal Surgery, Graduate School of Medicine, The University of Tokyo, Tokyo, Japan; 8Department of Molecular and Cellular Pathology, Graduate School of Medical Sciences, Kanazawa University, Kanazawa, Japan; 9Tokushima University Industry-University R&D Startup Leading Institute, Tokushima, Japan
Correspondence: Yoh Dobashi
Department of Pathology, School of Medicine, International University of Health and Welfare, 537-3 Iguchi, Nasushiobara, Tochigi, 329-2763, Japan
Tel +81-287-37-2221
Fax +81-287-39-3001
Email [email protected]
Introduction: Trefoil Factor (TFF) is a member of a protein family comprised of three isoforms, of which TFF-1 exhibits antithetical functions; promotion or suppression of cell proliferation, survival and invasion, depending on the cancer type. However, the pathobiological function of TFF-1 in lung carcinoma has been still unclear.
Methods: We examined the expression and secretion of TFF-1 using cultured human lung carcinoma cells by immunoblotting, immunofluorescence, enzyme-linked immunosorbent assay and quantitative real-time PCR analyses. The effects of TFF-1 on various phenotypes were analyzed in two cell lines, including those transfected with cDNA encoding TFF-1. Cell proliferation and death were examined by hemocytometer cell counting and by colorimetric viability/cytotoxicity assay. Cell cycle profile, migration and invasion were also examined by flow cytometry, wound healing assay and Matrigel Transwell assay, respectively. The effect of TFF-1 overexpression was confirmed by additional transfection of TFF-1-specific siRNA.
Results: Endogenous TFF-1 protein expression and secretion into the media were observed exclusively in adenocarcinoma-derived cell lines. Forced overexpression of TFF-1 drove cell cycle transition, while the proliferation decreased by 19% to 25% due to increased cell death. This cell death was predominantly caused by apoptosis, as assessed by the activation of caspase 3/7. Cell migration was also suppressed by 71% to 82% in TFF-1-transfected cells. The suppressive effect of TFF-1 on proliferation and migration was restored by transfection of TFF-1 siRNA. Moreover, invasion was also suppressed to 77% to 83% in TFF-1-transfected cells.
Conclusion: These findings reveal that TFF-1 functions as a suppressor of cancer proliferation by induction of apoptosis, cell migration and invasion and thus may provide a synergistic target for potential treatment strategies for human lung carcinoma.
Keywords: TFF-1, lung carcinoma cells, growth inhibition, apoptosis, migration, invasion
Introduction
Lung cancer is the leading cause of cancer death worldwide and the 5-year survival rate of all lung cancer patients is approximately 63%1 due to distant metastasis and recurrence. The TFF family is a group of proteins composed of three isoforms based on sequence similarity; gastric peptides pS2/TFF-1, spasmolytic peptide (SP)/TFF-2 and intestinal trefoil factor (ITF)/TFF-3.2,3 All TFFs are small (7~14 kDa) protease-resistant proteins and are secreted onto the mucosal surface in the gastrointestinal tract, but also expressed in a variety of tissues in distinct, albeit redundant patterns.4 Of these three subfamilies, TFF-1 was originally identified as an estrogen-inducible gene in a breast cancer cell line MCF-75,6 and is predominantly expressed in the stomach and the colon in normal tissues.4,7,8 Introduction of TFF-1 in normal colon and kidney epithelial cells promoted cell dispersion and enhanced infiltration capacity.2,9–11 The pathological effects of TFF-1 are diverse: in vitro overexpression of TFF-1 in the colonic, pancreatic and ovarian cancer cells promoted cell proliferation,12 survival,11 migration and cell invasion.2,11–14 Aberrant expression of TFF-1 in clinical specimens of cancers was also observed in those of the colon,7,8,14 the pancreas,8,13 the breast,15,16 the prostate,17 the thyroid,7 the lung7,8 and the ovary.8,12 Moreover, TFF-1 expression was correlated with chemoresistance,12 metastasis13,14 and with a poor prognosis in those cancers.12,14 These observations suggest that TFF-1 has a tumor promoting function.
Meanwhile, antithetical effects have also been observed. TFF-1 suppressed proliferation of gastric cancer cells,18–20 and in vivo, TFF-1 deficient mice were observed to develop gastric carcinomas, suggesting that TFF-1 may have a tumor suppressor function.20,21 Indeed, TFF-1 expression was lost in 40–60% of human gastric carcinomas8,22 and functionally inactivated by promoter methylation23 or somatic mutation.24 Thus, TFF-1 may act both as a tumor promoter or a tumor suppressor, depending on the cell types. Accordingly, the correlation between TFF-1 expression and cancer prognosis has been controversial and thus, the role of TFF-1 may be individually determined for each cell type. Therefore, understanding the exact role of TFF-1 in lung cancer would be valuable. Although TFF-1 overexpression has been described in lung cancer7,25,26 and TFF-1 may have a tumor promoting function in lung cancer, modulation of this expression has been somewhat unclear. These previous reports briefly described TFF-1 expression in lung cancer and other organs,7 expression in invasive mucinous adenocarcinoma (AC)25 and suppression of TFF-1 in patients with AC, showing an association with early relapse that did not reach statistical significance.26 In other older clinical studies of lung cancer, it was found that serum levels of TFF-1 protein in patients with AC was higher than those in patients with other diseases or in controls, but this observation had little clinical value as a screening tumor marker.27 Similarly, cytosolic TFF-1 concentrations measured in clinical samples were found to be higher in tumor than in normal tissue, with higher levels in AC than squamous cell carcinoma (SCC).28 Collectively, the clinical significance of TFF-1 expression in lung carcinoma or even basic function of TFF-1 has been hard to assess. In the present study, in cultured human lung carcinomas of all histological types, we investigated the role of TFF-1 by examining expression profiles, effects on cell proliferation, migration and invasion using transfection of cDNA or siRNA, and speculated the potential of TFF-1 as a therapeutic target.
Methods
This study was approved by the Institutional Ethics Committee of Saitama Medical Center, Jichi Medical University (No. S17-035) and University of Tokyo (No. 11414-[1]).
Cell Culture
Twelve human lung carcinoma cell lines were used. H1650, H1975 (both AC), SQ5 (SCC), and H1299 (large cell carcinoma, LCC) were obtained from the American Type Culture Collection (Manassas, VA, USA); A549, PC-3 (both AC), SBC-3 and SBC-5 (both small cell carcinoma, SmCC) were from the Japanese Cancer Research Resources Bank (Osaka, Japan); and LC-AI (adenosquamous carcinoma), LK2, EBC-1 (both SCC), and Lu-99 (LCC) were from the RIKEN cell bank (Ibaraki, Japan). Cells were cultured in Dulbecco’s modified Eagle’s medium supplemented with 10% fetal bovine serum (FBS) and streptomycin (100μg/mL)/penicillin G (100 units/mL).
Concentrated media was prepared as follows: confluent cells in 6cm dishes were washed with phosphate-buffered saline (PBS) 3 times and incubated with 2 mL of serum-free medium for 22 hrs. The medium was lyophilized with a centrifugal dryer for 8hs, resuspended in 50μL of PBS and subjected to ELISA.
Construction of Plasmid and Cell Transfection
A FLAG-tagged, full-length TFF-1 gene (252 base pairs with a 24-base FLAG tag shown in parentheses) with a nucleotide sequence of 5ʹ-ATGGCCACCATGGAGAACAAGGTGATCTGCGCCCTGGTCCTGGTGTCCATGCTGGCCCTCGGCACCCTGGCCGAGGCCCAGACAGAGACGTGTACAGTGGCCCCCCGTGAAAGACAGAATTGTGGTTTTCCTGGTGTCACGCCCTCCCAGTGTGCAAATAAGGGCTGCTGTTTCGACGACACCGTTCGTGGGGTCCCCTGGTGCTTCTATCCTAATACCATCGACGTCCCTCCAGAAGAGGAGTGTGAATTT(GACTACAAAGACGATGACGACAAG)TAG −3ʹ was inserted into the Xba I- Hind III multicloning site in the mammalian pBApo-CMV Neo vector (pBA-neo, No.3240, TaKaRa, Shiga, Japan) to generate the plasmid pBA-TFF1. SBC-5 and LC-AI cells were transfected with 10 nM pBA-TFF1 or pBA-neo using Lipofectamine 2000 (No.11668019, ThermoFisher Scientific [ThermoFisher], Waltham, MA) and selected with 500μg/mL of G418 disulfate. Transfection efficiency was monitored by co-transfection of a green fluorescent protein gene. Stable clones were isolated after 7 days of selection and expression was evaluated by immunoblotting as well as immunofluorescent staining (IF). Cells were named as the pBA-TFF1-transfected group (“TFF-1-transfected”), the pBA-neo-transfected group (“control-transfected”) and parental blank control group (“parental”).
Immunoblotting and Immunofluorescence Analyses
Subconfluent cells were solubilized and protein was extracted with RIPA buffer (50 mM Tris-HCL pH.7.6, 150 mM NaCl, 1% Nonidet P40, 0.5% Deoxycholate, 0.1% SDS) with 1/100 volume of protease inhibitor cocktail (No.165-26021, Fujifilm-WAKO, Osaka, Japan). Protein (75μg) was separated in a NuPAGE™ 4 to 12% Mini Protein Gel (No. NP0336BOX, ThermoFisher) and transferred onto Poly Vinylidene DiFluoride membrane. The membrane was probed with rabbit anti-human TFF-1 polyclonal antibody (No. PA5-31863, ThermoFisher) at a dilution of 1:250 at 4°C overnight. β-actin was used as internal loading control and blotted with mouse anti-β-actin monoclonal antibody (281-98721, Fujifilm-WAKO) at a 1:1000 dilution. Next, the membrane was incubated with alkaline-phosphatase-conjugated goat anti-rabbit (S3731, Promega, Madison, WI) or anti-mouse (S3721, Promega) secondary antibodies at a 1:1500 dilution for 1.5 hrs at room temperature (RT) followed by visualization with nitro blue tetrazolium /5-bromo-4-chloro-3-indolyl-phosphate (NBT/BCIP, S380C, Promega).
For IF, cells were fixed in ice-cold methanol at 4°C for 1h and serially incubated in the following solutions: (1) 5% normal rabbit serum, 30 min; (2) primary antibody against TFF-1 (1:200) for 2hs at 4°C; (3) FITC-conjugated goat anti-rabbit (ab150077, Abcam, Cambridge, UK) IgG (1:1000) for 1h at RT. Samples were stained with 4′,6-diamidino-2-phenylindole (DAPI, ab228549, Abcam) and the fluorescence images were digitally captured on an All-in-One fluorescence microscope equipped with a color CCD camera (BZ-X710, KEYENCE Ltd., Osaka, Japan).
Quantitative Real-Time PCR (qRT-PCR) Assay
Total RNA (1μg) was extracted from cells and was used for reverse transcription with random primers to synthesize the first strand cDNA using the TaqMan Gene Expression Cells-to CTTM Kit (AM1728, Invitrogen, ThermoFisher). Conventional PCR amplification with 1 μg of cDNA was performed using the TaqMan Gene Expression Master Mix (4369016. ThermoFisher) and TaqMan Gene Expression Assays (1765589, ThermoFisher) containing probes and PCR primers for TFF-1 (No.4331182, Assay ID Hs00907239_m1, ThermoFisher) or for β-actin (No.4331182, Assay ID Hs01060665_g1) as an internal control. PCR reaction was carried out using a Quant Studio12 Flex Real-time PCR system (Applied Biosystems, ThermoFisher). The volume of the reaction mix was 25μL and reaction conditions were as follows: initial denaturation at 95°C for 10 min; 40 cycles of annealing and extension at 60°C for 1 min and denaturation at 95°C for 15 sec. The expression levels were quantified with Quant Studio Software Version 1.2.2. Experiment was replicated three times and three replicate samples were used per sample.
Enzyme-Linked Immunosorbent Assay (ELISA)
We measured TFF-1 from cell lysates and concentrated medium by an ELISA assay previously developed and described.29 Briefly, a 96-well microtiter plate was precoated with rabbit polyclonal antibody against TFF-1, 50μL of sample or previously prepared standard human recombinant TFF-1 solution was used for reaction. The final colorimetric product was quantified by absorbance at 450nm using microplate reader, VARIOKSKAN LUX, and analyzed by SkanIt Software 5.0 (ThermoFisher). Concentrations of human TFF-1 in the samples were calculated from a recombinant human TFF-1 standard curve. Experiment was replicated three times and three replicate wells were used per sample.
Cell Proliferation Assay
In parental, control-transfected and TFF1-transfected SBC-5 and LC-AI cells, proliferation was analyzed by hemocytometer cell number counts. Briefly, 1.0×10⁴ cells were seeded into 6cm plate and cultured with 10% FBS. After 0, 3, 5, 7 days, attached cells were detached, pooled with floating cells, stained with 0.5% trypan-blue, and both living and dead cells were counted. Simultaneously, living and dead fractions were also quantified colorimetrically using the Viability/Cytotoxicity Multiplex Assay Kit (CK17, Dojindo Lab. Kumamoto, Japan) with absorbance at 450 nm.
Analysis of Cell Death Type
To clarify the type of cell death, we assayed the activity of caspase 3/7 (cas3/7) with a fluorogenic substrate for activated caspase-3/7 using the CellEvent™ Caspase-3/7 Green Detection Reagent (C10423, ThermoFisher), with simultaneous DAPI staining. The number of positively stained cells were interpreted as cas3/7-active, ie, apoptotic. Those positive cells among 500 DAPI-positive cells observed in 5 fields were counted and the ratio was calculated.
Gene Knockdown Assay
For transient expression of small interfering RNA (siRNA), cells were transfected with an siRNA targeting TFF-1 (Silencer Select No.4392421, ID.s14033) and a non-targeting siRNA (Silencer Select, No.4390844, ThermoFisher) following the manufacturer’s protocol. For this experiment, 5×10³ cells were seeded in standard 24-well plates 24hrs before transfection. siRNA was used at a concentration of 30nM in serum-free medium containing Lipofectamine 2000 reagent. Following incubation at 37°C for 72 hrs, knockdown of TFF-1 was confirmed by ELISA, and cells were used for further experiments. For the proliferation assay, transfection of siRNA was performed in the presence of 2% FBS.
Cell Cycle Analysis
Cell cycle profiles were assessed by flow cytometry. Cells were stained using the Cycletest Plus reagent kit (#340242, Becton, Dickinson [BD] Biosciences, San Jose, CA). Cell cycle progression was analyzed by measuring the amount of propidium iodide-labeled DNA using a FACSVerse (BD Biosciences). The fraction of each phase was assessed using BD FACSuite software.
Migration Assay
1x10⁴ cells were seeded in 12-well plates. A 0.6 mm wide scratch was made in the cell monolayer using a sterile P200 pipette tip. The cells were gently washed with PBS, and incubated in serum-free medium containing 3μg/mL Mitomycin C (No.133-15931, WAKO-Fujifilm). Serial photographs of the same area were taken at 0 and 18hrs and digitally captured on a CCD camera (BZ-X710, KEYENCE Ltd.). The processed image was loaded into Image-J v. 1.31 (freeware downloaded from http://rsbweb.nih.gov/ij/). The area covered by migrated cells at 18h was measured and the relative ratio to the whole wound area was calculated as migration rate.
Alternatively, cells were transfected with TFF-1-specific siRNA or non-targeting siRNA 48hrs prior to making the scratch. The covered area was measured in each group by the same procedure.
Invasion Assays
Transwell assays were used to evaluate cell invasiveness. BioCoat Matrigel Invasion Chambers (No. 354481, Corning, Bedford, MA) consist of 6-well Transwell units with 8 µm pore-size filters precoated with or without Matrigel. The cell suspension containing 5×10⁴ cells/mL in serum-free medium were added to the upper chamber and the medium containing 10% FBS were added in the lower chamber. Following 22-hr incubation at 37°C, the cells that had traversed to the lower surface of the membrane were fixed with 4% paraformaldehyde and stained with Giemsa/Methylene blue at RT for 5 min. Cell numbers were counted in 5 randomly chosen fields under a light microscope. The ratios of the cell number on the membrane with the Matrigel to that without Matrigel were calculated and expressed as the invasion rate.
Statistical Analysis
The JMP software package (version 11, SAS Institute Inc., Cary, NC) and Statmate IV (Advanced Technology for Medicine and Science Co., Ltd., Tokyo, Japan) were used for statistical analyses. Mann–Whitney U-test was used to compare data between two groups or one-way analysis of variance (ANOVA) to compare among multiple groups. If there were significant differences, a further least significant difference method (Fisher’s PLSD test) was used for pairwise comparison. All tests were two-sided, and a value of p<0.05 was considered as statistically significant.
Results
Expression of Endogenous TFF-1 and Secretion into the Medium
Initially, 12 cell lines were subjected to immunoblotting analysis. As shown in Figure 1A and Supplementary Figure 1, a single band of 13kDa was observed only in PC-3 cells, derived from AC. However, the signal was barely detectable in any other cell line. To confirm this result, an ELISA assay and qRT-PCR analysis were also performed. By ELISA, a measurable level of TFF-1 was detected in cell lysates of AC, ie, 4.59ng/mL in PC3, 0.76 in A549, 0.28 in H1975 and 0.15ng/mL in H1650, but was undetectable in cells derived from SCC (SQ5, LC-AI, LK2, EBC-1), LCC (H1299, Lu99) or SmCC (SBC3, SBC5) (Figure 1B). In accordance with these results, concentrated media from AC cell cultures had measurable values of TFF-1 (A549, 1.27ng/mL; PC3, 0.299ng/mL; and H1975, 0.046ng/mL), whereas other cells, including one AC cell line (H1650) and those derived from SCC (LC-AI, LK2), LCC (H1299) and SmCC (SBC-3, SBC-5) had no detectable TFF-1. By qRT-PCR, detectable levels of TFF-1 expression were observed in the lysates of AC cell lines PC-3, A549, H1975 and H1650. We quantified expression levels relative to those obtained with H1975 as follows: 13.30 for PC3, 9.35 for A549, 1.00 for H1975, 0.163 for H1650, while levels for LC-AI, LK2, EBC-1, LK2, SQ5, H1299, Lu99, SBC3 and SBC5 were undetectable (Figure 1C). Therefore, endogenous TFF-1 is expressed intracellularly and secreted extracellularly in cells derived from adenocarcinomas.
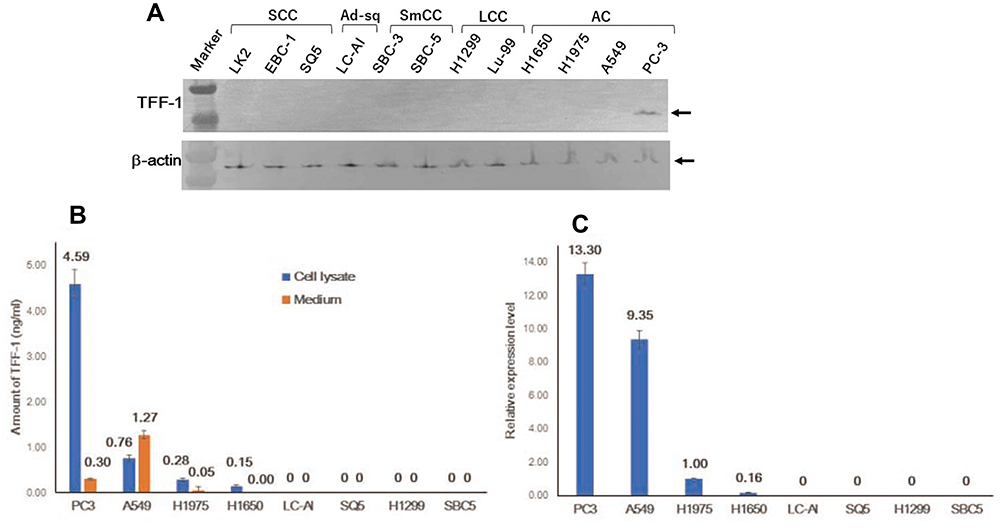 |
Figure 1 Expression of endogenous TFF-1 protein in cultured cells from human lung carcinoma. (A) Expression of the TFF-1 protein was detected at around 13kDa by immunoblotting analysis only in PC-3 cells. (B) Schematic presentation of TFF-1 expression and the amount secreted into the medium analyzed by ELISA. (C) Result of qRT-PCR analysis of TFF-1 mRNA expression, expressed relative to values obtained for H1975. (B and C) Square and bar indicate mean value and standard deviation, respectively, obtained from three replicated experiments with three replicate samples. Abbreviations: AC, adenocarcinoma; SCC, squamous cell carcinoma; LCC, large cell carcinoma; SmCC, small cell carcinoma; Marker, molecular weight marker. |
Establishment of Cell Lines Overexpressing TFF-1
SBC-5 and LC-AI cells, which were confirmed not to express endogenous TFF-1, were transfected with pBA-TFF1 or pBA-neo. Ten colonies from each were picked up, further expanded and subjected to immunoblotting analysis, IF and ELISA. None of these analyses revealed expression in the parental or control-transfected cells, but detectable levels of expression were observed in 4 clones each from the TFF1-transfected SBC-5 (clones 1, 2, 9, 10) and LC-AI (clones 2, 3, 5, 6) cells, respectively, by immunoblotting with anti-TFF-1 antibody (Figure 2A and Supplementary Figure 2). By IF staining, those 4 clones showed a visible fluorescence signal (Figure 2B and C). When the TFF-1 was measured by ELISA, the TFF1-transfected clones of SBC-5 and LC-AI expressed 1.62 to 2.12ng/mL and 3.24 to 4.25ng/mL, respectively, whereas no measurable expression was detected in control-transfected clones. By qRT-PCR analysis, levels of TFF-1 mRNA expression relative to that obtained with H1975 were 9.81 to 11.42 in SBC-5-derived clones, and 12.90 to 15.8 in LC-AI-derived clones, whereas levels for control-transfected clones were undetectable (Figure 2D). The expression levels of mRNA in TFF1-transfected clones were higher compared with parental or control-transfected cells at statistically significant level, while the differences among clones were not in both SBC-5 and LC-AI cells (Figure 2D). Therefore, TFF1-FLAG could be successfully overexpressed in these cells by transfection. Consistently, we could detect TFF-1 in concentrated media from cells of the TFF-1-transfected cells by ELISA: 0.42 to 0.47ng/mL for SBC-5 and 1.25 to 1.28ng/mL for LC-AI. No measurable secretion was found in the control-transfected cells. Three clones with the highest TFF1-FLAG expression by both analyses were used for further analysis.
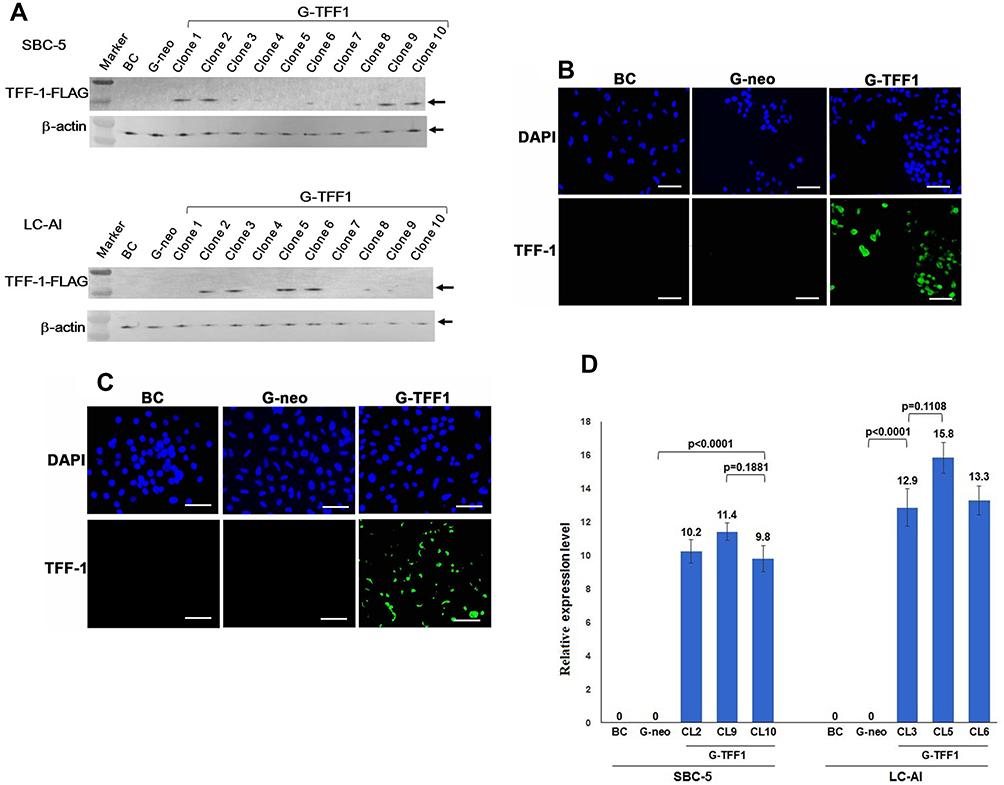 |
Figure 2 Establishment of TFF-1-overexpressing cell lines. SBC-5 and LC-AI cells were transfected with a vector containing the cDNA encoding TFF-1/FLAG (pBA-TFF1) or empty vector (pBA-neo). (A) Expression of this fusion protein was evaluated by immunoblotting analysis with anti-TFF-1 antibody. Expression was not observed in parental SBC-5 or LC-AI cells (BC), but a single band of around 15kDa was detected after transfection of pBA-TFF1 (G-TFF1) in 4 clones, but not observed in cells transfected with pBA-neo (G-neo). Expression was normalized to the β-actin loading control. “Marker” indicates molecular weight marker. (B and C) Images of immunofluorescent staining in parental cells (BC), pBA-neo (G-neo) or pBA-TFF1-transfected cells (G-TFF1) of SBC-5 (B), LC-AI (C) cells are shown. Cells were stained with anti-TFF-1 antibody and with 4′,6-diamidino-2-phenylindole (DAPI). Scale bar indicates 100μm. (D) Schematic presentation of TFF-1 mRNA expression after transfection with pBA-neo or pBA-TFF1 (3 clones; CL) expressed relative to values obtained for H1975. Square and bar indicate mean values and standard deviations, respectively, obtained by qRT-PCR analysis from three replicated experiments with three replicate samples. Results were statistically analyzed and p-values were obtained by Fisher’s PLSD test. |
Overexpression of TFF-1 Decreases Proliferation-Rate and Enhances Cell Death
To determine whether TFF-1 affects cancer cell proliferation, we quantified cell proliferation and death of cells in the parental, control-transfected and TFF-1-transfected cells by hemocytometer counts of living and dead cells. Transfection of TFF-1 into two cell lines resulted in a lower rate of living cell proliferation compared with parental and control-transfected cells. For SBC-5 cells, the number of living, TFF-1-transfected cells after 7 days of culture was 73.2% that of the parental cells (difference between two groups, p=0.0419, by Mann–Whitney U-test), and 75.0% that of the control-transfected cells (p=0.0559). For LC-AI cells, the number of living, TFF-1-transfected cells was 78.6% that of the parental (p=0.0369) and 81.5% that of control-transfected cells (p=0.0456). No significant difference was noted between parental and control-transfected cells (p=0.7084 for SBC-5, p=0.8508 for LC-AI; Figure 3A, Table 1). On the other hand, the dead cell fraction was higher as 230% in the TFF-1-transfected SBC-5 cells compared to parental (p=0.0453, by Mann–Whitney U-test) and 219% of control-transfected cells (p=0.0495). The dead cell fraction in TFF-1-transfected LC-AI cells was 267% that of parental (p=0.0470) and 200% that of control-transfected cells (p=0.0480). No significant difference was noted between parental and control-transfected groups (p=0.9537 for SBC-5, p=0.6143 for LC-AI) (Figure 3B, Table 1). However, we observed that the combined number of living and dead cells was higher for the TFF-1-transfected cells than parental and control-transfected cells (Figure 3C).
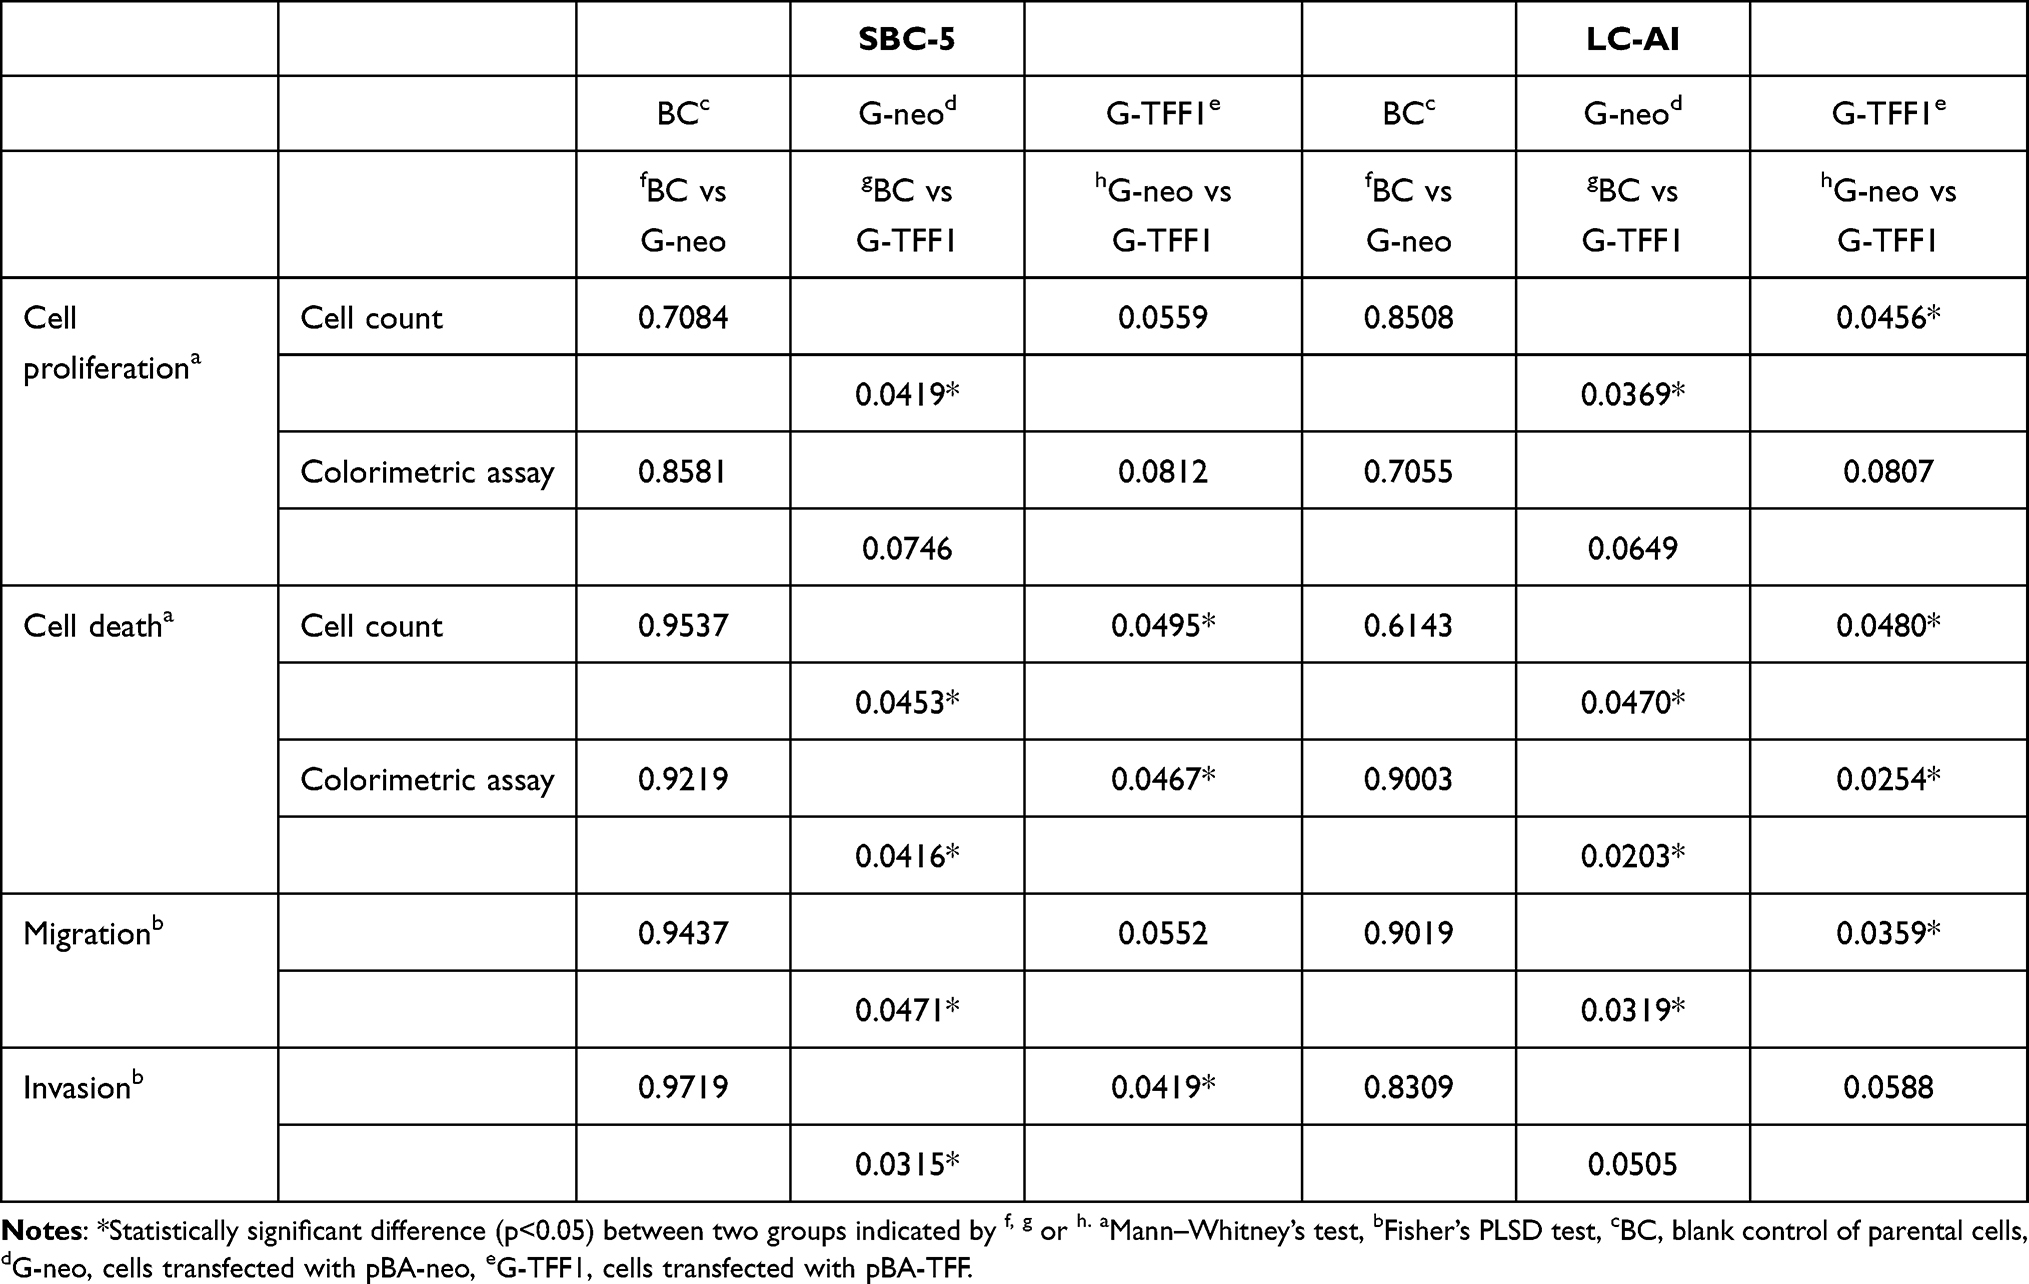 |
Table 1 Statistical Differences Among Parental Cell and Established Clones Represented by p-values |
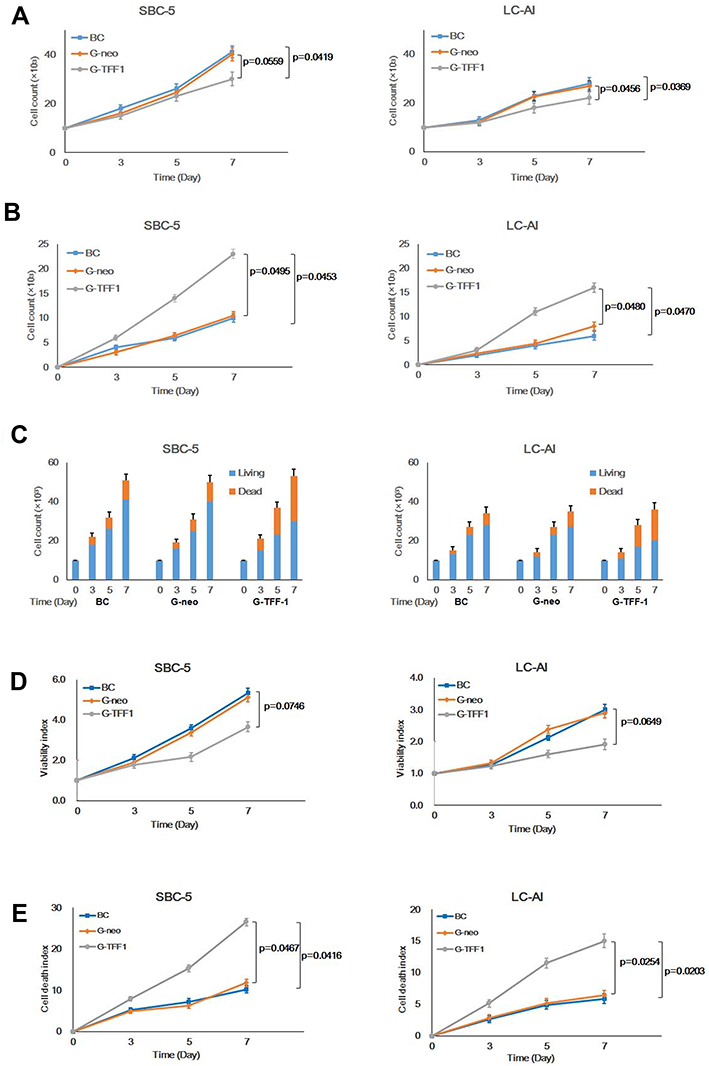 |
Figure 3 Constitutive overexpression of TFF-1 suppresses cell proliferation and enhances cell death. (A) Growth curves of parental, pBA-neo, or pBA-TFF1-transfected SBC-5 and LC-AI cells during 7 days observation. (B) Increase in dead SBC-5 and LC-AI cells in these transfection groups. (C) Schematic presentation of living (blue) and dead (red) cell fractions of cultured cells counted by hemocytometer. (D) Results of viability assay in the 3 transfection groups measured by colorimetric Viability/Cytotoxicity Multiplex Assay Kit. (E) Results of dead cell assay measured by the same kit. (A–E) Mean value ± standard deviation (bar), obtained from three replicated experiments, were indicated. Results were statistically analyzed by one-way ANOVA and p-values were obtained by Mann–Whitney U-test. Abbreviations: BC, blank control of parental cells; G-neo, cells transfected with pBA-neo; G-TFF1, cells transfected with pBA-TFF1. |
To confirm these results, Viability/Cytotoxicity assay was performed. Results showed that viability index of the TFF-1-transfected cells increased during the time course, but was lower than parental or control-transfected cell viabilities: 68.8% of the parental (p=0.0746, by Mann–Whitney U-test) and 71.4% of the control-transfected cells (p=0.0812) for SBC-5 and 63.6% of the parental (p=0.0649) and 65.2% of the control-transfected cells (p=0.0807) for LC-AI. Therefore, we found a trend of cell viability suppression in TFF-1-overexpressing cells, but this was not statistically significant (Figure 3D, Table 1). However, the cytotoxicity assay revealed a statistically significant difference between parental and TFF-1-transfected or between control-transfected and TFF-1-transfected cells, similar to results obtained by cell counting. The fraction of dead cells in TFF-1-transfected SBC-5 cells was 258% of the parental (p=0.0416, by Mann–Whitney U-test) and 225% of the control-transfected cells (p=0.0467), and this fraction for TFF-1-transfected LC-AI cells was 255% of the parental (p=0.0203) and 235% of the control-transfected cells (p=0.0254) (Figure 3E, Table 1).
Identification of the Cell Death Type
To clarify the type of cell death observed in the cell proliferation assays, we assayed the activity of cas3/7 with simultaneous staining for DAPI. The number of active cas3/7-positive cells increased during the time course and the ratios of cas3/7-positive cells to total DAPI-positive cells were as follows. For SBC-5 cells, the ratios were 16.7% for parental, 18.0% for control-transfected, and 27.5% for TFF-1-transfected cells at day 7. For LC-AI, these ratios were 13.5, 17.4 and 25.0%, respectively (Figure 4). The fractions of cells with activated cas3/7, namely, apoptotic fractions found in this experiment were 60 to 85% of the dead cell fractions observed by cell counting, indicating that the predominant cause of cell death was apoptosis.
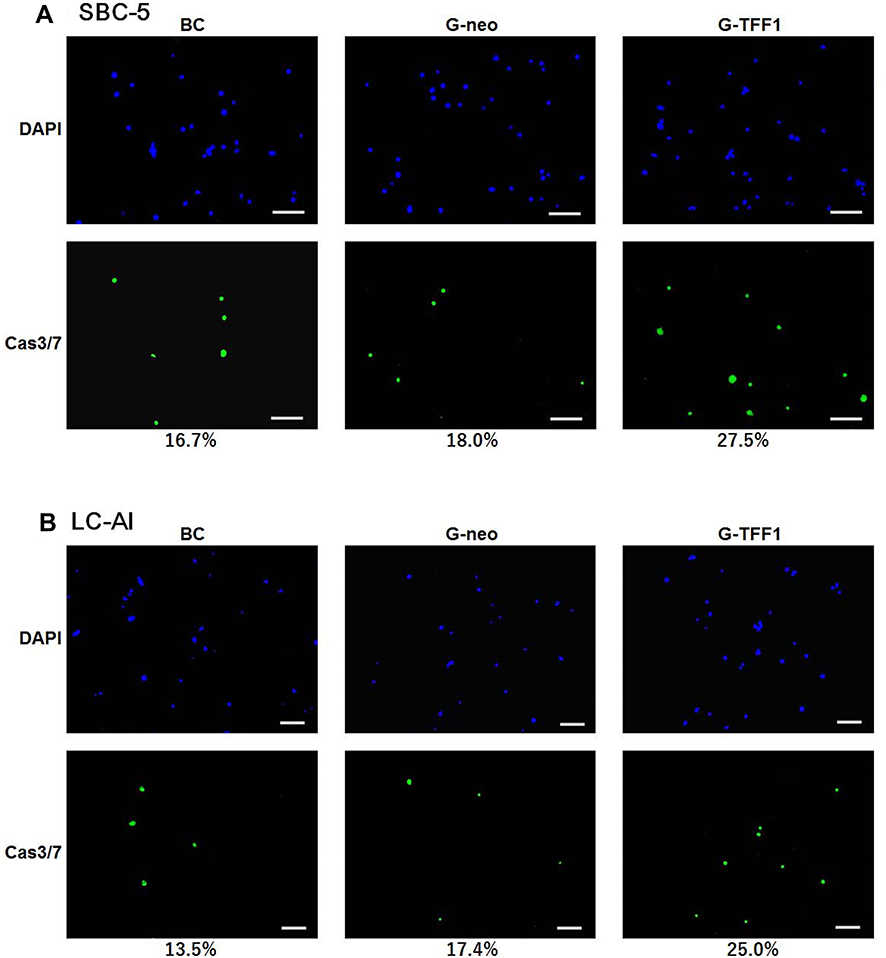 |
Figure 4 The type of cell death analyzed by immunofluorescent staining for active caspase 3/7 (A and B). Representative fields of parental, pBA-neo-transfected and pBA-TFF1-transfected cells stained for active caspase 3/7 (green) and DAPI (blue) after 7 days of culture. The value indicates the ratio of caspase-active to DAPI-stained cells obtained from three replicated experiments. Overexpression of TFF-1 resulted in a marked increase in the fraction of caspase-active cells, while not induced by transfection of pBA-neo. Scale bar indicates 100μm. Abbreviations: BC, blank control of parental cells; G-neo, cells transfected with empty pBA-neo vector; G-TFF1, cells transfected with pBA- TFF-1; DAPI, 4′,6-diamidino-2-phenylindole. |
Effect of TFF-1-Specific siRNA on Cell Proliferation and Cell Death
Next, to evaluate if overexpression of TFF-1 was sufficient to account for the above results, we transiently inhibited TFF-1 by siRNA. As shown in Figure 5A, in TFF-1-transfected SBC-5 cells, the amount of TFF-1 protein in cell lysate decreased from 2.11 to 0.95 ng/mL following transfection of TFF-1-specific siRNA under serum-free condition, and 2.20 to 1.50 ng/mL in the presence of 2% FBS. In contrast, following transfection of a non-targeting control siRNA, the amount of TFF-1 remained at 2.00 and 2.11 ng/mL, respectively. The difference in TFF-1 expression between non-treated or non-targeting siRNA-transfected and TFF-1-specific siRNA-transfected cells under serum free condition was statistically significant in SBC-5 cells (p=0.0002 and 0.0003, respectively, by Fisher’s PLSD test). Results were similar in the presence of 2% FBS (p=0.0071 and 0.0104, respectively). However, differences were not significant between non-treated and non-targeting siRNA-transfected cells in either condition (p=0.2619 and 0.3111, Figure 5A). Similarly, in TFF-1-transfected LC-AI, TFF-1 levels decreased from 4.11 to 1.58 ng/mL under serum-free condition, and 4.25 to 2.64 ng/mL in the presence of 2% FBS. Transfection of a non-targeting control siRNA had little effect on the amount of TFF-1, which remained at 3.90 and 4.09 ng/mL, respectively. The difference in TFF-1 expression between non-treated or non-targeting siRNA-transfected and TFF-1-specific siRNA-transfected cells was also statistically significant under serum free condition (p=0.0003 and 0.0005) or in the presence of 2% FBS (p=0.0014 and 0.0018, respectively). However, differences were not significant between non-treated and non-targeting siRNA-transfected cells in either condition (p=0.3287 and 0.3886, Figure 5A). Collectively, in TFF-1-transfected SBC-5 and LC-AI cells, further transfection of TFF-1-specific siRNA under serum-free condition resulted in a 49 to 59% and 54 to 70% reduction in total TFF-1 protein expression, respectively, as measured by ELISA. In the presence of 2% FBS, total TFF-1 protein expression was reduced by 27 to 38% and 31 to 44% in SBC-5 and LC-AI cells, respectively. Non-targeting siRNA caused a minor suppression, 5–7%, under serum-free condition and 3–4% reduction in the presence of 2% FBS (Figure 5A). Based on these results, cell proliferation and cell death assays were performed following transfection with or without siRNAs and quantified by the Viability/Cytotoxicity assay. In TFF-1-transfected cells, 3 days of treatment with siRNA against TFF-1 resulted in the restoration of proliferation in both cell lines, but non-targeting siRNA showed no obvious effect. For example, for SBC-5 cells, the viability index of cells transfected with TFF-1-siRNA was 87.5% that of the parental and 90.3% that of the control-transfected cells, whereas cells transfected with a non-targeting siRNA had viability indices of 68.8% and 71.0%, respectively (Figure 5B). As shown in Figure 5C, the dead cell indices of cells transfected with TFF-1-targeting siRNA returned to essentially comparable levels: 119% that of parental and 111% that of control-transfected SBC-5 cells, and 120% that of parental and 114% that of control-transfected LC-AI cells. In contrast, non-targeting siRNA transfection had minimal effect, ie, the dead cell indices in cells transfected with non-targeting siRNA remained 150 to 160% that of the parental and control-transfected cells. Therefore, the downregulation of TFF-1 by siRNA for TFF-1 notably reduced the suppression of proliferation and enhancement of cell death observed in cells overexpressing TFF-1. However, siRNA treatment did not cause further enhancement of cell proliferation or suppression of cell death in parental or control-transfected cells (Figure 5B and C). Since TFF-1 was not endogenously expressed in these two cell lines, these results further support the hypothesis that forced expression of TFF-1 was responsible for the inhibition of cell proliferation.
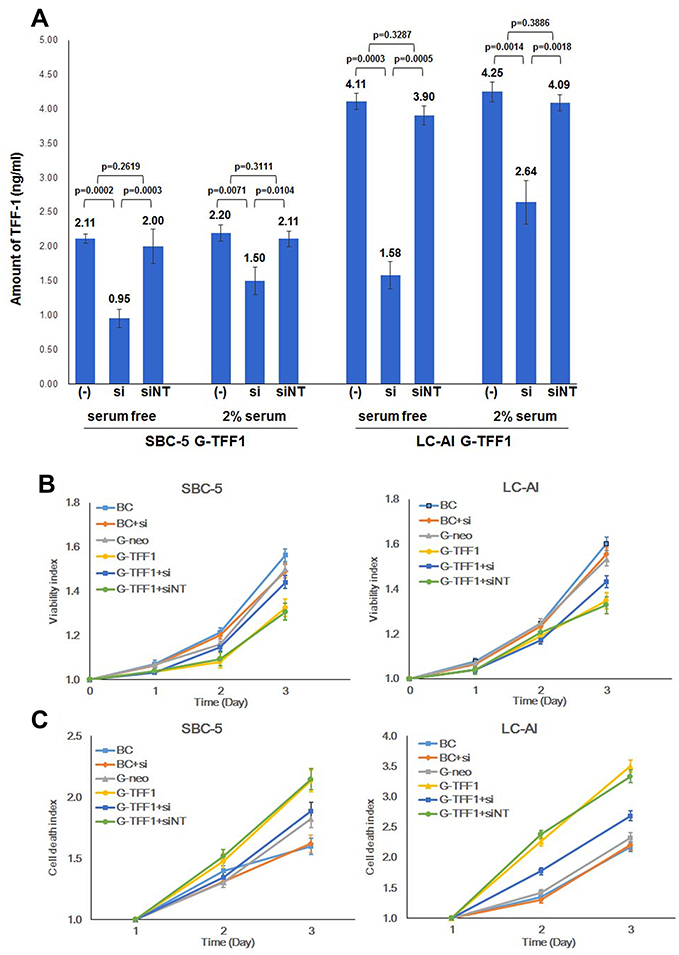 |
Figure 5 siRNA against TFF-1 reversed the suppression of cell proliferation and cell death caused by TFF-1. (A) Suppression of TFF-1 expression by transfection of TFF-1-specific and non-targeting siRNA into TFF1-transfected cells in the absence or presence of 2% serum in the media. Square and bar indicate mean values and standard deviations, respectively, obtained from three replicated experiments with three replicate samples analyzed by ELISA. Results were statistically analyzed and p-values were obtained by Fisher’s PLSD test. (B) Growth curves of parental, pBA-neo, or pBA-TFF1-transfected SBC-5 and LC-AI cells with or without transfection by TFF-1 siRNA or non-targeting siRNA evaluated by viability assay. (C) Dead cell fractions evaluated by cytotoxicity assay in the same SBC-5 and LC-AI-derived cell lines. (B and C) Mean value ± standard deviation (bar), obtained from three replicated experiments, was indicated. Abbreviations: (-), no siRNA treatment; si, siRNA for TFF-1; siNT, non-targeting siRNA; BC, blank control of parental cells; G-neo, cells transfected with pBA-neo; G-TFF1, cells transfected with pBA-TFF1. |
Cell Cycle Analysis
Next, the cell cycle was analyzed by flow cytometry. Since SBC-5 cells were prone to be observed in sub-diploid fraction by the procedure to obtain a single cell from aggregated cells, we gated the fractions of G1 to G2/M and avoided sub-G1 fraction. The distribution of cell cycle phases was altered in cells overexpressing TFF-1 (Figure 6). In TFF-1-transfected SBC-5 and LC-AI cells, the proportion of cells in G1 phase was 8.1% and 7.9% lower, respectively, compared to control-transfected cells, but the proportion in S phase was 5.1% and 2.4% higher, and in G2/M-phases was 3.0% and 5.5% higher, respectively. These results indicated that, in TFF-1-transfected cells, the cell cycle was driven more rapidly, consistent with the results of the proliferation assay.
 |
Figure 6 Results of cell cycle analysis by flow cytometry (A and B). Values indicate cell fractions in each phase of the cell cycle and are expressed as mean value ± standard deviation obtained from three replicated experiments. Abbreviations: BC, blank control of parental cells; G-neo, cells transfected with pBA-neo; G-TFF1, cells transfected with pBA-TFF1. |
Cell Migration Analysis
Given that expression of TFF-1 has been implicated in migration and metastasis in a number of cancers, we examined the effects of TFF-1 on the migration of lung cancer cells in the wound healing assay. The relative level of migration was examined in parental, control-transfected, and TFF-1-transfected cells, as well as in cells transfected with siRNA. Results revealed that TFF-1-transfected cells migrated at a slower rate (as shown by the wound area) compared to parental or control-transfected cells (Figure 7A and B). Wound closure rates in parental, control-transfected and TFF-1-transfected cells were 32.7%, 31.2% and 9.2% for SBC-5 cells, and 48.0%, 42.0% and 7.5% for LC-AI cells, respectively. The difference in migration rates between parental or control-transfected and TFF-1-transfected was borderline significant in SBC-5 cells (p=0.0471, and 0.0552, respectively, by Fisher’s PLSD test), but significant in LC-AI cells (p=0.0319 and 0.0359, Figure 7C and D). No significant difference was noted between parental and control-transfected cells (p=0.9437 in SBC-5, p=0.9019 in LC-AI). These results suggest that migration was impaired by overexpression of TFF-1.
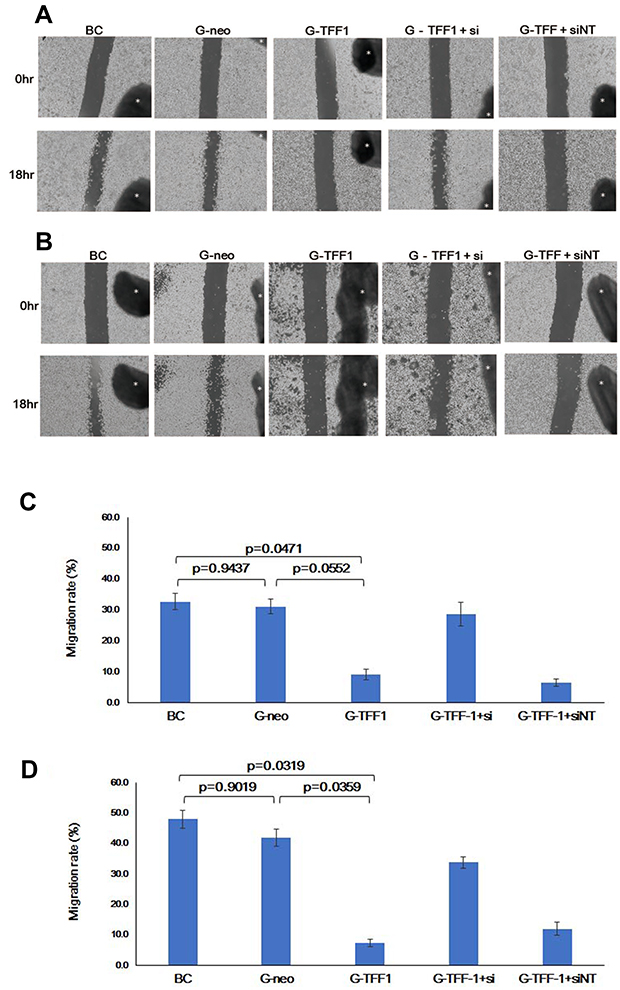 |
Figure 7 Overexpression of TFF-1 protein suppresses migration, but its downregulation restores migration. (A and B) Photographs of the scratched area on the dish at 0hr (upper row) and 18hrs (lower row) after incubation in serum-free medium. Black dot with asterisk indicates the mark for the fixed point observation. (C and D) Schematic presentation of the area covered by migrated cells within the wound. Results were statistically analyzed by Mann–Whitney U-test and p-values were obtained by Fisher’s PLSD test. (A and C) SBC-5 and (B and D) LC-AI cells. (C and D) Square and bar indicate mean value and standard deviation, respectively, obtained from three replicated experiments. Abbreviations: BC, blank control of parental cells; G-neo, cells transfected with pBA-neo; G-TFF1, cells transfected with pBA-TFF1; si, siRNA for TFF-1; siNT, non-targeting siRNA. |
To further confirm the effect of TFF-1 overexpression on migration, we examined the effect of TFF-1 knockdown. When TFF-1-specific and non-targeting siRNAs were introduced into TFF-1-transfected SBC-5 cells, the TFF-1-specific, but not the non-targeting siRNA restored migration up to a 28.7% wound closure rate, comparable to parental (32.7%) and control-transfected (31.2%) cells (Figure 7A and B), although differences of closure rates were not statistically significant (p=0.0729 between TFF-1-transfected and TFF-1-transfected with siRNA by Fisher’s PLSD test). In LC-AI cells, introduction of TFF-1-specific siRNA also partially restored migration to a 33.8% wound closure rate, slightly less than that seen with parental (48.0%) and control-transfected cells (42%). Again, differences of closure rates did not reach the level of statistical significance (p=0.0621 between TFF-1-transfected and TFF-1-transfected with siRNA by Fisher’s PLSD test). Introduction of the non-targeting siRNA into TFF-1-transfected cells had little or no effect (Figure 7A–D). Therefore, in both cell lines, overexpression of TFF-1 downregulated migration, and this was reversed by introduction of siRNA targeting TFF-1. These results suggest that the inhibitory effect on tumor cell migration is predominantly due to upregulation of TFF-1. We further noted that that introduction of siRNA for TFF-1 into parental, or control-transfected cells did not enhance basal migration rates.
Invasion Assay
Next, the invasive capacity of TFF-1-transfected cells was evaluated by a Transwell assay. Similar to the results of the migration assay, invasiveness was also markedly reduced by overexpression of TFF-1. TFF-1-transfected cells showed a lower rate of invasion: in parental, control-transfected and TFF-1-transfected SBC-5 cells, the invasion rate was 77.2%, 76.0% and 58.4%, respectively. For LC-AI cells, these numbers were 74.8%, 73.7% and 61.3%, respectively (Figure 8A and B). Therefore, invasiveness was reduced by up to 23.2% in TFF-1-transfected cells compared with controls. These differences in invasiveness between parental or control-transfected and TFF-1-transfected cells was statistically significant for SBC-5 (p=0.0315 and p=0.0419, by Fisher’s PLSD test), but of borderline significance for LC-AI cells (p=0.0505 and p=0.0588, Table 1). No significant difference was noted between parental and control-transfected cells (p=0.9719 in SBC-5, p=0.8309 in LI-AI, Figure 8B).
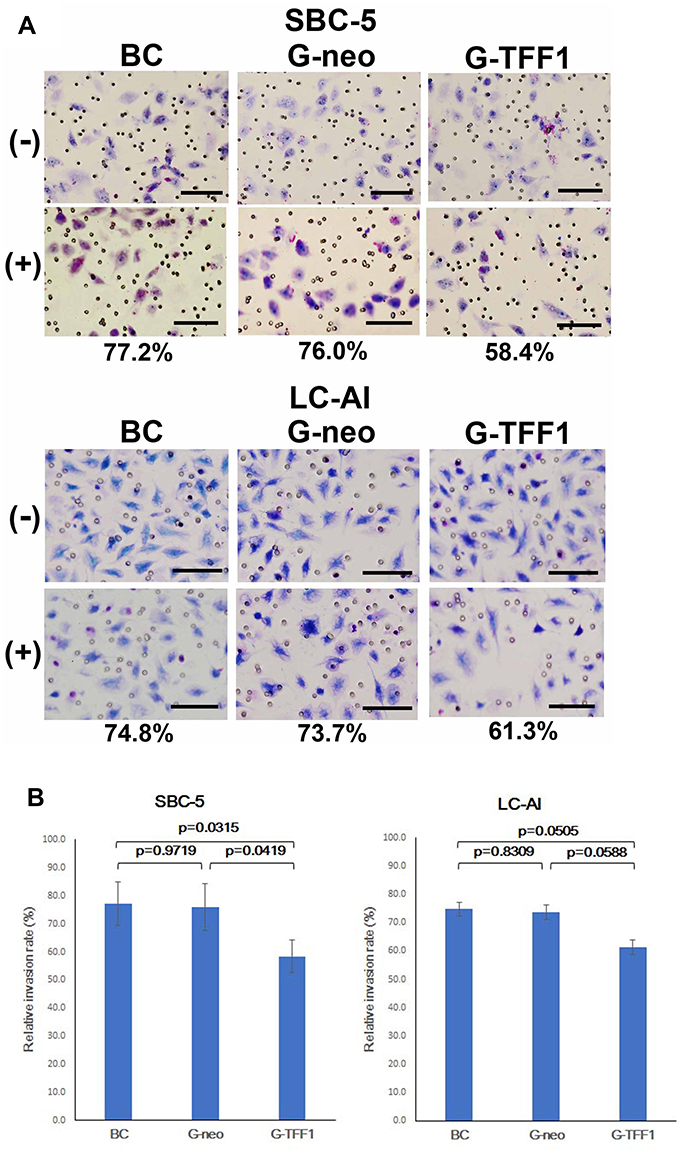 |
Figure 8 Effect of TFF-1 overexpression on invasiveness in Transwell assay. (A) Photographs of the representative fields of parental, pBA-neo-transfected and pBA-TFF1-transfected cells on the Transwell membrane stained with Giemsa/Methylene blue. The value indicates the average invasion rate which is the ratio of the cell number on the membrane with the Matrigel to that without Matrigel obtained from three replicate experiments. Scale bar indicates 100μm. (B) The relative level of invasion represented by the ratio of the number of traversed cells through the Matrigel-coated membrane to that without Matrigel. Results were statistically analyzed by Mann–Whitney U-test and p-values were obtained by Fisher’s PLSD test. Square and bar indicate mean value and standard deviation, respectively, obtained from three replicated experiments. Abbreviations: BC, blank control of parental cells; cells transfected with pBA-neo; G-TFF1, cells transfected with pBA-TFF1; (-), without Matrigel; (+), with Matrigel. |
Discussion
TFF-1 is involved in diverse physiological processes, such as cell proliferation, differentiation, blood vessel formation,3,7,10 regulation of the central nervous system,30 as well as mucosal protection of the gastrointestinal tract.2,7 With regards to tumorigenesis, the functional involvement of TFF-1 has been conflicting and variously described in the literature. TFF-1 overexpression is observed in a range of carcinomas,7,8,13–15 suggesting its tumorigenic function. Meanwhile, its possible function as a tumor suppressor-like protein has also been reported in gastric and other cancers.2,8,16,20,31 Clinically, TFF-1 expression is reduced in human gastric carcinomas due to TFF-1 gene alterations.8,32,33 In breast cancer, TFF-1 overexpression is a predictive factor of the response to the hormone therapy and contributes to a favorable prognosis.7,16 These discordant findings suggest that TFF-1 potentially has dual functions as both oncogenic and a tumor suppressor-like protein in a cell-type specific or a context-dependent manner.2,34 Since the information of TFF-1 in lung cancer may provide an insight in its role, we tried to clarify the function of TFF-1 in lung cancer cells.
The results in our current study reveal several novel effects modulated by TFF-1 and may advance our understanding of its pathobiological function in lung cancer cells. First, the expression of TFF-1 was detectable exclusively in AC cell lines. Second, TFF-1 promoted cell division, but also enhanced apoptosis, leading to decreased net proliferation rate as a result. Therefore, TFF-1 overexpression drives an abortive cell cycle. Third, TFF-1 is involved in regulating and inhibiting migration and invasion. These overall observations are basically concordant with the previous reports that TFF-1 is overexpressed in some cells, while overexpression may drive tumor suppression.2,7,8,20 These also suggest that TFF-1 is not a simple oncogenic gene or tumor suppressor gene in lung cancer. The function should be evaluated from various aspects.
So far, histological type-specific expression/secretion of TFF-1 has not been described. In lung cancer, TFF-1 may prevent the establishment of cultured cell lines other than for AC. If this is the case, AC cells may be unique in that they have a specific, intrinsic cellular machinery that evades inhibition by TFF-1 and allows immortalization, but this mechanism is unclear at present.
With regards to the effects of TFF-1 on cell proliferation and apoptosis, the effects of TFF-1 are variously and conflictingly described. Previously, TFF-1 was reported to delay the transition of cells from Gl to S phase, and to reduce apoptosis in gastrointestinal cells.18 However, acceleration of G1/S transition with S-phase arrest was also described in gastric cancer cells.20 Our current results suggest another mechanism, ie, overexpression of TFF-1 enhances the proportion of S-G2/M phases in the cell cycle, but simultaneously enhances the dead cell fraction. This may be a unique profile showing the context-dependent effects of TFF-1 on cell cycle regulation.
Forced overexpression of TFF-1 suppressed the migration and invasion of SBC-5 and LC-AI cells, in which TFF-1 is normally not endogenously expressed. Introduction of siRNA against TFF-1 reversed this suppressive effect, but did not further enhance migration in parental or control-transfected cells. Thus, the phenotypic changes observed in lung cancer cells overexpressing TFF-1 depends specifically and, at least, predominantly, on TFF-1 activity. Some reports in the literature are consistent with these results,7,35 but other studies showed an antithetical effect that TFF-1 expression stimulated the migration and invasion of cultured pancreatic and ovarian cancer cells12,13 or breast epithelial or cancer cells, while TFF-1 knockdown reduced those effects.16 In these latter examples, TFF-1 functions as a motogenic factor and promotes spreading and metastasis in several human cancers.
The signaling mechanisms associated with these various cancer cell phenotypes related to TFF-1 have been partially explained in recent reports. In colon and ovarian cancer cells, overexpression of TFF-1 was reported to promote tumorigenesis partially through the Wnt/ß-catenin pathway.12,14 Meanwhile, in gastric cancer, TFF-1 inactivates the transcription factor NF-κB,36,37 along with TNF-α and IL-6 receptor-mediated signaling. These are all critical pro-inflammatory pathways and play major roles in inflammation-driven carcinogenesis.36,38–41 The function of TFF-1 may also depend on the inflammation in the particular tumor micro-environment.
It has also been reported that when TFF-1 is abnormally overexpressed in epithelial tissues from glandular organs, it acts as a promoter of tumorigenesis through its anti-senescence activity.17 Consistently, knockdown of TFF-1 results in decreased viability, increased senescence in prostate and pancreatic cancer cells in vitro and reduced tumor growth in vivo.17 In this setting, TFF-1 could confer resistance against oncogene-induced senescence.
Although apoptosis was enhanced by TFF-1 in the present study, the involvement of TFF-1 in apoptosis has also been variously described. TFF-1 facilitates apoptosis in gastric cancer cells,20 and one of the signaling mechanisms has been described as involving the transcriptional activation of p53 and the concurrent downregulation of miR-18a expression in retinoblastoma Y-79 cells.42 On the other hand, knockdown of TFF-1 in the different retinoblastoma cells, RBL30, induced apoptosis without altering the cell proliferation rate.42 There was also one report on lung AC that appears inconsistent with our current findings, showing that knockdown of TFF-1 inhibited cell proliferation and induced apoptosis in a TFF-1/high and KRAS-mutated lung AC cell line.43 Again, these overall diverse effects of TFF-1 on cancer cell phenotypes may reflect a complex machinery that varies with cell type. Although discrepancies among these overall results may derived from differences in the cell lines or experimental procedures used (for example, forced expression or knockdown, constitutive or transient overexpression), the functional involvement of TFF-1 in proliferation, migration, invasion and apoptosis, seems much more dependent on upstream events.
TFF-1 represents an example of a gene whose complex roles in tumorigenesis and maintenance of cancer cells are manifested in a tissue-specific manner. Such complexity seems to be determined by different intrinsic activities at the cellular and molecular level underlying the dual activities of TFF-1.
In conclusion, we have shown that overexpression of TFF-1 results in suppression of cell proliferation by induction of apoptosis, and inhibition of migration and invasion in vitro in lung cancer-derived cells. The effects of constitutive overexpression of TFF-1 on lung cancer phenotype has hitherto not been described. Given the important roles of this signaling molecule, which cross-talks with a variety of other factors, these novel findings suggest a new direction for the treatment of lung cancer, such as the development of synergic agents of TFF-1. Further exploration regarding the roles and mechanisms of TFF-1 function in lung cancer at the cellular and clinical levels is under way in our laboratory.
Abbreviations
TFF, Trefoil Factor; ELISA, enzyme-linked immunosorbent assay; AC, adenocarcinoma; SCC, squamous cell carcinoma; LCC, large cell carcinoma; SmCC, small cell carcinoma; FBS, fetal bovine serum; IF, immunofluorescent staining; DAPI, 4′,6-diamidino-2-phenylindole; qRT-PCR, Quantitative real-time PCR; cas3/7, caspase 3/7; siRNA, small interfering RNA; ANOVA, analysis of variance.
Acknowledgments
This work is partially supported by Japan Society for the Promotion of Science 17K08727, 20K07378 (YD, HT), 23501295 (SN), Smoking Research Foundation (YD, HT, KM) and Princess Takamatsu Cancer Research Fund (SN). Funding sources had no role in study design, data collection, and analysis; in the decision to publish; or in the preparation of the manuscript. We thank Ms. M. Furuya and Ms. E. Kimura for the excellent technical assistance.
Disclosure
The authors report no editorial or financial conflicts of interest in this work.
References
1. Siegel RL, Miller KD, Jemal A. Cancer statistics, 2019. CA Cancer J Clin. 2019;69(1):7–34. doi:10.3322/caac.21551
2. Busch M, Dunker N. Trefoil factor family peptides–friends or foes? Biomol Concepts. 2015;6(5–6):343–359. doi:10.1515/bmc-2015-0020
3. Kjellev S. The trefoil factor family - small peptides with multiple functionalities. Cell Mol Life Sci. 2009;66(8):1350–1369. doi:10.1007/s00018-008-8646-5
4. Madsen J, Nielsen O, Tornoe I, Thim L, Holmskov U. Tissue localization of human trefoil factors 1, 2, and 3. J Histochem Cytochem. 2007;55(5):505–513. doi:10.1369/jhc.6A7100.2007
5. Masiakowski P, Breathnach R, Bloch J, Gannon F, Krust A, Chambon P. Cloning of cDNA sequences of hormone-regulated genes from the MCF-7 human breast cancer cell line. Nucleic Acids Res. 1982;10(24):7895–7903. doi:10.1093/nar/10.24.7895
6. Prud’homme JF, Fridlansky F, Le Cunff M, et al. Cloning of a gene expressed in human breast cancer and regulated by estrogen in MCF-7 cells. DNA. 1985;4(1):11–21. doi:10.1089/dna.1985.4.11
7. Mathelin C, Tomasetto C, Rio MC. [Trefoil factor 1 (pS2/TFF1), a peptide with numerous functions]. Bull Cancer. 2005;92(9):773–781. French.
8. Ribieras S, Tomasetto C, Rio MC. The pS2/TFF1 trefoil factor, from basic research to clinical applications. Biochim Biophys Acta. 1998;1378(1):F61–77.
9. Emami S, Le Floch N, Bruyneel E, et al. Induction of scattering and cellular invasion by trefoil peptides in src- and RhoA-transformed kidney and colonic epithelial cells. FASEB J. 2001;15(2):351–361. doi:10.1096/fj.00-0355com
10. Rodrigues S, Van Aken E, Van Bocxlaer S, et al. Trefoil peptides as proangiogenic factors in vivo and in vitro: implication of cyclooxygenase-2 and EGF receptor signaling. FASEB J. 2003;17(1):7–16. doi:10.1096/fj.02-0201com
11. Rodrigues S, Rodrigue CM, Attoub S, et al. Induction of the adenoma-carcinoma progression and Cdc25A-B phosphatases by the trefoil factor TFF1 in human colon epithelial cells. Oncogene. 2006;25(50):6628–6636. doi:10.1038/sj.onc.1209665
12. Zhao S, Ma Y, Huang X. Trefoil factor 1 elevates the malignant phenotype of mucinous ovarian cancer cell through Wnt/beta-catenin signaling. Int J Clin Exp Pathol. 2015;8(9):10412–10419.
13. Arumugam T, Brandt W, Ramachandran V, et al. Trefoil factor 1 stimulates both pancreatic cancer and stellate cells and increases metastasis. Pancreas. 2011;40(6):815–822. doi:10.1097/MPA.0b013e31821f6927
14. Yusufu A, Shayimu P, Tuerdi R, Fang C, Wang F, Wang H. TFF3 and TFF1 expression levels are elevated in colorectal cancer and promote the malignant behavior of colon cancer by activating the EMT process. Int J Oncol. 2019;55(4):789–804.
15. Ishibashi Y, Ohtsu H, Ikemura M, et al. Serum TFF1 and TFF3 but not TFF2 are higher in women with breast cancer than in women without breast cancer. Sci Rep. 2017;7(1):4846. doi:10.1038/s41598-017-05129-y
16. Buache E, Etique N, Alpy F, et al. Deficiency in trefoil factor 1 (TFF1) increases tumorigenicity of human breast cancer cells and mammary tumor development in TFF1-knockout mice. Oncogene. 2011;30(29):3261–3273. doi:10.1038/onc.2011.41
17. Radiloff DR, Wakeman TP, Feng J, Schilling S, Seto E, Wang XF. Trefoil factor 1 acts to suppress senescence induced by oncogene activation during the cellular transformation process. Proc Natl Acad Sci U S A. 2011;108(16):6591–6596. doi:10.1073/pnas.1017269108
18. Bossenmeyer-Pourie C, Kannan R, Ribieras S, et al. The trefoil factor 1 participates in gastrointestinal cell differentiation by delaying G1-S phase transition and reducing apoptosis. J Cell Biol. 2002;157(5):761–770. doi:10.1083/jcb200108056
19. Calnan DP, Westley BR, May FE, Floyd DN, Marchbank T, Playford RJ. The trefoil peptide TFF1 inhibits the growth of the human gastric adenocarcinoma cell line AGS. J Pathol. 1999;188(3):312–317. doi:10.1002/(SICI)1096-9896(199907)188:3<312::AID-PATH360>3.0.CO;2-P
20. Ge Y, Zhang J, Cao J, et al. TFF1 inhibits proliferation and induces apoptosis of gastric cancer cells in vitro. Bosn J Basic Med Sci. 2012;12(2):74–81. doi:10.17305/bjbms.2012.2499
21. Lefebvre O, Chenard MP, Masson R, et al. Gastric mucosa abnormalities and tumorigenesis in mice lacking the pS2 trefoil protein. Science. 1996;274(5285):259–262. doi:10.1126/science.274.5285.259
22. Machado JC, Nogueira AM, Carneiro F, Reis CA, Sobrinho-Simoes M. Gastric carcinoma exhibits distinct types of cell differentiation: an immunohistochemical study of trefoil peptides (TFF1 and TFF2) and mucins (MUC1, MUC2, MUC5AC, and MUC6). J Pathol. 2000;190(4):437–443. doi:10.1002/(SICI)1096-9896(200003)190:4<437::AID-PATH547>3.0.CO;2-1
23. Fujimoto J, Yasui W, Tahara H, et al. DNA hypermethylation at the pS2 promoter region is associated with early stage of stomach carcinogenesis. Cancer Lett. 2000;149(1–2):125–134. doi:10.1016/S0304-3835(99)00349-3
24. Park WS, Oh RR, Park JY, et al. Somatic mutations of the trefoil factor family 1 gene in gastric cancer. Gastroenterology. 2000;119(3):691–698. doi:10.1053/gast.2000.16483
25. Koh MJ, Shin DH, Lee SJ, et al. Gastric-type gene expression and phenotype in non-terminal respiratory unit type adenocarcinoma of the lung with invasive mucinous adenocarcinoma morphology. Histopathology. 2020;76(6):898–905. doi:10.1111/his.14077
26. Ludovini V, Bianconi F, Siggillino A, et al. Gene identification for risk of relapse in stage I lung adenocarcinoma patients: a combined methodology of gene expression profiling and computational gene network analysis. Oncotarget. 2016;7(21):30561–30574. doi:10.18632/oncotarget.8723
27. Higashiyama M, Doi O, Kodama K, Yokuchi H, Inaji H, Tateishi R. Estimation of serum level of pS2 protein in patients with lung adenocarcinoma. Anticancer Res. 1996;16(4B):2351–2355.
28. Ruibal A, Nunez MI, Del rio MC, Garcia Diez S, Rodriguez J, Alvarez De Linera JA. [Cytosolic pS2 levels in 154 non-small-cell lung carcinomas. Correlation with other clinical and biological parameters]. Rev Esp Med Nucl. 2002;21(2):109–114. Spanish. doi:10.1016/S0212-6982(02)72044-2
29. Aikou S, Ohmoto Y, Gunji T, et al. Tests for serum levels of trefoil factor family proteins can improve gastric cancer screening. Gastroenterology. 2011;141(3):
30. Jensen P, Ducray AD, Widmer HR, Meyer M. Effects of Forskolin on Trefoil factor 1 expression in cultured ventral mesencephalic dopaminergic neurons. Neuroscience. 2015;310:699–708. doi:10.1016/j.neuroscience.2015.10.010
31. Soutto M, Chen Z, Saleh MA, et al. TFF1 activates p53 through down-regulation of miR-504 in gastric cancer. Oncotarget. 2014;5(14):5663–5673. doi:10.18632/oncotarget.2156
32. Katoh M. Trefoil factors and human gastric cancer (review). Int J Mol Med. 2003;12(1):3–9.
33. Shi SQ, Cai JT, Yang JM. Expression of trefoil factors 1 and 2 in precancerous condition and gastric cancer. World J Gastroenterol. 2006;12(19):3119–3122. doi:10.3748/wjg.v12.i19.3119
34. Perry JK, Kannan N, Grandison PM, Mitchell MD, Lobie PE. Are trefoil factors oncogenic? Trends Endocrinol Metab. 2008;19(2):74–81. doi:10.1016/j.tem.2007.10.003
35. Liu J, Wang X, Yang X, et al. miRNA423-5p regulates cell proliferation and invasion by targeting trefoil factor 1 in gastric cancer cells. Cancer Lett. 2014;347(1):98–104. doi:10.1016/j.canlet.2014.01.024
36. Soutto M, Belkhiri A, Piazuelo MB, et al. Loss of TFF1 is associated with activation of NF-kappaB-mediated inflammation and gastric neoplasia in mice and humans. J Clin Invest. 2011;121(5):1753–1767. doi:10.1172/JCI43922
37. Xia Y, Shen S, Verma IM. NF-kappaB, an active player in human cancers. Cancer Immunol Res. 2014;2(9):823–830. doi:10.1158/2326-6066.CIR-14-0112
38. He G, Karin M. NF-kappaB and STAT3 - key players in liver inflammation and cancer. Cell Res. 2011;21(1):159–168. doi:10.1038/cr.2010.183
39. Yang J, Liao X, Agarwal MK, Barnes L, Auron PE, Stark GR. Unphosphorylated STAT3 accumulates in response to IL-6 and activates transcription by binding to NFkappaB. Genes Dev. 2007;21(11):1396–1408. doi:10.1101/gad.1553707
40. Grivennikov SI, Karin M. Dangerous liaisons: STAT3 and NF-kappaB collaboration and crosstalk in cancer. Cytokine Growth Factor Rev. 2010;21(1):11–19. doi:10.1016/j.cytogfr.2009.11.005
41. Soutto M, Chen Z, Bhat AA, et al. Activation of STAT3 signaling is mediated by TFF1 silencing in gastric neoplasia. Nat Commun. 2019;10(1):3039. doi:10.1038/s41467-019-11011-4
42. Busch M, Grosse-Kreul J, Wirtz JJ, et al. Reduction of the tumorigenic potential of human retinoblastoma cell lines by TFF1 overexpression involves p53/caspase signaling and miR-18a regulation. Int J Cancer. 2017;141(3):549–560. doi:10.1002/ijc.30768
43. Matsubara D, Yoshimoto T, Soda M, et al. Reciprocal expression of trefoil factor-1 and thyroid transcription factor-1 in lung adenocarcinomas. Cancer Sci. 2020;111(6):2183–2195. doi:10.1111/cas.14403
 © 2021 The Author(s). This work is published and licensed by Dove Medical Press Limited. The
full terms of this license are available at https://www.dovepress.com/terms
and incorporate the Creative Commons Attribution
- Non Commercial (unported, 3.0) License.
By accessing the work you hereby accept the Terms. Non-commercial uses of the work are permitted
without any further permission from Dove Medical Press Limited, provided the work is properly
attributed. For permission for commercial use of this work, please see paragraphs 4.2 and 5 of our Terms.
© 2021 The Author(s). This work is published and licensed by Dove Medical Press Limited. The
full terms of this license are available at https://www.dovepress.com/terms
and incorporate the Creative Commons Attribution
- Non Commercial (unported, 3.0) License.
By accessing the work you hereby accept the Terms. Non-commercial uses of the work are permitted
without any further permission from Dove Medical Press Limited, provided the work is properly
attributed. For permission for commercial use of this work, please see paragraphs 4.2 and 5 of our Terms.