Back to Journals » Infection and Drug Resistance » Volume 14
Saliva Testing is a Robust Non-Invasive Method for SARS-CoV-2 RNA Detection
Authors Palikša S ![]() , Lopeta M
, Lopeta M ![]() , Belevičius J, Kurmauskaitė V, Ašmenavičiūtė I, Pereckaitė L, Vitkauskienė A, Baliūtytė I, Valentaitė M, Mickienė A, Gagilas J
, Belevičius J, Kurmauskaitė V, Ašmenavičiūtė I, Pereckaitė L, Vitkauskienė A, Baliūtytė I, Valentaitė M, Mickienė A, Gagilas J
Received 12 May 2021
Accepted for publication 7 July 2021
Published 27 July 2021 Volume 2021:14 Pages 2943—2951
DOI https://doi.org/10.2147/IDR.S314491
Checked for plagiarism Yes
Review by Single anonymous peer review
Peer reviewer comments 2
Editor who approved publication: Prof. Dr. Héctor Mora-Montes
Sigitas Palikša,1 Mantvydas Lopeta,1 Jonas Belevičius,1 Vaida Kurmauskaitė,1 Ieva Ašmenavičiūtė,1 Laura Pereckaitė,2 Astra Vitkauskienė,2 Ieva Baliūtytė,3 Monika Valentaitė,3 Auksė Mickienė,3 Julius Gagilas1
1JSC Diagnolita, Vilnius, 10257, Lithuania; 2Department of Laboratory Medicine, Lithuanian University of Health Sciences, Kaunas, 50161, Lithuania; 3Department of Infectious Diseases, Lithuanian University of Health Sciences, Kaunas Hospital, Kaunas, 47116, Lithuania
Correspondence: Sigitas Palikša
JSC Diagnolita, Saulėtekio al. 7C, Vilnius, 10257, Lithuania
Tel +370 688 12972
Email [email protected]
Purpose: The precise diagnostic testing is of high importance in fighting the coronavirus pandemic. While nasopharyngeal (NP) swab testing is currently the gold standard, the SARS-CoV-2 virus could be also detected in some other body fluids. In this study, we aimed to compare the SARS-CoV-2 RNA detection results, obtained using saliva samples and NP swab samples, collected from infected patients and healthy volunteers.
Patients and Methods: A total of 111 individuals were enrolled in this study: 53 healthy volunteers, participating in routine testing and 58 COVID-19 patients. Diagnosis for both groups was confirmed using a set of diagnostic CE-IVD labeled RT-qPCR kits. Most of the saliva samples were collected within 48 hours after the NP swabs were taken. RNA was purified from saliva samples and analyzed using a laboratory-developed kit (Diagnolita). Detection results for both sample types were compared and analyzed in terms of result agreement, Ct variation, and quantity of internal control, as well as population analysis.
Results: We found a good concordance between the NP swab and saliva samples. The positive percent agreement was 98.28% (CI 90.76– 99.96%) and negative percent agreement was 98.11% (CI 89.93– 99.95%). Additionally, we observed a statistically significant (p< 0.05) and moderately strong (R = 0.53) correlation between Ct values in saliva and NP swab samples. The saliva collection method is more robust since the Ct variation of internal control ribonuclease P mRNA detection is lower in saliva samples.
Conclusion: Saliva sample testing is a robust and reliable non-invasive alternative to the NP swab method for SARS-CoV-2 RNA detection, as well as a promising tool for COVID-19 screening.
Keywords: COVID-19, coronavirus, infection, RT-qPCR
Introduction
COVID-19 infection, caused by the SARS-CoV-2 virus, has spread worldwide since its emergence in Wuhan, China, at the end of 2019.1 The WHO has announced the pandemic situation in March 2020.2 As of 6 May 2021, more than 155 million confirmed cases and 3.2 million COVID-19 caused deaths were reported worldwide.3
Large numbers of patients during the pandemic could lead to a deep health system crisis. Due to this, proper diagnostic methods resulting in rapid and reliable virus detection are of great importance. RT-qPCR detection of SARS-CoV-2 RNA using NP swabs is the gold-standard method, as recommended by the World Health Organization.4 However, SARS-CoV-2 RNA could be found also in other fluids – bronchoalveolar lavage fluid, sputum, fibro bronchoscopy brush biopsy, nasal swabs, pharyngeal swabs, blood, and saliva.5–7 Various strategies have been proposed to facilitate the diagnosis of SARS-CoV-2, in addition to those proposed by regulatory agencies of various countries or the WHO.8–10 Regarding the sample availability, saliva appears to be a very appropriate fluid, which could be easily collected without any invasive procedures. Saliva sampling is suitable for infants and compatible with self-collection, thus lowering the risk of infection for medical personnel.
Indeed, clinical studies, investigating saliva as a source for SARS-CoV-2 RNA detection, appeared rapidly after the pandemic started.7,11 Numerous investigations, related to SARS-CoV-2 diagnosis using saliva samples were published as of the end of 2020.12–14 In April 2020, the first FDA-approved tests for SARS-CoV-2 detection in saliva specimens appeared, albeit with emergency use precaution.15,16 Later, an increasing number of similar tests followed.17
There are several ways for viral particles to appear in saliva: infected salivary glands, both in the upper and lower respiratory tract, and from the blood through the gingival crevicular fluid.18,19 The appearance of viral particles in the saliva is related to the early stages of infection as SARS-CoV-2 RNA could be detected in saliva before lung lesions appear. This could also explain the transmission of the virus through asymptomatic infections.18
In this study, we compared the SARS-CoV-2 RNA detection results, obtained using saliva and the corresponding NP swab samples, collected from the same patients.
Patients and Methods
Participants
One hundred and eleven individuals were enrolled in this study: 53 healthy volunteers, participating in routine testing, and 58 patients, infected with SARS-CoV-2 virus after the infection was confirmed by RT-qPCR on NP swabs. All participants were familiarized with the study and have signed the informed consent form, according to the protocol, approved by Kaunas regional biomedical research ethics committee, approval number BE-2-72, date of approval 2020–06-17. Participants’ written informed consent was obtained prior to sample collection and the study was conducted in accordance with the Declaration of Helsinki.
NP swab samples were taken at the Emergency room of the Trauma and Emergency Center as well as COVID-19 testing facility of the Hospital of Lithuanian University of Health Sciences Kauno Klinikos. Saliva samples were taken from the same patients hospitalized at the Department of Infectious Diseases, Lithuanian University of Health Sciences, Kaunas Hospital.
Sample and Data Collection
NP swabs were taken according to the protocols, provided by the kit manufacturers and standard procedures, applied in the clinics. Corresponding saliva samples were collected after NP swabs were taken. Saliva was collected and stabilized using Saliva Collection Kit (#SCK, Diagnolita, Vilnius, Lithuania). Briefly, 2 mL of fresh saliva was collected into the saliva collection tube and immediately mixed with 2 mL of stabilization media. Stabilized saliva was kept at room temperature until purification.
The patient’s clinical symptoms were recorded at the time of hospitalization following the guidelines released by the Ministry of Health of The Republic of Lithuania (release date 2020 03 16, No. V-383). The following demographic data for each individual were collected: age, sex, and comorbidities.
Sample Purification and Analysis
NP swab samples, where applicable, were purified using GeneJET viral DNA and RNA purification kit (Thermo Fisher Scientific, Waltham, MA, USA). For RT-qPCR analysis, the following CE-IVD labeled kits were used: AmoyDx Novel Coronavirus (2019-nCoV) Detection Kit v4 (Amoy Diagnostics, Xiamen, China), Bosphore Novel Coronavirus (2019-nCoV) Detection Kit v4 (Anatolia Geneworks, Istanbul, Turkey), Covmultione v.3 (Biosta, Vilnius, Lithuania), GeneProof SARS-CoV-2 PCR Kit (GeneProof, Brno, Czech Republic), Liferiver Novel Coronavirus (2019-nCoV) Real-Time Multiplex RT-PCR Kit (Liferiver Bio-Tech, La Jolla, CA, USA).
Stabilized saliva samples were purified using Saliva NA Purification Kit (#SPK, Diagnolita, Vilnius, Lithuania) according to manufacturer's recommendations. Briefly, 0.49 milliliters of stabilized saliva were mixed with the binding solution, reducing reagent, proteinase K and magnetic beads. During this step, cells and viral particles are lysed and nucleic acids bind to the magnetic beads. Thereafter, beads were washed twice using wash buffers, included in the kit. Beads were collected on the magnet, and the nucleic acids were eluted into 50 µL of the elution buffer. RT-qPCR analysis was performed using the Primer-Probe Mix for SARS-CoV-2 Detection (#PPM, Diagnolita, Vilnius, Lithuania) and TaqManTM Fast Virus 1-Step Master Mix 4X (Thermo Fisher Scientific, Waltham, MA, USA).
Statistical Analysis
Statistical analysis was performed using R version 4.04. All comparisons were made with two-tailed tests and considered statistically significant at p < 0.05. The normality of the data was assessed using the Shapiro–Wilk test and Q-Q plots.
The Wilcoxon rank-sum test was utilized to compare the ages of subject groups stratified by sex and test results. The concordance between NP swab and saliva samples was evaluated by calculating positive and negative agreement values and estimating the Pearson correlation of viral Ct values. Confidence intervals for positive percent agreement and negative percent agreement were calculated using the Clopper-Pearson method as implemented in binom.confint function of the binom package.
Further comparison of NP swab and saliva samples involved assessment of internal control of human Ribonuclease P Protein Subunit P30 (RPP) RNA Ct values. Since different protocols may impact the variance of the control RNA Ct values, it was chosen to analyze only the largest group of the NP swab samples, processed according to the same protocol. The Wilcoxon signed-rank test was used to test the differences in RPP RNA Ct values of matched NP swabs and saliva samples. Also, the variance of Ct values was compared with the robust Levene test as implemented in leveneTest function of the car (Companion to Applied Regression) package.
Next, the analysis was continued with saliva samples only. Viral RNA Ct values were normalized by RPP RNA to obtain the Viral Score. The formula of Viral Score was as follows: RPP Ct – ORF1ab&S Ct + 10. In one case, RPP was not detected and a Ct value of 40 was inputted which corresponds to the number of PCR cycles. Three Viral Score levels were defined as low, medium, and high by choosing cutoff values based on Z-scores in a way that approximately half of the values would be classified as medium. Normalized viral RNA quantities as defined by Viral Score were compared with a t-test between patients with and without symptoms. The analysis was extended to the most frequent groups of symptoms. In each case, one-way ANOVA was utilized to compare three groups of subjects: asymptomatic, patients with a specific type of symptoms, and patients with other symptoms.
Results
This study was conducted from October 2020 to March 2021 in collaboration with the Department of Laboratory Medicine, Department of Infectious Diseases (both are departments of Medical Academy, Lithuanian University of Health Sciences, Kaunas, Lithuania) and JSC Diagnolita. One hundred and eleven individuals were recruited in this study: 53 healthy volunteers, participating in routine testing and 58 patients, infected with the SARS-CoV-2 virus. NP swab samples for all the subjects were taken at the clinics and a set of diagnostic CE-IVD labeled RT-qPCR kits was applied for SARS-CoV-2 RNA detection (Supplementary Figure S1). Saliva samples were collected from both healthy individuals and patients. For the majority of subjects, saliva samples were collected up to 48 hours after the NP swabs were taken (for more information see Supplementary Data File 1). Stabilized saliva specimens were purified and RT-qPCR was performed to compare the results, obtained using NP swabs and the corresponding saliva samples.
Demographic Analysis
Fifty samples of male and 61 samples of female subjects, aged between 15 and 85, were analyzed (Table 1). The median age in both groups was 44 and 58 years, respectively. The age difference between these groups was not significant (p = 0.18). Considering the SARS-CoV-2 RNA detection results, we noticed a significant age difference between the COVID-19 infected patients and healthy volunteers in both male and female groups (Table 1 and Supplementary Figure S2).
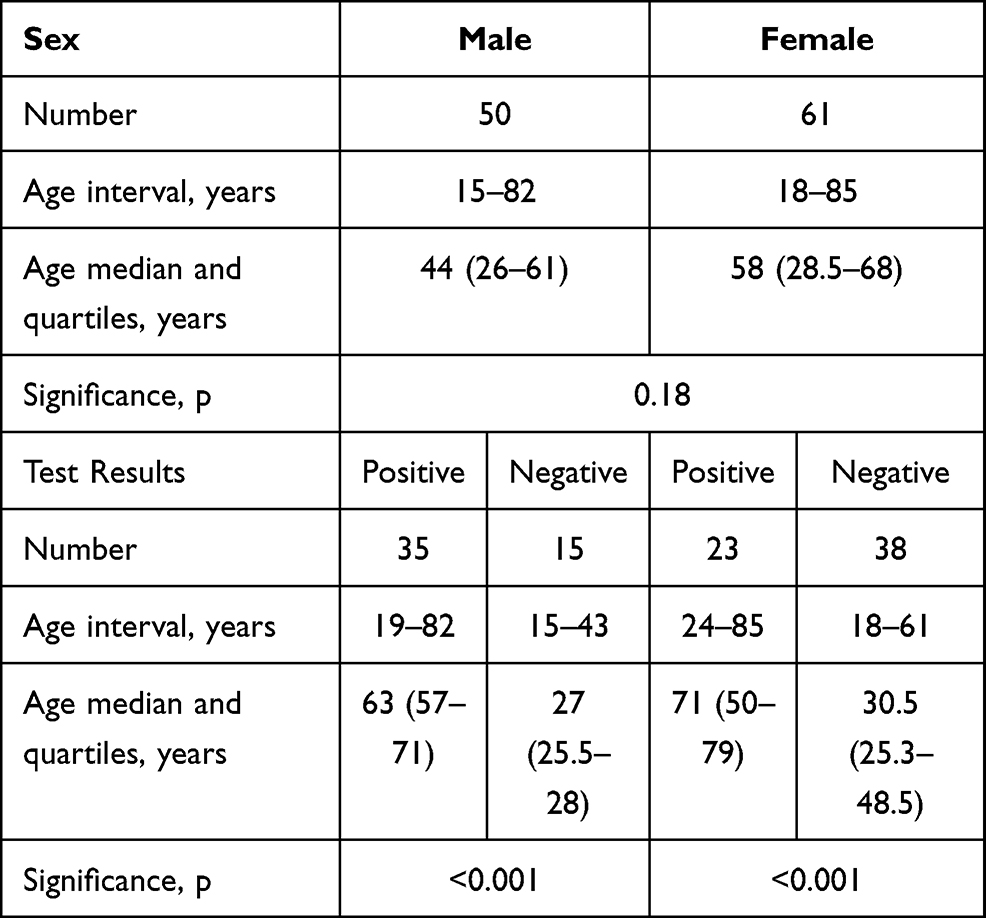 |
Table 1 Demographic Analysis |
Concordance Between NP and Saliva Samples
Statistical analysis, applied to examine the concordance between the two sample types, revealed a perfect agreement. Indeed, calculated positive percent agreement (PPV) and negative percent agreement (NPV) values were 98.28% (CI 90.76–99.96%) and 98.11% (CI 89.93–99.95%), respectively. Taking the NP results as a reference, only one false negative and one false-positive sample were detected (Table 2). Detailed analysis of the samples with false positive and false negative detection results is provided in the Supplementary Table S1. Additionally, we observed a statistically significant (p<0.05) and moderately strong (R = 0.53) correlation between Ct values, representing viral load in saliva and NP swab samples (Figure 1).
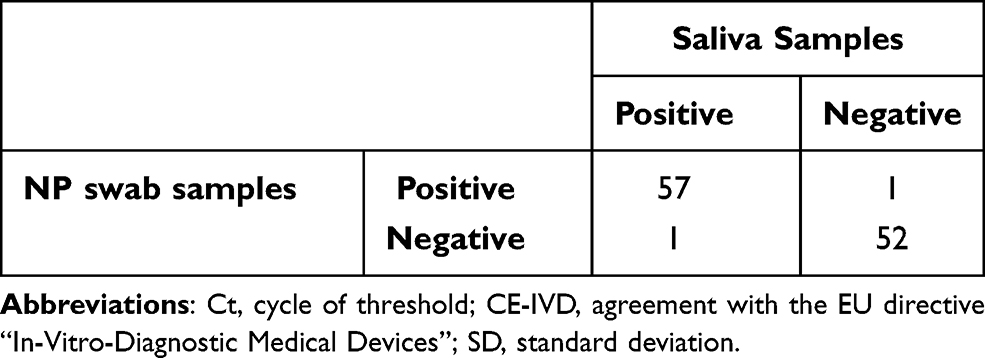 |
Table 2 Comparison of the Results, Obtained Using NP Swab and Saliva Samples |
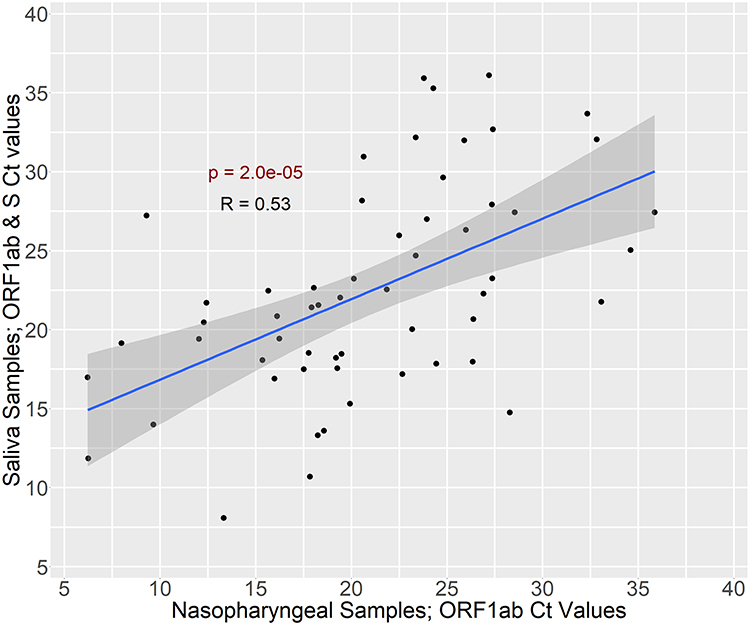 |
Figure 1 Correlation between Viral RNA Ct values in matched NP and saliva samples. Only Ct values of the ORF1ab gene were included for NP samples as this gene was detected with all kits and was used for detection in saliva samples as well. “ORF1ab & S” indicates that ORF1ab and S genes were detected in the same channel. |
Evaluation of the Control RNA Level in the Samples
We also made a comparison of the Ct values, representing the internal control RPP RNA, obtained for NP swab and saliva samples. Since the protocols for NP swab sample collection and stabilization used in this study varied depending on the RT-qPCR kit manufacturer’s recommendations, in this comparison we included only the largest group of NP swab samples, collected according to the same protocol. The nonparametric Wilcoxon test was applied when comparing the Ct values and the Levene test was applied when analyzing Ct variation in both sample types. Ct variation is expressed as absolute values of the deviations from the median. We obtained a statistically significant difference between the Ct values, corresponding to the amount of internal control RPP RNA (Figure 2). This could be explained by the different amounts and/or source of the biological material, taken during the sample collection. Additionally, we showed that Ct values, corresponding to the RPP amount in saliva samples, vary significantly less, in comparison to NP swab samples. This may be considered as a piece of evidence, showing that saliva collection is a more robust method, generating lower sample-to-sample variation.
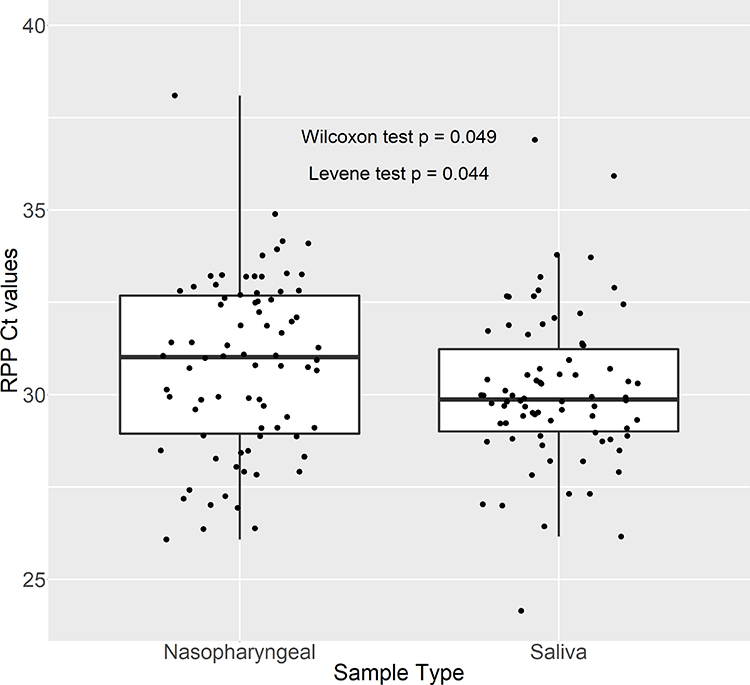 |
Figure 2 Internal Control RPP RNA Ct values by sample type. The largest group of NP samples that were collected according to the same instructions and matching saliva samples were included. |
Evaluation of the Viral RNA Level in the Saliva Samples
Ct values, representing the viral load in the saliva samples, were normalized to the Ct values and detected for RPP RNA, which is used as an internal control. The resulting Ct score was used to classify the viral RNA levels in the samples. The Levels of viral RNA were classified into three groups: low, medium, and high. The medium level is defined as the Ct score, which is close to the mean Ct – the deviation from the mean is less than 0.6475*SD. According to this categorization, the majority of the samples had medium levels of viral RNA. The Ct scores are distributed according to the Gaussian law (Figure 3).
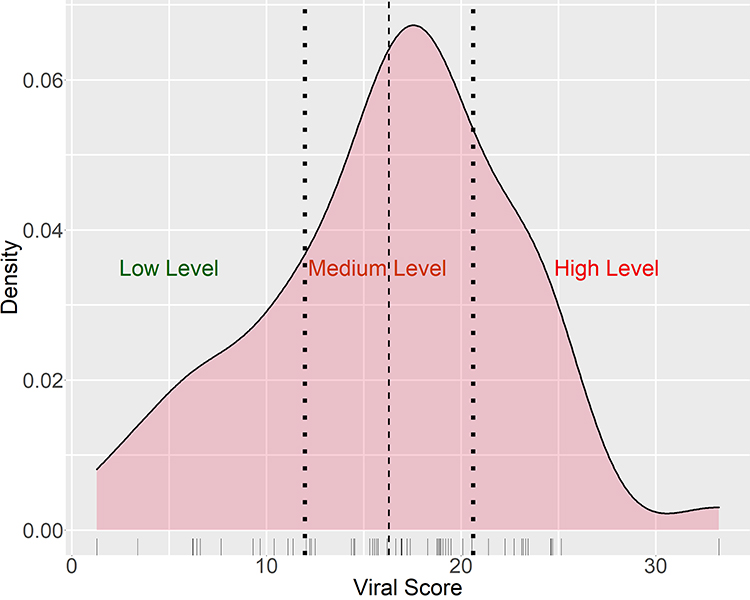 |
Figure 3 Distribution of Viral Scores in saliva samples. Viral Scores were obtained normalizing Viral RNA Ct values by control RPP RNA Ct values. Viral scores were classified into three groups: low, medium, and high levels. The cutoffs for classification were defined as mean±0.6475*SD and are shown as dotted vertical lines. Dashed vertical line indicates mean of Viral Scores. Separate observations are shown in the rug plot below the density plot. |
Comparison of Viral Score in Asymptomatic and Symptomatic Subjects
For patients with confirmed COVID-19 infection, symptoms were recorded during the clinical data collection. Additionally, the Viral Score values, obtained by performing the SARS-CoV-2 RNA detection using RT-qPCR, were analyzed to investigate if there is any relation between the viral load and clinical symptoms. However, we could not see any significant difference between Viral Score values in saliva samples, collected from patients suffering from symptoms and asymptomatic subjects (Figure 4.).
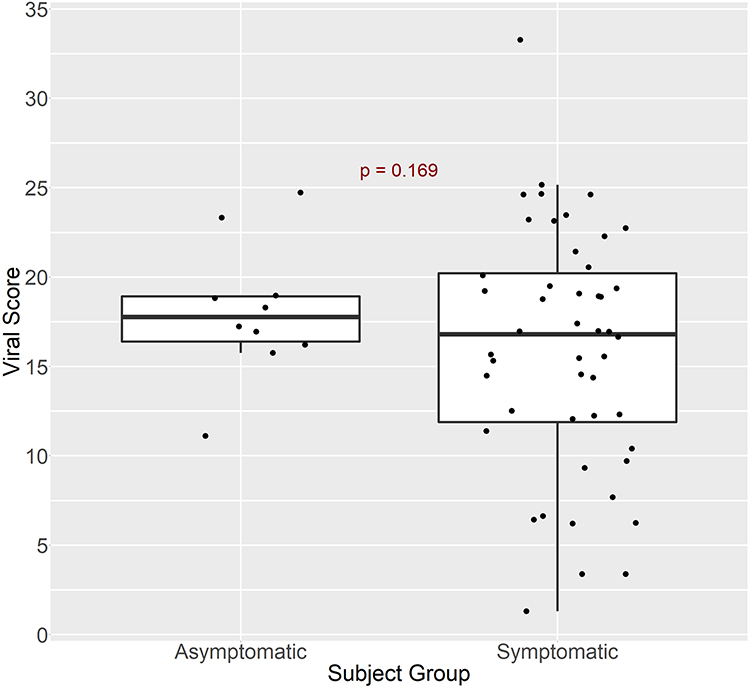 |
Figure 4 Viral Score values in saliva samples from asymptomatic and symptomatic subjects with the viral infection. P-value of the t-test is provided. |
The most frequent symptoms of COVID-19 infection were studied concerning the Viral Score values, calculated after performing the SARS-CoV-2 RNA detection. We also analyzed if there are any groups of symptoms, such as fever, cough, shortness of breath, fatigue, or digestion dysfunction, that correlate to the Viral Score values. However, the differences between the Viral Scores in the aforementioned groups were not statistically significant (Supplementary Table S2). Nonetheless, we acknowledge that the sample size is small and the statistical power of the test is low.
Discussion
Numerous studies, dedicated to examining saliva as a source for the diagnosis of infectious diseases, caused by various viruses, such as Zika, West Nile, Yellow fever, Ebola, and other hemorrhagic fever, have been reported.20 Also, saliva testing has been proven to be a suitable approach when detecting respiratory viruses, including the coronavirus SARS-CoV.21,22
Saliva sampling is a simple and non-invasive procedure, suitable for self-collection. In contrast, NP swab collection requires close contact between the healthcare worker and a patient, thus increasing the chance of viral transmission. Besides, NP swab collection is an invasive procedure that is uncomfortable and distressing for most patients.
Studies, dedicated to investigating the suitability of saliva samples to detect the SARS-CoV-2 RNR appeared rapidly after the pandemic started.7,11 Various protocols of saliva collection were suggested, varying in sample volume and preservation, followed by different techniques of isolation and detection. As a result, distinct results obtained when exploring the saliva samples for SARS-CoV-2 RNA detection were published.12–14,23,24
The main parameter, characterizing the detection method, is the agreement between the results obtained by the method under investigation and the gold standard. Regarding the saliva and NP swab comparison, most studies provide good results of agreement, sometimes termed as overall percentage agreement (OPA). The concordance between the two aforementioned methods usually exceeds 75%; however, some studies report the results close to 98%.23 Some authors report the results in terms of PPA and NPA, and the conclusions of the research often declare that viral RNA detection from saliva is an acceptable alternative to the NP swab method.14,24 The results of our study allow agreeing with the statement that NP sample testing could be replaced with saliva testing, as we obtain the NPA, PPA, and OPA values of more than 98%. This result is close to the top results, obtained comparing NP and saliva samples.23,25 Interestingly, some studies claim that the RT-PCR test performed using saliva samples could be even more sensitive in comparison to NP swab samples, which is referred to as a gold standard.26,27
To control the sample collection, purification, and analysis, internal controls are usually obligatory. Diagnolita’s SARS-CoV-2 detection assay is designed to use the RNA of the human RPP gene as an internal control. Regarding the further analysis of saliva and NP swab samples, we compared the Ct values, obtained for internal control RPP RNA. Interestingly, we obtained that RPP Ct values tend to vary less in saliva samples, thus suggesting that saliva sampling is a more consistent method. This observation is supported by another study, where similar results were found.27
Another noticeable observation of our study is that we did not find a correlation between symptoms and SARS-CoV-2 RNA Ct values, detected for infected patients. However, this result should be accepted with caution that a limited number of asymptomatic Covid-19-infected patients were registered and this could lead to a limited power of statistical analysis method. On the other hand, our conclusion is supported by another study, in which significantly larger numbers of samples were analyzed.28
Conclusion
Our work supports the suggestion that coronavirus testing from saliva is a promising tool to control the pandemic, as we obtained strong agreement between the results, collected using saliva samples and NP swab samples. Saliva sampling is a non-invasive, comfortable, and convenient method, compatible with self-collection, acceptable to most individuals, and providing a low risk of infection for medical personnel.
Disclosure
Sigitas Palikša, Mantvydas Lopeta, Jonas Belevičius, Vaida Kurmauskaitė, Ieva Ašmenavičiūtė, and Julius Gagilas are employees at JSC Diagnolita. JSC Diagnolita has developed some of the kits used in this research. The authors report no other conflicts of interest in this work.
References
1. Huang C, Wang Y, Li X, et al. Clinical features of patients infected with 2019 novel coronavirus in Wuhan, China [published correction appears in Lancet. 2020 Jan 30;:]. Lancet. 2020;395(10223):497–506. doi:10.1016/S0140-6736(20)30183-5
2. World Health Organization [homepage on the Internet]. WHO director-general‘s opening remarks at the media briefing on COVID-19 – 11 March 2020. 2020. Available from: https://www.who.int/director-general/speeches/detail/who-director-general-s-opening-remarks-at-the-media-briefing-on-covid-19---11-march-2020.
3. Worldometer [homepage on the Internet]. COVID-19 Coronavirus pandemic. 2021. Available from: https://www.worldometers.info/coronavirus/#countries.
4. World Health Organization [homepage on the Internet]. Laboratory testing for 2019 novel coronavirus (2019-nCoV) in suspected human cases. Interim guidance. 2020. Available from: https://www.who.int/publications-detail/laboratory-testing-for-2019-novel-coronavirus-in-suspected-human-cases-20200117.
5. Wang W, Xu Y, Gao R, et al. Detection of SARS-CoV-2 in different types of clinical specimens. JAMA. 2020;323(18):1843–1844. doi:10.1001/jama.2020.3786
6. Bwire GM, Majigo MV, Njiro BJ, Mawazo A. Detection profile of SARS-CoV-2 using RT-PCR in different types of clinical specimens: a systematic review and meta-analysis. J Med Virol. 2021;93(2):719–725. doi:10.1002/jmv.26349
7. To KK, Tsang OT, Yip CC, et al. Consistent detection of 2019 novel coronavirus in saliva. Clin Infect Dis. 2020;71(15):841–843. doi:10.1093/cid/ciaa149
8. González-González E, Lara-Mayorga IM, Rodríguez-Sánchez IP, et al. Colorimetric loop-mediated isothermal amplification (LAMP) for cost-effective and quantitative detection of SARS-CoV-2: the change in color in LAMP-based assays quantitatively correlates with viral copy number. Anal Methods. 2021;13(2):169–178. doi:10.1039/D0AY01658F
9. Meza-Robles C, Barajas-Saucedo CE, Tiburcio-Jimenez D, et al. One-step nested RT-PCR for COVID-19 detection: a flexible, locally developed test for SARS-CoV2 nucleic acid detection. J Infect Dev Ctries. 2020;14(7):679–684. doi:10.3855/jidc.12726
10. Pereira-Gómez M, Fajardo Á, Echeverría N, et al. Evaluation of SYBR green real time PCR for detecting SARS-CoV-2 from clinical samples. J Virol Methods. 2021;289:114035. doi:10.1016/j.jviromet.2020.114035
11. Chan JF, Yip CC, To KK, et al. Improved molecular diagnosis of COVID-19 by the novel, highly sensitive and specific COVID-19-RdRp/Hel real-time reverse transcription-PCR assay validated in vitro and with clinical specimens. J Clin Microbiol. 2020;58(5):e00310–e00320. doi:10.1128/JCM.00310-20
12. Nasiri K, Dimitrova A. Comparing saliva and nasopharyngeal swab specimens in the detection of COVID-19: a systematic review and meta-analysis. J Dent Sci. 2021;16(3):799–805. doi:10.1016/j.jds.2021.01.010
13. Bastos ML, Perlman-Arrow S, Menzies D, Campbell JR. The sensitivity and costs of testing for SARS-CoV-2 infection with saliva versus nasopharyngeal swabs: a systematic review and meta-analysis [published correction appears in Ann Intern Med. 2021 Apr;174(4):584]. Ann Intern Med. 2021;174(4):501–510. doi:10.7326/M20-6569
14. Butler-Laporte G, Lawandi A, Schiller I, et al. Comparison of saliva and nasopharyngeal swab nucleic acid amplification testing for detection of SARS-CoV-2: a systematic review and meta-analysis [published correction appears in doi: 10.1001/jamainternmed.2021.0245]. JAMA Intern Med. 2021;181(3):353–360. doi:10.1001/jamainternmed.2020.8876
15. Rutgers Today. New Rutgers saliva test for coronavirus gets FDA approval. 2020. Available from: https://www.rutgers.edu/news/new-rutgers-saliva-test-coronavirus-gets-fda-approval.
16. U.S. Food and Drug Administration [Letter]. 2020. Available from: https://www.fda.gov/media/137088/download.
17. U.S. Food and Drug Administration. In vitro diagnostics EUAs – molecular diagnostic tests for SARS-CoV-2. 2021. Available from: https://www.fda.gov/medical-devices/coronavirus-disease-2019-covid-19-emergency-use-authorizations-medical-devices/in-vitro-diagnostics-euas-molecular-diagnostic-tests-sars-cov-2#individual-molecular.
18. Xu J, Li Y, Gan F, Du Y, Yao Y. Salivary glands: potential reservoirs for COVID-19 asymptomatic infection. J Dent Res. 2020;99(8):989. doi:10.1177/0022034520918518
19. To KK, Tsang OT, Leung WS, et al. Temporal profiles of viral load in posterior oropharyngeal saliva samples and serum antibody responses during infection by SARS-CoV-2: an observational cohort study. Lancet Infect Dis. 2020;20(5):565–574. doi:10.1016/S1473-3099(20)30196-1
20. Niedrig M, Patel P, El Wahed AA, Schädler R, Yactayo S. Find the right sample: a study on the versatility of saliva and urine samples for the diagnosis of emerging viruses. BMC Infect Dis. 2018;18(1):707. doi:10.1186/s12879-018-3611-x
21. To KK, Lu L, Yip CC, et al. Additional molecular testing of saliva specimens improves the detection of respiratory viruses. Emerg Microbes Infect. 2017;6(1):e49. doi:10.1038/emi.2017.35
22. Wang WK, Chen SY, Liu IJ, et al. Detection of SARS-associated coronavirus in throat wash and saliva in early diagnosis. Emerg Infect Dis. 2004;10(7):1213–1219. doi:10.3201/eid1007.031113
23. Herrera LA, Hidalgo-Miranda A, Reynoso-Noverón N, et al. Saliva is a reliable and accessible source for the detection of SARS-CoV-2. Int J Infect Dis. 2021;105:83–90. doi:10.1016/j.ijid.2021.02.009
24. Czumbel LM, Kiss S, Farkas N, et al. Saliva as a candidate for COVID-19 diagnostic testing: a meta-analysis. Front Med. 2020;7:465. doi:10.3389/fmed.2020.00465
25. Huber M, Schreiber PW, Scheier T, et al. High efficacy of saliva in detecting SARS-CoV-2 by RT-PCR in adults and children. Microorganisms. 2021;9(3):642. doi:10.3390/microorganisms9030642
26. Teo AKJ, Choudhury Y, Tan IB, et al. Saliva is more sensitive than nasopharyngeal or nasal swabs for diagnosis of asymptomatic and mild COVID-19 infection. Sci Rep. 2021;11(1):3134. doi:10.1038/s41598-021-82787-z
27. Wyllie AL, Fournier J, Casanovas-Massana A, et al. Saliva or nasopharyngeal swab specimens for detection of SARS-CoV-2. N Engl J Med. 2020;383(13):1283–1286. doi:10.1056/NEJMc2016359
28. Bhatta A, Henkhaus R, Fehling HL. Comparison of SARS-CoV-2 viral load in saliva samples in symptomatic and asymptomatic cases. medRxiv. 2021. doi:10.1101/2021.02.12.21251229
 © 2021 The Author(s). This work is published and licensed by Dove Medical Press Limited. The
full terms of this license are available at https://www.dovepress.com/terms
and incorporate the Creative Commons Attribution
- Non Commercial (unported, 3.0) License.
By accessing the work you hereby accept the Terms. Non-commercial uses of the work are permitted
without any further permission from Dove Medical Press Limited, provided the work is properly
attributed. For permission for commercial use of this work, please see paragraphs 4.2 and 5 of our Terms.
© 2021 The Author(s). This work is published and licensed by Dove Medical Press Limited. The
full terms of this license are available at https://www.dovepress.com/terms
and incorporate the Creative Commons Attribution
- Non Commercial (unported, 3.0) License.
By accessing the work you hereby accept the Terms. Non-commercial uses of the work are permitted
without any further permission from Dove Medical Press Limited, provided the work is properly
attributed. For permission for commercial use of this work, please see paragraphs 4.2 and 5 of our Terms.