Back to Journals » Journal of Multidisciplinary Healthcare » Volume 18
Relative Fat Mass and Psoriasis Risk: Evidence from NHANES 2009–2014
Received 4 April 2025
Accepted for publication 24 July 2025
Published 29 July 2025 Volume 2025:18 Pages 4365—4376
DOI https://doi.org/10.2147/JMDH.S532383
Checked for plagiarism Yes
Review by Single anonymous peer review
Peer reviewer comments 2
Editor who approved publication: Professor Charles V Pollack
Tianming Ma,1 Xiaoqing Xiang,2 Guijun Liu3
1The Second Affiliated Hospital of Heilongjiang University of Chinese Medicine, Harbin City, Heilongjiang Province, People’s Republic of China; 2Heilongjiang University of Chinese Medicine, Harbin City, Heilongjiang Province, People’s Republic of China; 3The Fourth Affiliated Hospital of Heilongjiang University of Chinese Medicine, Harbin City, Heilongjiang Province, People’s Republic of China
Correspondence: Guijun Liu, The Fourth Affiliated Hospital of Heilongjiang University of Chinese Medicine, Harbin City, Heilongjiang Province, 150077, People’s Republic of China, Tel +86 13836002768, Email [email protected]
Objective: This study aims to investigate the relationship between Relative Fat Mass (RFM) and the risk of psoriasis based on data from the US National Health and Nutrition Examination Survey (NHANES) from 2009 to 2014.
Methods: This cross-sectional study included 19,565 adults aged 20 years and older. Psoriasis diagnosis was determined using self-reported questionnaires, and RFM was calculated based on established formulas. Multivariable logistic regression models were used to analyze the association between RFM and psoriasis risk, adjusting for covariates such as age, gender, race, socioeconomic factors, and health behaviors. Nonlinear relationships and potential threshold effects between RFM and psoriasis were assessed using restricted cubic splines.
Results: The analysis revealed a significant positive association between RFM and psoriasis risk. Each 1-unit increase in RFM was associated with a 3% higher likelihood of psoriasis (OR=1.03, 95% CI: 1.02– 1.05, P< 0.05). The restricted cubic spline analysis showed a nonlinear relationship between RFM and psoriasis risk (P_non-linear=0.028). Subgroup analysis further demonstrated that income level (with lower associations observed among those with a poverty-to-income ratio ≤ 1.3) moderated the relationship. RFM exhibited moderate predictive performance for psoriasis risk, with an area under the receiver operating characteristic curve (AUC) of 0.549.
Conclusion: RFM is significantly associated with increased psoriasis risk, with a dose-response relationship observed. These findings suggest that RFM may serve as a useful predictor for psoriasis risk and could be incorporated into screening strategies for early detection and prevention.
Keywords: relative fat mass, psoriasis, NHANES, obesity, cross-sectional study
Introduction
Psoriasis is a chronic, inflammatory, systemic immune-mediated skin disease, typically characterized by scattered erythematous plaques covered with silvery-white scales and accompanied by intense pruritus.1 In addition to causing significant physical discomfort, psoriasis imposes a substantial psychological burden on affected individuals. The incidence of psoriasis has been increasing annually, while its pathogenesis remains unclear. The development of the disease may be associated with multiple factors, including genetic background, immune system function, infections, endocrine changes, psychosocial stress, daily lifestyle habits, medication use, and environmental influences.2 Current medical studies suggest that psoriasis is primarily driven by abnormal activation of T cells and is closely associated with inflammatory cytokines such as tumor necrosis factor-alpha (TNF-α), interleukin (IL)-23, and IL-17.3
Obesity has been confirmed as a significant risk factor for psoriasis in numerous studies. Its influence is reflected not only in the incidence of the disease but also in its severity. Studies have shown that both the prevalence and severity of psoriasis are significantly higher in obese individuals compared to those with normal weight.4 Among various obesity patterns, abdominal obesity is considered a specific risk factor for psoriasis. Research has demonstrated a dose-dependent relationship between waist circumference and psoriasis risk, further highlighting the role of abdominal obesity in the pathogenesis of psoriasis and its associated comorbidities.5 Body Mass Index (BMI), defined as ≥30 kg/m² for obesity, is currently the most commonly used indicator for assessing obesity, characterized by persistent metabolic dysregulation, excessive fat accumulation, and metabolic abnormalities.6 The role of BMI as an important indicator for assessing psoriasis risk has been confirmed in multiple studies. A multicenter study based on bidirectional Mendelian randomization and regression analysis found a significant causal relationship between BMI and psoriasis severity. Specifically, for each unit increase in BMI, the Psoriasis Area and Severity Index (PASI), Body Surface Area (BSA), and Dermatology Life Quality Index (DLQI) all showed upward trends.7 A prospective study among American women revealed that women with a BMI of 30.0–34.9 had a 63% increased risk of developing psoriasis compared to those with a BMI less than 25, while those with a BMI ≥35 had a 103% increased risk.8 In addition to BMI, abdominal obesity has also been confirmed to be closely associated with psoriasis. A nationwide population-based study reported that individuals with a waist circumference over 105 cm had a significantly higher risk of psoriasis compared to those with a waist circumference below 80/75 cm; this association remained even after adjusting for confounding factors such as BMI.5
Although BMI is widely used for obesity assessment, it has significant limitations in clinical practice. BMI cannot distinguish between subcutaneous and visceral fat, the latter of which plays a more critical role in metabolic diseases, insulin resistance, and mortality risk. Studies have shown that even within the normal BMI range, excessive accumulation of visceral fat can substantially increase the risk of related diseases.9 Given the limitations of BMI, researchers have proposed novel indicators that better reflect fat distribution and metabolic risk, such as the Body Roundness Index (BRI). BRI has demonstrated greater advantages over BMI in assessing individual fat distribution and the risk of related diseases.10 Existing studies have indicated that elevated BRI levels are closely associated with metabolic syndrome,11 osteoarthritis,12 cardiovascular disease,13 and depression,14 making it an emerging tool for health risk assessment. Although the direct relationship between BRI and psoriasis remains unclear, current evidence suggests that BRI may be linked to various inflammatory diseases. Therefore, investigating the potential role of BRI in psoriasis holds significant research value. Based on this rationale, the present study is the first to conduct a cross-sectional analysis using data from the National Health and Nutrition Examination Survey (NHANES) to explore the association between BRI and psoriasis. The findings aim to further elucidate the potential link between obesity phenotypes and psoriasis risk, providing scientific evidence and practical guidance for the prevention and management of psoriasis.
Methods
Study Design and Population
The National Health and Nutrition Examination Survey (NHANES) is a nationwide survey designed to collect comprehensive data on the nutritional and health status of the US population. This survey is conducted biennially using a cross-sectional study design and implemented based on a complex, multistage probability sampling method. This study utilized publicly available NHANES datasets, which were collected in accordance with ethical guidelines and obtained informed consent from all participants. The study design and relevant data are accessible on the public platform (www.cdc.gov/nchs/nhanes/). All methods in this study strictly adhered to ethical standards and regulations. This study analyzed NHANES datasets from the periods 2003–2006 and 2009–2014, with an initial sample size of 50,938 participants. Based on the study design and data requirements, the following exclusions were applied: 25,191 participants were excluded due to being under 20 years old, pregnant, or lacking survey weight data. 3,267 participants were excluded due to missing psoriasis data. 1,242 participants were excluded due to the inability to calculate RFM. 1,673 participants were excluded due to missing covariate data. Ultimately, a total of 19,565 eligible participants were included in the final analysis (Figure 1).
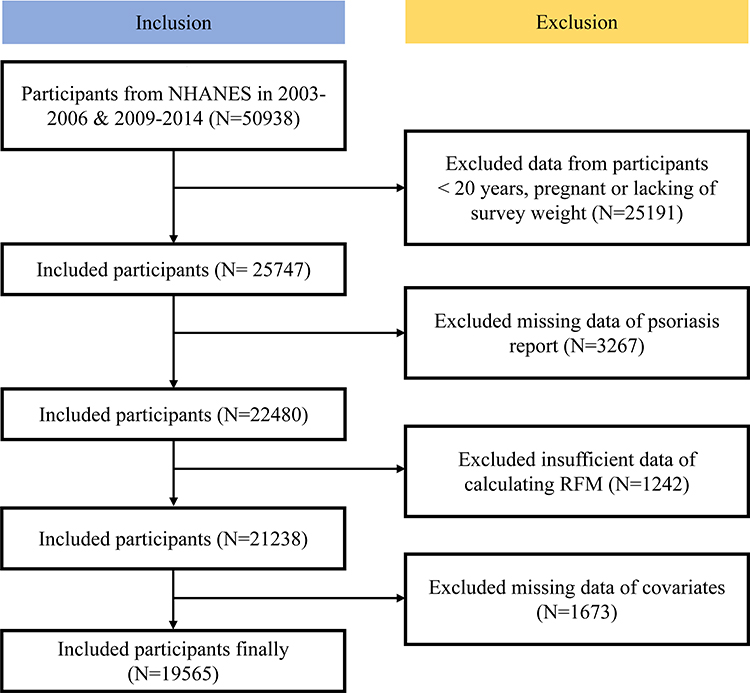 |
Figure 1 Participant Flowchart of Study Inclusion (NHANES 2003–2014). This study utilized data from the National Health and Nutrition Examination Survey (NHANES) 2003–2006 and 2009–2014 cycles. From an initial pool of 50,938 participants, stepwise exclusions (age <20 years, pregnancy, missing key variables) yielded a final analytical cohort of 19,565 eligible participants. The flowchart details sequential inclusion/exclusion criteria and attrition causes. Notes: Rectangular boxes: Represent screening stages. Inclusion steps: Current retained participants. Exclusion steps: Number removed and specific reason. Directional arrows: Indicate sequential flow (top to bottom). |
Psoriasis Diagnosis Results
The diagnosis of psoriasis relies on questionnaires in the dermatology section or in the medical conditions section: “Have you ever been told by a doctor or other health care professional that you had psoriasis?” “Yes” stands for patients with psoriasis. The diagnosis of arthropathic psoriasis was made as psoriasis with a history of arthritis. Psoriasis severity was assessed according to the following questionnaires: “Is Psoriasis little or extensive? or Degree of Psoriasis.” The severity of psoriasis was evaluated according to the body surface area (BSA) scoring method.15
RFM Measurement
Physical measurements, including waist circumference and body weight, were performed by trained health technicians under standardized conditions at a mobile examination center (MEC). These measurements were utilized to calculate the RFM for each participant, with values rounded to two decimal places to ensure consistency. In the analysis, RFM was treated as a continuous variable to maintain statistical accuracy. The RFM value was computed using a formula that integrates waist circumference, height, and sex: RFM = 64 - (20 × height / waist) + (12 × sex), where sex = 1 for females and 0 for males.16 This methodology enabled precise quantification of body fat and established RFM as a primary exposure variable in the study, providing a reliable basis for subsequent analyses.
Covariates
This study utilized questionnaire and physical examination data collected by interviewers from the NHANES database, including demographic information (age, sex, race/ethnicity, poverty-income ratio (PIR), education level, and marital status) and behavioral factors (smoking and alcohol consumption). Race/ethnicity categories were self-reported and classified as Mexican American, non-Hispanic White, non-Hispanic Black, and other races (including multiracial individuals). Education level was categorized as below high school, high school graduate, and above high school. Marital status was classified as married/cohabiting, widowed/divorced/separated, and never married. Smoking status was assessed through a questionnaire, first asking, “Have you ever smoked more than 100 cigarettes?” If the response was “No” the individual was classified as a never smoker. If the response was “Yes” a follow-up question was asked: “Are you still smoking?” Those who answered “Quit smoking” were classified as former smokers, while those who answered “Still smoking” were classified as current smokers. Alcohol consumption was assessed using a questionnaire based on the question, “Do you drink alcohol at least 12 times per year?” A single drinking instance was defined as consuming 12 ounces of beer, 4 ounces of wine, or 1 ounce of distilled spirits. Body mass index (BMI) data were obtained from NHANES physical examination records and calculated based on height (H, m) and weight (W, kg) using the formula BMI = W/H². BMI was classified according to standards applicable to the US population: underweight (<18.5 kg/m²), normal weight (18.5–24.9 kg/m²), overweight (25–29.9 kg/m²), and obese (≥30.0 kg/m²).
Statistical Analysis
Weighted statistical analyses were conducted for each participant based on the complex, multistage cluster sampling design of NHANES. The chi-square test was used to assess differences between groups for categorical variables, while analysis of variance (ANOVA) was applied to compare continuous variables. To explore the association between RFM and psoriasis-like conditions, a multivariable logistic regression model was constructed with three models: Model I was unadjusted for covariates. Model II was adjusted for age, sex, and race/ethnicity. Model III was further adjusted for marital status, education level, poverty-income ratio (PIR), smoking status, alcohol consumption, hypertension, cardiovascular disease, and history of diabetes. To evaluate the potential interaction effects of RFM with categorical variables (eg, sex and age) on psoriasis progression, subgroup analyses were conducted by stratifying the study population based on sex, age, and other key variables. A smooth curve fitting analysis was performed to examine the nonlinear relationship between RFM and psoriasis, and a two-piece linear regression model was used to investigate potential threshold effects. Additionally, the predictive ability of RFM for psoriasis was assessed using the receiver operating characteristic (ROC) curve and the area under the curve (AUC). All models were adjusted for the aforementioned covariates, and statistical analyses were conducted using R software (version 4.3.0), with sampling weights applied to account for the survey design. A p-value <0.05 was considered statistically significant.
Results
Characteristics of Study Objects
Table 1 presents the differences in characteristics between psoriasis patients and non-psoriasis individuals. A total of 19,565 participants were included in this study, of whom 2.8% (541 individuals) had psoriasis. Compared to the non-psoriasis group, psoriasis patients were older, with 50.3% aged 40–59 years and 18.5% aged ≥60 years (P = 0.002). In terms of racial distribution, non-Hispanic Whites accounted for the highest proportion among psoriasis patients (81.7%), while non-Hispanic Blacks (6.1%) and Mexican Americans (3.8%) had lower proportions (P < 0.001). Regarding health conditions, psoriasis patients had a higher prevalence of hypertension (38.2%, P < 0.001) and a higher RFM (36.02 ± 8.30, P < 0.001). Analysis of smoking status showed that the proportion of former smokers was higher among psoriasis patients (35.8%, P < 0.001), although the proportion of current smokers was similar to that of the non-psoriasis group. Additionally, there were no significant differences between psoriasis patients and non-psoriasis individuals in terms of education level, marital status, poverty-income ratio (PIR), and alcohol consumption (P > 0.05). In summary, these findings suggest that psoriasis may be associated with older age, specific racial groups, hypertension, and higher RFM levels.
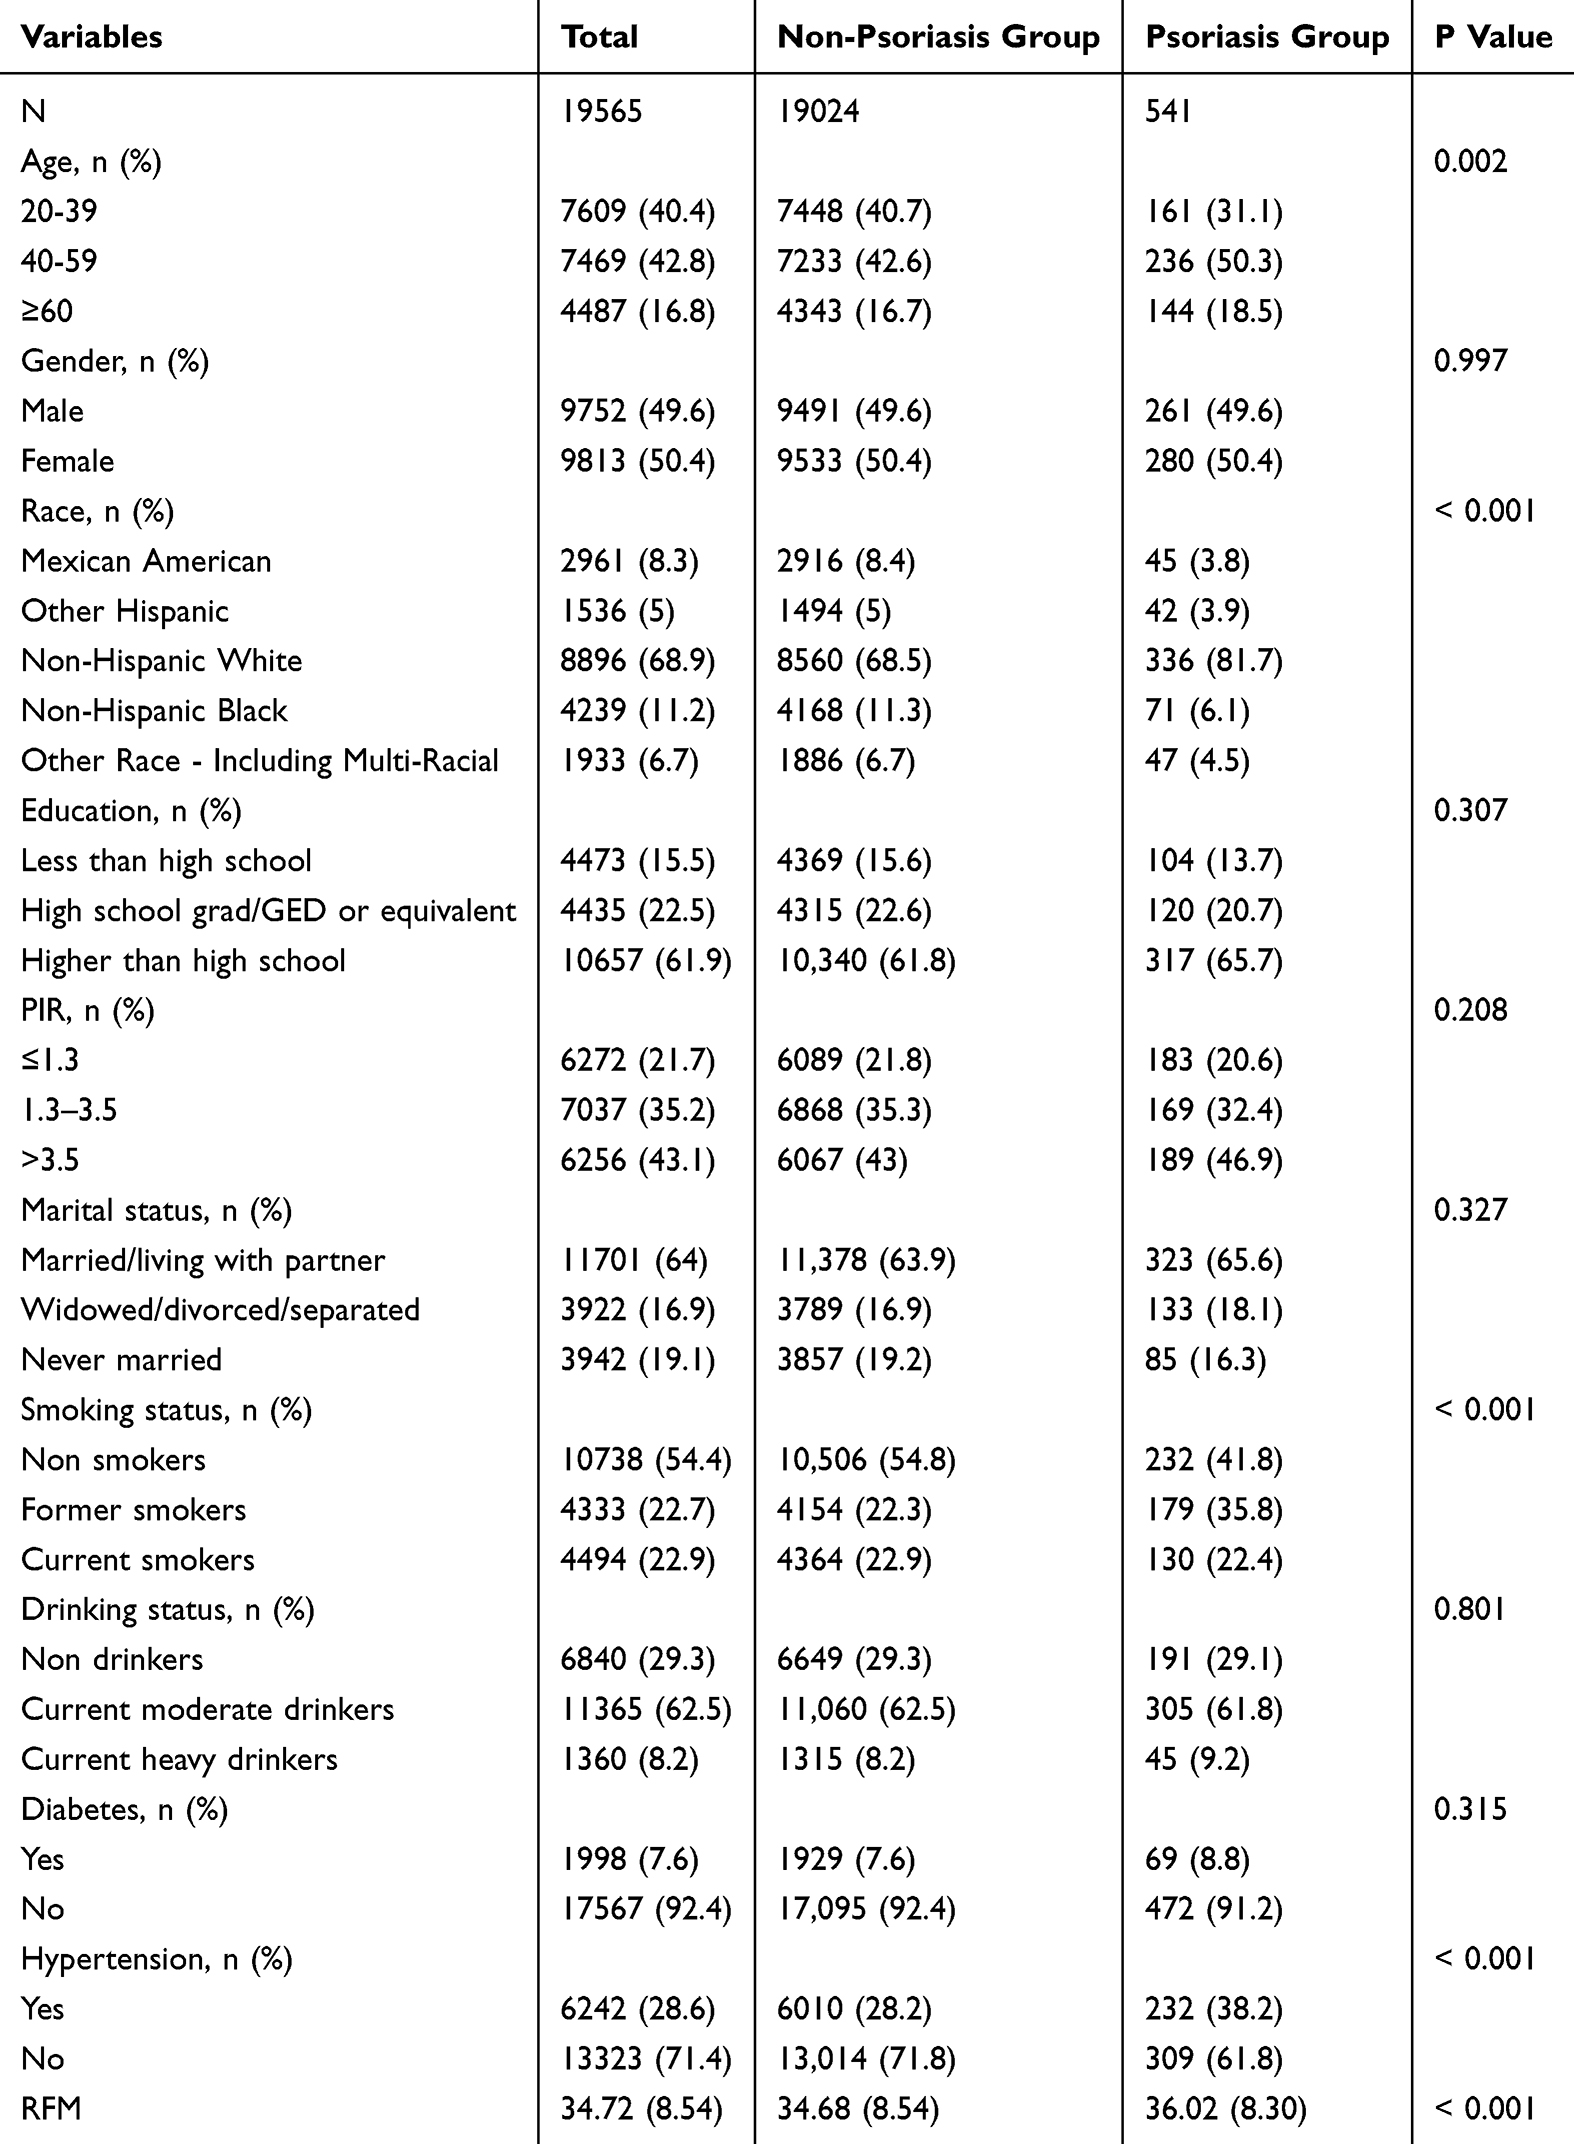 |
Table 1 Characteristics of Participants Grouped by Psoriasis in NHANES 1999–2020 |
Association Between Relative Fat Mass (RFM) and Psoriasis Risk
Table 2 summarizes the association between RFM and psoriasis risk across different models. In Model 1, which was unadjusted for covariates, each one-unit increase in RFM as a continuous variable was associated with a 2% increase in psoriasis risk (OR = 1.02, 95% CI 1.01–1.03, P < 0.001). Compared to the Q1 group, the odds ratios (OR) for the Q2 and Q4 groups were 1.45 (95% CI 1.08–1.94, P = 0.013) and 1.54 (95% CI 1.22–1.95, P < 0.001), respectively, showing a significant trend (P for trend = 0.005). In Model 2, which was adjusted for age, sex, race/ethnicity, education level, poverty-income ratio (PIR), and marital status, the OR for RFM as a continuous variable increased to 1.04 (95% CI 1.02–1.06, P < 0.001). The ORs for the Q2 and Q4 groups were 1.49 (95% CI 1.10–2.01, P = 0.01) and 2.09 (95% CI 1.38–3.17, P < 0.001), further supporting the association between higher RFM and increased psoriasis risk (P for trend = 0.001). In Model 3, which was fully adjusted for all covariates, including smoking status, alcohol consumption, diabetes, and hypertension, the OR for RFM as a continuous variable was 1.03 (95% CI 1.02–1.05, P = 0.002). The ORs for the Q2 and Q4 groups were 1.38 (95% CI 1.03–1.86, P = 0.033) and 1.77 (95% CI 1.11–2.81, P = 0.016), respectively. Despite adjustments for multiple potential confounders, the positive correlation between RFM and psoriasis risk remained significant, with P for trend still showing significance (P = 0.028). These findings suggest that higher RFM may be associated with an increased risk of psoriasis, particularly in unadjusted and partially adjusted models.
 |
Table 2 The Associations of RFM and Psoriasis in Weighted Logistic Regression Models |
The Associations Between BRI and Psoriasis Syndrome Stages in RCS Regression Model
Dose-Response Relationship Analysis indicates a significant association between RFM and the risk of psoriasis (Figure 2). Specifically, RFM and psoriasis exhibit a nonlinear relationship, with the overall P-value (P_overall < 0.05) and the nonlinear P-value (P_non-linear = 0.080) supporting this trend. Furthermore, as RFM increases, the risk of psoriasis progressively rises, further emphasizing the potential role of RFM as a risk factor.
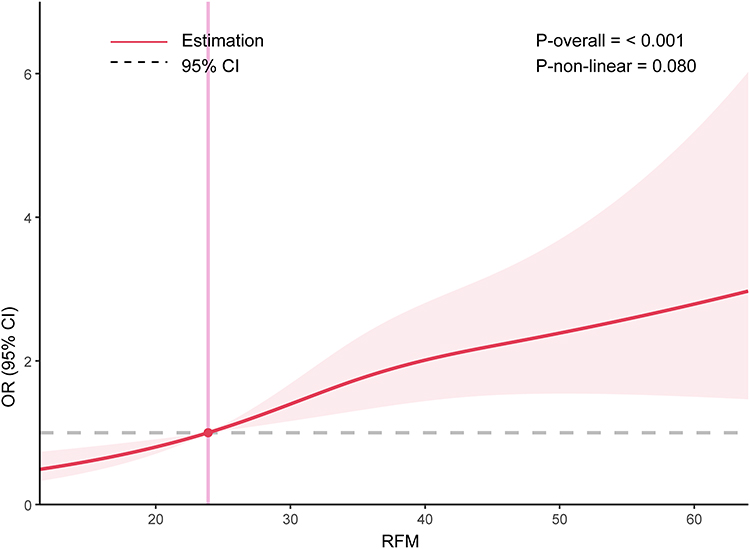 |
Figure 2 Restricted cubic spline (RCS) curve of the association between relative fat mass (RFM) and psoriasis among all participants. The red solid line indicates the estimated odds ratios (ORs) for psoriasis across the spectrum of RFM, with the red shaded area representing the 95% confidence intervals (CIs). The gray dashed horizontal line represents the null value (OR = 1.0), and the vertical pink line marks the reference RFM value. The association between RFM and psoriasis was statistically significant overall (P-overall < 0.001), with a marginally significant non-linear trend (P-non-linear = 0.080). Notes: Red solid line: Estimated odds ratio (OR), Red shaded area: 95% confidence interval, Gray dashed line: Reference line (OR = 1.0), Pink vertical line: Reference or median RFM value. |
Subgroup Analysis
To assess the robustness of the positive correlation between RFM and the risk of psoriasis, this study conducted a stratified analysis based on sociodemographic characteristics and health status, evaluating the association within each subgroup (see Figure 3). The results of the subgroup analysis showed that in most categorical characteristics, the association between RFM and psoriasis risk remained significant, indicating the stability of this relationship across different populations. However, a significant interaction was observed in the income level subgroup (P for interaction = 0.031), suggesting that economic status may modulate this association. Specifically, among individuals with a PIR of 1.3–3.5, the association between RFM and psoriasis risk was most pronounced (OR = 1.04, 95% CI 1.01–1.08), whereas in those with PIR ≤1.3, the association was weaker (OR = 1.01, 95% CI 0.98–1.05). Furthermore, although the P-values for interaction did not reach significance in other subgroups (such as age, sex, race, education level, marital status, smoking status, alcohol consumption, diabetes, and hypertension), the positive correlation between RFM and psoriasis risk remained consistent, further supporting the robustness of this association across different populations. In conclusion, the findings of this study further confirm the positive correlation between RFM and psoriasis risk and suggest that income level may be an important moderating factor influencing this association.
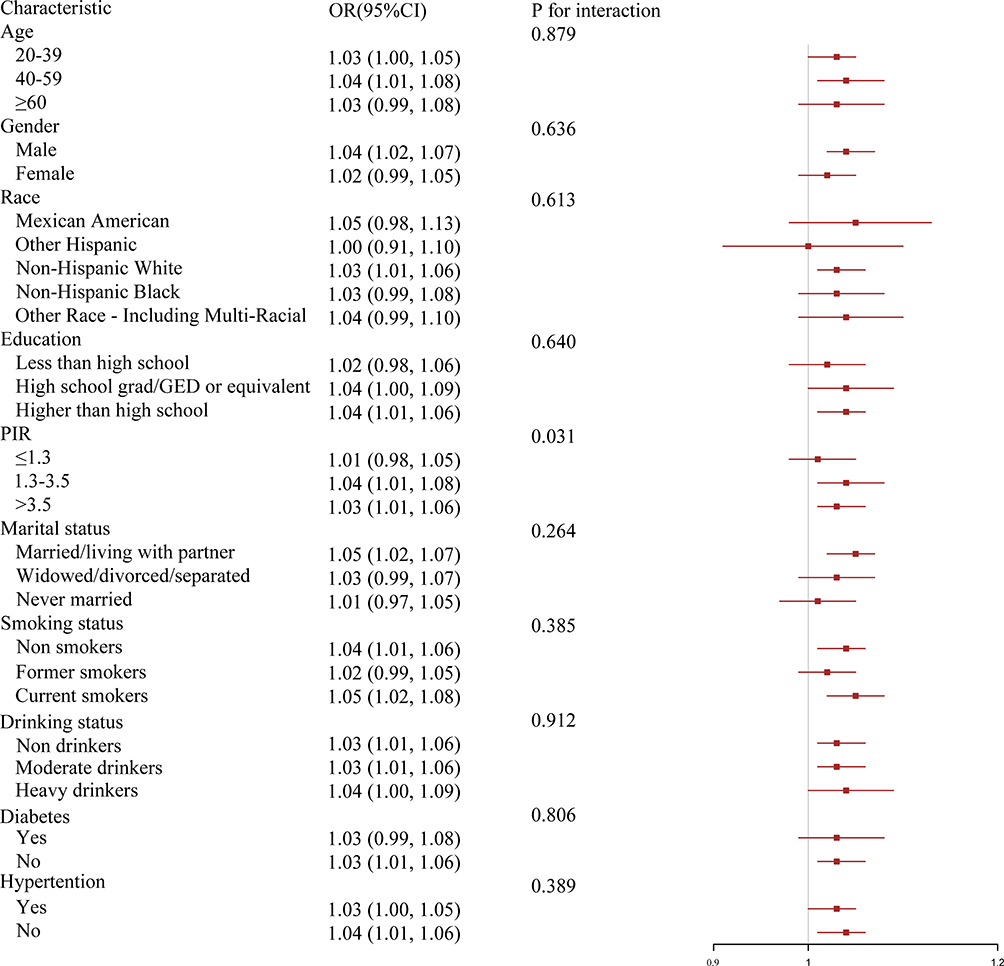 |
Figure 3 Subgroup analyses of the associations between relative fat mass (RFM) and psoriasis. This forest plot displays the odds ratios (ORs) and 95% confidence intervals (CIs) for the association between RFM and psoriasis across different subgroups. Subgroups include age, gender, race, education, poverty income ratio (PIR), marital status, smoking status, drinking status, diabetes, and hypertension. P values for interaction were calculated to assess effect modification. A statistically significant interaction was observed for PIR (P = 0.031), suggesting heterogeneity in the association across PIR levels. Notes: Red squares: Point estimates of ORs for each subgroup, Horizontal red lines: 95% confidence intervals, Vertical gray line: Reference line at OR = 1.0, P for interaction: Indicates whether the association between RFM and psoriasis differs significantly across subgroup levels. |
Predictive Value of RFM on Psoriasis
We evaluated the predictive performance of BRI for psoriasis risk using ROC curve analysis. The results showed that the AUC was 0.549 (Figure 4), indicating limited standalone discriminative capacity. Although the AUC suggests suboptimal predictive power (AUC < 0.7), the observed association between BRI and psoriasis risk highlights its potential role as a complementary marker within multi-parameter risk assessment models.
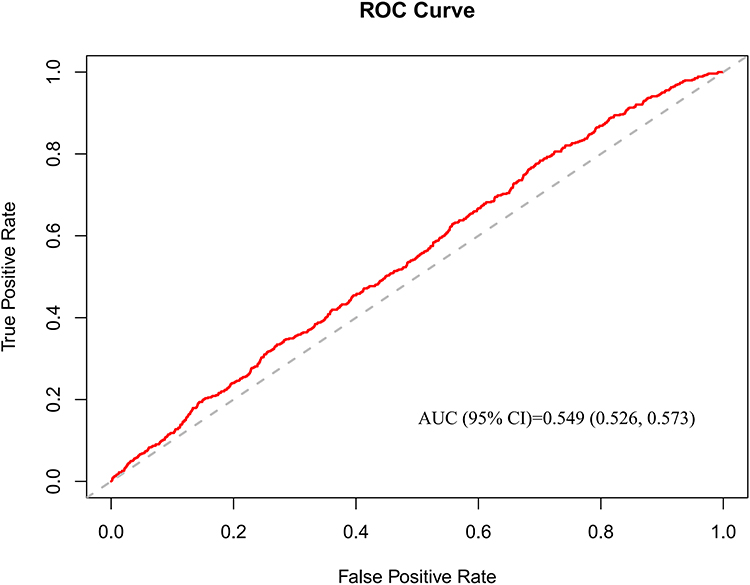 |
Figure 4 Receiver operating characteristic (ROC) curve evaluating the predictive performance of RFM for psoriasis. The ROC curve (red line) illustrates the trade-off between sensitivity and specificity of RFM in predicting psoriasis. The area under the curve (AUC) was 0.549 (95% CI: 0.526–0.573), indicating poor discriminatory ability. The gray dashed diagonal line represents a non-informative classifier (AUC = 0.5). Notes: Red line: ROC curve of RFM predicting psoriasis, Gray dashed line: Reference line (AUC = 0.5, no discrimination), AUC: 0.549 (95% CI: 0.526–0.573). |
Discussion
This study, based on the NHANES database from 2009 to 2014, representatively reflects the adult population in the United States. The results indicate that higher RFM levels are significantly associated with an increased prevalence of psoriasis, and this association remains significant even after adjusting for partial and full covariates. While these findings support the potential utility of RFM in identifying individuals with a higher likelihood of psoriasis, it is important to emphasize that, due to the cross-sectional nature of the data, causal relationships cannot be established. Therefore, interpretations should remain cautious, and further prospective studies are warranted to validate these associations.
A growing body of evidence has shown a bidirectional relationship between obesity and psoriasis. Obesity increases the prevalence and severity of psoriasis, while psoriasis patients are also more prone to obesity.17 This may be largely attributed to a shared chronic low-grade inflammatory state. A large cohort study conducted in Taiwan demonstrated a significant association between obesity and psoriasis, with individuals having a BMI ≥30 showing a 2.7-fold higher risk of psoriasis compared to those with normal BMI, while metabolic conditions such as diabetes, dyslipidemia, and hypertension were not significantly associated.18 These findings are consistent with our study and further highlight obesity as a key factor in psoriasis pathogenesis. RFM, as a relatively novel adiposity measure based on waist circumference and height, has shown better performance in estimating body fat percentage than BMI.19 It has been widely applied in studies exploring the relationship between obesity and diseases such as gallstones, infertility, and hyperuricemia,20–22 and has demonstrated superior predictive performance for conditions like diabetes, hypertension, and cardiovascular diseases (with higher AUCs compared to BMI).23–25 Although research on the association between RFM and psoriasis is still limited, RFM’s established value in other chronic conditions suggests its potential utility in evaluating obesity-related skin diseases such as psoriasis.26,27
Studies have demonstrated that in obese individuals, adipocyte hypertrophy leads to tissue hypoxia and cellular stress, which trigger macrophage infiltration and the release of pro-inflammatory cytokines including TNF-α, IL-6, and IL-17.28 These cytokines circulate to the skin and promote the activation of dendritic cells and Th17 cells, resulting in keratinocyte hyperproliferation—a hallmark of psoriatic lesions.29 Leptin, a pro-inflammatory adipokine elevated in obesity, promotes Th17 differentiation via the STAT3 pathway, while levels of anti-inflammatory adiponectin are markedly reduced.30 This hormonal imbalance aggravates psoriatic inflammation. Clinical studies have reported a positive correlation between serum leptin levels and PASI scores in psoriasis patients (r = 0.42), suggesting that leptin may be associated with disease severity.31 Additionally, insulin resistance in obesity can activate the mTOR pathway, promoting keratinocyte proliferation,31 while hyperinsulinemia may impair Foxp3+ Treg cell function, compromising immune tolerance and exacerbating psoriatic inflammation.32
Our subgroup analysis of PIR revealed a significant interaction (P for interaction = 0.031), suggesting that economic status may modulate the association between RFM and psoriasis. Individuals with lower income levels often consume high-calorie, low-nutrient diets,33 have limited access to healthcare,34 and are more likely to experience chronic stress, sedentary lifestyles, and environmental risk factors (eg, air pollution), all of which contribute to both obesity and systemic inflammation.35 Moreover, psychological disorders such as depression and anxiety, which are more prevalent in low-income populations, are independently associated with both obesity and psoriasis.36 These socioeconomic disparities may help explain the heterogeneity of RFM–psoriasis associations observed across subgroups.
In this cross-sectional study, we identified a nonlinear positive correlation between RFM and psoriasis. The association was particularly evident when RFM ranged between 30 and 43, and remained robust across different strata, including sex, age, race, PIR, family history of psoriasis, and smoking exposure. Notably, the association was more pronounced in participants with active psoriasis than those with past (remitted) psoriasis, suggesting that adiposity may contribute not only to disease development but also to its persistence. Compared with BMI, RFM incorporates both height and waist circumference and more accurately reflects central obesity, which has been shown to be more strongly associated with psoriasis than general obesity.37–40 Other central obesity measures, including WC and WHR, have also been linked to psoriasis risk,41 but RFM may provide a more individualized and precise assessment by accounting for sex-specific differences in fat distribution.42
RFM has the advantage of simplicity, requiring only waist and height measurements, making it feasible for large-scale screening. Studies have shown that RFM can better detect individuals with central obesity who may be overlooked by BMI.43 Therefore, while our findings suggest that RFM may serve as a useful tool for identifying individuals at higher likelihood of psoriasis, its modest discriminative ability in this study (AUC = 0.549) limits its utility as a standalone screening measure. Further work is needed to establish appropriate RFM thresholds and assess its integration with other clinical indicators.44 Although our study suggests that individuals with RFM above a certain threshold (eg, 34.08) may have a higher likelihood of psoriasis, the modest effect sizes (eg, odds ratios close to 1) raise questions about clinical relevance. The threshold effect observed may help guide targeted lifestyle interventions aimed at central obesity, which could contribute to broader benefits, including inflammation reduction and improved skin health.17,45 Incorporating RFM into public health surveillance and education could enhance awareness of the obesity–psoriasis link and facilitate early intervention in high-risk populations.46,47
This study has several notable limitations. First, due to its cross-sectional design, causality cannot be established. Although a significant association was observed between RFM and psoriasis, it remains unclear whether higher RFM contributes to psoriasis onset, whether psoriasis leads to increased RFM, or whether unmeasured confounders are involved. Second, while the total sample size was large (n = 19,565), some subgroup analyses—such as the PIR ≤ 1.3 group—may have had limited sample sizes, potentially affecting the stability and reliability of those results. Additionally, self-reported variables such as diet, physical activity, and income are subject to recall and reporting bias. The low AUC value also indicates that RFM alone has limited predictive performance for psoriasis and should not be used in isolation for clinical decisions. Finally, since NHANES is based on US data, the generalizability to other populations and healthcare systems remains to be validated.
In conclusion, this study identified a significant positive association between RFM and the prevalence of psoriasis, particularly among individuals with higher levels of central adiposity. However, given the cross-sectional nature of the NHANES data, no temporal or causal relationships can be established. Moreover, the predictive performance of RFM observed in this study was modest (AUC = 0.549), suggesting that RFM should be considered a supplementary, rather than standalone, risk indicator for psoriasis. At present, there is a lack of prospective validation, as no follow-up data confirm whether individuals with high RFM are more likely to develop psoriasis over time. Therefore, future longitudinal studies are essential to determine the causal direction of this relationship and to evaluate the clinical utility of RFM in early identification and risk stratification of psoriasis. Further investigations should also examine how RFM interacts with genetic, environmental, and behavioral factors to inform more precise and equitable prevention strategies.
Data Sharing Statement
The data underlying the results presented in this study are sourced from the National Health and Nutrition Examination Survey (NHANES). As a secondary analysis based on public and anonymous data, this study does not involve new subject exposure or privacy interventions, and meets the internationally recognized ethical review exemption standards (in accordance with Article 32 of the Helsinki Declaration and the Ethical Guidelines for Health Sciences). The acquisition and use of data strictly follow the NHANES official data usage agreement, and the research process does not involve any risk of sensitive information leakage. This survey data is publicly available online for researchers and data users worldwide (www.cdc.gov/nchs/nhanes/.). For access to the datasets used and/or analyzed in this study, as well as the codes utilized, please contact the corresponding author. The codes of datasets utilized and/or analyzed in this work can be obtained from the corresponding author at [email protected] (Guijun Liu) on request.
Ethical Approval
This study does not require ethical approval, as it does not involve human participants, personal data, or animal subjects. All data utilized in this research are publicly available and de-identified, thus exempting it from the need for ethical review.
Consent to Participate
The data used in this study were obtained from the National Health and Nutrition Examination Survey (NHANES). NHANES is a publicly available, anonymized database, and all participants in the original survey provided informed consent, agreeing to the use of their data for research purposes. The use of data in this study complies with NHANES access and usage policies, and no additional participant recruitment or data collection was involved. For more information about NHANES, please visit its official website: www.cdc.gov/nchs/nhanes/.
Funding
Heilongjiang Provincial Health Commission scientific research topic (20220404121093).
Disclosure
Tianming Ma, Xiaoqing Xiang, Guijun Liu declare no competing interest.
References
1. Jain R, Sangoi R, Pascal S, et al. Insights Into the Epidemiological, Clinical, Histopathological, and Dermoscopic Aspects of Chronic Plaque Psoriasis. Cureus. 2024;16(9):e69912. PMID: 39439643; PMCID: PMC11495829. doi:10.7759/cureus.69912.
2. Gao Y, Xu T, Wang Y, et al. Pathophysiology and Treatment of Psoriasis: from Clinical Practice to Basic Research. Pharmaceutics. 2025;17(1):56. PMID: 39861704; PMCID: PMC11769081. doi:10.3390/pharmaceutics17010056.
3. Yi RC, Akbik M, Smith LR, Klionsky Y, Feldman SR. Therapeutic Advancements in Psoriasis and Psoriatic Arthritis. J Clin Med. 2025;14(4):1312. PMID: 40004842; PMCID: PMC11855982. doi:10.3390/jcm14041312.
4. Kunz M, Simon JC, Saalbach A. Psoriasis: obesity and Fatty Acids. Front Immunol. 2019;10:1807. PMID: 31417571; PMCID: PMC6684944. doi:10.3389/fimmu.2019.01807.
5. Han JH, Lee JH, Han KD, et al. Increased risk of psoriasis in subjects with abdominal obesity: a nationwide population-based study. J Dermatol. 2019;46(8):695–701. Epub 2019 May 31. PMID: 31149744. doi:10.1111/1346-8138.14939.
6. Shah NR, Braverman ER. Measuring adiposity in patients: the utility of body mass index (BMI), percent body fat, and leptin. PLoS One. 2012;7(4):e33308. Epub 2012 Apr 2. PMID: 22485140; PMCID: PMC3317663. doi:10.1371/journal.pone.0033308.
7. Wang H, Hou S, Kang X, et al. BMI matters: understanding the link between weight and severe psoriasis. Sci Rep. 2025;15(1):11158. PMID: 40169742; PMCID: PMC11961747. doi:10.1038/s41598-025-94505-0.
8. Kumar S, Han J, Li T, Qureshi AA. Obesity, waist circumference, weight change and the risk of psoriasis in US women. J Eur Acad Dermatol Venereol. 2013;27(10):1293–1298. Epub 2012 Oct 12. PMID: 23057623; PMCID: PMC4179884. doi:10.1111/jdv.12001.
9. Li H, OuYang Z, Ding Z, et al. Association between body roundness index and female infertility: a cross-sectional study of NHANES 2013–2018. Frontiers in Nutrition. 2024;11:1509311. doi:10.3389/fnut.2024.1509311
10. Chen Y, Wang C, Sun Q, et al. Comparison of novel and traditional anthropometric indices in Eastern-China adults: which is the best indicator of the metabolically obese normal weight phenotype? BMC Public Health. 2024;24(1):2192. doi:10.1186/s12889-024-19638-9
11. Li Z, Fan C, Huang J, et al. Non-linear relationship between the body roundness index and metabolic syndrome: data from national health and nutrition examination survey (NHANES) 1999-2018. Br J Nutr. 2024;131(11):1852–1859. doi:10.1017/S0007114524000357
12. Wang X, Guo Z, Wang M, Xiang C. Association between body roundness index and risk of osteoarthritis: a cross-sectional study. Lipids Health Dis. 2024;23(1):334. doi:10.1186/s12944-024-02324-5
13. Tang L, Zeng L. Comparative efficacy of anthropometric indices in predicting 10-year ASCVD risk: insights from NHANES data. Front Cardiovasc Med. 2024;11:1341476. doi:10.3389/fcvm.2024.1341476
14. Shi YY, Zheng R, Cai JJ, Qian SZ. The association between triglyceride glucose index and depression: data from NHANES 2005-2018. BMC Psychiatry. 2021;21(1):267. doi:10.1186/s12888-021-03275-2
15. Paroutoglou K, Papadavid E, Christodoulatos GS, Dalamaga M. Deciphering the Association Between Psoriasis and Obesity: current Evidence and Treatment Considerations. Curr Obes Rep. 2020;9(3):165–178. PMID: 32418186. doi:10.1007/s13679-020-00380-3.
16. Dai YX, Shen YJ, Chou YJ, et al. Obesity, but Not Metabolic Diseases, Is Associated with Risk of Psoriasis: a Population-Based Cohort Study in Taiwan. Dermatology. 2020;236(6):521–528. Epub 2020 Jul 3. PMID: 32623433. doi:10.1159/000508303.
17. Palumbo AM, Jacob CM, Khademioore S, et al. Validity of non-traditional measures of obesity compared to total body fat across the life course: a systematic review and meta-analysis. Obes Rev. 2025;24(6):e13894. Epub ahead of print. PMID: 39861925. doi:10.1111/obr.13894.
18. Lin X, Lin H, Xu J, Yang S, Miao L. Relative fat mass as a predictor of gallstones: insights from national health and nutrition examination survey data. Lipids Health Dis. 2025;24(1):78. Erratum in: Lipids Health Dis. 2025 Mar 15;24(1):95. doi: 10.1186/s12944-025-02519-4. PMID: 40025500; PMCID: PMC11872304. doi:10.1186/s12944-025-02480-2.
19. Liu D, Luo X, Zhou K. Association between current relative fat mass and history of female infertility based on the NHANES survey. Sci Rep. 2025;15(1):6294. PMID: 39984538; PMCID: PMC11845496. doi:10.1038/s41598-025-89417-y.
20. Gu T, Wang Z, Yang Q, Xu M, Shao X, Xue B. Relative Fat Mass Associated with Hyperuricemia in Adults: a Cross-Sectional Study. Endocr Metab Immune Disord Drug Targets. 2025;25. Epub ahead of print. PMID: 39936429. doi:10.2174/0118715303344427241218114648
21. Woolcott OO, Samarasundera E, Heath AK. Association of relative fat mass (RFM) index with diabetes-related mortality and heart disease mortality. Sci Rep. 2024;14(1):30823. PMID: 39730510; PMCID: PMC11681238. doi:10.1038/s41598-024-81497-6.
22. Yu P, Huang T, Hu S, Yu X. Predictive value of relative fat mass algorithm for incident hypertension: a 6-year prospective study in Chinese population. BMJ Open. 2020;10(10):e038420. PMID: 33067286; PMCID: PMC7569915. doi:10.1136/bmjopen-2020-038420.
23. Zwartkruis VW, Suthahar N, Idema DL, et al. Relative fat mass and prediction of incident atrial fibrillation, heart failure and coronary artery disease in the general population. Int J Obes Lond. 2023;47(12):1256–1262. Epub 2023 Sep 9. PMID: 37684330. doi:10.1038/s41366-023-01380-8.
24. Liu H, Jin M, Hao H, Yuan Y, Jia H, Zhou Y. Association between relative fat mass and kidney stones in American adults. Sci Rep. 2024;14(1):27045. PMID: 39511356; PMCID: PMC11543931. doi:10.1038/s41598-024-78061-7.
25. Zhou M, Zhang T, Zeng Z, Zeng S, Wang S, Wang H. Association of relative fat mass with asthma: inflammatory markers as potential mediators. Lipids Health Dis. 2025;24(1):13. PMID: 39810140; PMCID: PMC11731360. doi:10.1186/s12944-024-02428-y.
26. Fratton Z, Maione V, Bighetti S, Bettolini L, Stinco G, Errichetti E. Real-life Experience of Bimekizumab in 27 Obese Patients with Plaque-type Psoriasis: a 24-week Multicenter Retrospective Study. Dermatol Pract Concept. 2025;15(1):4893. Epub ahead of print. PMID: 39853248. doi:10.5826/dpc.1501a4893.
27. Zhou T, Wu J, Wang Y, Gao Y, Cheng K. Weight-Adjusted Waist Index, Psoriasis, and All-Cause Mortality: findings from the NHANES 2003-2006 and 2009-2014. Clin Cosmet Invest Dermatol. 2025;18:7–18. PMID: 39781099; PMCID: PMC11708201. doi:10.2147/CCID.S497128.
28. Lawler W, Castellanos T, Engel E, et al. Impact of obesity on the CCR6-CCL20 axis in epidermal γδ T cells and IL-17A production in murine wound healing and psoriasis. J Immunol. 2025;214(1):153–166. PMID: 40073267; PMCID: PMC11844138. doi:10.1093/jimmun/vkae011.
29. Kim J, Lee J, Lee J, et al. Psoriasis harbors multiple pathogenic type 17 T-cell subsets: selective modulation by risankizumab. J Allergy Clin Immunol. 2025;18:S0091–6749(25)00175–7. Epub ahead of print. PMID: 39978685. doi:10.1016/j.jaci.2025.02.008.
30. Landgren AJ, Jonsson CA, Bilberg A, et al. Serum IL-23 significantly decreased in obese patients with psoriatic arthritis six months after a structured weight loss intervention. Arthritis Res Ther. 2023;25(1):131. PMID: 37501212; PMCID: PMC10373368. doi:10.1186/s13075-023-03105-8.
31. Kounatidis D, Vallianou NG, Karampela I, et al. Anti-Diabetic Therapies and Cancer: from Bench to Bedside. Biomolecules. 2024;14(11):1479. PMID: 39595655; PMCID: PMC11591849. doi:10.3390/biom14111479.
32. Reynoso-von Drateln C, Martínez-Abundis E, Balcázar-Muñoz BR, Bustos-Saldaña R, González-Ortiz M. Lipid profile, insulin secretion, and insulin sensitivity in psoriasis. J Am Acad Dermatol. 2003;48(6):882–885. PMID: 12789179. doi:10.1067/mjd.2003.446.
33. Zhang Y, Dong S, Ma Y, Mou Y. Burden of psoriasis in young adults worldwide from the global burden of disease study 2019. Front Endocrinol. 2024;15:1308822. PMID: 38414821; PMCID: PMC10897041. doi:10.3389/fendo.2024.1308822.
34. Cordeiro Jr TG, Andrade BP, Palitot EB, Piuvezam MR, Mascarenhas SR. Profile of patients receiving medical care at a reference, support, and treatment center for psoriasis patients at a university hospital. An Bras Dermatol. 2016;91(5):691–693. PMID: 27828656; PMCID: PMC5087241. doi:10.1590/abd1806-4841.201644945.
35. Zeng J, Luo S, Huang Y, Lu Q. Critical role of environmental factors in the pathogenesis of psoriasis. J Dermatol. 2017;44(8):863–872. Epub 2017 Mar 27. PMID: 28349593. doi:10.1111/1346-8138.13806.
36. Pollo CF, Miot HA, Matos TDS, et al. Prevalence and factors associated with depression and anxiety in patients with psoriasis. J Clin Nurs. 2021;30(3–4):572–580. Epub 2020 Dec 27. PMID: 33258200. doi:10.1111/jocn.15577.
37. Byker Shanks C, Bruening M, Yaroch AL. BMI or not to BMI? debating the value of body mass index as a measure of health in adults. Int J Behav Nutr Phys Act. 2025;22(1):23. PMID: 40001193; PMCID: PMC11863867. doi:10.1186/s12966-025-01719-6.
38. Blüher M. An overview of obesity-related complications: the epidemiological evidence linking body weight and other markers of obesity to adverse health outcomes. Diabetes Obes Metab. 2025;27(S2):3–19. Epub ahead of print. PMID: 40069923. doi:10.1111/dom.16263.
39. Zhang Q, Kong B, Zhou Z, et al. Association between systemic immune-inflammation index and central obesity in pediatric populations: a cross-sectional and cohort study. Front Immunol. 2025;16:1546612. PMID: 40046065; PMCID: PMC11880016. doi:10.3389/fimmu.2025.1546612.
40. Xu Z, Ma K, Zhai Y, Wang J, Li Y. Obesity mediates the association between psoriasis and diabetes incidence: a population-based study. Diabetol Metab Syndr. 2025;17(1):51. PMID: 39920716; PMCID: PMC11806695. doi:10.1186/s13098-025-01622-x.
41. Ivan EC, Teresa EG, Catalina LS, Alberto Francisco RG, Elena RD. Gender Differences in the Predictive Value of Obesity Indices for Insulin Resistance in Adult Mexican Individuals. Endocr Metab Immune Disord Drug Targets. 2024;24(14):1640–1650. PMID: 38415492. doi:10.2174/0118715303284893240215070923.
42. Cichosz SL, Rasmussen NH, Vestergaard P, Hejlesen O. Is predicted body-composition and relative fat mass an alternative to body-mass index and waist circumference for disease risk estimation? Diabetes Metab Syndr. 2022;16(9):102590. Epub 2022 Aug 9. PMID: 35986982. doi:10.1016/j.dsx.2022.102590.
43. Demura S, Sato S. Nonlinear relationships between visceral fat area and percent regional fat mass in the trunk and the lower limbs in Japanese adults. Eur J Clin Nutr. 2008;62(12):1395–1404. Epub 2007 Sep 5. PMID: 17805228. doi:10.1038/sj.ejcn.1602887.
44. Aguirre C, Tumani MF, Carrasco F, et al. Relative fat mass as an estimator of body fat percentage in Chilean adults. Eur J Clin Nutr. 2024;78(9):782–787. Epub 2024 Jun 28. PMID: 38942896. doi:10.1038/s41430-024-01464-2.
45. Huang L, Luo Y, Kuai L, et al. An approach for psoriasis of microneedle patch simultaneously targeting multiple inflammatory cytokines and relapse related T cells. Biomaterials. 2025;318:123120. Epub 2025 Jan 22. PMID: 39923540. doi:10.1016/j.biomaterials.2025.123120.
46. Cordingley L, Nelson PA, Davies L, et al. Identifying and Managing Psoriasis-Associated Comorbidities: The IMPACT Research Programme. Southampton (UK): NIHR Journals Library; 2022. PMID: 35377573.
47. Fan YJ, Feng YJ, Meng Y, Su ZZ, Wang PX. The relationship between anthropometric indicators and health-related quality of life in a community-based adult population: a cross-sectional study in Southern China. Front Public Health. 2022;10:955615. PMID: 36249240; PMCID: PMC9554305. doi:10.3389/fpubh.2022.955615.
 © 2025 The Author(s). This work is published and licensed by Dove Medical Press Limited. The
full terms of this license are available at https://www.dovepress.com/terms
and incorporate the Creative Commons Attribution
- Non Commercial (unported, 4.0) License.
By accessing the work you hereby accept the Terms. Non-commercial uses of the work are permitted
without any further permission from Dove Medical Press Limited, provided the work is properly
attributed. For permission for commercial use of this work, please see paragraphs 4.2 and 5 of our Terms.
© 2025 The Author(s). This work is published and licensed by Dove Medical Press Limited. The
full terms of this license are available at https://www.dovepress.com/terms
and incorporate the Creative Commons Attribution
- Non Commercial (unported, 4.0) License.
By accessing the work you hereby accept the Terms. Non-commercial uses of the work are permitted
without any further permission from Dove Medical Press Limited, provided the work is properly
attributed. For permission for commercial use of this work, please see paragraphs 4.2 and 5 of our Terms.
Recommended articles
A Comparison of Clinical Characteristics in Overweight/Obese and Normal Weight Patients with Psoriasis Vulgaris: A Bicentric Retrospective Observational Study
Li L, Liu K, Duan X, Xu L, Yang Q, Liu F
Clinical, Cosmetic and Investigational Dermatology 2023, 16:1377-1385
Published Date: 30 May 2023
Anxiety and Depression in People with Eczema or Psoriasis: A Comparison of Associations in UK Biobank and Linked Primary Care Data
Matthewman J, Mansfield KE, Hayes JF, Adesanya EI, Smith CH, Roberts A, Langan SM, Henderson AD
Clinical Epidemiology 2023, 15:891-899
Published Date: 7 August 2023
Association of Complete Blood Cell Count-Derived Inflammatory Biomarkers with Psoriasis and Mortality
Zhao Y, Yang XT, Bai YP, Li LF
Clinical, Cosmetic and Investigational Dermatology 2023, 16:3267-3278
Published Date: 13 November 2023
The Association Between Life’s Essential 8 and Psoriasis in American Adults: A Cross-Sectional NHANES Study
Zhang W, Yuan Z, Wang Y, Jin Z, Luo Z, Wang X
Clinical, Cosmetic and Investigational Dermatology 2024, 17:2555-2563
Published Date: 12 November 2024
Weight-Adjusted Waist Index as a Novel Predictor of Chronic Obstructive Pulmonary Disease: Evidence from NHANES 2013-2018
Wang H, Chen W, Guo F, Xu Z, Luo X, Wu J, Zhu Y, Wang Z
International Journal of Chronic Obstructive Pulmonary Disease 2025, 20:1625-1638
Published Date: 22 May 2025