Back to Journals » International Journal of General Medicine » Volume 15
Relationship Between Risk Factors and Macular Thickness in Patients with Early Diabetic Retinopathy
Authors Wei Q, Qiu W, Liu Q, Jiang Y
Received 19 March 2022
Accepted for publication 23 June 2022
Published 5 July 2022 Volume 2022:15 Pages 6021—6029
DOI https://doi.org/10.2147/IJGM.S366348
Checked for plagiarism Yes
Review by Single anonymous peer review
Peer reviewer comments 3
Editor who approved publication: Dr Scott Fraser
Qingquan Wei,1,* Wei Qiu,1,* Qing Liu,1,2 Yanyun Jiang1
1Department of Ophthalmology, Tong Ren Hospital, Shanghai Jiao Tong University School of Medicine, Shanghai, 200336, People’s Republic of China; 2Shanghai Key Laboratory of Ocular Fundus Diseases, Shanghai, 200080, People’s Republic of China
*These authors contributed equally to this work
Correspondence: Qing Liu; Yanyun Jiang, Department of Ophthalmology, Tong Ren Hospital, Shanghai Jiao Tong University School of Medicine, Shanghai, 200335, People’s Republic of China, Tel +8618121226956, Email [email protected]; [email protected]
Purpose: The purpose of this study was to explore the changes in macular thickness (MT) in normal people, patients without obvious diabetic retinopathy (NDR) and patients with nonproliferative diabetic retinopathy (NPDR) and to study the possible risk factors for early diabetic retinopathy (DR).
Methods: Thirty-one healthy individuals, 40 people with no sign of DR and 60 people with mild NPDR were included in this cross-sectional study. All patients underwent a complete ophthalmological examination. Optical coherence tomography (OCT) was used to measure the MT of each participant. The potential relationship between MT and systemic risk factors for DR, including diabetes duration, body mass index (BMI), hemoglobin A1c (HbA1c), serum lipids, and blood pressure, was analyzed.
Results: The MT of the right and left eyes in the central and inner ring regions of the NPDR group and NDR group were significantly different from that in the control group. The MTs of the right and left eyes in the central region and inner ring region were also significantly different between the NPDR group and NDR group, but the MTs of the right and left eyes in the outer ring region were not significantly different among the three groups. Diabetic duration, total cholesterol (TC), triglycerides (TGs), systolic pressure, and diastolic pressure were positively correlated with the MT of the right and left eyes in the central region.
Conclusion: MT increases, especially in the central region and inner ring, may be the first structural retinal change in diabetic patients and is related to the duration of diabetes, TC, TG, systolic pressure and diastolic pressure.
Keywords: diabetic retinopathy, macular thickness, optical coherence tomography, risk factors
Introduction
Secondary macular edema (ME) is one of the causes of vision loss in patients with diabetic retinopathy (DR).1–4 Diabetic macular edema (DME) can develop at any stage of DR, which is refractory to treatment in the late stage. Therefore, finding novel ways to identify and treat DR in its early stages is vital.5
Many factors are involved in DR development, such as blood pressure, hyperglycemia, diabetes duration, hypertension, and HbA1c.6–8 These factors may also be involved in macular thickness (MT) changes in diabetic patients and may be risk factors and even predictors of DME. The visual acuity (VA) of DR patients is often dependent on central foveal involvement, perifoveal capillary blood flow velocity, and retinal thickness at the central fovea. DME has been reported to occur in 10% of DR patients.9,10 Measuring MT in DM patients may lead to early detection of DR development and subsequent intervention. Optical coherence tomography (OCT) is an emerging technology used to perform cross-sectional imaging of the retina that can be used to measure MT.11
Therefore, we used OCT to record the thickness of each area at the early stage of DR. Furthermore, we explored the relationship between systemic factors and MT to determine the risk factors contributing to the occurrence and development of DME in type 2 diabetes patients.
Materials and Methods
Ethical Approval
This cross-sectional study was conducted at the Department of Ophthalmology of the Tong Ren Hospital affiliated with Shanghai Jiao Tong University School of Medicine. This study was approved by the Research Ethics Committee of the Tong Ren Hospital affiliated with Shanghai Jiao Tong University School of Medicine, Shanghai, China. The procedures conformed to the tenets of the Declaration of Helsinki.
All patients who participated in the examinations and procedures signed informed consent documents.
Participants and Grouping
The present study included 131 participants aged 40 or older recruited between 1 January 2019 and 31 June 2020. The participants were divided groups 1 (control group; 31 healthy individuals), 2 (NDR group; 40 patients with no sign of DR) and 3 (NPDR group; 60 patients with mild NPD).
Patients with at least a 1-year history of type 2 diabetes without DR or with mild NPDR and a visual acuity of 6/10 or better were included in the study. The exclusion criteria were as follows: diagnosed with clinically significant diabetic macular edema (CSME), a history of any ocular disease and refractive surgery or ocular surgery, a history of previous laser photocoagulation or retinal disease, any neurodegenerative disease, type 1 diabetes, a history of smoking, cardiovascular disease, anemia and the use of drugs except for those administered for the treatment of diabetes and hypertension.
Ophthalmological Examinations
Each patient underwent a detailed examination of both eyes by professional ophthalmologists and a detailed medical review. VA, best corrected visual acuity, refractive error, intraocular pressure, anterior and posterior segment examination, axial length, and fundus examination were measured by the same ophthalmologist. MT measurements were taken using an OCT imaging system (3D OCT-1 (Ver. 8.30); Topcon Corporation, Japan) after pupillary dilation. Only well-focused, well-centered images without eye movements and with a quality strength of 25 or more were selected for further analyses. The scanning mode “Macula map” was used to measure the retinal thickness (RT) within 6 mm of the macula. Linear scanning with diameters of 1, 3, and 6 mm centered on the fovea of the macula region and each quadrant (upper, lower, nasal, and temporal) was performed. The macula was divided into three concentric circles: the central area (1 mm diameter), the inner ring area (1~3 mm diameter) and the outer ring area (3~6 mm diameter). Two radiation rays were applied to the inner and outer rings, which were divided into 4 areas (up, down, left, and right) for a total of 9 areas (Figure 1). The average macular thickness in each ring was used in this study.
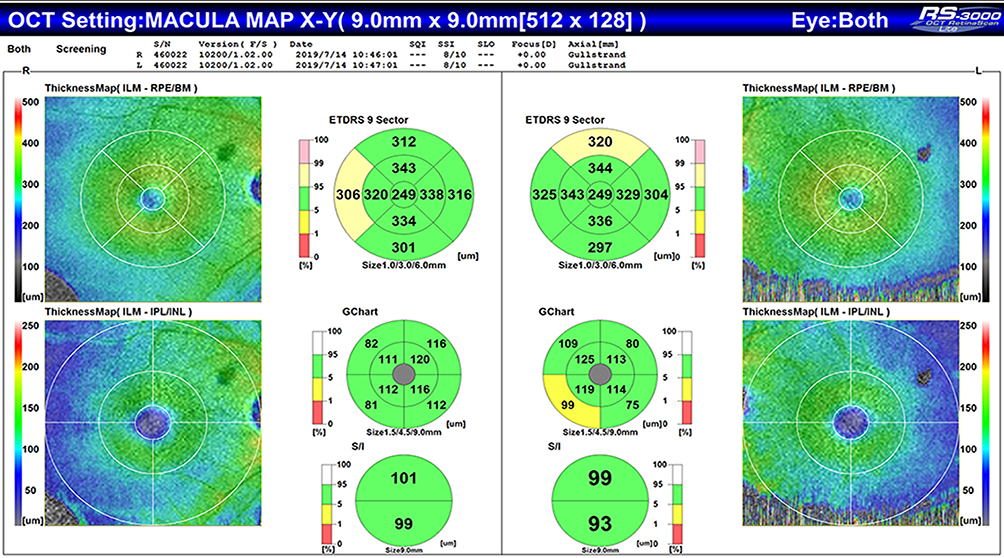 |
Figure 1 OCT photographs of the MT in a healthy individual. |
Laboratory Tests
Patients were diagnosed with type 2 DM by endocrinologists based on the criteria of The Expert Committee for the diagnosis and classification of DM.12
Blood was collected from patients in the morning after fasting for 12 h and used to measure the concentration of glycated hemoglobin (HbA1c), the serum lipid profile, total cholesterol (TC), and triglycerides (TG) by using an autoanalyzer (high pressure liquid chromatography, ADVIA-1650 Chemistry System, Bayer Corporation, Germany).
Statistical Analysis
Data are presented as the mean ± standard deviation (SD). SPSS V.19.0 for Windows (SPSS, Chicago, Illinois, USA) was used for the statistical analyses. The mean comparison between groups was analyzed by variance analysis, and a nonparametric test (Mann–Whitney U) was used to test the data that did not conform to the normal distribution. Correlations between MT and systemic risk factors were investigated by using the Pearson correlation coefficient. A p value <0.05 was defined as statistically significant.
Results
Basic Characteristics of Subjects
A total of 131 participants were included in our study. They were divided group 1 (31 normal people without DR), group 2 (40 DM patients with no sign of DR) and group 3 (60 DM patients with NPDR). The basic clinical and laboratory characteristics of the three groups are shown in Table 1.
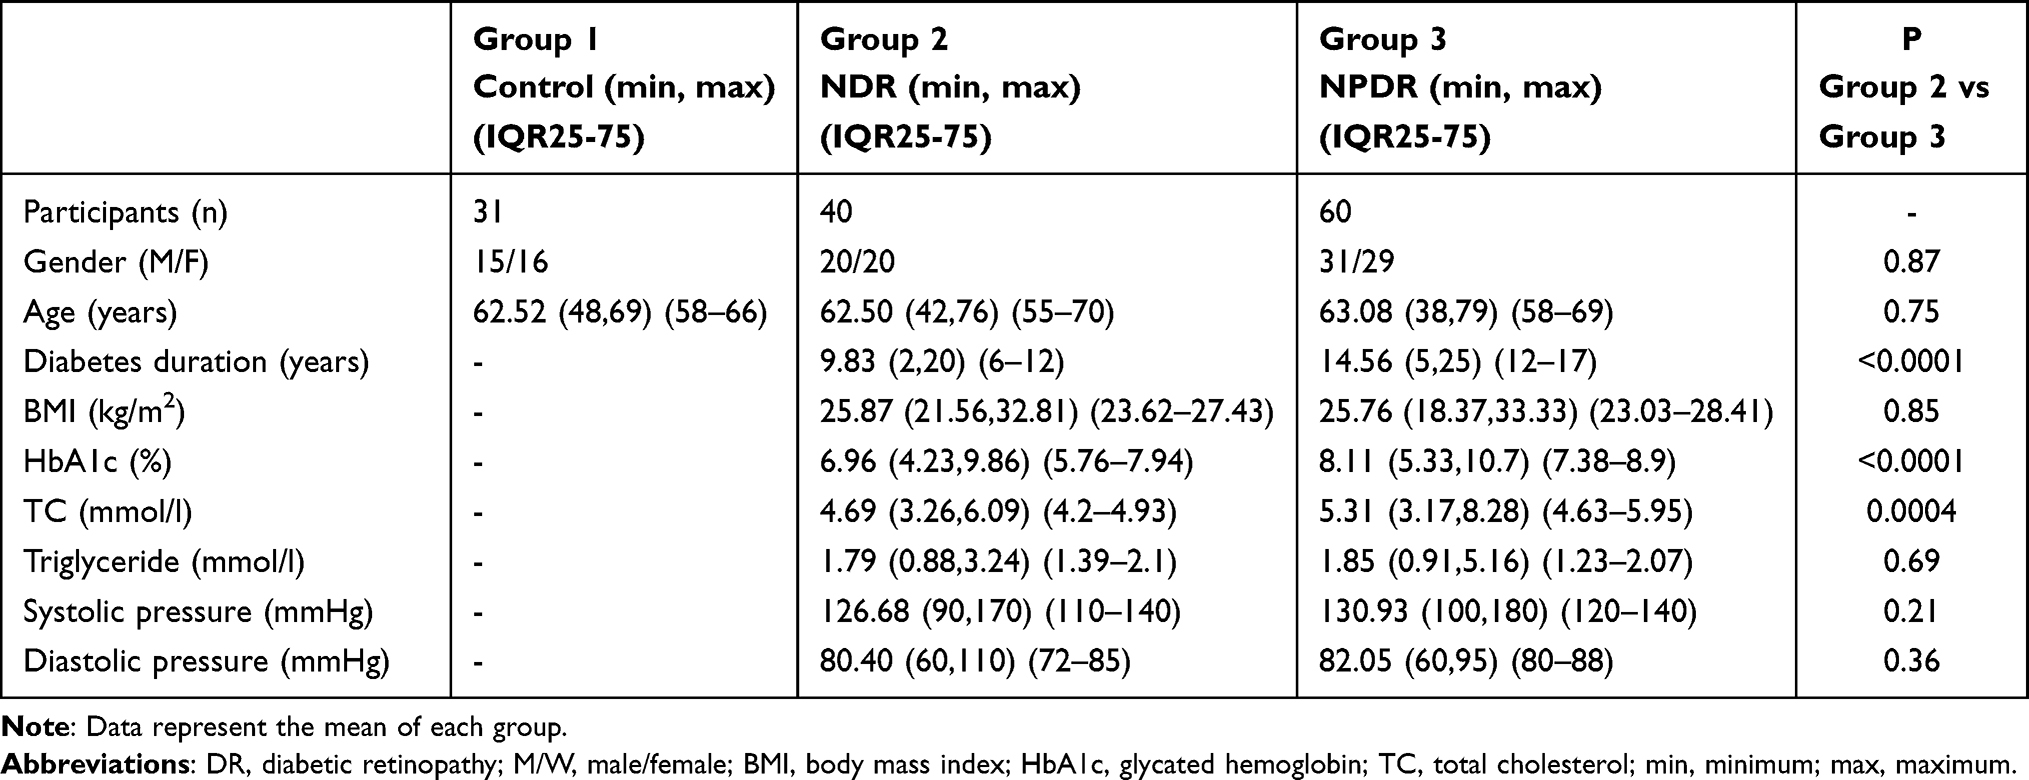 |
Table 1 Comparison of Characteristics According to DR Status |
MT in Different Groups
The minimum MTs of the right eyes of the NPDR group in the central, inner ring and outer ring regions were 246 μm ((IQR25-75 264–279 μm), 300.25 μm (IQR25-75 321.5–346.5 μm) and 244.25 μm ((IQR25-75 287.25–322.25 μm), respectively; in the left eye, these values were 240 μm, 306 μm and 256.5 μm. The maximum right-eye MTs in the central, inner ring and outer ring regions were 289 μm (IQR25-75 264–279 μm), 376.75 μm ((IQR25-75 323–349.25 μm) and 368.5 μm (IQR25-75 290.25–322.75 μm), respectively; in the left eye, these values were 289 μm, 380.5 μm and 364.25 μm. The MTs in the right and left eyes in the central and inner ring regions in the NPDR and NDR groups were significantly different compared with those in the control group. The MTs in the right and left eyes in the central and inner ring regions in the NPDR group were also significantly different from those in the NDR group. However, the MTs in the right and left eye outer ring regions were not significantly different among the three groups (Table 2).
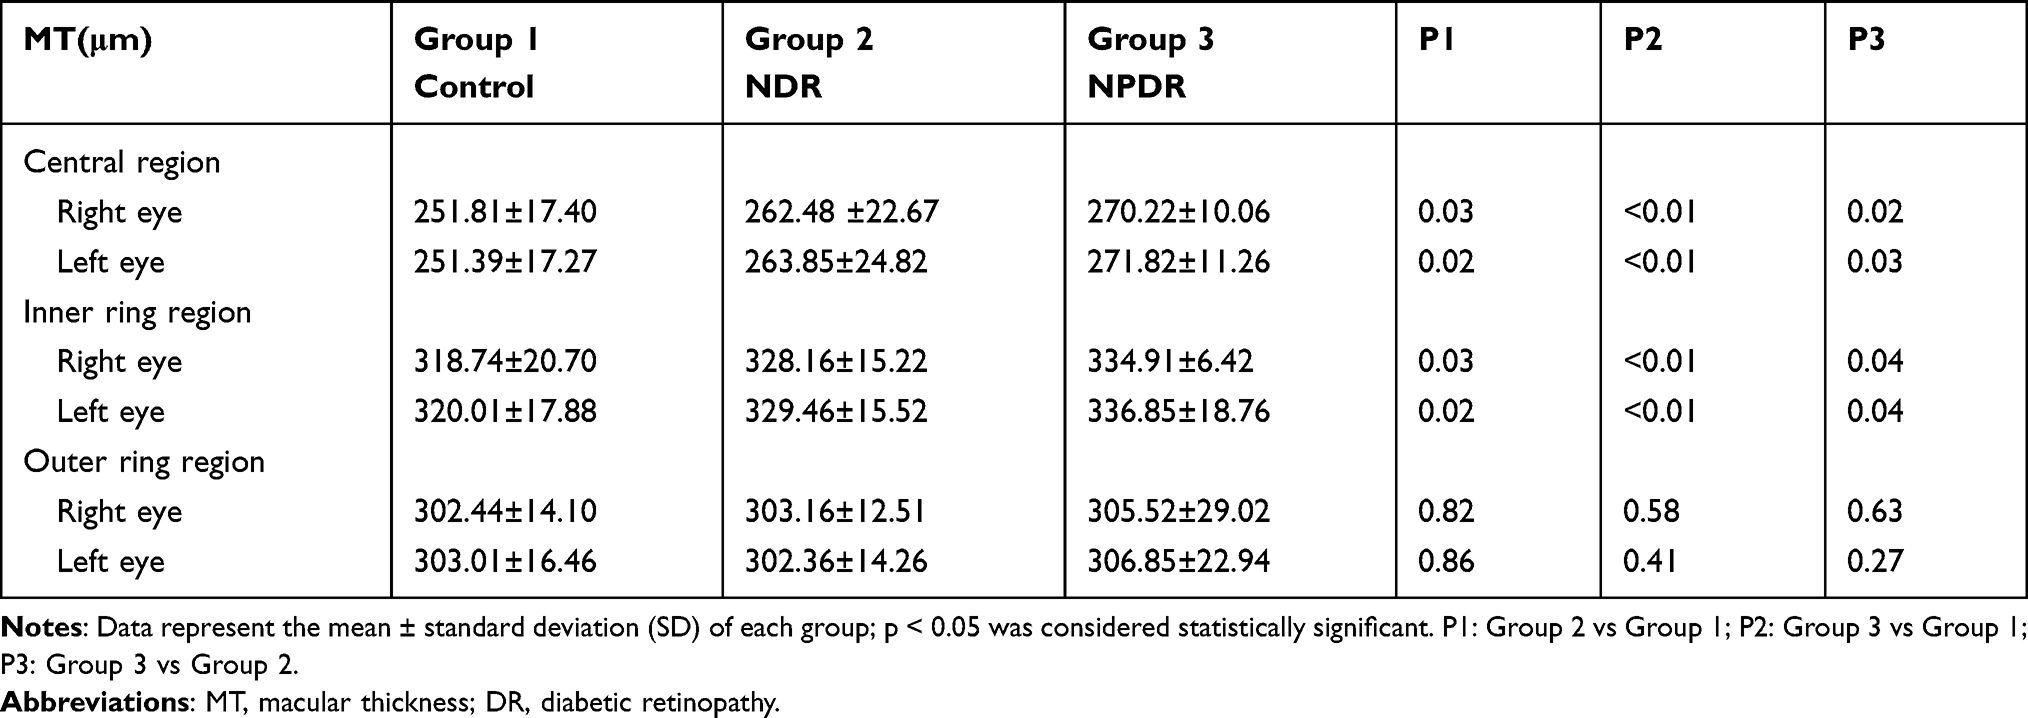 |
Table 2 MT of the Subjects in the Three Groups |
Correlation Between MT and Systemic Risk Factors for DR
The duration of diabetes was found to be positively correlated with MT in the central region of the right and left eyes (Table 3, Figure 2). TC and TG were also found to be positively correlated with MT in the central region of the right and left eyes (Table 3, Figure 3), as did systolic and diastolic pressure (Table 3, Figure 4).
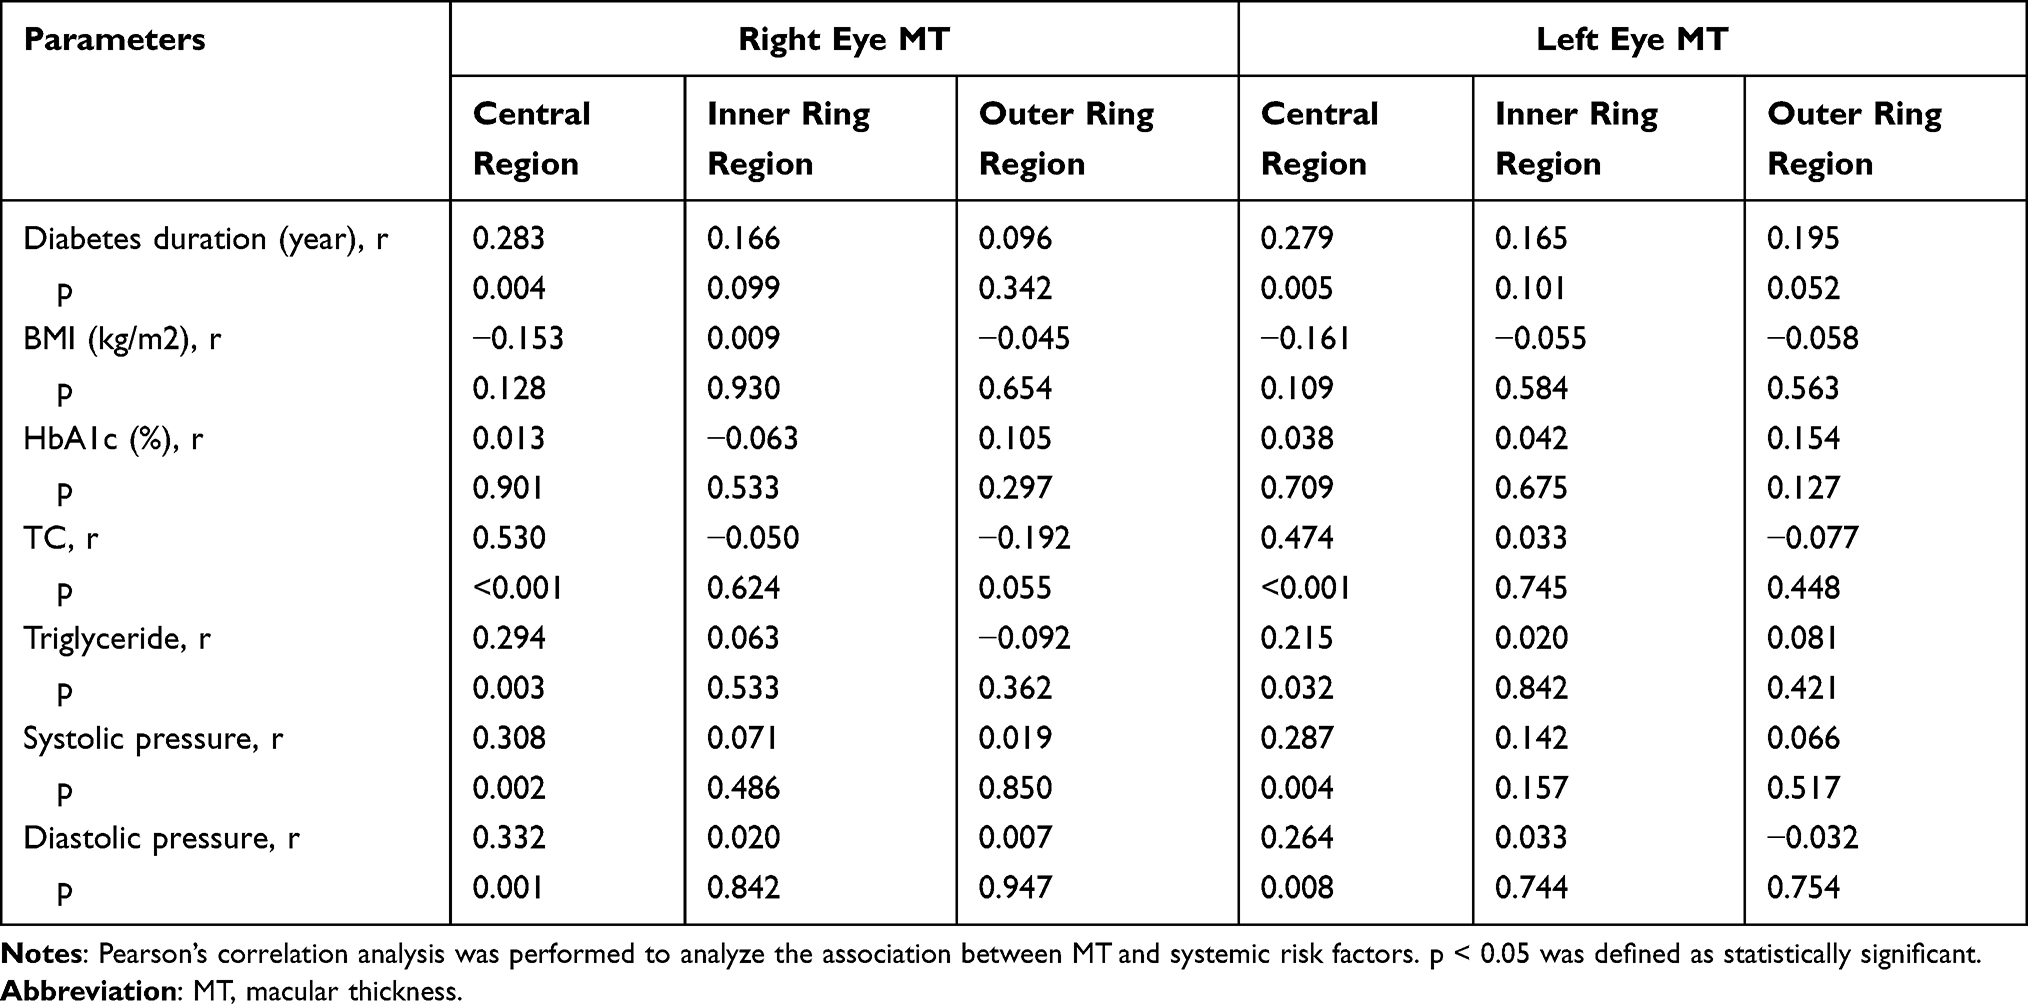 |
Table 3 Correlation Analysis of MT with Systemic Risk Factors |
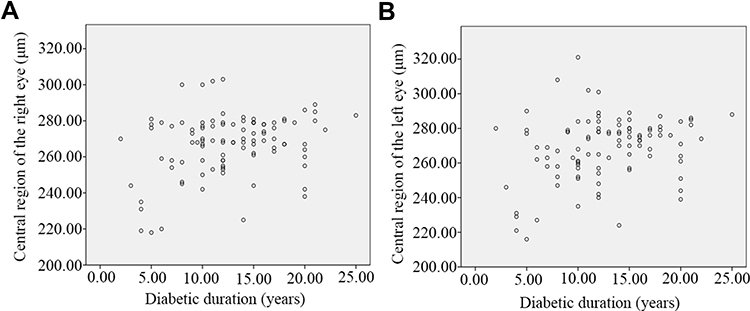 |
Figure 2 Scatter plot of the correlation between diabetes duration and MT in the central region in the right (A) and left eyes (B). |
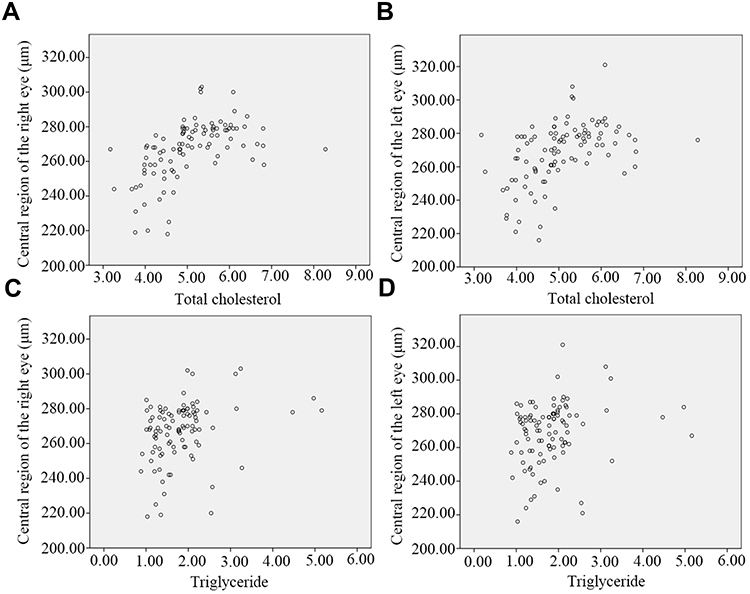 |
Figure 3 Scatter plot of the correlation between MT in the central region and total cholesterol in right (A) and left (B) eyes and the correlation between MT in the central region and triglycerides in right (C) and left (D) eyes. |
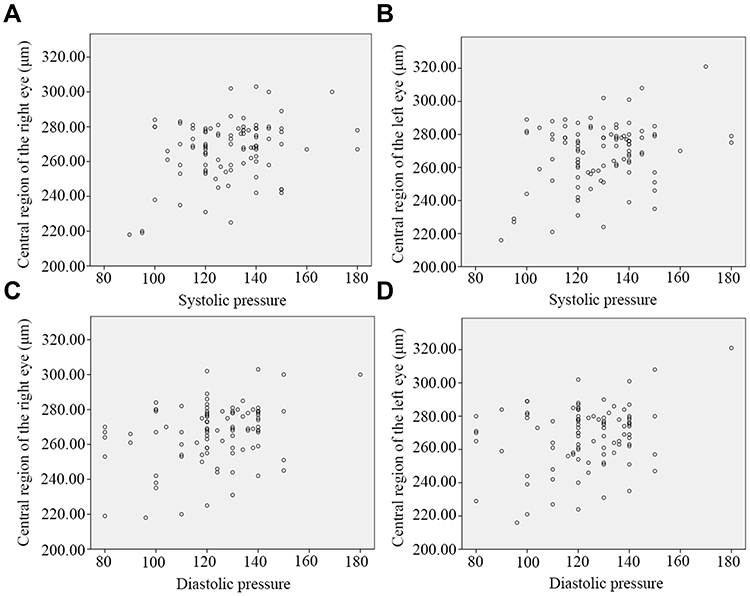 |
Figure 4 Scatter plot of the correlation between MT in the central region and systolic pressure in right (A) and left (B) eyes and the correlation between MT in the central region and diastolic pressure in right (C) and left (D) eyes. |
Discussion
The pathogenesis of DME is not yet clear. Most people believe that the main mechanism is the impairment of blood–retinal barrier function. DME ultimately leads to the accumulation of fluid in the inner and outer plexiform layers of the retina in the macular region and the thickening of the retina.13 The macula is a sensitive area of the retina that receives the most light information. Macular thickening as a result of DME substantially impairs patient vision. As methods for vitreous body retinal surgery have improved, the rate of blindness among DR patients has declined; however, DME has become the most important factor associated with vision impairment and blindness in diabetic patients.14 Scholars have recently suggested that the true correlation between diabetes and vision loss is the degree of macular thickening.15,16 Intervening early in macular edema decreases macular thickness and improves visual acuity varying degrees.17–21 Therefore, it is critical to develop methods for the early diagnosis of macular edema.
With the increasingly wide application of OCT in ophthalmology, some scholars have proposed evaluating “subclinical DME.”22 OCT has become the gold standard for measuring retinal thickness and some retinal and optic nerve diseases in vivo. The sensitivity of OCT imaging has been greatly improved in recent years as software and hardware technology has been updated and developed; current OCT scanning technology can identify subtle structural changes in the retina. OCT is not only noninvasive and sensitive but also demonstrates good renaturation and stability.23–25 OCT is well suited for multiple follow-up examinations. Moreover, many diabetic patients often have severe systemic diseases, and some have allergies. Therefore, it is impossible to perform fundus fluorescein angiography on some patients, and OCT examination is particularly important for these diabetic patients.
The current study revealed that an increase in RT occurs early in the course of DR. The thicker the retinal neuroepithelial layer becomes, the more serious the ME and the more obvious the VA decline. Early measurement of RT is of substantial significance for DR management, condition monitoring and prognosis.26,27 Overall, the inner and outer layers of the normal macular region were thinnest in the central 1 mm region and thickest in the inner ring region (1~3 mm diameter), and the retina gradually became thinner in the outer ring region (3~6 mm diameter). The inner layer of the retina accounts for approximately 43% of the retina, except for the 1 mm area in the center of the macula. Histological studies have shown that the inner retinal tissue in the fovea is very thin, mainly consisting of photoreceptors, but that the inner retinal tissue to the left of the fovea is considerably thicker. Therefore, the thickness of the macular fovea is more specific than other regional indices of the macular region. In this study, OCT was used to measure retinal thickness in the macular region in the NPDR group, NDR group, and normal control group. The results showed that the thickness of the central and inner ring retina in the NDR group was significantly lower than that in the control group (P < 0.05). The MT in the central and inner ring regions in the NPDR group was significantly lower than that in the control group (P < 0.05). The MT in the central and inner ring regions in the NDR group was significantly lower than that in the NPDR group (P < 0.05). The MT in the outer ring region was not significantly different among the three groups (P > 0.05). This indicates that OCT can identify MT that is not visible to the naked eye and is gradually aggravated with the progression of DR. OCT provides a basis for the diagnosis of DME in the early stage of diabetes and is conducive to the prevention and treatment of DME to minimize patient visual impairment.
We also studied the correlation between macular retinal thickness and related biochemical indicators in diabetic patients. The results showed that macular retinal thickness was not related to HbA1c. However, some studies have suggested that a high baseline HbA1c and a large reduction in HbA1c are risk factors for an increase in MT.28,29 This may be because the pathogenesis of macular retinal thickening is not the same as the pathogenesis of hyperglycemia-induced microangiopathy. There may be other unknown factors involved. Obesity has also been observed to have adverse effects on a variety of eye diseases. An increasing number of epidemiological studies have revealed a relationship between BMI and DR.30 Elevated BMI is usually associated with hypertension and dyslipidemia, both of which are risk factors for DR.31 However, we found no significant relationship between BMI and MT. This observation was consistent with the findings of previous studies.32 Therefore, BMI may affect DR in many ways. A prolonged duration of diabetes has been thought to be a risk factor for DR.33,34 This may be because prolonged exposure to the hyperglycemic state can increase the risk of vascular injury, leading to DR. Improving blood lipid status and controlling blood pressure with antihypertensive drugs can reduce the risk of DR progression.1,35–38 In our study, we found that the macular thickness in the inner ring region positively correlated with the duration of diabetes, TC, TG, systolic blood pressure, and diastolic blood pressure. Changes in macular retinal thickness can possibly be predicted by assessing these biochemical markers in the early stage of DME. In contrast, the increase in RT in the macular area observed by ophthalmic OCT may predict the existence of early systemic complications.
However, there are some limitations to our study. First, this study did not examine the history of diabetes medication use. Treatment with diabetes drugs may be another factor affecting patient prognosis. A case–control study on the effect of different antidiabetic drugs on MT in diabetic patients would help solve this problem. Second, VA and MT were not analyzed due to incomplete data collection. We will continue to explore this factor in future research.
Conclusions
In conclusion, the detection of MT, diabetes duration, TC, TG, low-density lipoid, systolic blood pressure, and diastolic blood pressure in early diabetic patients and control of these factors are beneficial to the prediction and treatment of early diabetic complications.
Acknowledgments
We would like to thank all the patients and healthy individuals who participated in this study. This work was financially supported by the Hospital-level Project Fund of Tong Ren Hospital, Shanghai Jiaotong University School of Medicine (No. TRYJ(LC)05 and TRYJ2021JC02) and the Shanghai Key Laboratory of Ocular Fundus Diseases (No. 20180801) and Foundation of Changning District Science and Technology Commission (CNKW2020Y15). The authors also thank AJE for English editing.
Disclosure
The authors report no conflicts of interest in this work.
References
1. Cheung N, Mitchell P, Wong TY. Diabetic retinopathy. Lancet. 2010;376(9735):124–136. doi:10.1016/S0140-6736(09)62124-3
2. Stitt AW, Curtis TM, Chen M, et al. The progress in understanding and treatment of diabetic retinopathy. Prog Retin Eye Res. 2016;51:156–186.
3. Middel CS, Hammes HP, Kroll J. Advancing Diabetic Retinopathy Research: analysis of the Neurovascular Unit in Zebrafish. Cells. 2021;10(6):548.
4. Kollias AN, Ulbig MW. Diabetic retinopathy: early diagnosis and effective treatment. Dtsch Arztebl Int. 2010;107(5):75–83.
5. Hernandez C, Simo-Servat A, Bogdanov P, Simo R. Diabetic retinopathy: new therapeutic perspectives based on pathogenic mechanisms. J Endocrinol Invest. 2017;40(9):925–935.
6. Wang B, Wang F, Zhang Y, et al. Effects of RAS inhibitors on diabetic retinopathy: a systematic review and meta-analysis. Lancet Diabetes Endocrinol. 2015;3(4):263–274.
7. Action to Control Cardiovascular Risk in Diabetes Follow-On Eye Study G, the Action to Control Cardiovascular Risk in Diabetes Follow-On Study G. Persistent Effects of Intensive Glycemic Control on Retinopathy in Type 2 Diabetes in the Action to Control Cardiovascular Risk in Diabetes (ACCORD) Follow-On Study. Diabetes Care. 2016;39(7):1089–1100.
8. Firth J. Fenofibrate and diabetic retinopathy. Lancet. 2008;371(9614):722.
9. Gardner TW, Larsen M, Girach A, Zhi X. Protein Kinase CDRSSG. Diabetic macular oedema and visual loss: relationship to location, severity and duration. Acta Ophthalmol. 2009;87(7):709–713.
10. Sakata K, Funatsu H, Harino S, Noma H, Hori S. Relationship of macular microcirculation and retinal thickness with visual acuity in diabetic macular edema. Ophthalmology. 2007;114(11):2061–2069. doi:10.1016/j.ophtha.2007.01.003
11. Huang D, Swanson EA, Lin CP, et al. Optical coherence tomography. Science. 1991;254(5035):1178–1181. doi:10.1126/science.1957169
12. Chhablani J, Sharma A, Goud A, et al. Neurodegeneration in Type 2 Diabetes: evidence From Spectral-Domain Optical Coherence Tomography. Invest Ophthalmol Vis Sci. 2015;56(11):6333–6338.
13. Bhagat N, Grigorian RA, Tutela A, Zarbin MA. Diabetic macular edema: pathogenesis and treatment. Surv Ophthalmol. 2009;54(1):1–32.
14. Lent-Schochet D, Lo T, Luu KY, et al. Natural History and Predictors of Vision Loss in Eyes with Diabetic Macular Edema and Good Initial Visual Acuity. Retina. 2021;41(10):2132–2139.
15. Glassman AR, Baker CW, Beaulieu WT, et al. Assessment of the DRCR Retina Network Approach to Management With Initial Observation for Eyes With Center-Involved Diabetic Macular Edema and Good Visual Acuity: a Secondary Analysis of a Randomized Clinical Trial. JAMA Ophthalmol. 2020;138(4):341–349.
16. Chatziralli I, Theodossiadis G, Dimitriou E, Theodossiadis P. Evaluation of morphological characteristics of diabetic macular edema in patients with non-proliferative versus proliferative diabetic retinopathy: a spectral-domain optical coherence tomography study. Int Ophthalmol. 2021;41(7):2417–2424.
17. Bressler SB, Odia I, Maguire MG, et al. Factors Associated With Visual Acuity and Central Subfield Thickness Changes When Treating Diabetic Macular Edema With Anti-Vascular Endothelial Growth Factor Therapy: an Exploratory Analysis of the Protocol T Randomized Clinical Trial. JAMA Ophthalmol. 2019;137(4):382–389.
18. Wells JA, Glassman AR, Jampol LM, et al. Association of Baseline Visual Acuity and Retinal Thickness With 1-Year Efficacy of Aflibercept, Bevacizumab, and Ranibizumab for Diabetic Macular Edema. JAMA Ophthalmol. 2016;134(2):127–134.
19. Bressler NM, Beaulieu WT, Glassman AR, et al. Persistent Macular Thickening Following Intravitreous Aflibercept, Bevacizumab, or Ranibizumab for Central-Involved Diabetic Macular Edema With Vision Impairment: a Secondary Analysis of a Randomized Clinical Trial. JAMA Ophthalmol. 2018;136(3):257–269.
20. Wells JA, Glassman AR, Ayala AR, et al. Aflibercept, Bevacizumab, or Ranibizumab for Diabetic Macular Edema: two-Year Results from a Comparative Effectiveness Randomized Clinical Trial. Ophthalmology. 2016;123(6):1351–1359.
21. Virgili G, Parravano M, Evans JR, Gordon I, Lucenteforte E. Anti-vascular endothelial growth factor for diabetic macular oedema: a network meta-analysis. Cochrane Database Syst Rev. 2017;6:CD007419.
22. Browning DJ, Fraser CM. The predictive value of patient and eye characteristics on the course of subclinical diabetic macular edema. Am J Ophthalmol. 2008;145(1):149–154.
23. Virgili G, Menchini F, Casazza G, et al. Optical coherence tomography (OCT) for detection of macular oedema in patients with diabetic retinopathy. Cochrane Database Syst Rev. 2015;1:CD008081.
24. Virgili G, Menchini F, Murro V, Peluso E, Rosa F, Casazza G. Optical coherence tomography (OCT) for detection of macular oedema in patients with diabetic retinopathy. Cochrane Database Syst Rev. 2011;1(7):CD008081.
25. Wang Y, Fawzi AA, Varma R, et al. Pilot study of optical coherence tomography measurement of retinal blood flow in retinal and optic nerve diseases. Invest Ophthalmol Vis Sci. 2011;52(2):840–845.
26. Sopharak A, Uyyanonvara B, Barman S, Williamson TH. Automatic detection of diabetic retinopathy exudates from non-dilated retinal images using mathematical morphology methods. Comput Med Imaging Graph. 2008;32(8):720–727.
27. Esmaeelpour M, Povazay B, Hermann B, et al. Mapping choroidal and retinal thickness variation in type 2 diabetes using three-dimensional 1060-nm optical coherence tomography. Invest Ophthalmol Vis Sci. 2011;52(8):5311–5316.
28. Moon SW, Kim HY, Kim SW, Oh J, Huh K, Oh IK. The change of macular thickness measured by optical coherence tomography in relation to glycemic control in diabetic patients. Graefes Arch Clin Exp Ophthalmol. 2011;249(6):839–848.
29. Yeung L, Sun CC, Ku WC, et al. Associations between chronic glycosylated haemoglobin (HbA1c) level and macular volume in diabetes patients without macular oedema. Acta Ophthalmol. 2010;88(7):753–758.
30. Kastelan S, Salopek Rabatic J, Tomic M, et al. Body mass index and retinopathy in type 1 diabetic patients. Int J Endocrinol. 2014;2014:387919.
31. Yau JW, Rogers SL, Kawasaki R, et al. Global prevalence and major risk factors of diabetic retinopathy. Diabetes Care. 2012;35(3):556–564.
32. Wang J, Zhang RY, Chen RP, et al. Prevalence and risk factors for diabetic retinopathy in a high-risk Chinese population. BMC Public Health. 2013;13:633.
33. Xie XW, Xu L, Wang YX, Jonas JB. Prevalence and associated factors of diabetic retinopathy. The Beijing Eye Study 2006. Graefes Arch Clin Exp Ophthalmol. 2008;246(11):1519–1526.
34. Rajalakshmi R, Amutha A, Ranjani H, et al. Prevalence and risk factors for diabetic retinopathy in Asian Indians with young onset type 1 and type 2 diabetes. J Diabetes Complications. 2014;28(3):291–297.
35. Sjolie AK, Klein R, Porta M, et al. Effect of candesartan on progression and regression of retinopathy in type 2 diabetes (DIRECT-Protect 2): a randomised placebo-controlled trial. Lancet. 2008;372(9647):1385–1393.
36. Beulens JW, Patel A, Vingerling JR, et al. Effects of blood pressure lowering and intensive glucose control on the incidence and progression of retinopathy in patients with type 2 diabetes mellitus: a randomised controlled trial. Diabetologia. 2009;52(10):2027–2036.
37. Keech AC, Mitchell P, Summanen PA, et al. Effect of fenofibrate on the need for laser treatment for diabetic retinopathy (FIELD study): a randomised controlled trial. Lancet. 2007;370(9600):1687–1697.
38. Group AS, Group AES, Chew EY, et al. Effects of medical therapies on retinopathy progression in type 2 diabetes. N Engl J Med. 2010;363(3):233–244.
 © 2022 The Author(s). This work is published and licensed by Dove Medical Press Limited. The
full terms of this license are available at https://www.dovepress.com/terms
and incorporate the Creative Commons Attribution
- Non Commercial (unported, 3.0) License.
By accessing the work you hereby accept the Terms. Non-commercial uses of the work are permitted
without any further permission from Dove Medical Press Limited, provided the work is properly
attributed. For permission for commercial use of this work, please see paragraphs 4.2 and 5 of our Terms.
© 2022 The Author(s). This work is published and licensed by Dove Medical Press Limited. The
full terms of this license are available at https://www.dovepress.com/terms
and incorporate the Creative Commons Attribution
- Non Commercial (unported, 3.0) License.
By accessing the work you hereby accept the Terms. Non-commercial uses of the work are permitted
without any further permission from Dove Medical Press Limited, provided the work is properly
attributed. For permission for commercial use of this work, please see paragraphs 4.2 and 5 of our Terms.
Recommended articles
Reduced Size of Telangiectatic Capillaries After Intravitreal Injection of Anti-Vascular Endothelial Growth Factor Agents in Diabetic Macular Edema
Itou J, Furushima K, Haruta M, Kato N, Arai R, Mori K, Ishikawa K, Yoshida S
Clinical Ophthalmology 2023, 17:239-245
Published Date: 19 January 2023
Non-Linear Relationship Between Fasting C-Peptide and Retinopathy in Patients with Type 2 Diabetes Mellitus - A Retrospective Study
Ma J, Han C, Lv Y, Cai H
Diabetes, Metabolic Syndrome and Obesity 2025, 18:1035-1045
Published Date: 7 April 2025
Association Between Serum Vitamin D3 Levels and Diabetic Macular Edema in Patients with Type 2 Diabetes: A Retrospective Case-Control Study
Al-latayfeh M, Shatnawi RA, Abu-Ain MS, Alotaibi TM, Albazee E, Al-balawi M, Alnifise MH
Diabetes, Metabolic Syndrome and Obesity 2026, 19:588850
Published Date: 20 February 2026