Back to Journals » Diabetes, Metabolic Syndrome and Obesity » Volume 15
Relationship Between Four Non-Insulin-Based Indexes of Insulin Resistance and Serum Uric Acid in Patients with Type 2 Diabetes: A Cross-Sectional Study
Authors Han R ![]() , Zhang Y, Jiang X
, Zhang Y, Jiang X
Received 12 February 2022
Accepted for publication 16 April 2022
Published 9 May 2022 Volume 2022:15 Pages 1461—1471
DOI https://doi.org/10.2147/DMSO.S362248
Checked for plagiarism Yes
Review by Single anonymous peer review
Peer reviewer comments 2
Editor who approved publication: Prof. Dr. Juei-Tang Cheng
Rongfeng Han, Yang Zhang, Xia Jiang
Department of Endocrinology, Tianjin First Center Hospital, Tianjin, 300192, People’s Republic of China
Correspondence: Rongfeng Han, Department of Endocrinology, Tianjin First Center Hospital, Tianjin, 300192, People’s Republic of China, Email [email protected]
Aim: The aim of this study was to investigate the association between serum uric acid (SUA) levels and four insulin resistance surrogates in patients with type 2 diabetes (T2DM). The four non-insulin-based indexes of insulin resistance (IR) include the glucose and triglycerides index (TyG), TyG index with body mass index (TyG-BMI), ratio of triglycerides to high-density lipoprotein cholesterol (TG/HDL-c) and metabolic score for insulin resistance (METS-IR).
Methods: A total of 687 patients with T2DM were enrolled in the current study. Patients were stratified into three groups according to their levels of SUA. Spearman correlation was used to analyze the correlation between SUA and clinical variables. Multiple linear regression analysis was used to assess the association between SUA and the four insulin resistance surrogates. Receiver operating characteristic (ROC) analyses and the area under the ROC curve (AUC) were then used to assess the ability of TyG, TyG-BMI, TG/HDL-c, and METS-IR to discriminate hyperuricemia (HUA) in T2DM.
Results: SUA in T2DM was significantly positively correlated with TyG (r 0.406 P < 0.01), TyG-BMI (r 0.272 P < 0.01), TG/HDL-c (r 0.493 P < 0.01), and METS-IR (r 0.238 P < 0.01). Furthermore, higher values of the four insulin resistance surrogates were independently correlated with higher SUA levels in T2DM patients (P < 0.01 for all) after adjusting for confounding factors. TyG, TyG-BMI, TG/HDL-c, and METS-IR all had a significant discriminative ability for HUA in patients with T2DM. The AUC values were 0.693 (95% CI 0.645– 0.741), 0.649 (95% CI 0.599– 0.699), 0.768 (95% CI 0.726– 0.811), and 0.660 (95% CI 0.609– 0.710), respectively.
Conclusion: The present study suggests that TyG, TyG-BMI, TG/HDL-c and METS-IR had a significant correlation with SUA in T2DM. TG/HDL-c was the best marker among the four insulin resistance surrogates for the identification of HUA in T2DM.
Keywords: type 2 diabetes, serum uric acid, insulin resistance, TyG, TyG-BMI, TG/HDL-c, METS-IR
Introduction
Type 2 diabetes (T2DM) is a metabolic disease characterized by persistent hyperglycemia. For T2DM patients, in addition to glucose metabolic disorder, persistent hyperglycemia chronically damages tissues and organs such as the retina, heart and kidney, severely threatening patients’ lives and health.1 Serum uric acid (SUA) is the metabolic end product of purine nucleotides, and at physiological concentrations, SUA plays positive roles in antioxidation, DNA damage resistance, antiosteoporosis and delay of the decline in cognitive function, etc. However, at too high of a concentration, SUA can induce HUA; in addition to its ability to induce gout and chronic kidney disease, HUA has been demonstrated to have a close relationship with obesity, dyslipidemia, diabetes, hypertension and cardiovascular diseases and is an independent risk factor for the occurrence of various diseases.2–6 With the improvement of people’s living standards and changes in dietary structure, the incidence rates of T2DM and HUA have been increasing yearly, which has become a considerable challenge in the field of public health.7–9
Insulin resistance (IR) is an important characteristic of patients with T2DM. IR is caused by insulin-dependent tissues becoming less sensitive to the effect of insulin, which leads to metabolic imbalance. At the same time, there is a significant correlation between IR and HUA.10 The “gold standard” for the diagnosis of IR is a measurement of the glucose disposal rate using a hyperinsulinemic-euglycemic clamp (HEC). However, the invasiveness and complexity of this procedure limit its clinical use.11 Homeostasis model assessment for IR (HOMA-IR), an index for evaluating IR, is currently widely used, but its application is limited by the requirements for insulin measurement.12 In recent years, some non-insulin–based IR indexes, such as the triglyceride-glucose index (TyG),13 triglyceride-glucose-body mass index (TyG-BMI),14 triglycerides-to-high-density lipoprotein cholesterol ratio (TG/HDL-c),15 and metabolic score for IR (METS-IR),16 have been developed to compensate for the shortcomings of traditional IR indicators as new alternative predictors of IR. These indexes can be calculated through simple routine biochemical tests and are suitable for clinical and epidemiological research. However, there are few research reports on the relationship of TyG, TyG-BMI, TG/HDL-c, and METS-IR with the SUA level in T2DM patients. To provide a clinical reference, this study aims to analyze the association between these four non-insulin-based IR indicators and SUA levels in T2DM and their predictive value for HUA.
Methods
Study Population
A total of 687 adult T2DM patients who were hospitalized in the endocrinology department at Tianjin First Central Hospital from June 2017 to October 2019 were retrospectively selected as the research subjects. The inclusion criteria were (1) diagnosis of type 2 diabetes according to the World Health Organization17 criteria; (2) age ≥18 years; (3) no documented ketoacidosis, hyperosmolar nonketotic diabetic coma or lactic acidosis in the 3 months before enrollment; (4) no use of drugs that affect uric acid metabolism and lipid-lowering in the past 3 months; and (5) complete clinical data. Patients with any fever or infectious diseases, serious cardiovascular and cerebrovascular disease, obstructive uropathy, malignant tumor, rheumatic disease, or acute internal medicine and surgical diseases and those who were pregnant or lactating were excluded. This study was approved by the ethics review board of Tianjin First Center Hospital and complied with the Helsinki Declaration. The requirement for informed patient consent was waived because no interventions or further examinations were performed.
Data Collection
Demographic information and medication history were collected by physicians. All the patients were given hypoglycemic drugs. Height and weight were measured by electronic scales. Two seated blood pressure measurements were obtained by a well-trained nurse using a mercury sphygmomanometer after the patients rested quietly for at least 5 min following a standard protocol, with the average of the two measurements used for the analysis. The patients fasted for at least 8 hours overnight, and blood and urine samples were collected the following morning. All blood and urine samples were tested immediately after collection. The tests included hemoglobin A1C (HbA1c) (Bio-Rad VARIANTII TURBO, America), fasting blood glucose (FBG), serum uric acid (SUA), blood urea nitrogen (BUN), creatinine (CR), triglyceride (TG), total cholesterol (TC), high-density lipoprotein cholesterol (HDL-c), low-density lipoprotein cholesterol (LDL-c), and albumin excretion rate (AER) (Roche Cobas c 701, Germany).
Definitions
Hyperuricemia (HUA) was defined as an SUA level > 420 μmol/L in males or > 360 μmol/L in females.18 Diabetic nephropathy (DN) was defined as an AER of ≥ 30 mg/24 h or an AER of ≥ 20 μg/min in at least two of three consecutive overnight urine collections.19 Hypertension was defined as an average of two measurements of systolic blood pressure (SBP) ≥140 mmHg or diastolic blood pressure (DBP) ≥90 mmHg or current use of antihypertensive agents. The estimated glomerular filtration rate (eGFR) was calculated using the Chinese modification of diet in renal disease (MDRD) equation: eGFR (mL/min/1.73 m2) =175 × (serum creatinine (mg/dl)) −1.234 × (age)−0.179 × (0.79 for females).20 Body mass index (BMI) was calculated as weight divided by the square of height. Non-insulin–based IR indexes included TyG, TyG-BMI, TG/HDL-c and METS-IR. These were calculated using the following formulas: TyG = ln [TG (mg/dL) × FBG (mg/dL) / 2];13 TyG-BMI= TyG× BMI;14 TG/HDL-c = TG (mg/dL) / HDL-c (mg/dL);15 and METS-IR = {ln [2 × FPG (mg/dL) + TG (mg/dL)] × BMI (kg/m2) / ln [HDL-c (mg/dL)]}.16
Statistical Analysis
Data were analyzed using SPSS 25.0 software (SPSS Inc., Chicago, IL, USA). Categorical variables are expressed as numbers (percentages) and were compared using the chi-squared test. Continuous variables with a normal distribution are expressed as the mean ± standard deviation, and those without a normal distribution are expressed as the median (25th and 75th percentiles). Comparisons of the clinical parameters in three groups were analyzed by one-way ANOVA (normally distributed data) or the Kruskal–Wallis H-test (nonnormally distributed data). Spearman correlation was used to analyze the correlations between SUA levels and other variables. Multiple linear regression analysis was used to assess the associations between SUA and the four insulin resistance surrogates in patients with T2DM. Receiver operating characteristic (ROC) analyses and the area under the ROC curve (AUC) were then used to assess the ability of TyG, TyG-BMI, TG/HDL-c, and METS-IR to discriminate HUA in T2DM patients. The significance level was set at P < 0.05.
Results
Clinical Characteristics
There were 377 (54.88%) men and 310 (45.12%) women in the study. The average ages were 50.7 ± 17.2 and 55.9 ± 16.1 years for men and women, respectively. According to the reference range for SUA,21 all subjects were divided into three groups, as shown in Table 1. There was no significant difference in age, diabetes duration, SBP, DBP, height, prevalence of DN or hypertension among the three groups. In the higher SUA group, there was a significantly higher proportion of men; significantly higher weight, BMI, CR, BUN, TG, TC, and AER; and significantly lower HbA1c, eGFR and HDL-c compared with the other two groups. The higher SUA group had significantly lower FBG, while LDL-c were significantly increased. As shown in Figure 1, TyG, TyG-BMI, TG/HDL-c, and METS-IR were significantly increased in the higher SUA group (P < 0.001).
 |
Table 1 Comparisons of Clinical Characteristics of T2DM Patients with Different SUA Levels |
 |
Figure 1 Comparison of four non-insulin-based IR indexes at different serum uric acid (SUA) levels. (A) difference of triglyceride and glucose index (TyG) among the three groups; (B) difference of TyG index with body mass index (TyG-BMI) among the three groups; (C) difference of the ratio of triglycerides divided by high-density lipoprotein cholesterol (TG/HDL-c) among the three groups; (D) difference of metabolic score for insulin resistance (METS-IR) among the groups. |
Correlation Between SUA and Clinical Variables
Spearman correlation analysis results are shown in Table 2. SUA was significantly positively correlated with diabetes duration, height, weight, BMI, BUN, CR, TG, TC, LDL-c, and AER, while SUA was significantly negatively correlated with HDL-c, HbA1c, FBG, and eGFR (P < 0.05 for all). SUA was not correlated with age, SBP or DBP (P > 0.05 for all), although it was significantly positively correlated with TyG, TyG-BMI, TG/HDL-c, and METS-IR (Figure 2, P < 0.05 for all).
 |
Table 2 Correlations Between SUA Level and Clinical Variables |
 |
Figure 2 Correlation between serum uric acid (SUA) and four non-insulin-based IR indexes in T2DM. (A) correlation between SUA and triglyceride and glucose index (TyG); (B) correlation between SUA and TyG index with body mass index (TyG-BMI); (C) correlation between SUA and the ratio of triglycerides divided by high-density lipoprotein cholesterol (TG/HDL-c); (D) correlation between SUA and metabolic score for insulin resistance (METS-IR). |
Multiple Linear Regression Analysis of Four Non-Insulin-Based IR Indexes Correlated with SUA in Participants with Type 2 Diabetes
Furthermore, to explore the role of four non-insulin-based IR indexes in SUA metabolism, multiple linear regression analysis was performed to assess whether the four non-insulin-based IR indexes were independently correlated with SUA in participants with type 2 diabetes. As presented in Table 3, the results showed that TyG, TyG-BMI, TG/HDL-c, and METS-IR were positively associated with SUA in the unadjusted model (P < 0.01 for all), and this association remained significant after adjustment for age, sex and diabetes duration (P < 0.01 for all) and for SBP, DBP, BUN, CR, TC, LDL-c, HbA1c, AER and eGFR in type 2 diabetic participants (P < 0.01 for all).
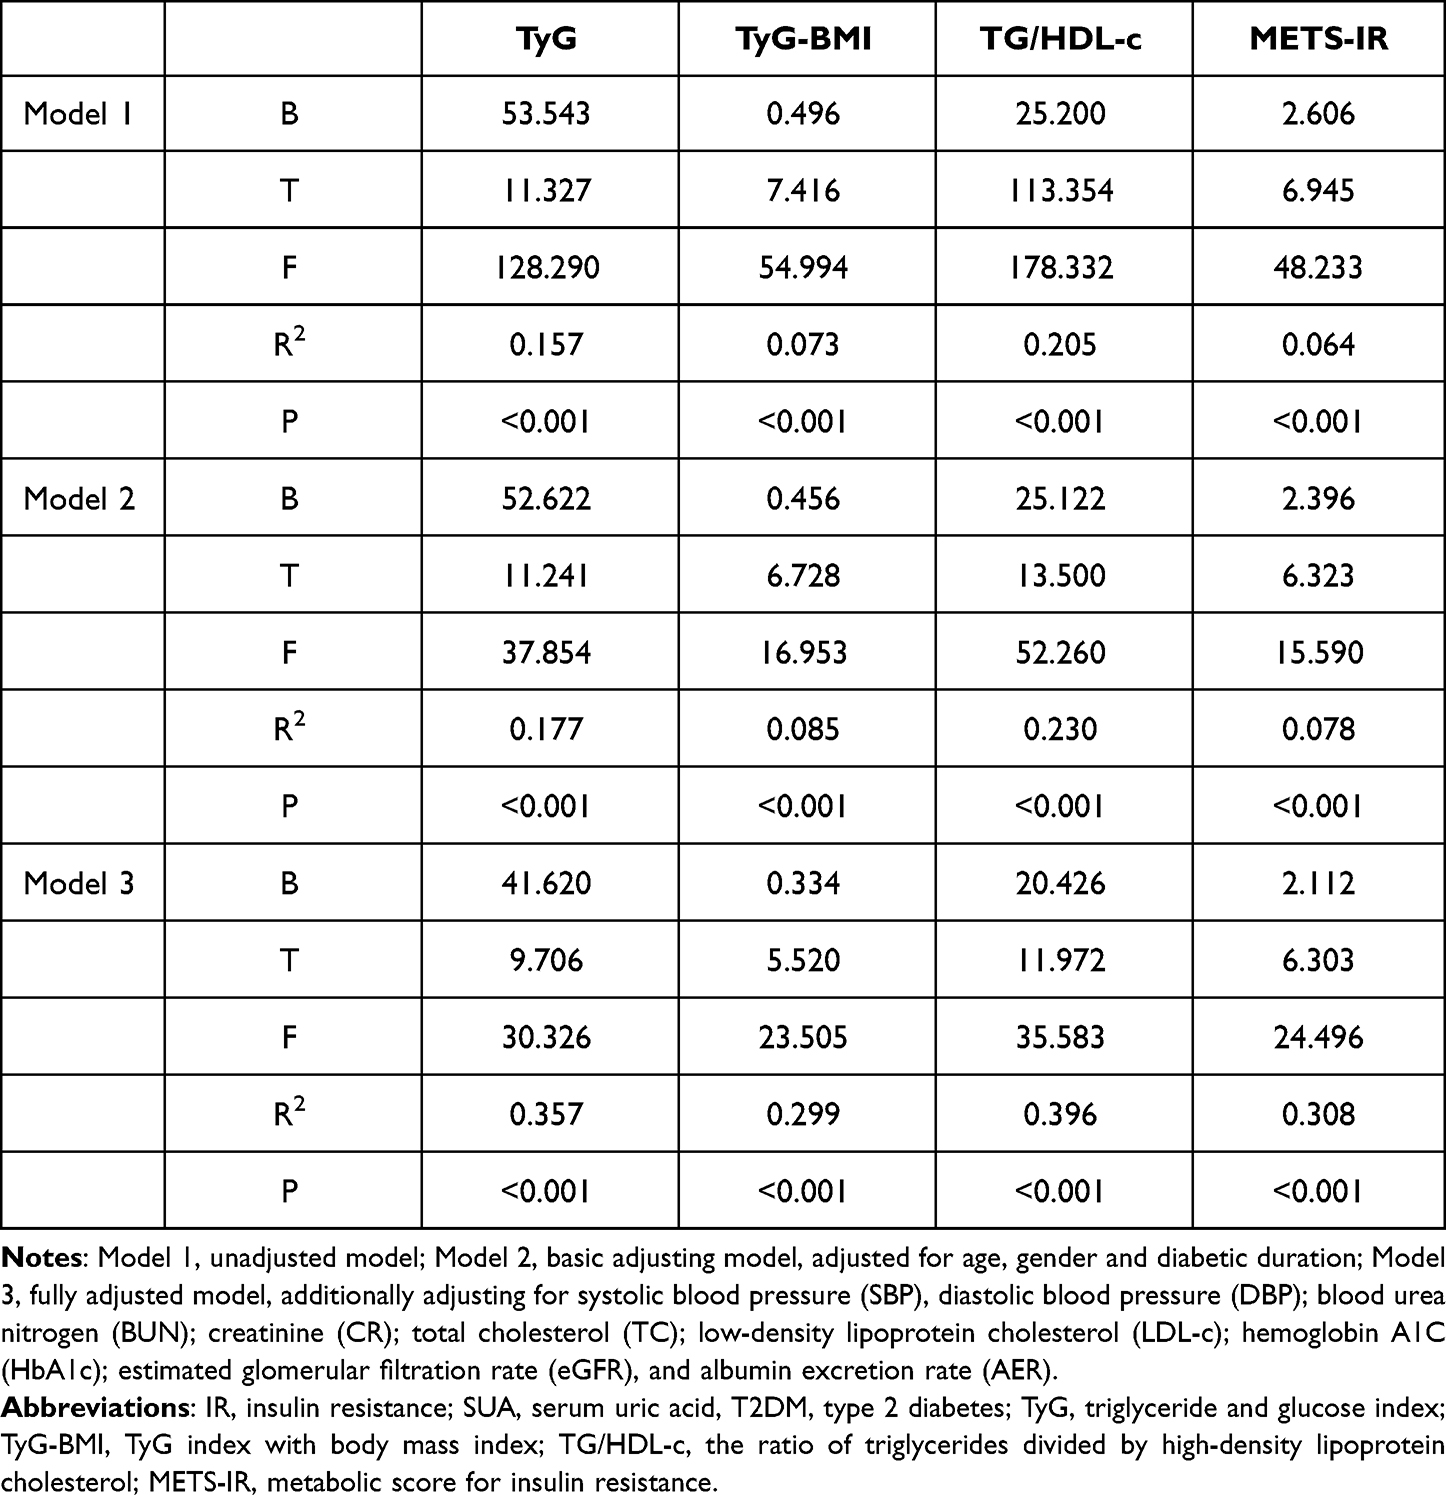 |
Table 3 Multiple Regression Analysis of Four Non-Insulin-Based IR Indexes Correlated with SUA in T2DM |
AUCs and Cutoff Values of the Four Non-Insulin-Based IR Indexes for the Prediction of HUA in Type 2 Diabetic Participants
The AUC values, cutoff values, sensitivity and specificity of the four IR surrogates in discriminating HUA in type 2 diabetic participants are shown in Table 4 and Figure 3. TyG, TyG-BMI, TG/HDL-c, and METS-IR all had significant discriminative ability for HUA in patients with T2DM. The AUC values were 0.693 (95% CI 0.645–0.741), 0.649 (95% CI 0.599–0.699), 0.768 (95% CI 0.726–0.811), and 0.660 (95% CI 0.609–0.710), respectively. The cutoff values (sensitivity, specificity) were TyG 9.55 (75.9%, 53.1%), TyG-BMI 255.50 (66.2%, 62.5%), TG/HDL-c 1.79 (76.6%, 65.1%), and METS-IR 46.33 (57.9%, 71.0%).
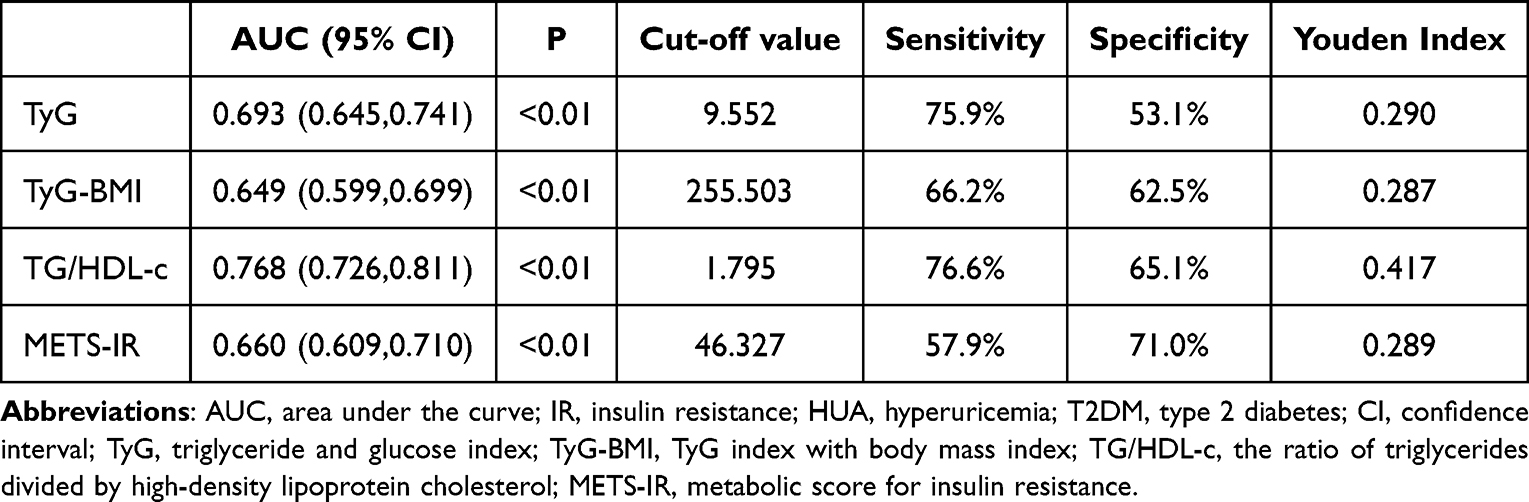 |
Table 4 AUCs and Cutoff Values of Four Non-Insulin-Based IR Indexes for the Prediction of HUA in T2DM |
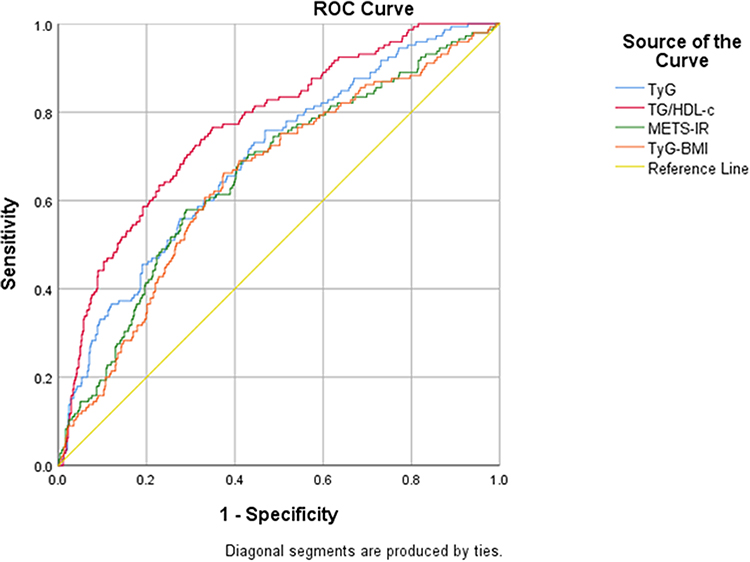 |
Figure 3 Receiver operating characteristic (ROC) curves for predicting HUA in T2DM. Abbreviations: HUA, hyperuricemia; TyG, triglyceride and glucose index; TyG-BMI, TyG index with body mass index; TG/HDL-c, the ratio of triglycerides divided by high-density lipoprotein cholesterol; METS-IR, metabolic score for insulin resistance. |
Discussion
This study is the first to evaluate the correlations between four non-insulin-dependent IR indexes and SUA levels in patients with T2DM and the predictive value of the four indicators for HUA. The present study found that the four easily measurable surrogate indexes of IR were significantly associated with the presence of HUA in T2DM. Our participants are patients with T2DM. Another study has shown that even in subjects at risk for T2DM, SUA concentrations were significantly associated with impaired IR and insulin secretion.22 IR is the common factor in many pathological and physiological conditions, including obesity, dyslipidemia, T2DM, abnormal glucose tolerance, hypertension and arteriosclerosis, and is a prevalent phenomenon in human disease.23 IR can be present up to 20 years before the onset of T2DM, and in patients without diabetes, it has been an independent predictor of cardiovascular disease and mortality.22,24 Recent studies also highlight the role of SUA as an emerging non-traditional independent risk factor that correlates with obesity, metabolic syndrome, type 2 diabetes, preclinical cardiac and extracardiac organ damage, as well as cardiovascular events.25–27 As shown in the study, HUA was closely related to and mutually beneficial with IR.28 The potential mechanism by which IR causes HUA is as follows: in the body under IR, the intermediate products of the glycolysis process are shifted to phosphoribosyl pyrophosphate and 5-ribose phosphoric acid, increasing the production of SUA;29 IR can cause hyperinsulinemia and promote reabsorption of uric acid by kidney tubules; and IR can then increase the synthesis of fat cells in the liver, resulting in abnormal metabolism of purines and an increase in the SUA level.30 In addition, the renal glucose threshold of T2DM patients is usually reduced, which further promotes Na-H ion exchange in kidney tubules, resulting in an increase in urate reabsorption, causing an increase in SUA levels.31 The possible mechanism by which HUA causes IR is as follows: in the case of HUA, urate crystals are apt to separate out and precipitate in pancreatic islets, resulting in impaired function of pancreatic islet B cells and causing glucose and lipid metabolism disorders. Uric acid could mediate IR and impaired insulin secretion through the development of mitochondrial oxidative stress and the impairment of insulin-dependent stimulation of nitric oxide in endothelial cells.22,32 Uric acid can cause an increase in monocyte chemoattractant protein-1, which plays a critical role in inflammatory reactions in fat cells.33 Uric acid was found to directly inhibit insulin signaling and induce insulin resistance which is considered to be the underlying mechanism of hepatic steatosis.34 In addition, uric acid can reduce the synthesis of adiponectin, which is the specific insulin action enhancer of fat cells and a medium against inflammatory reactions. Thus, HUA may result in endocrine disorder of fat cells by producing inflammatory reactions at low levels and insulin resistance.35
Even though the close relationship between HUA and IR has been well demonstrated, using this theory to guide the prevention and management of HUA in clinical practice is still one step away and that is IR assessment. We used IR surrogates, which can be calculated according to the biochemical indexes of the human body, and had the advantages of simplicity, convenience and economy. The TyG index, which combines FBG and lipid profiles, was first reported to be a useful surrogate for IR in 2008.13 Several studies have demonstrated that TyG has shown excellent predictive performance in detecting IR compared with HOMA-IR and HEC.36 TG/HDL-c, which contains pivotal components of hyperlipidemia, has been proposed as a predictor of IR and an easily obtainable atherogenic marker.37,38 It was reported that TG/HDL-c ratio better indicates atherosclerotic disturbances than TG and HDL-c, alone and might be reliable in screening for metabolic disturbances.39 In 2016, Er et al14 found that a new index formed by combining the TyG index with BMI can better reflect the state of IR. Compared with lipid parameters, the lipid ratio, blood glucose parameters, the TyG index and obesity-related parameters, TyG-BMI has the largest AUC in identifying IR. Bello-Chavolla et al reported that METS-IR was a promising tool for screening insulin sensitivity and a novel score for evaluating cardiometabolic risk in healthy and at-risk subjects.16 TyG-BMI and METS-IR include not only a lipid index and FBG but also an obesity index, BMI.
The correlation of TyG and TG/HDL-c with SUA in T2DM and their predictive value in discriminating HUA were higher than those of TyG-BMI and METS-IR. In Eastern China, one large-scale cross-sectional study showed that TG/HDL-c and TyG were significantly associated with HUA in both sexes.40 Another study based on the Chinese population found that METS-IR’s ability to identify metabolic unhealthy was not as good as that of TyG.41 Obesity plays a critical role in the pathophysiology of IR;42 thus, the combination of TyG with BMI should theoretically enhance the role of TyG. Bello-Chavolla et al also suggested that METS-IR had better diagnostic performance for incident T2DM than TyG and TG/HDL-c in Mexican subjects, which is mainly attributed to the addition of BMI to the calculation formula of METS-IR.16 However, our study showed a contrasting result. The contradiction may result from the drawback of BMI, which has a weak capacity to distinguish muscle and fat, especially in Asian individuals.43 In addition, the predictive value of TG/HDL-c (AUC 0.768) for HUA in T2DM is higher than that of TyG (AUC 0.693). IR and HUA are often accompanied by dyslipidemia, such as hypertriglyceridemia and low HDL-c levels.44,45 The mechanism of dyslipidemia and HUA requires large amounts of free fatty acids (FFAs) for triglyceride synthesis, and FFAs are associated with the de novo synthesis of purines and thus accelerate uric acid production.46 The relationship between FBG, one of the components of TyG, and the uric acid level was an inverted U-shape. When FBG increases to a certain threshold, elevated urine glucose levels lead to competitive inhibition of reabsorption of uric acid and increase the excretion of uric acid.40 Our subjects were type 2 diabetic patients, and their fasting blood glucose levels were higher than those in the general population. Due to the aforementioned mechanism, although TG/HDL-c is the simplest of the four indicators, it had the strongest correlation with HUA in our study.
There are some limitations of the present study. First, this was a cross-sectional observational study. A causal relationship cannot be established directly based on the results of this study. Second, we continuously collected all participants at a particular location over a period of time; thus, our participants are representative of hospitalized patients with T2DM but not the general population with T2DM. Indeed, prospective cohort studies are required to evaluate the predictive potential of the four non-insulin-based indexes of IR for the development of HUA in patients with T2DM. Third, we did not directly measure insulin indicators in all the study population, so we did not include HOMA-IR to compare with the four insulin resistance surrogates. Fourth, the lack of similar research makes it impossible to fully compare the results.
Conclusions
In conclusion, we showed that four non-insulin-based indexes of IR were significantly associated with HUA in patients with T2DM. We found that TG/HDL-c was the best marker among the four IR surrogates for the identification of HUA in T2DM. The present results not only further confirmed IR is a common risk factor for T2DM and HUA but also provided a simpler and more economical choice for distinguishing IR. Improving insulin resistance may be an important target for the treatment and prevention of HUA in patients with T2DM.
Funding
There is no funding to report.
Disclosure
Dr Rongfeng Han reports personal fees from Tianjin First Central Hospital, during the conduct of the study; personal fees from Tianjin First Central Hospital, outside the submitted work. The authors report no other conflicts of interest in this work.
References
1. Sheu W, Chan SP, Matawaran BJ, et al. Use of SGLT-2 inhibitors in patients with type 2 diabetes mellitus and abdominal obesity: an Asian perspective and expert recommendations. Diabetes Metab J. 2020;44(1):11–32. doi:10.4093/dmj.2019.0208
2. Shao Y, Shao H, Sawhney Monika S, et al. Serum uric acid as a risk factor of all-cause mortality and cardiovascular events among type 2 diabetes population: meta-analysis of correlational evidence. J Diabetes Complicat. 2019;33(10):107409. doi:10.1016/j.jdiacomp.2019.07.006
3. White J, Sofat R, Hemani G, et al. Plasma urate concentration and risk of coronary heart disease: a Mendelian randomisation analysis. Lancet Diabetes Endocrinol. 2016;4(4):327–336. doi:10.1016/S2213-8587(15)00386-1
4. Mallat SG, Al Kattar S, Tanios BY, et al. Hyperuricemia, hypertension, and chronic kidney disease: an emerging association. Curr Hypertens Rep. 2016;18(10):74. doi:10.1007/s11906-016-0684-z
5. Li C, Hsieh MC, Chang SJ. Metabolic syndrome, diabetes, and hyperuricemia. Curr Opin Rheumatol. 2013;25(2):210–216. doi:10.1097/BOR.0b013e32835d951e
6. Cicero AFG, Fogacci F, Giovannini M, et al. Interaction between low-density lipoprotein- cholesterolaemia, serum uric level and incident hypertension: data from the Brisighella Heart Study. J Hypertens. 2019;37(4):728–731. doi:10.1097/HJH.0000000000001927
7. Cho NH, Shaw JE, Karuranga S, et al. IDF diabetes atlas: global estimates of diabetes prevalence for 2017 and projections for 2045. Diabetes Res Clin Pract. 2018;138:271–281. doi:10.1016/j.diabres.2018.02.023
8. Balakumar P, Maung-U K, Jagadeesh G. Prevalence and prevention of cardiovascular disease and diabetes mellitus. Pharmacol Res. 2016;113:600–609. doi:10.1016/j.phrs.2016.09.040
9. Bardin T, Richette P. Impact of comorbidities on gout and hyperuricaemia: an update on prevalence and treatment options. BMC Med. 2017;15(1):123. doi:10.1186/s12916-017-0890-9
10. Yamada A, Sato KK, Kinuhata S, et al. Association of visceral fat and liver fat with hyperuricemia. Arthrit Care Res. 2016;68(4):553–561. doi:10.1002/acr.22729
11. Rudvik A, Mansson M. Evaluation of surrogate measures of insulin sensitivity-correlation with gold standard is not enough. BMC Med Res Methodol. 2018;18(1):64. doi:10.1186/s12874-018-0521-y
12. Borai A, Livingstone C, Kaddam I, et al. Selection of the appropriate method for the assessment of insulin resistance. BMC Med Res Methodol. 2011;11:158. doi:10.1186/1471-2288-11-158
13. Simental-Mendía LE, Rodríguez-Morán M, Guerrero-Romero F. The product of fasting glucose and triglycerides as surrogate for identifying insulin resistance in apparently healthy subjects. Metab Syndr Relat Disord. 2008;6(4):299. doi:10.1089/met.2008.0034
14. Er LK, Wu S, Chou HH, et al. Triglyceride glucose-body mass index is a simple and clinically useful surrogate marker for insulin resistance in nondiabetic individuals. PLoS One. 2016;11(3):e0149731. doi:10.1371/journal.pone.0149731
15. Fahim A, Gerald MR. Comparison of two methods using plasma triglyceride concentration as a surrogate estimate of insulin action in nondiabetic subjects: triglycerides × glucose versus triglyceride/high-density lipoprotein cholesterol. Metabolism. 2011;60(12):1673–1676. doi:10.1016/j.metabol.2011.04.006
16. Bello-Chavolla OY, Almeda-Valdes P, Gomez-Velasco D, et al. METS-IR, a novel score to evaluate insulin sensitivity, is predictive of visceral adiposity and incident type 2 diabetes. Eur J Endocrinol. 2018;178(5):533–544. doi:10.1530/EJE-17-0883
17. Alberti KGMM, Zimmet PZ. Definition, diagnosis and classification of diabetes mellitus and its complications. Part 1: diagnosis and classification of diabetes mellitus. Provisional report of a WHO Consultation. Diabetic Med. 1998;15(7):539–553. doi:10.1002/(SICI)1096-9136(199807)15:7<539::AID-DIA668>3.0.CO;2-S
18. Zhou JG. Chinese multi-disciplinary consensus on the diagnosis and treatment of hyperuricemia and its related diseases. Chin J Intern Med. 2017;56(3):235–248.
19. Levin A, Stevens PE, Bilous RW, et al. Kidney disease: improving global outcomes (KDIGO) CKD work group. KDIGO 2012 clinical practice guideline for the evaluation and management of chronic kidney disease. Kidney Int Suppl. 2013;3(1):1–150.
20. Wang XJ, Qian XW, Zhang X, et al. Association of serum uric acid with thyroid function in health check-up participants. Chin Med J. 2020;133(12):1409–1414. doi:10.1097/CM9.0000000000000840
21. Chinese association of physicians in nephrology. Guidelines for the diagnosis and treatment of renal hyperuricemia in China (2017 edition). Chin Med J. 2017;97(25):1927–1936.
22. Martínez-Sánchez FD, Vargas-Abonce VP, Guerrero-Castillo AP, et al. Serum uric acid concentration is associated with insulin resistance and impaired insulin secretion in adults at risk for type 2 diabetes. Prim Care Diabetes. 2021;15(2):293–299. doi:10.1016/j.pcd.2020.10.006
23. Blendea MC, Jacobs D, Stump CS, et al. Abrogation of oxidative stress improves insulin sensitivity in the Ren-2 rat model of tissue angiotensin II over expression. Am J Physiol- Endocrinol Metab. 2005;288(2):353–359.
24. Pino AD, DeFronzo RA. Insulin resistance and atherosclerosis: implicationsfor insulin sensitizing agents. Endocr Rev. 2019;40(6):1447–1467. doi:10.1210/er.2018-00141
25. Bjelakovic B, Stefanutti C, Bonic D, et al. Serum uric acid and left ventricular geometry pattern in obese children. Atheroscler Supp. 2019;40:88–93. doi:10.1016/j.atherosclerosissup.2019.08.035
26. Taniguchi Y, Hayashi T, Tsumura K, et al. Serum uric acid level was associated with an increased risk for hypertension but not for Type 2 diabetes. J Hypertens. 2001;19(7):1209–1215. doi:10.1097/00004872-200107000-00005
27. Caliceti C, Calabria D, Roda A, et al. Fructose intake, serum uric acid, and cardiometabolic disorders: a critical review. Nutrients. 2017;9(4):395. doi:10.3390/nu9040395
28. Roncal CA, Mu W, Croker B, et al. Effect of elevated serum uric acid on cisplatin induced acute renal failure. Am J Physiol Renal Physiol. 2007;292(1):116–122. doi:10.1152/ajprenal.00160.2006
29. Lv Q, Meng XF, He FF, et al. High serum uric acid and increased risk of type 2 diabetes: a systemic review and metaanalysis of prospective cohort studies. PLoS One. 2013;8(2):56–60.
30. Zhu Y, Hu Y, Huang T, et al. High uric acid directly inhibits insulin signaling and induces insulin resistance. Biochem Bioph Res Commun. 2014;447(4):707–714. doi:10.1016/j.bbrc.2014.04.080
31. Jalal DI, Jablonski KL, McFann K, et al. Vascular endothelial function is not related to serum uric acid in healthy adults. Am J Hypertens. 2012;25(4):407–413. doi:10.1038/ajh.2011.237
32. King C, Lanaspa MA, Jensen T, et al. Uric acid as a cause of the metabolic syndrome. Contrib Nephrol. 2018;192:88–102.
33. Baldwin W, McRae S, Marek G, et al. Hyperurieemia as a mediator of the proinflammatory endocrine imbalance in the adipose tissue in a murine model of the metabolic syndrome. Diabetes. 2011;60(4):1258–1269. doi:10.2337/db10-0916
34. Klisic A, Kavaric N, Ninic A. Predictive values of serum uric acid and alanine-aminotransferase for fatty liver index in Montenegrin population. J Med Biochem. 2019;38(4):407–417. doi:10.2478/jomb-2019-0001
35. Yuan HJ, Yang XG, Shi XY, et al. Association of serum uric acid with different levels of glucose and related factors. Chin Med J. 2011;124:1443–1448.
36. Sánchez-García A, Rodríguez-Gutiérrez R, Mancillas-Adame L, et al. Diagnostic accuracy of the triglyceride and glucose index for insulin resistance: a systematic review. Int J Endocrinol. 2020;2020:4678526. doi:10.1155/2020/4678526
37. Bittner V, Johnson BD, Zineh I, et al. The TG/HDL cholesterol ratio predicts all cause mortality in women with suspected myocardial ischemia a report from the Women’s ischemia syndrome evaluation (WISE). Am Heart J. 2009;157(3):548. doi:10.1016/j.ahj.2008.11.014
38. Van Linthout S, Spillmann F, Schultheiss HP, et al. High-density lipoprotein at the interface of type 2 diabetes mellitus and cardiovascular disorders. Curr Pharm Des. 2010;16(13):1504–1516. doi:10.2174/138161210791051031
39. Klisic A, Kavaric N, Ninic A. Serum cystatin C levels are associated with triglycerides/high-density lipoprotein cholesterol ratio in adolescent girls ages between 16–19 years old. Eur Rev Med Pharmacol Sci. 2020;24(20):10680–10686. doi:10.26355/eurrev_202010_23426
40. Liu XZ, Xu X, Zhu JQ, Zhao DB. Association between three non-insulin-based indexes of insulin resistance and hyperuricemia. Clin Rheumatol. 2019;38(11):3227–3233. doi:10.1007/s10067-019-04671-6
41. Yu X, Wang L, Zhang W, et al. The fasting triglycerides and glucose (TyG) index is more suitable for the identification of metabolically unhealthy individuals of Chinese adult population: a nationwide study. J Diabetes Investig. 2018;10:1050–1058.
42. Kojta I, Chacińska M, Błachnio-Zabielska A. Obesity, bioactive lipids, and adipose tissue inflammation in insulin resistance. Nutrients. 2020;12(5):1305. doi:10.3390/nu12051305
43. Bray GA, Smith SR, de Jonge L, et al. Effect of dietary protein content on weight gain, energy expenditure, and body composition during overeating: a randomized controlled trial. JAMA. 2012;307(1):47–55. doi:10.1001/jama.2011.1918
44. Shulman GI. Ectopic fat in insulin resistance, dyslipidemia, and cardiometabolic disease. New Engl J Med. 2014;371(12):1131–1141. doi:10.1056/NEJMra1011035
45. Peng TC, Wang CC, Kao TW, et al. Relationship between hyperuricemia and lipid profiles in US adults. BioMed Res Int. 2015;2015:127596. doi:10.1155/2015/127596
46. Matsuura F, Yamashita S, Nakamura T, et al. Effect of visceral fat accumulation on uric acid metabolism in male obese subjects: visceral fat obesity is linked more closely to overproduction of uric acid than subcutaneous fat obesity. Metabolism. 1998;47(8):929–933. doi:10.1016/S0026-0495(98)90346-8
 © 2022 The Author(s). This work is published and licensed by Dove Medical Press Limited. The
full terms of this license are available at https://www.dovepress.com/terms
and incorporate the Creative Commons Attribution
- Non Commercial (unported, 3.0) License.
By accessing the work you hereby accept the Terms. Non-commercial uses of the work are permitted
without any further permission from Dove Medical Press Limited, provided the work is properly
attributed. For permission for commercial use of this work, please see paragraphs 4.2 and 5 of our Terms.
© 2022 The Author(s). This work is published and licensed by Dove Medical Press Limited. The
full terms of this license are available at https://www.dovepress.com/terms
and incorporate the Creative Commons Attribution
- Non Commercial (unported, 3.0) License.
By accessing the work you hereby accept the Terms. Non-commercial uses of the work are permitted
without any further permission from Dove Medical Press Limited, provided the work is properly
attributed. For permission for commercial use of this work, please see paragraphs 4.2 and 5 of our Terms.
Recommended articles
Type 2 Diabetes Mellitus in a 7 Year Old Girl
Haris B, Stafrace S, Hussain K
International Medical Case Reports Journal 2022, 15:245-250
Published Date: 12 May 2022
Association Between Triglyceride-Glucose Index and Serum Uric Acid Levels: A Biochemical Study on Anthropometry in Non-Obese Type 2 Diabetes Mellitus Patients
Luo Y, Hao J, He X, Wang C, Zhao H, Zhang Z, Yang L, Ren L
Diabetes, Metabolic Syndrome and Obesity 2022, 15:3447-3458
Published Date: 3 November 2022
A Novel Metabolic Score for Insulin Resistance and Symptomatic Intracranial Hemorrhage in Ischemic Stroke Patients After Endovascular Thrombectomy
Chen S, E Y, Zhang X, Wei B, Wang S, Xu Z, Gong P, Xie Y, Qin C, Zhang Y
Neuropsychiatric Disease and Treatment 2023, 19:321-328
Published Date: 5 February 2023
Is Insulin Resistance a High-Risk Factor for Postmenopausal Endometrial Cancer: Insights from the Triglyceride Glucose (TyG) Index and the Metabolic Score for Insulin Resistance (METS-IR)
Gao S, Wang J, Wang T, Wang J
International Journal of Women's Health 2024, 16:2355-2363
Published Date: 27 December 2024
Insulin Resistance in GDM A1 vs Healthy Pregnancy: A Comparative Study Using METS-IR and TyG Index
Jiang H, Shang M, Gao S
International Journal of Women's Health 2025, 17:3789-3797
Published Date: 23 October 2025