Back to Journals » Clinical Interventions in Aging » Volume 17
Prevalence and Factors Influencing Sarcopenia Among Community-Dwelling Older Adults Using the Asian Working Group for Sarcopenia Definition
Authors He X, Song Y, Ma L, Ainsworth BE, Liu Y, Chen N ![]()
Received 1 September 2022
Accepted for publication 20 November 2022
Published 29 November 2022 Volume 2022:17 Pages 1707—1727
DOI https://doi.org/10.2147/CIA.S388319
Checked for plagiarism Yes
Review by Single anonymous peer review
Peer reviewer comments 3
Editor who approved publication: Dr Zhi-Ying Wu
Xiangfeng He,1,2,* Yanping Song,2,* Lin Ma,2,* Barbara E Ainsworth,3 Yu Liu,4 Nan Chen1,2,4
1Department of Rehabilitation, Xinhua Hospital Affiliated to Shanghai Jiaotong University School of Medicine, Shanghai, People’s Republic of China; 2Department of Rehabilitation, Xinhua Hospital Chongming Branch, Shanghai, People’s Republic of China; 3College of Health Solutions, Arizona State University, Phoenix, AZ, USA; 4School of Kinesiology, Shanghai University of Sport, Shanghai, People’s Republic of China
*These authors contributed equally to this work
Correspondence: Yu Liu, School of kinesiology, Shanghai University of Sport, No. 399 Changhai Road, Yangpu District, Shanghai, People’s Republic of China, Tel +86-21-65507860, Email [email protected] Nan Chen, Department of Rehabilitation, Xinhua Hospital Affiliated to Shanghai Jiaotong University School of Medicine, No. 1665 Kongjiang Road, Yangpu District, Shanghai, People’s Republic of China, Email [email protected]
Objective: This study aimed to explore the prevalence and impact of related factors for sarcopenia among community-dwelling older people in Chongming district, China, according to the diagnostic criteria of the Asia Working Group for Sarcopenia-2019.
Methods: We conducted a cross-sectional study from April 2021 to December 2021. Diagnosis of sarcopenia (non-sarcopenia, possible sarcopenia, sarcopenia, and severe sarcopenia) was based on appendicular skeletal muscle mass index, handgrip strength, gait speed, and the 5-time chair stand test. Staff collected all subjects’ clinical and sociodemographic characteristics, cardiovascular disease (CVD) risk factors, inflammatory markers, physical activity (PA), and daily lifestyle activities to identify sarcopenia-related factors.
Results: A total of 1407 older people aged ≥ 65 years were enrolled into the study (58.7% female). The prevalence of confirmed sarcopenia was 19.6% (17.1% in females and 23.1% in males). The prevalence of possible sarcopenia, sarcopenia, and severe sarcopenia were 19.7% (22.2% in females, 16.2% in males), 11.9% (10.1% in females, 14.5% in males), and 7.7% (7% in females, 8.6% in males), respectively. Increasing age, gender, depression status, and high-fat mass were associated with an increased likelihood of sarcopenia in all subjects. In females, living alone, high-fat mass, lower body mass index (BMI), lower body weight, and have no time spent doing housework increased the likelihood of sarcopenia. In males, depression status, high-fat mass, higher neutrophils-to-lymphocytes ratio (NLR), lower BMI, lower body weight increased the likelihood of sarcopenia.
Conclusion: Our study showed a high prevalence of sarcopenia among community-dwelling older people in the Chongming district. Detection, prevention, and treatment efforts are needed to reduce the impact of sarcopenia in older, rural communities in China.
Keywords: sarcopenia, prevalence, risk factor, older people, rural area
Introduction
Sarcopenia is a progressive and generalized geriatric syndrome characterized by accelerated loss of muscle mass, strength, and performance.1 It occurs commonly as an age-related process in older people.2 It is estimated that sarcopenia affects 5–13% of people aged 60–70 years (y), increasing to 11–50% for those aged 80 y or older.3 Sarcopenia is increasingly recognized as a serious, global public health concern that causes substantial economic and social burdens. It is associated with falls and fractures,4 functional decline,5 cardiovascular disease (CVD),6 and premature death,7 increasing healthcare costs.8 In 2000, the USA’s direct health care costs for sarcopenia were nearly $18.5 billion.9 Clinical staff should focus on screening for sarcopenia for all older people and, for those with sarcopenia, provide appropriate treatment to delay the progression of sarcopenia.
China is facing many serious challenges related to aging. As one of the fastest-aging countries globally, China had 190.64 million older people ≥ 65 y in 2020, accounting for 18.7% of the total population.10 The Chongming district of Shanghai is the third largest island in China. This district is one of the areas with the highest aging population in Shanghai. In 2021, 189,024 people ≥ 65 y lived in Chongming district, accounting for 29.6% of the total population. Compared with 2011, the proportion of older people increased by 11.7%. The growing aging population exacerbates the high prevalence of sarcopenia, which brings individuals and society a substantial financial burden.
The prevalence of sarcopenia varies across studies because of differences in study populations (such as gender, age, and ethnicities), living environments (urban vs rural), measurement methods, and diagnostic criteria. Yang et al11 compared the prevalence of sarcopenia in 483 Chinese community-dwelling older people using five criteria to determine sarcopenia: the European Working Group on Sarcopenia in Older People-2011 (EWGSOP-2011), the European Working Group on Sarcopenia in Older People-2014 (EWGSOP-2014), the Asia Working Group for Sarcopenia (AWGS-2014), the International Working Group on Sarcopenia (IWGS), and the National Institutes of Health (FNIH) Sarcopenia Project criteria. They noted the prevalence of sarcopenia defined by EWGSO-2014 (4.6%) was lower than the prevalence of sarcopenia defined by EWGSOP-2011 (15.7%), AWGS-2014 (9.1%), and IWGS (16.1%) criteria. They also noted the prevalence of sarcopenia was higher using the EWGSO-2014 criteria (4.6%) than the FNIH criteria (3.3%). Gao et al12 compared the prevalence of sarcopenia in 887 community-dwelling older people in western China and found that the rural elderly were more likely to suffer from sarcopenia than the urban elderly. Many factors, such as low body mass index (BMI), increasing age, poor nutritional status, and smoking are related to sarcopenia.13 However, these sarcopenia-related factors may differ from other studies due to diverse cultures, living environments, and lifestyles. Therefore, it is necessary to investigate sarcopenia’s prevalence and sarcopenia-related factors among different Chinese populations to provide practical strategies for prevention and treatment.
There are few studies on the prevalence of sarcopenia in older Chinese people, especially in rural areas.12 Accordingly, large-scale cross-sectional studies are needed to identify the prevalence of sarcopenia in older Chinese populations. The studies can increase the awareness of sarcopenia in older people and in clinical staff working in community health centers. They also can inform timely and effective treatments for those with sarcopenia. Our study’s primary aim was to conduct a large-scale cross-sectional study to explore the prevalence of sarcopenia among community-dwelling older people in the Chongming district of Shanghai, China using AWGS-2019 criteria. The secondary aim was to identify the likelihood of sarcopenia based on subjects’ clinical and sociodemographic characteristics, CVD risk factors, inflammatory markers, physical activity (PA), daily lifestyle activities, and by gender in this population.
Materials and Methods
Study Design and Subjects
We conducted a cross-sectional study from April 2021 to December 2021 in the Chongming district of Shanghai, China. Two towns (Chengqiao Town and Sanxing Town) were selected at random from 16 towns and had a similar age group distributions and gender ratios. We used a computer-generated random list to select seven communities from these two towns (5 communities from Chengqiao Town and two communities from Sanxing Town). To aid in subject recruitment, we conducted sarcopenia-related health education courses and distributed brochures on sarcopenia in both communities before recruitment. Inclusion criteria were: (1) ages ≥ 65 y; (2) lived in one of the two towns of the Chongming District; and (3) willing to participate in this study. Exclusion criteria were: (1) suffering from severe cognitive impairment, mental illness, or other neurodegenerative disorders; (2) had severe hearing impairment, visual impairment, or communication difficulties; and (3) had physical disabilities or suffering from dyskinesia disease that made one unable to walk independently and perform the handgrip strength test, 6-meter gait speed test and five times sit to stand test. All those eligible for inclusion but not eligible for exclusion were invited to participate in our study. The subjects signed informed consent forms after agreed to participate our study. Figure 1 shows the recruitment decisions for inclusion and exclusion.
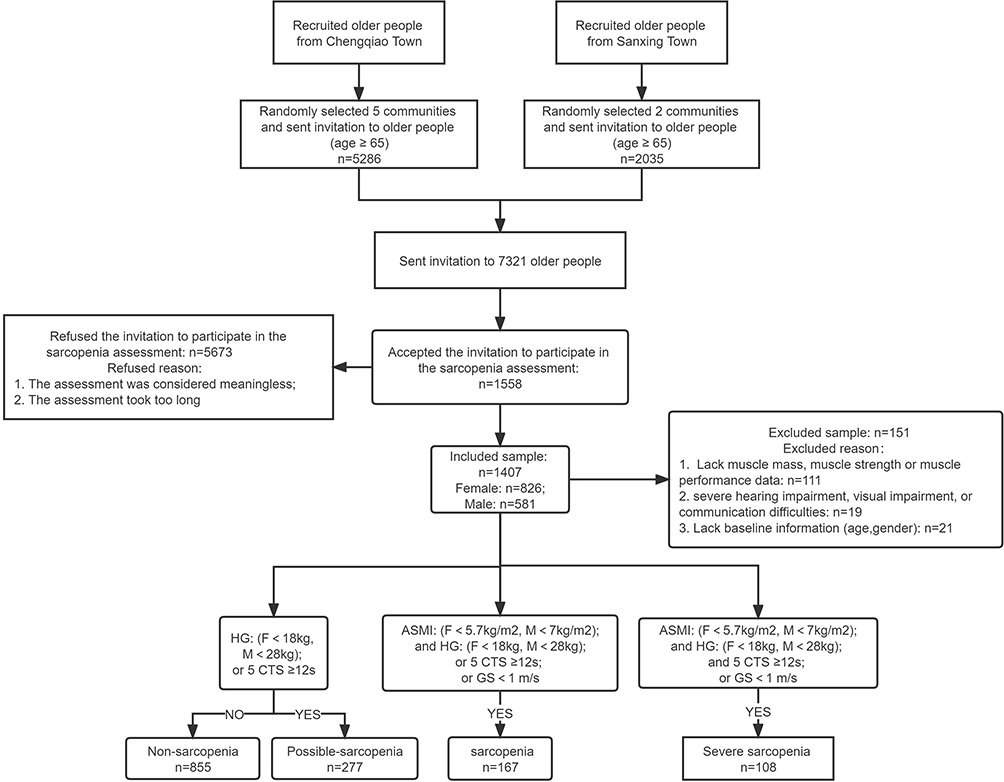 |
Figure 1 Flow of subjects in the study stand test. Abbreviations: F, female; M, male; HG, handgrip strength; GS, gait speed; ASMI, appendicular skeletal muscle mass index; 5-CTS, 5-time chair We have revises it. |
Definition of Possible Sarcopenia, Sarcopenia, and Severe Sarcopenia
We defined sarcopenia status according to the diagnostic criteria of AWGS-201914 (Figure 1). Possible sarcopenia was defined as low skeletal muscle strength or low muscle performance. Sarcopenia was defined as low skeletal muscle mass and low muscle strength or low physical performance. Severe sarcopenia was defined as low skeletal muscle mass, low muscle strength, and low muscle performance. The remaining subjects were classified as non-sarcopenia.
Upper and lower skeletal muscle mass in kilograms (kg) was measured by bioelectrical impedance analysis (Inbody 720, Korea). Appendicular skeletal muscle mass (ASM) in kg was defined as the sum of the skeletal muscle mass of the upper and lower limbs. The appendicular skeletal muscle mass index (ASMI) was calculated as ASM divided by weight in kg divided by height in meters (m) squared (kg/m2). The definition of low muscle mass was ASMI <7.0 kg/m2 for males and <5.7 kg/m2 for females.
Handgrip strength (HG) in kg was assessed using a hand dynamometer (Jamar Plus+ Digital Hand Dynamometer; IL, USA). HG strength was measured sequentially on the dominant hand three times, with the highest value in kg recorded. Low HG strength was defined as HG <28 kg for males and <18 kg for females.
Gait speed (GS) and the 5-time chair stand test (5-CTS) assessed physical performance. GS was measured by recording the time (in seconds, s) it took to walk 6-meters. The test was performed twice and the average speed was recorded. The 5-CTS required subjects to stand from a sitting position in a chair (without arms) five times as quickly as possible. Speed was measured in seconds. The test was conducted three times, with a 1-minute break between each test, and the average speed was recorded. Low physical performance was defined as a GS <1 meter per second (m/s) or 5-CTS ≥ 12s.
Data Collection
Data were collected after subjects completed their national free physical examination program at a community health center. All measures were obtained by study staff trained to conduct face-to-face questionnaire surveys and collect physical measures.
Subject Characteristics
Clinical characteristics included age group (65–69, 70–74, 75–79, ≥ 80 y), gender, body weight, body mass index (BMI), nutritional status, cognitive status, and depression status. Sociodemographic characteristics included educational attainment, living status, smoking habits, alcohol drinking habits, fall history, and farming. Farming refers to older people who did farming and fishing for work. PA and daily lifestyle activities include habitual exercise, daily activities, and structured PA.
Assessment of Nutritional Status
Nutritional status was assessed using the Mini Nutritional Assessment (MNA).15 The MNA consists of four assessment domains and each domain item was assigned points according to the answer given, and the total score was the sum of 24 items, ranging from 0 to 30 points. A total score of < 17 points indicates malnutrition; 17 to 23.5 points indicate a risk of malnutrition, and ≥ 24 points reflect a normal nutritional status. The MNA takes 10 minutes to complete.
Assessment of Cognitive Function and Depressive Symptom
The Mini-Mental State Examination (MMSE) is an 11-item screening tool to evaluate cognitive function in community-dwelling, hospitalized, and institutionalized older adults.16 The score ranges from 0 to 30 points, with higher scores indicating a better cognitive function. A score of ≤ 17, 20, or 24 points for illiterate, elementary school, and college students indicates cognitive impairment.
Depression was evaluated using the short-form 15-item Chinese version of the Geriatric Depression Scale (GDS-15).17 The GDS-15 has 15 items that ask subjects to respond yes (1 point) or no (0 points) about how they felt over the past week. With a maximum score of 15 points, higher scores indicate more obvious depressive symptoms. We used a cut-off score of 5 and above to define depressive symptoms for this study.18
Assessment of Anthropometric Factors
Fat mass in kg was measured using bioelectrical impedance (BIA). Waist and hip circumference were measured in cm using cloth tape measures centered around the umbilicus (waist circumference) and mid-hip level (hip circumference). Waist-to-hip ratio (WHR) was calculated by dividing waist circumference by hip circumference.
Assessment of CVD Risk Factors and Inflammatory Markers
Six CVD risk factors were studied. Anthropometric risk factors were high-fat mass (≥ 35% in females and ≥ 25% in males),19 high waist circumference (≥ 88 cm in females and ≥ 102 cm in males),20 and high WHR (≥ 0.8 in females and ≥ 0.95 in males).21 A circulatory risk factor was hypertension, defined as a systolic blood pressure of ≥ 140 mmHg, a diastolic blood pressure of ≥ 90 mmHg, or taking antihypertensive drugs at the baseline measurement. Metabolic risk factors were type 2 diabetes and hypercholesterolemia. Subjects were considered to have type 2 diabetes if they had a previous diagnosis of type 2 diabetes, fasting glucose ≥ 7 millimole per liter (mmol/l),22 or taking antidiabetic medication at the baseline visit.23 Hypercholesterolemia was defined as a total serum cholesterol ≥ 6.2 mg/dL or taking hypercholesterolemia medication at baseline.24
Inflammatory markers were the white blood cell count (WBC) and its subtypes (lymphocytes, monocytes, neutrophils, and eosinophils), platelet count, neutrophils-to-lymphocytes ratio (NLR), and platelet-to-lymphocytes ratio (PLR). Blood sample (5mL) were obtained by clinic nurses from peripheral venipuncture and analyzed by standardized chemical analysis in a biochemistry laboratory.
Assessment of Physical Activity and Daily Lifestyle Activities
PA was assessed using the short form of the International Physical Activity Questionnaire (IPAQ-SF) in the Chinese language25 and a daily lifestyle activities questionnaire developed for this study. The IPAQ-SF consists of 7 items identifying minutes of activity per day (min/d) and events per week (events/wk) of vigorous- and moderate-intensity PAs, walking, and hours per day (h/d) of sitting. The IPAQ-SF total score is in MET-minutes per week (MET-min/wk). The IPAQ-SF continuous score is determined by multiplying the MET level x min/d x events/wk for vigorous- and moderate-intensity PAs and walking. Following the IPAQ scoring guidelines, min/day PA values are truncated at 3 hours (180 minutes) to avoid over-reporting PA duration in a single day. MET levels for PAs are vigorous (8 METs), moderate (4 METs), and walking (3.3 METs). The total score is computed by summing the MET-min/wk for vigorous- and moderate-intensity PAs and walking. The IPAQ-SF takes about 5 minutes to complete. Following the IPAQ scoring guidelines, the IPAQ-SF categorical score identifies three levels of PA: highly active, moderately active and low active.
Daily lifestyle activities (in h/day) were assessed by questionnaires self-administered and it included habitual exercise (brisk walking, running, and resistance training) and daily activities (housework, sleep, and sitting). Housework included light housework (tidying, dusting), straightening and cleaning up, shopping, heavy housework, farming, and home repairs. Engaging in daily lifestyle activities was defined as consistently (> 1 year) engaging in exercise or daily activities at least three events/wk for more than 20 min/event.
Ethics Statement
This study was approved by the Ethics Committee at Xinhua hospital Chongming branch. All subjects read and signed an informed consent form before enrolling in the study. This study had complied with the Declaration of Helsinki.
Statistical Analysis
Subjects were classified into two major groups, each with two subgroups: without sarcopenia (non-sarcopenia and possible sarcopenia) and confirmed sarcopenia (sarcopenia and severe sarcopenia). Prevalence data and categorical variables are presented as numbers and percentages. Continuous variables are presented as means and standard deviations (M±SD) and means and standard errors (M±SE). The normality of continuous variables was determined using the Shapiro–Wilk test. The Mann–Whitney, Kruskal–Wallis test (continuous data), and the Pearson chi-squared test (categorical data) were performed to compare sarcopenia-related factors (clinical and sociodemographic characteristics, CVD risk factors, inflammatory markers, PA, and daily lifestyle behaviors) between the gender and the different sarcopenia statuses. Sarcopenia-related factors with a p-value < 0.1 between non-sarcopenia and confirmed sarcopenia status in the total sample were included in multivariate logistic regression analysis models (separately for the total sample and by gender) to quantify the added risks or protection of sarcopenia-related factors. Possible sarcopenia-related factors with a p-value < 0.1 between non-sarcopenia and possible sarcopenia status in the total sample were included in multivariate logistic regression analysis models to quantify the possible sarcopenia-related risks factors. The regression models were performed with forward stepwise selection. Multiple imputations were used to assess the sensitivity of results to missing values. Odds ratios (OR) and 95% confidence intervals (CI) were computed and the Hosmer-Lemshow test (H-L test) was used to determine the goodness-of-fit for the logistic regression models. P<0.05 indicates statistical differences. Statistical analyses were performed using the SPSS version 22 statistical package (IBM, Armonk, NY, USA).
Results
The Prevalence of Confirmed Sarcopenia
A total of 7321 community-dwelling older people (age ≥ 65 y) participating in the national free physical examination program from April 2021 to December 2021 in these communities were invited to participate in a comprehensive sarcopenia assessment (5286 people from Chengqiao Town and 2035 people from Sanxing Town). Overall, 1558 older people agreed to participate in the sarcopenia assessment (21.3% response rate) and we obtained complete data on 1407 older people. 275 out of 1407 older people screened were sarcopenics according to AWGS-2019 criteria. The overall prevalence of confirmed sarcopenia was 19.5% (17.1% in females and 23.1% in males) (Table 1).
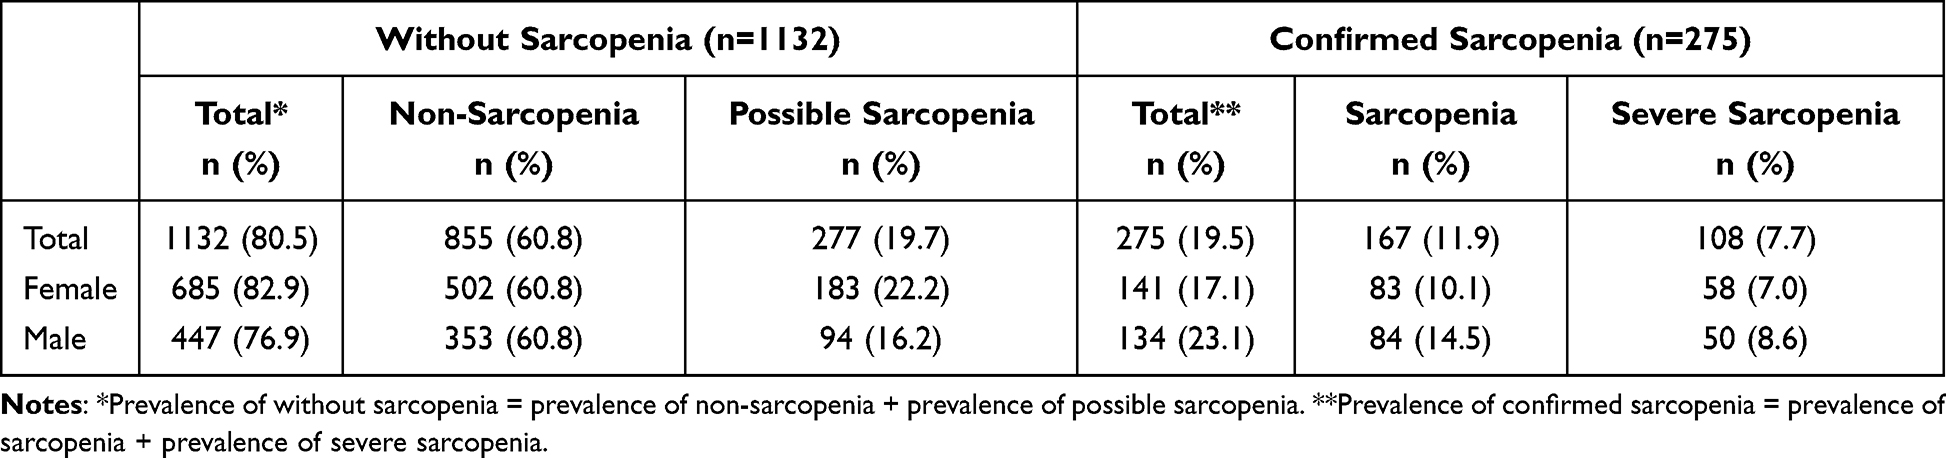 |
Table 1 The Prevalence of Sarcopenia Status for the Full Sample and by Gender |
Confirmed sarcopenia status increased rapidly with age, ranging from 12.1% in the 65–69 y to 41.8% in those ≥ 80 y. The subjects without sarcopenia decreased rapidly with age, ranging from 87.9% in the 65–69 y to 58.2% in those ≥ 80 y. Prevalence for confirmed sarcopenia was higher in males than females in all age groups. In females, confirmed sarcopenia ranged from 10.4% in the 65–69 y age group to 39.3% in the ≥ 80 y age group. In males, confirmed sarcopenia ranged from 15.1% in the 65–69 y age group to 44.7% in the ≥ 80 y age group (Table 2 and Figure 2).
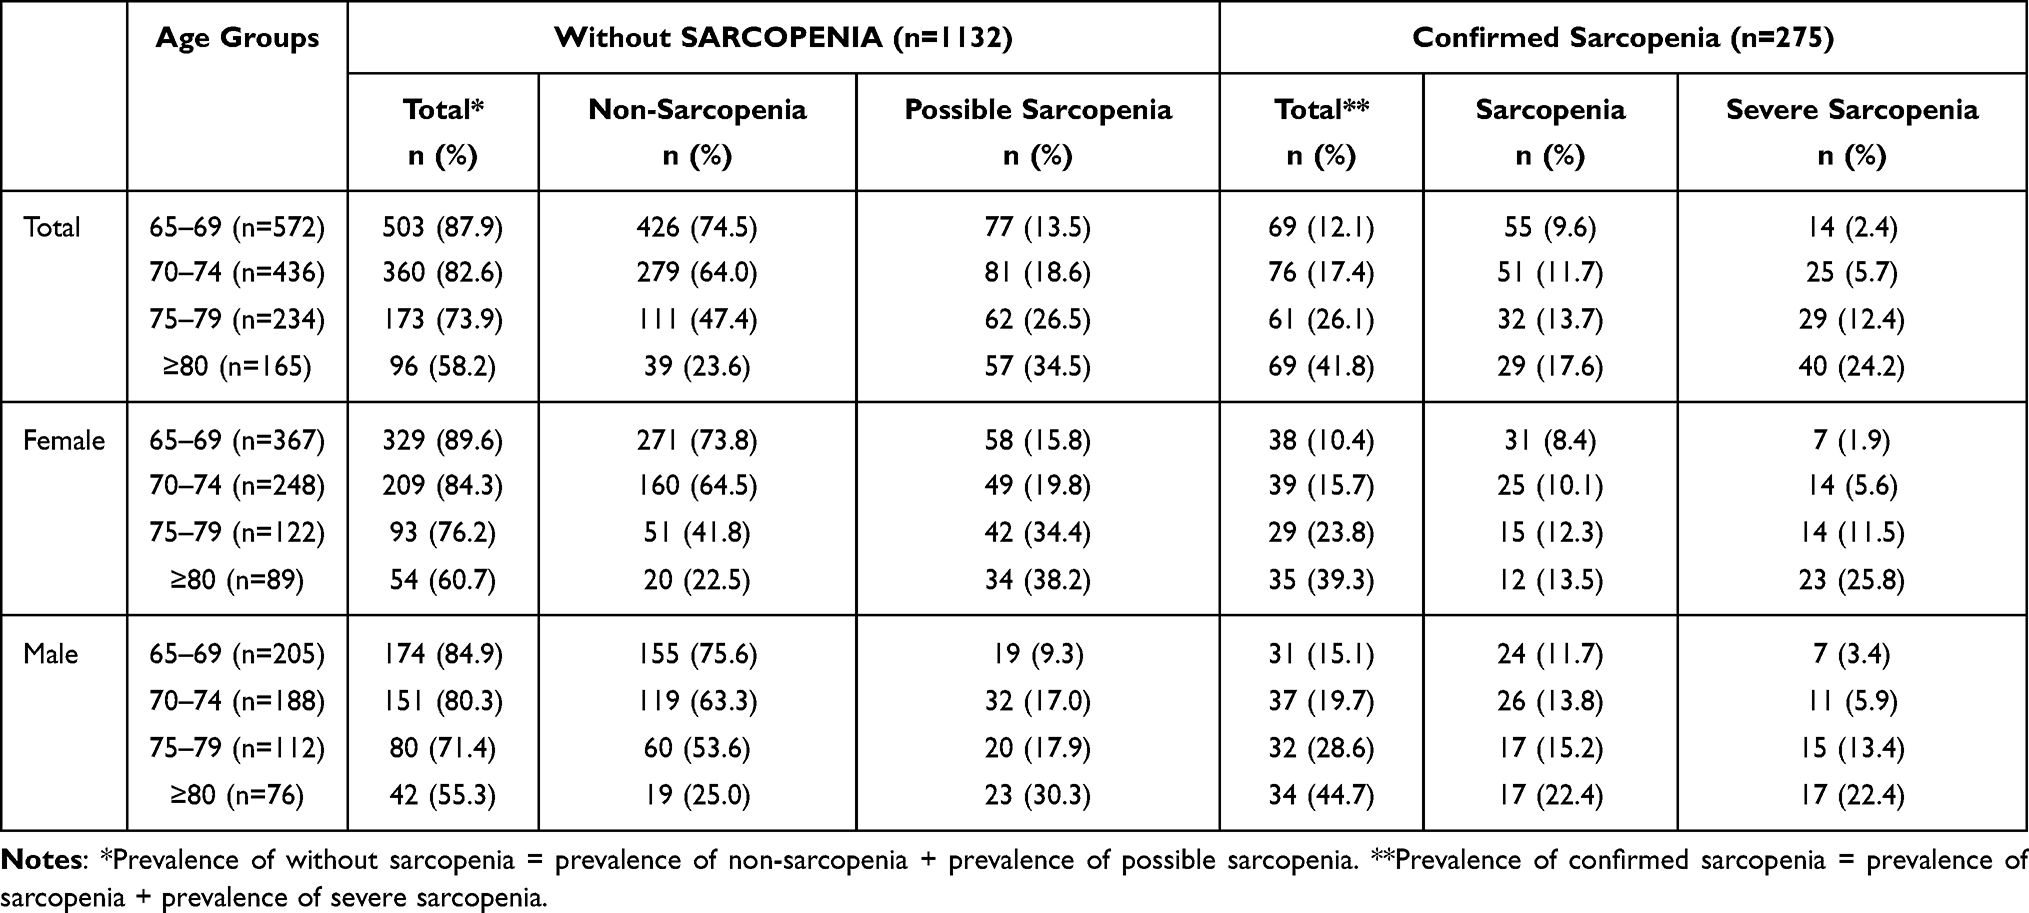 |
Table 2 The Prevalence of Sarcopenia Status by Age Groups and Gender |
 |
Figure 2 Prevalence of sarcopenia in all subjects, female subjects and male subjects among different age groups. The numbers at the top of each bar are the sample percentages in each category. |
The Prevalence of Possible Sarcopenia, Sarcopenia, and Severe Sarcopenia
The proportions of subjects with any sarcopenia status were possible sarcopenia (19.7%), sarcopenia (11.9%), and severe sarcopenia (7.7%). Possible sarcopenia had the highest prevalence in all age groups, ranging from 13.5% in the 65–69 y to 34.5% in ≥ 80 y. The prevalence of sarcopenia was 9.6% in the 65–69 y to 17.6% in ≥ 80 y. The prevalence of severe sarcopenia was lowest in the 65–69 age group (2.4%) and increased exponentially in the ≥ 80 age group (24.2%) (Table 2 and Figure 2).
Comparing sarcopenia diagnosis by age and gender showed similar graded increases in sarcopenia status by age groups (Table 2 and Figure 2). The prevalence of possible sarcopenia was lower in males than females in all age groups. Sarcopenia and severe sarcopenia prevalence were higher in males than females in all age groups. In females, possible sarcopenia, sarcopenia, and severe sarcopenia prevalence increased steeply with age. Comparing prevalence values in the 65–69 y age group to the ≥ 80 y age group showed increases in possible sarcopenia from 15.8% to 38.2%. Sarcopenia increased with age from 8.4% to 13.5%, and severe sarcopenia increased with age from 1.9% to 25.8%. In males, the prevalence of sarcopenia increased steeply with age for all sarcopenia status. The range of prevalence values for the 60–69 y age group to the ≥ 80 age group for possible sarcopenia was 9.3% to 30.3%. The range of sarcopenia and severe sarcopenia was 11.7% to 22.4% and 3.4% to 22.4%, respectively.
Clinical and Sociodemographic Characteristics of Study Subjects
Significant differences in the sarcopenia-related factors were observed between the without sarcopenia (non-sarcopenia and possible sarcopenia) and confirmed sarcopenia (sarcopenia and severe sarcopenia) groups for mean age, age group, gender, weight, BMI, nutritional status, depressive scores, educational attainment, and smoking status (p<0.05) (Table 3). Similar differences were observed between the non-sarcopenia and possible sarcopenia status (mean age, age group, gender, BMI, cognitive status, depression, educational attainment, drinking status, farming, and fall history) (P<0.05). Comparison by sarcopenia status (possible sarcopenia, sarcopenia, and severe sarcopenia) showed significant differences in mean age, age group, gender, weight, BMI, nutritional status, cognitive status, depression, smoking status, and fall history (p<0.05). On average, subjects with severe sarcopenia were older, predominantly female, and had a higher proportion with lower cognitive status, and higher fall history.
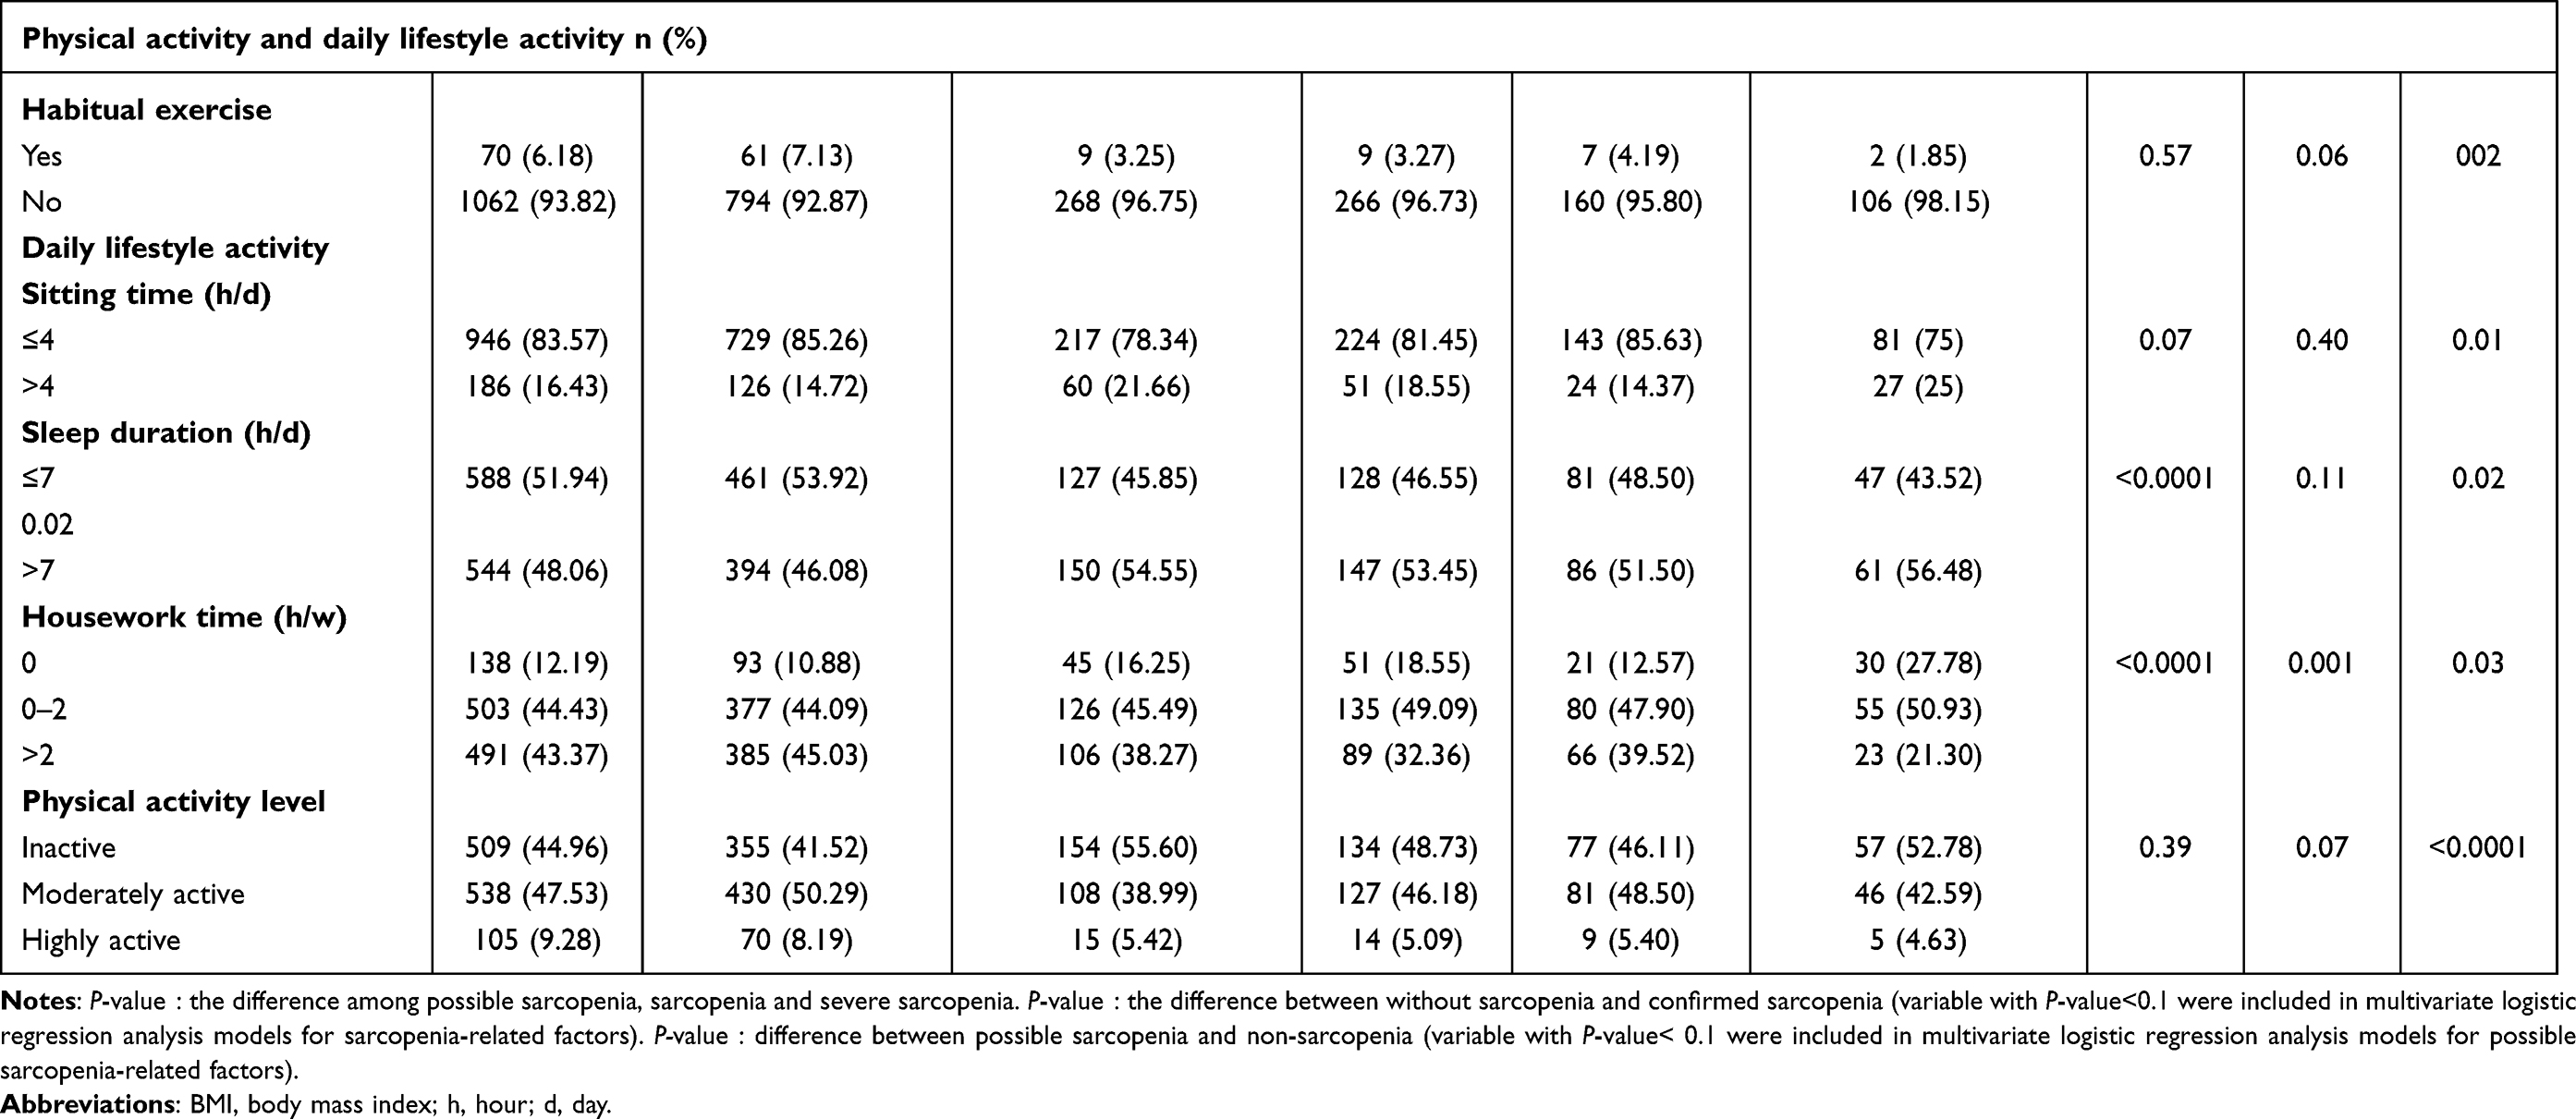 |
Table 3 Prevalence and Mean (± SD) Values for Clinical and Sociodemographic Characteristics by Sarcopenia Status |
CVD and Inflammatory Markers
Comparisons between the without sarcopenia and confirmed sarcopenia groups showed significant differences in the proportions with a high waist circumference, high WHR, high-fat mass, and mean values for lymphocytes and NLR (p<0.05) (Table 3). Differences between the possible sarcopenia and non-sarcopenia status were observed for the proportions with high waist circumference and fat mass, and mean values for NLR and PLR (p<0.05). Comparison by sarcopenia status (possible sarcopenia, sarcopenia, and severe sarcopenia) showed significant differences for the proportions with high waist circumference, WHR, and fat mass (p< 0.05). Proportions with a high waist circumference and WHR were highest in the possible sarcopenia status. Proportions with high-fat mass and mean NLR values were highest in the severe sarcopenia status. Mean PLR values were highest in the sarcopenia status.
Physical Activity and Daily Lifestyle Activities
The only significant difference between the without sarcopenia and confirmed sarcopenia groups was the time spent in housework (p<0.05) (Table 3). Subjects with possible sarcopenia differed from those with non-sarcopenia in the proportions reporting habitual exercise, time spent sitting, sleeping, and housework, and in the PA tertiles. (P<0.05). Sarcopenia status (possible sarcopenia, sarcopenia, and severe sarcopenia) differed in the time spent sleeping and doing housework (p<0.05).
As shown in Figure 3A, the average PA MET-min/wk was highest in the non-sarcopenia status and was significantly lower in possible sarcopenia, sarcopenia and severe sarcopenia (p<0.05). Based on Figure 3B, the proportion engaging in high PA was highest in the non-sarcopenia status and decreased stepwise with increasing severity of sarcopenia. Among those with severe sarcopenia, most subjects engaged in low PA and decreased their participation in a stepwise pattern with increasing PA levels.
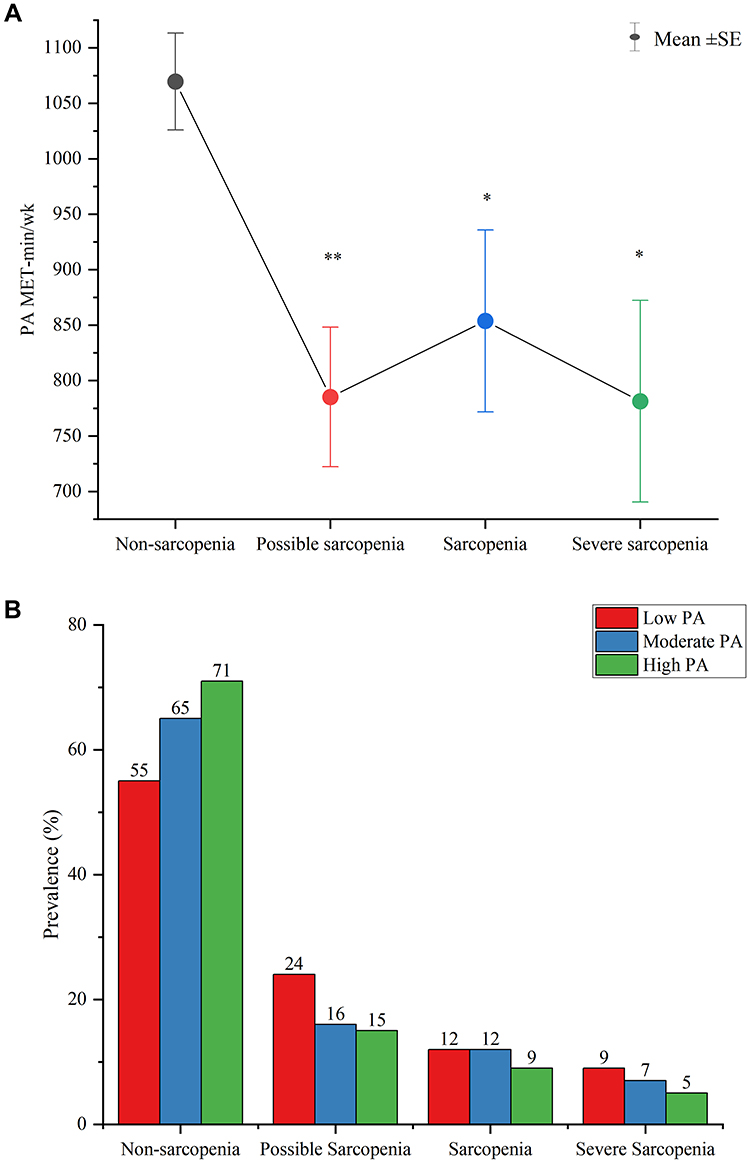 |
Figure 3 (A) Mean ± SE for MET-min/wk of physical activity in subjects with non-sarcopenia, possible sarcopenia, sarcopenia, and severe sarcopenia. Statistical comparisons are made with the non-sarcopenia group, *p<0.05, **p<0.01; (B) The sample proportion in low-, moderate-, and high physical activity categories among subjects with non-sarcopenia, possible sarcopenia, sarcopenia, and severe sarcopenia. The numbers at the top of each bar are the sample percentages in each category. |
Table 4 presents differences in sarcopenia-related factors between subjects without sarcopenia and confirmed sarcopenia for males and females. Differences in sarcopenia status were significant in each gender for age, age group, weight, BMI, nutritional status, high WHR, high fat mass, and daily lifestyle activities (p<0.05). In males, differences also were significant for depressive status, drinking frequency, farming, fall history, diabetes, lymphocytes, NLR, PLR, and habitual exercise (p< 0.05). In females, differences also were significant for cognitive status, living alone, high waist status, and eosinophils (p<0.05).
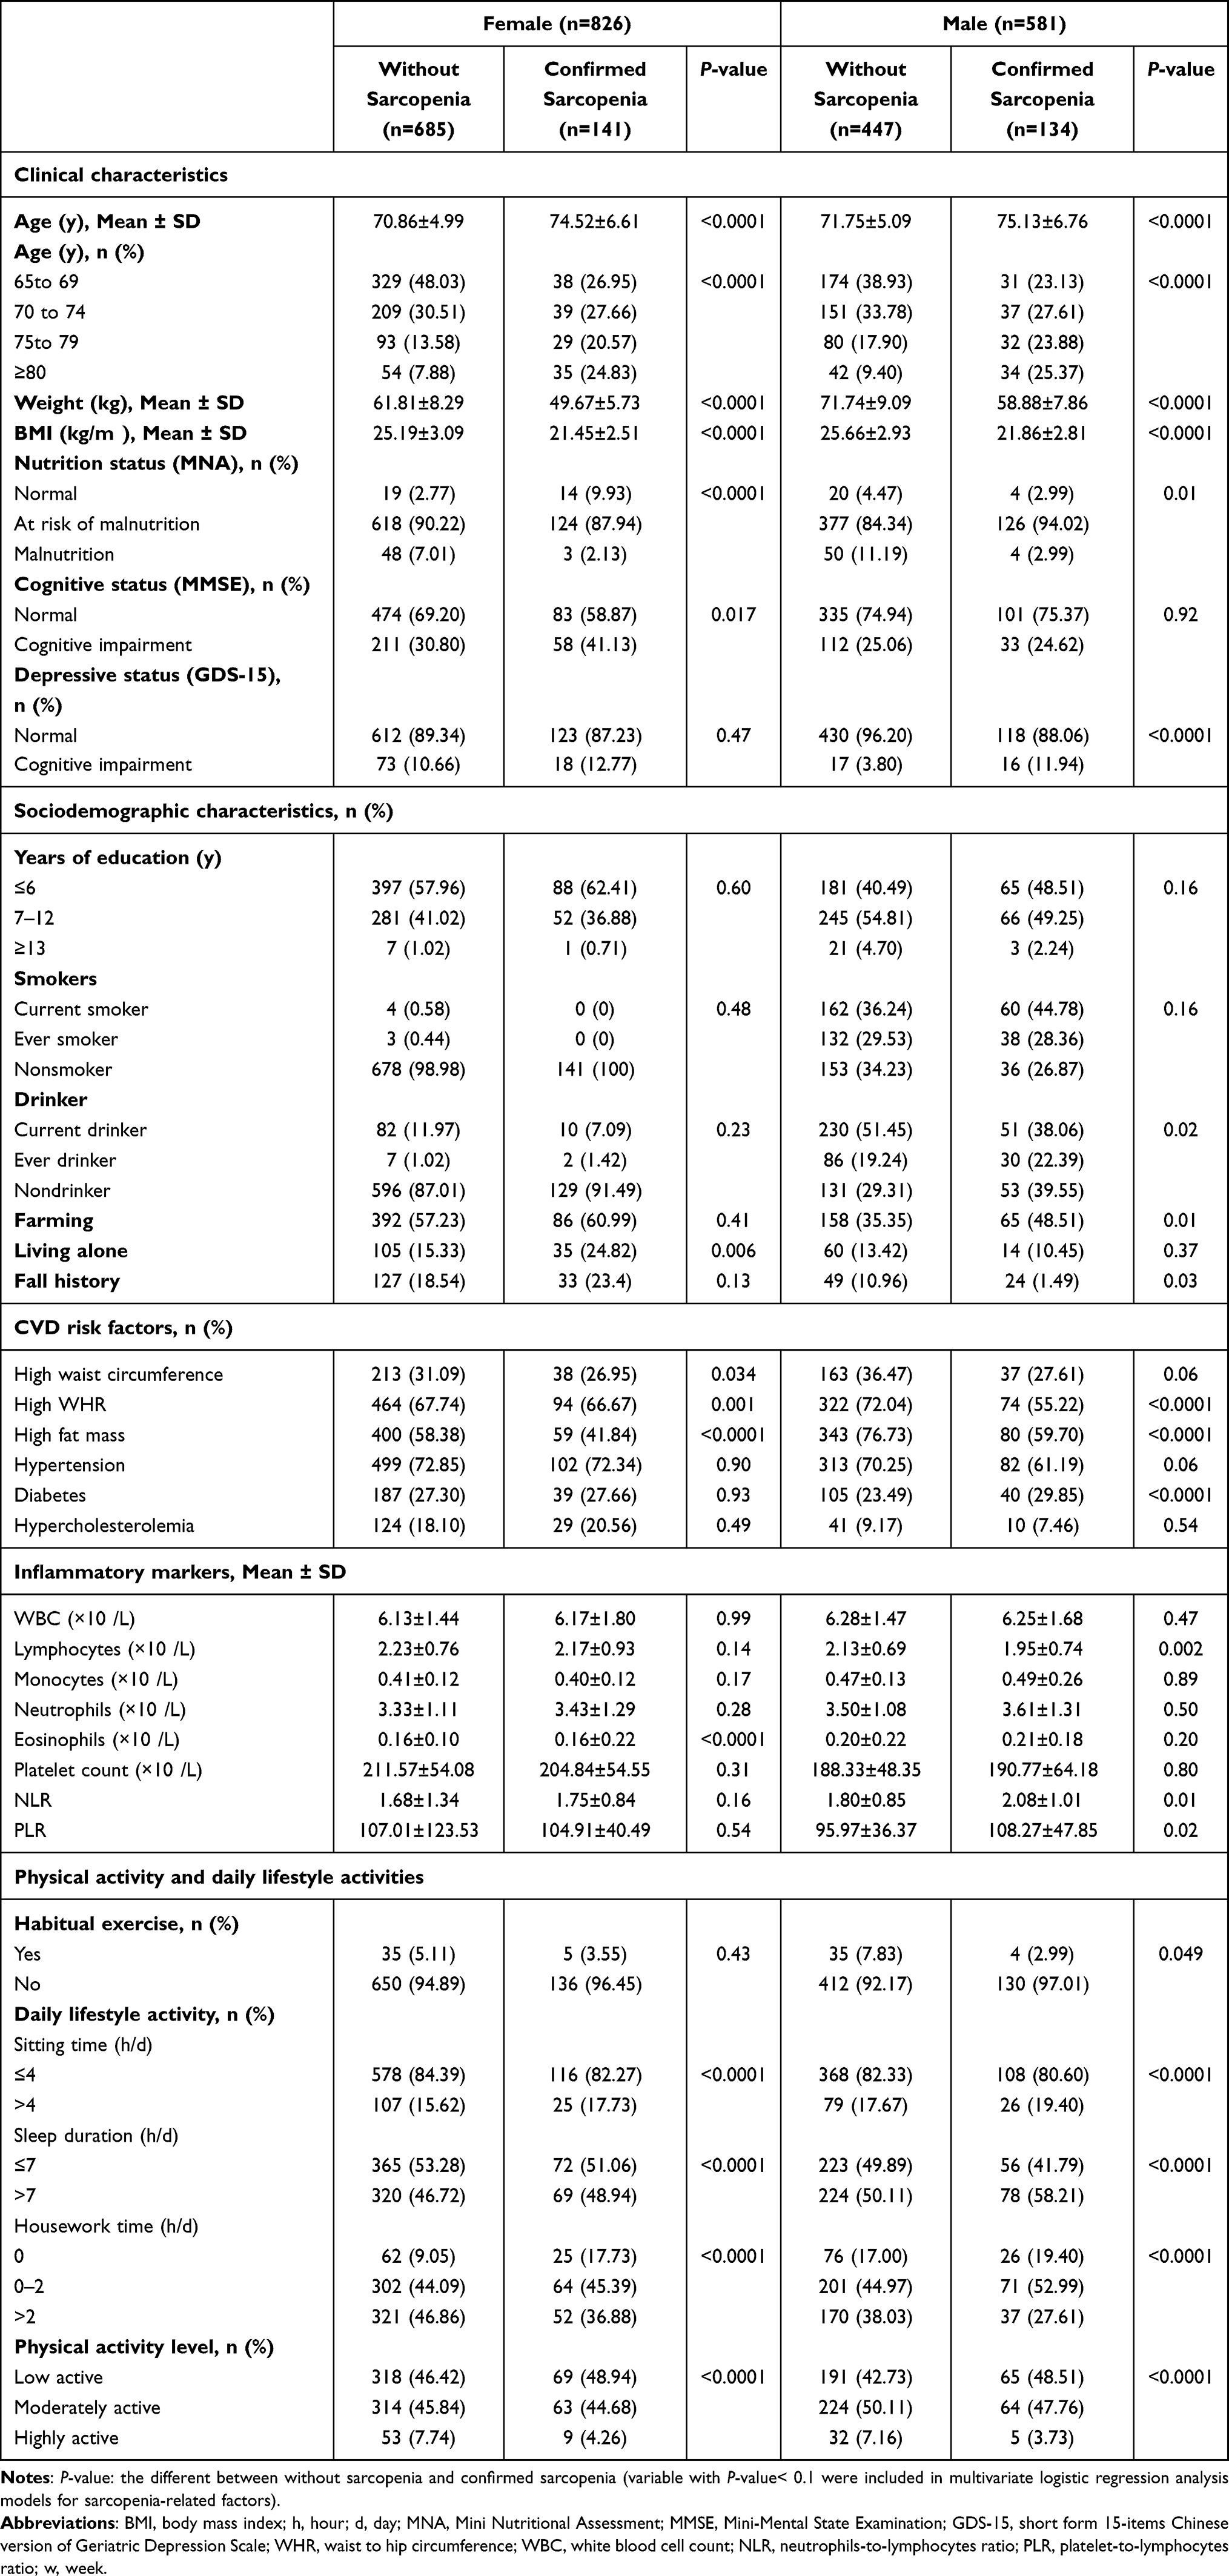 |
Table 4 Prevalence and Mean (± SD) Values for Sarcopenia-Related Factors Sarcopenia Category and Gender |
Multivariate Analysis of Sarcopenia-Related Factors for Sarcopenia and Possible Sarcopenia
Table 5 shows that sarcopenia-related factors increasing the likelihood of sarcopenia were being over 70 y (compared to 65–69 y), male gender, and having higher depression scores. Sarcopenia-related factors decreasing the likelihood of sarcopenia were having higher body weights, higher BMI, higher fat mass, and engaging in housework. Related factors increasing the likelihood of possible sarcopenia were being over 70 y (compared to being 65–69 y), having a higher waist circumference, and higher PLR values. Lower NLR values decreased the likelihood of possible sarcopenia.
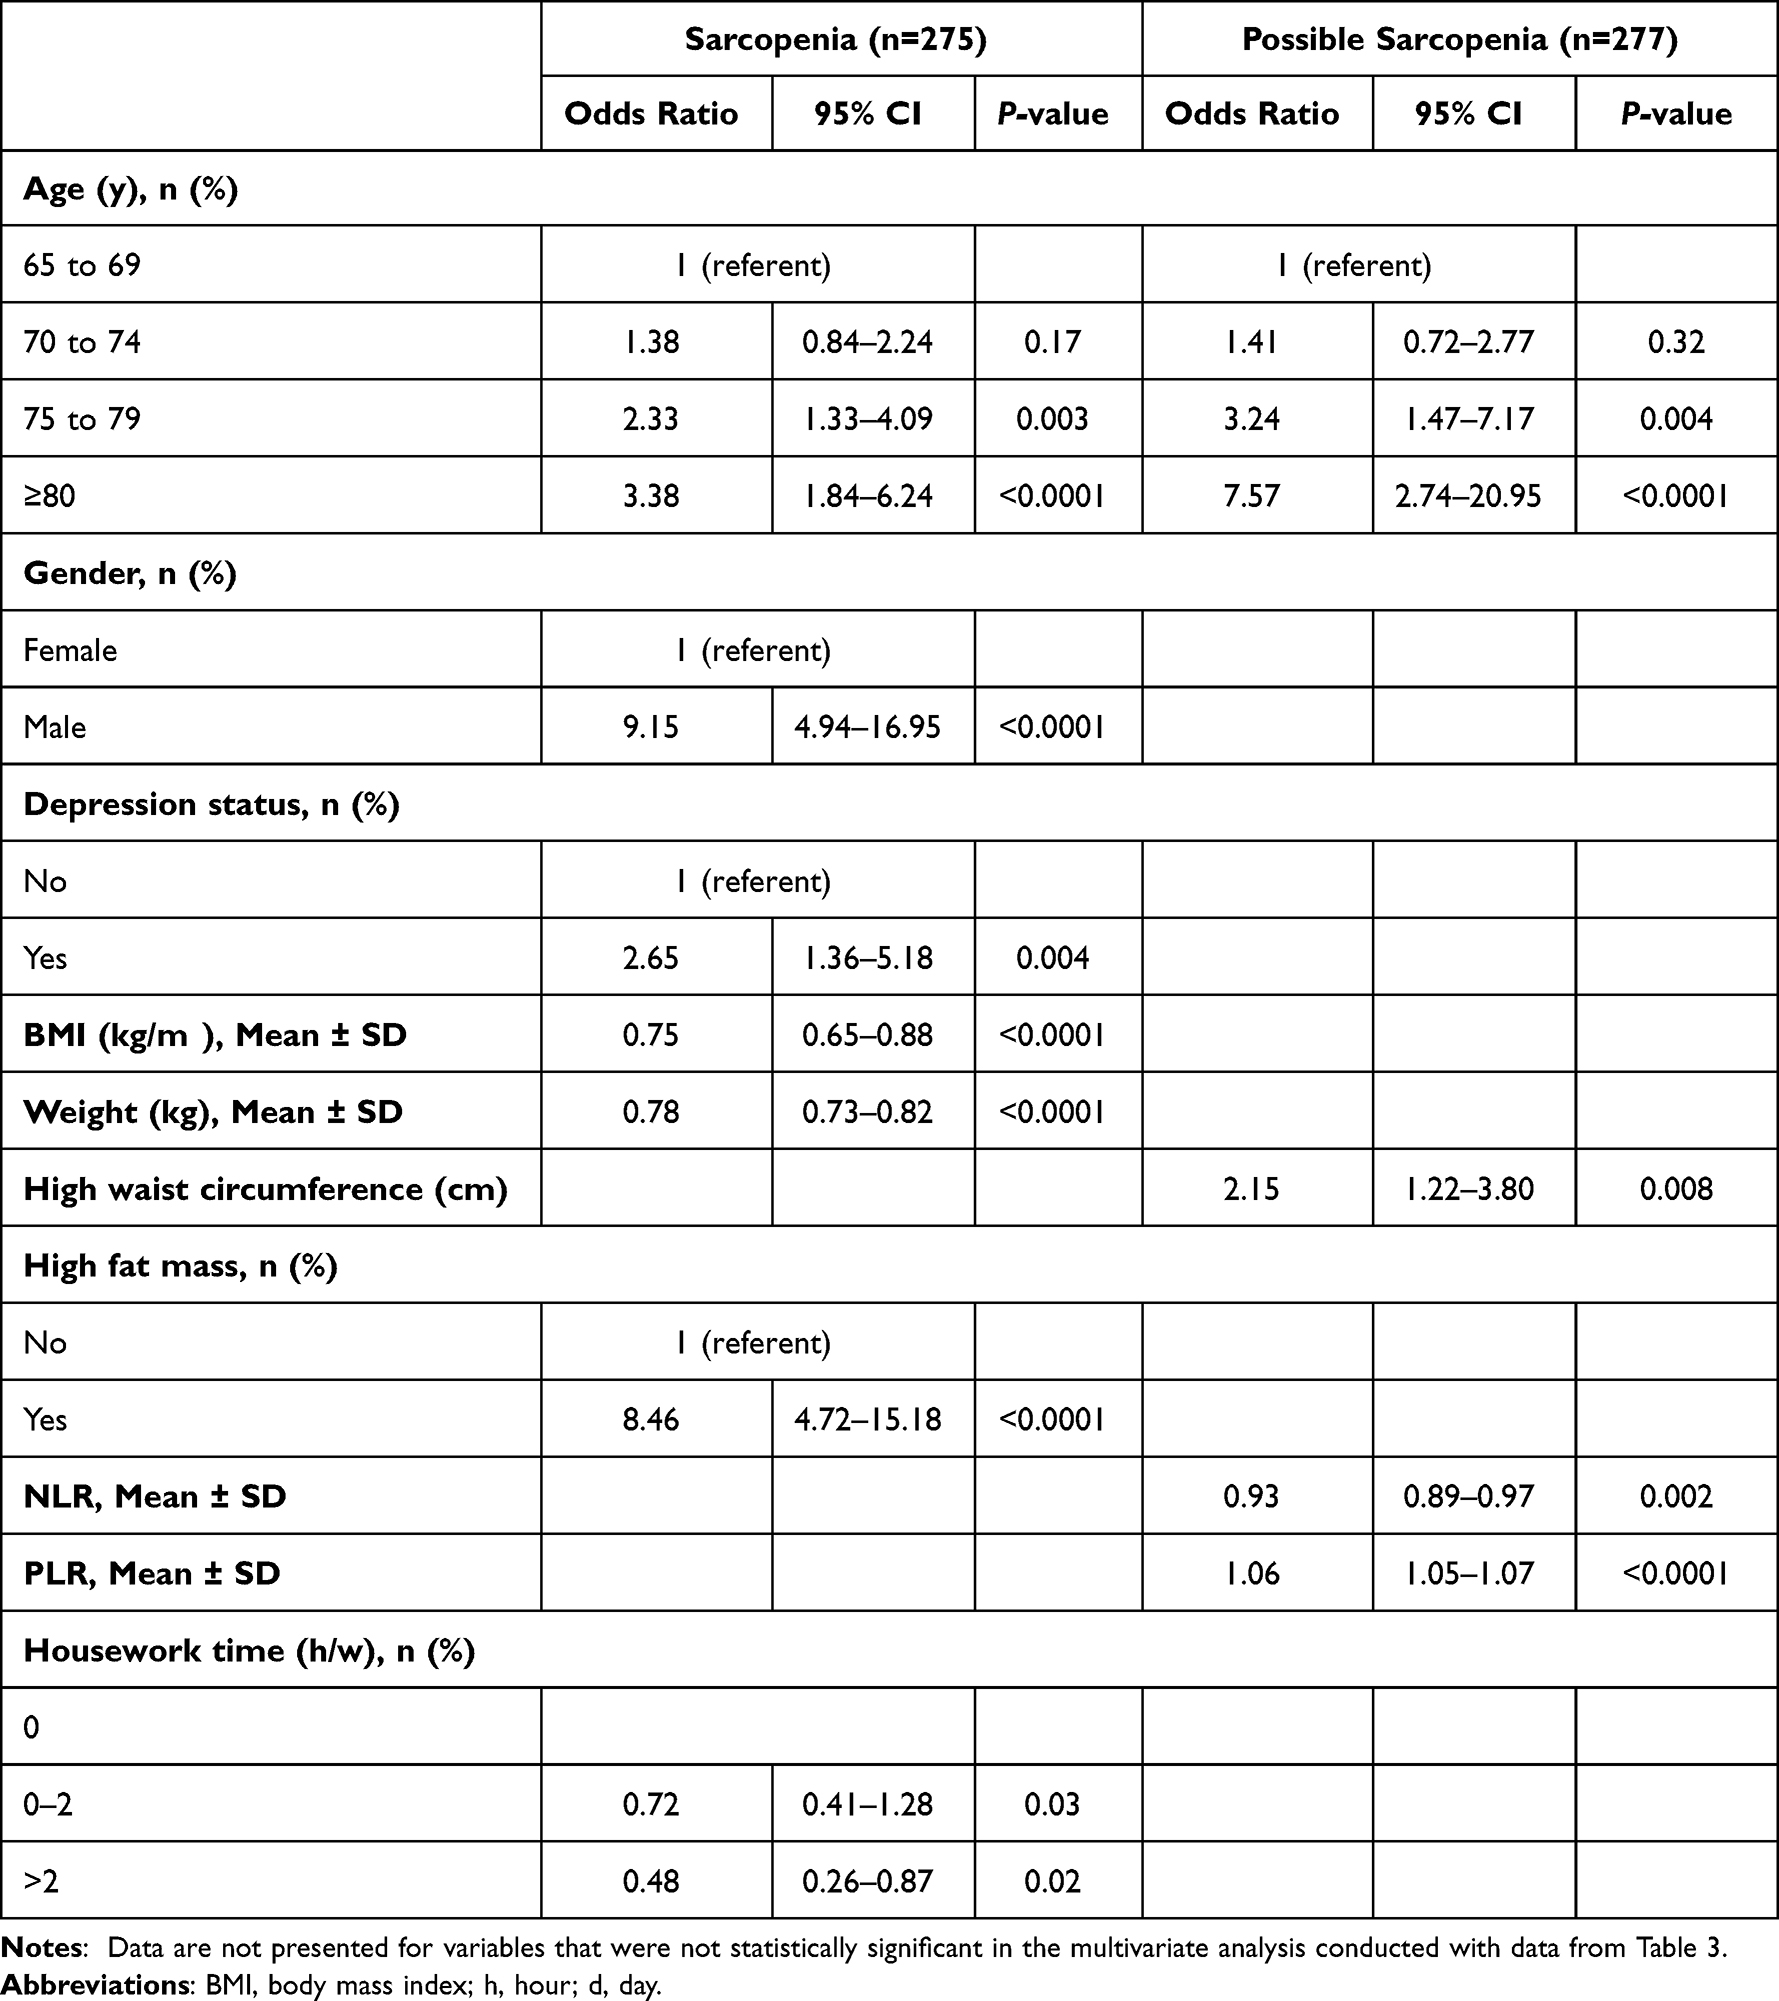 |
Table 5 Odds Ratios (95% Confidence Interval) for Sarcopenia and Possible Sarcopenia by Sarcopenia-Related Factorsa |
Since gender increased the likelihood of sarcopenia (Table 5), we performed logistic regression analysis to compute the OR and 95% CI for the risk of sarcopenia from sarcopenia-related factors by gender (Table 6). In females, sarcopenia-related factors increasing the likelihood of sarcopenia were having a higher-fat mass and living alone. Sarcopenia-related factors decreasing the likelihood of sarcopenia were having a lower body weight and BMI, and engaging in housework. In males, sarcopenia-related factors increasing the likelihood of sarcopenia were having a higher fat mass and NLR values, and depression. Having a higher body weight and a lower BMI reduced the likelihood of sarcopenia.
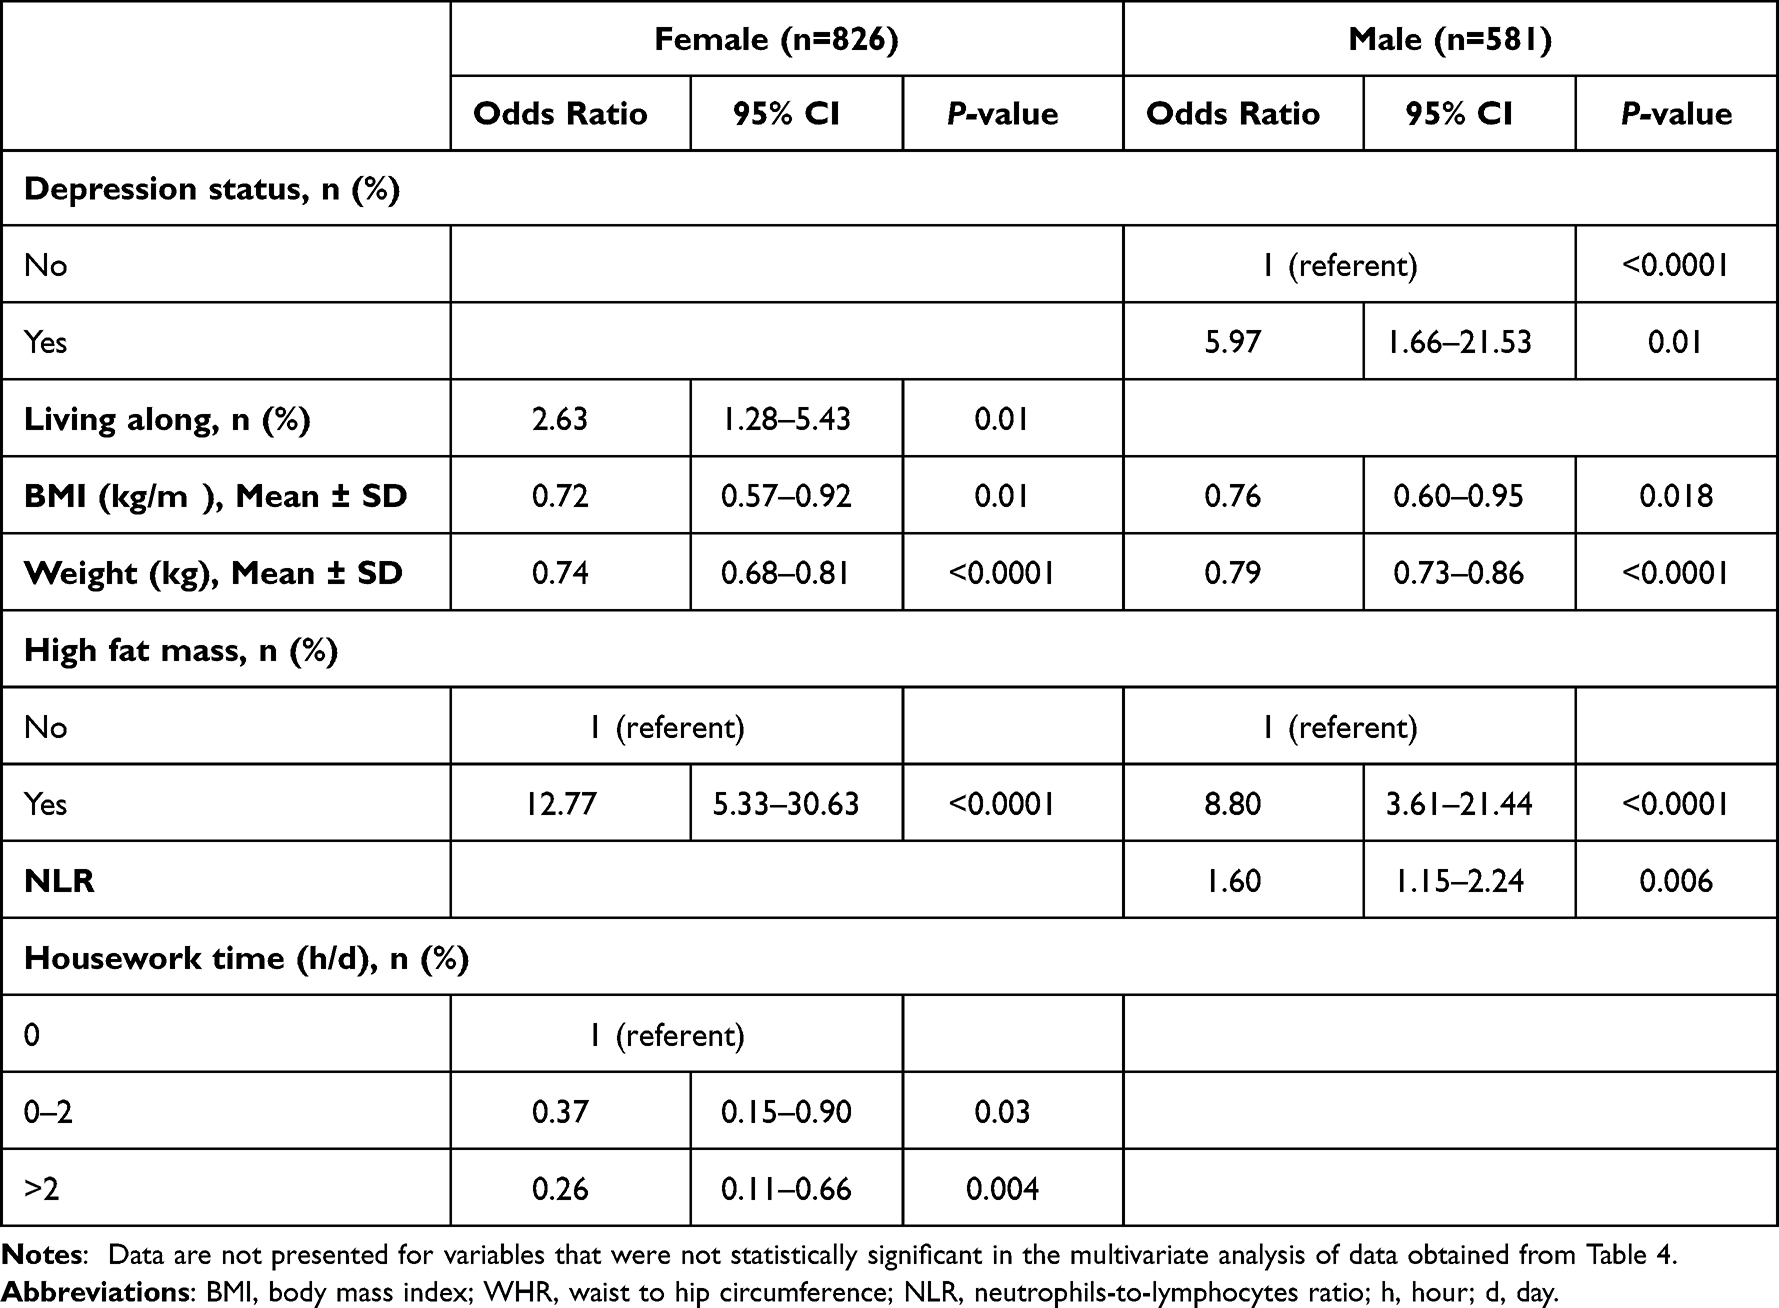 |
Table 6 Odds Ratios (95% Confidence Interval) for Sarcopenia-Related Factors by Gendera |
Discussion
In this, the prevalence of confirmed sarcopenia in the total sample was 19.5% with 17.1% in females and 23.1% in males. The prevalence of possible sarcopenia was higher in females than males and the prevalence of sarcopenia and severe sarcopenia was higher in males than females. In the total sample, sarcopenia was positively related to ages 75 y and older, depression status, high-fat mass, and male gender and negatively related to high body weight and BMI, and engaging in housework. Possible sarcopenia was related to being 75 y and older, having a high waist circumference, and high PLR values and negatively related to NLR values. In subgroup analysis by gender, sarcopenia was positively related to higher NLR values, high-fat mass, and depression and negatively related to higher body weight and BMI in males. In females, sarcopenia was positively related to living alone and high fat mass and negatively related to body weight and BMI, and housework time.
Previous studies have shown that the prevalence of sarcopenia varies by diagnostic criteria and in different populations. However, despite the diagnostic criteria used or populations studied, the prevalence of sarcopenia increases with age in older people, which is consistent with our results.26 Our results showed that the prevalence of possible sarcopenia and sarcopenia was higher in ages 75–79 y and over 80 y than ages 65 to 75 y. A meta-analysis by Chen et al also indicated that the odds of sarcopenia in Chinese men and women 80 years and older were two-to-three times higher than comparable people 60 to 70 years (females, OR= 3.28, 95% CI= 1.09–9.91; males, OR= 2.66, 95% CI= 1.28–5.50).27
We compared our results with several studies that used AWGS-2019 to diagnose sarcopenia among Chinese populations, as was done in our study. Surprisingly the prevalence of sarcopenia was higher in our study than in other studies. Du et al surveyed 631 older people in the urban community of Shanghai and found that the overall prevalence of sarcopenia was 12.2% (19.2% in females and 8.6% in males). The differences between studies might be due to the unique environments in which the subjects lived and worked. Compared with older people living in urban areas, rural older people typically do more physical work during their lifetime than urban dwellers. Theoretically, rural older people should have a lower sarcopenia prevalence given the increased amount of physical work performed. However, this may not be the case. In a comparison of sarcopenia in urban and rural older people, Gao et al12 reported rural older people had higher levels of sarcopenia than urban older people 13.1% vs 7%, respectively). The following reasons may help to understand rural-urban differences in sarcopenia prevalence. First, rural older people are at a higher risk of malnutrition than their urban counterparts, which may lead to reduced muscle mass and strength.28 Our research results confirmed this possibility as 1245 of 1407 (87%) older people in our study were at risk of malnutrition. Previous research has shown an association between dietary habits and sarcopenia suggesting low nutrient intake and poor adherence recommended dietary guidelines contributed to sarcopenia29,30. Second, due to limited education and economic levels, the older people’s PAs in this study consisted mainly of low-to-moderate intensity farming or housework. Over 90% of our subjects did not report doing regular exercise. A cross-sectional study from Zeng et al indicated that rural farmers were weaker in muscle strength and physical performance than non-farming Chinese older people.31 Farm work keeps people in an unhealthy posture (such as trunk bending, long-term squatting, or kneeling) for a long time, leading to muscle fatigue. This type of work places the body in continual fatigue and increases the risk of musculoskeletal disorders.32 In addition, chronic low-level exposure to pesticides may also be associated with an increased prevalence of muscle symptoms including neurological symptoms and muscle weakness.33 These muscle symptoms may deter older adults from regular exercise and leisure-time PA.
Huang et al, screened 266 older people over age 65 y in Zhoushan (the fourth largest island in China) and found that the prevalence of sarcopenia was 16.37% (20.59% in females and 12.9% in males).26 Other studies also show the prevalence of sarcopenia in males is comparable to that in females or is lower in males than in females.34 The prevalence of sarcopenia in the Huang et al study was similar to ours for all subjects combined (19.5%) and in females (17.1%) but not males (23.1%). We showed that the likelihood of males diagnosed with sarcopenia was nine times as likely as females diagnosed with sarcopenia (OR=9.15, 95% CI=4.94–16.95). We speculate that gender differences in sarcopenia may be due to the following reasons. First, we found that depression status and NLR, a marker of subclinical inflammation, were related factors for sarcopenia in males but not in females. Inflammation plays an essential role in the development of sarcopenia and depression. Inflammatory cytokines increase the interstitial concentrations of norepinephrine, dopamine, serotonin, and their metabolites in the hypothalamus and hippocampus, leading to the development of depression.35 People with depressive symptoms have lower levels of PA, increasing the risk of sarcopenia. Li et al’s meta-analysis supports the association between depression and sarcopenia, reporting an overall adjusted OR between depression and sarcopenia of 1.57 (95% CI: 1.32–1.86).36 Huang et al also showed that increased PA among rural older people was associated with a reduced risk of chronic diseases and that lower PA levels might contribute to sarcopenia.37 Our results confirmed this finding. We showed significantly lower levels of PA in older people with confirmed sarcopenia and possible sarcopenia than in those with non-sarcopenia. We also found a decreasing pattern in the prevalence of sarcopenia and possible sarcopenia with increasing PA levels. Second, males were mainly engaged in low-to-moderate intensity farming work and lacked regular exercise participation. Labor-intensive work (shoveling, moving heavy loads, and weeding) can cause musculoskeletal disorders. Prolonged farm work during the day takes time and can cause muscle fatigue and musculoskeletal disorders. This work may explain the inverse association between exercise and sarcopenia in males. Our study also indicated that engaging in housework is inversely related to sarcopenia. Females in our study who performed housework for 0–2 h/d and over 2 h/d decreased the likelihood of sarcopenia by 63% and 74%, respectively, compared to females who did not report spending time doing housework. This association reinforces the concept of housework as a health-enhancing, light-to-moderate intensity PA.38
Most older people develop inflammation with aging. Several studies have demonstrated that chronic low-grade inflammation plays an essential role in the progression of sarcopenia.39,40 Age-related inflammation alters cellular protein metabolism to promote proteolysis, accelerating muscle wasting.41 Inflammatory biomarkers, such as interleukin-6 (IL-6), C-reactive protein (CRP), and tumor necrosis factor-alpha (TNF-α) contribute to skeletal muscle proteolysis activation and insulin resistance. These biomarkers, NLR, PLR, and WBC, have been associated with sarcopenia.42 In a cross-sectional study of 3671 older adults, Liaw et al showed that higher PLR levels were associated with a higher risk of sarcopenia in community-dwelling older people.43 They found that PLR was negatively associated with the skeletal muscle index, a ratio of muscle strength to height. Hu et al also noted that NLR was an independent predictor for sarcopenia risk.44 Our results showed that higher NLR values increased the likelihood of sarcopenia in males by 62%, but not in females. However, not all studies support the findings observed in the studies mentioned above. Dupont et al and Tang et al reported no association between PLR, NLR, and WBC and sarcopenia.45,46
Identification of persons with possible sarcopenia is essential in early detection of sarcopenia in primary care settings. “Possible sarcopenia” defined as low muscle strength with or without reduced physical performance according to AWGS 2019. Our results showed that old people with possible sarcopenia had significant higher NLR and PLR values than those without sarcopenia. Borges et al also indicated that NLR had a negative correlation with handgrip strength and gait speed. These results indicated that systemic inflammation measured by NLR and PLR were associated with possible sarcopenia risk.47 As no other studies have reported associations between NLR and PLR inflammatory markers and possible sarcopenia, more large-scale studies should be conducted in the future study to verify the relationship between inflammatory biomarkers levels and possible sarcopenia status in diverse populations. As inexpensive and easily measurable parameters, NLR and PLR (and other) inflammatory biomarkers can be obtained from routine blood measurements, reducing the burden of separate testing sessions on medical staff and medical costs. Unfortunately, during routine community physical examinations in China (especially in areas with limited medical practices), inflammatory biomarkers are seldom measured, limiting their utility to identify sarcopenia status in clinical settings.
Chronic low-grade inflammation is a high-risk factor for sarcopenia and CVD. Sarcopenia also is an associated risk factor for hyperlipidemia and insulin resistance, which is associated with CVD risk.48 Our results showed that high-fat mass was associated with sarcopenia regardless of gender. This finding is consistent with other studies.49,50 In addition, our results also showed that a high BMI and high body weight were inversely related to sarcopenia. According to Li et al49 we infer that fat is redistributed into the intra-abdominal area and muscle during aging. Intramuscular fat infiltration reduces muscle renewal leading to pre-sarcopenia. Further, muscle loss (pre-sarcopenia) and fatty infiltration (myosteatosis) can aggravate low-grade inflammation and systemic insulin resistance. Due to the mutual masking of muscle loss and fat mass increase, the subjects can maintain an average weight but still show fat increases. For example, in our study, body weight and BMI values of study subjects with possible sarcopenia were similar to those with non-sarcopenia. Increases in myosteatosis may be an explanation for the increased likelihood of possible sarcopenia with higher waist circumferences in our study. Myosteatosis (and insulin resistance) also can increase lipolysis and local free fatty acid concentrations, increasing hyperlipidemia concentration. Chronic inflammation depletes existing and newly formed adipose depots and exacerbates muscle atrophy. This is consistent with our results showing an increased likelihood of sarcopenia with lower BMIs and body weights and increased likelihood of possible sarcopenia with higher fat mass. Only a few studies have reported the association between CVD risk factors and sarcopenia in Asian populations.51,52 Our study showed no associations between diabetes, hypertension, or dyslipidemia with sarcopenia. However, Han et al noted that sarcopenia is associated with diabetes and hypertension among Chinese people in Tianjin.53 There are very few studies on the relationship between diabetes, hypertension and dyslipidemia and sarcopenia, and further studies are needed to explore it.
Our study has several strengths. First, the study subjects were community-dwelling people over 65 y in Chongming district, a rural area of Shanghai, China. Our research is the first large-scale cross-sectional study to explore the prevalence of sarcopenia in three diagnostic stages (pre-sarcopenia, sarcopenia, and severe sarcopenia) in older people in the Chongming district using the latest diagnostic criteria. We also identified sarcopenia-related factors to include sociodemographic, clinical, CVD, inflammatory, PA, and lifestyle factors. Studies on the prevalence of sarcopenia in Chinese rural areas are rare,12,54 and previous studies have mainly focused on urban populations in China.11,12 Accordingly, this study can inform prevention and treatment programs for sarcopenia in rural older people in China. Second, in addition to exploring the significance of sarcopenia-related factors for sarcopenia and possible sarcopenia published in other studies, we explored the impact of additional CVD risk factors, inflammation markers, and PA on sarcopenia and possible sarcopenia. This expands the sarcopenia-related factors associated with sarcopenia. Third, we explored the strengths of sarcopenia-related factors in increasing or decreasing the likelihood of possible sarcopenia and sarcopenia in the total population and the likelihood of sarcopenia by gender. Sarcopenia is a dynamic condition with bidirectional transitions between sarcopenia-related factors and different sarcopenia stages, especially the first stage, possible sarcopenia. Timely detection and interventions to improve physical function and control chronic conditions can help offset sarcopenia progression.55 Knowing the strength of sarcopenia-related factors for sarcopenia progression is relevant for addressing sarcopenia in primary care settings. Fourth, we selected measurement parameters that were easy to collect, inexpensive, and suitable for wide use in community settings. Last, we also explored the relationship between tertiles of PA (low, middle, and high) on the prevalence of sarcopenia stages. As tertiles of PA decreased, the prevalence of possible sarcopenia, sarcopenia, and severe sarcopenia increased. This underscores the importance of maintaining a physically active lifestyle to maintain muscle mass and strength. This study also has some limitations. We used questionnaires to assess PA and daily lifestyle activities. Self-report questionnaires are subject to recall and social desirability bias. Also, our response rate was somewhat low (21.3%), which may influence the generalizability of our results.
Conclusions
This cross-sectional study showed a high prevalence of sarcopenia among community-dwelling older people aged ≥65 years in a rural area of Shanghai, especially in male. Confirmed sarcopenia increases significantly with age, especially in male, and is associated with gender, depressive status, BMI, weight, and high-fat mass. Our subgroup analysis by gender found that factors such as depression, inflammation, and housework activities may have contributed to the risk of sarcopenia. Possible sarcopenia is highly prevalent and is associated with high waist circumference, NLR, PLR, and housework.
The Chongming district of Shanghai has the highest proportion of older people in Shanghai. Due to limited medical facilities and inconvenient public transportation to and within Chongming, sarcopenia research has not been conducted in this area. The lifestyles of the older people in rural areas are unique, requiring sarcopenia-related factors to be addressed, such as farming, that not relevant in urban areas. These findings highlight the need for sarcopenia detection in primary care clinical settings with sarcopenia prevention and treatment programs provided for in rural Chinese older people.
Acknowledgment
This study is funded by the project of National Natural Science Foundation of China “Mechanism of the Regulation of Skeletal Muscle Cell AMPK Pathway by Intestinal P.merdae in the Progression of Sarcopenia” (No.82102651) and the special health research project of Shanghai Municipal Health Commission on the Health of Ageing, Woman and Children, Exploration on the Screening and Rehabilitation Intervention Model for Sarcopenia among Community-dwelling Older people in Chongming district under the Medical Union Model. (No. 2020YJZX0137).
Disclosure
The authors declare that they have no competing interests.
References
1. Chen LK, Woo J, Assantachai P, Auyeung TW, Arai H. Asian working group for sarcopenia: 2019 consensus update on sarcopenia diagnosis and treatment. J Am Med Dir Assoc. 2020;21:300–307.e2. doi:10.1016/j.jamda.2019.12.012
2. Cruz-Jentoft A, Sayer A. Sarcopenia. Lancet. 2019;393:2636–2646. doi:10.1016/S0140-6736(19)31138-9
3. Von Haehling S, Morley J, Anker S. From muscle wasting to sarcopenia and myopenia: update 2012. J Cachexia Sarcopenia Muscle. 2012;3:213–217. doi:10.1007/s13539-012-0089-z
4. Roh Y, Koh Y, Noh J, Gong H, Baek G. Evaluation of sarcopenia in patients with distal radius fractures. Arch Osteoporos. 2017;12:5. doi:10.1007/s11657-016-0303-2
5. Nagano A, Wakabayashi H, Maeda K, et al. Respiratory sarcopenia and sarcopenic respiratory disability: concepts, diagnosis, and treatment. J Nutr Health Aging. 2021;25:507–515. doi:10.1007/s12603-021-1587-5
6. Xia M, Chen L, Wu L, et al. Sarcopenia, sarcopenic overweight/obesity and risk of cardiovascular disease and cardiac arrhythmia: a cross-sectional study. Clin Nutr. 2021;40:571–580. doi:10.1016/j.clnu.2020.06.003
7. Petermann-Rocha F, Gray S, Pell J, Ho F, Celis-Morales C. The joint association of sarcopenia and frailty with incidence and mortality health outcomes: a prospective study. Clin Nutr. 2021;40:2427–2434. doi:10.1016/j.clnu.2020.10.044
8. Cruz-Jentoft A, Bahat G, Bauer J, et al. Sarcopenia: revised European consensus on definition and diagnosis. Age Ageing. 2019;48:16–31. doi:10.1093/ageing/afy169
9. Janssen I, Shepard D, Katzmarzyk P, Roubenoff R. The healthcare costs of sarcopenia in the United States. J Am Geriatr Soc. 2004;52(1):80–85. doi:10.1111/j.1532-5415.2004.52014.x
10. National bureau of statistics. Key data from the seventh national census. Available from: http://www.stats.gov.cn/ztjc/zdtjgz/zgrkpc/dqcrkpc/ggl/202105/t20210519_1817693.html.
11. Yang L, Yao X, Shen J, et al. Comparison of revised ewgsop criteria and four other diagnostic criteria of sarcopenia in Chinese community-dwelling elderly residents. Exp Gerontol. 2020;130:110798. doi:10.1016/j.exger.2019.110798
12. Gao L, Jiang J, Yang M, Hao Q, Luo L, Dong B. Prevalence of sarcopenia and associated factors in Chinese community-dwelling elderly: comparison between rural and urban areas. J Am Med Dir Assoc. 2015;16:1003.e1–6. doi:10.1016/j.jamda.2015.07.020
13. Kitamura A, Seino S, Abe T, et al. Sarcopenia: prevalence, associated factors, and the risk of mortality and disability in Japanese older adults. J Cachexia Sarcopenia Muscle. 2021;12:30–38. doi:10.1002/jcsm.12651
14. Chen L, Woo J, Assantachai P, et al. Asian working group for sarcopenia: 2019 consensus update on sarcopenia diagnosis and treatment. J Am Med Dir Assoc. 2020;21:300–307
15. Vellas B, Guigoz Y, Garry P, et al. The mini nutritional assessment (MNA) and its use in grading the nutritional state of elderly patients. Nutrition. 1999;15:116–122. doi:10.1016/S0899-9007(98)00171-3
16. Folstein M, Folstein S, McHugh P. ”Mini-mental state”. A practical method for grading the cognitive state of patients for the clinician. J Psychiatr Res. 1975;12:189–198. doi:10.1016/0022-3956(75)90026-6
17. Tang D. Application of short form geriatric depression scale (GDS-15)in Chinese elderly. Chin J Clin Psychol. 2013;21:402–405.
18. Pocklington C, Gilbody S, Manea L, McMillan D. The diagnostic accuracy of brief versions of the geriatric depression scale: a systematic review and meta-analysis. Int J Geriatr Psychiatry. 2016;31:837–857. doi:10.1002/gps.4407
19. World Health Organization. Physical status: the use and interpretation of anthropometry. Report of a WHO expert committee. World Health Organ Tech Rep Ser. 1995;854:1–452.
20. Després J, Lemieux I, Prud’homme D. Treatment of obesity: need to focus on high risk abdominally obese patients. BMJ. 2001;322:716–720. doi:10.1136/bmj.322.7288.716
21. Lean M, Han T, Morrison C. Waist circumference as a measure for indicating need for weight management. BMJ. 1995;311:158–161. doi:10.1136/bmj.311.6998.158
22. Kuzuya T, Nakagawa S, Satoh J. Report of the committee on the classification and diagnostic criteria of diabetes mellitus. Diabetes Res Clin Pract. 2002;1:2–20.
23. World Health Organization-Expert Committee on Physical Status. Physical status: the use and interpretation of anthropometry. In: Report of a WHO Expert Committee. Geneva, Switzerland: World Health Organization; 1995:1–452.
24. China guidelines for prevention and management of dyslipideamias in Chinese adults. The association committee of formulating the guidelines for prevention and management of dyslipidemias in Chinese adults. People’s Medical Publishing House; 2004.
25. Qu N, Li K-J. Study on the reliability and validity of international physical activity questionnaire (Chinese vision, IPAQ). Chin J Epidemiol. 2004;25:265–268.
26. Huang J, He F, Gu X, Chen S, Tong Z, Zhong S. Estimation of sarcopenia prevalence in individuals at different ages from Zheijang province in China. Aging. 2021;13:6066–6075. doi:10.18632/aging.202567
27. Chen Z, Li W, Ho M, Chau P. The prevalence of sarcopenia in Chinese older adults: meta-analysis and meta-regression. Nutrients. 2021;14:13. doi:10.3390/nu14010013
28. Chen Y, Yu C, Lin Y, et al. Brain ct can predict low lean mass in the elderly with cognitive impairment: a community-dwelling study. BMC Geriatr. 2022;22:3. doi:10.1186/s12877-021-02626-8
29. Otsuka Y, Iidaka T, Horii C, et al. Dietary intake of vitamin e and fats associated with sarcopenia in community-dwelling older Japanese people: a cross-sectional study from the fifth survey of the road study. Nutrients. 2021;13:1730. doi:10.3390/nu13051730
30. Karlsson M, Becker W, Michaëlsson K, Cederholm T, Sjögren P. Associations between dietary patterns at age 71 and the prevalence of sarcopenia 16 years later. Clin Nutr. 2020;39:1077–1084. doi:10.1016/j.clnu.2019.04.009
31. Zeng P, Han Y, Pang J, et al. Sarcopenia-related features and factors associated with lower muscle strength and physical performance in older Chinese: a cross sectional study. BMC Geriatr. 2016;16:45. doi:10.1186/s12877-016-0220-7
32. Kang F, He Z, Feng B, Qu W, Zhang B, Wang Z. Prevalence and risk factors for msds in vegetable greenhouse farmers: a cross-sectional survey from Shandong rural area, China. Med Lav. 2021;112:377–386. doi:10.23749/mdl.v112i5.11490
33. Hongsibsong S, Sittitoon N, Sapbamrer R. Association of health symptoms with low-level exposure to organophosphates, DNA damage, ache activity, and occupational knowledge and practice among rice, corn, and double-crop farmers. J Occup Health. 2017;59:165–176. doi:10.1539/joh.16-0107-OA
34. Liu X, Hou L, Xia X, et al. Prevalence of sarcopenia in multi ethnics adults and the association with cognitive impairment: findings from west-China health and aging trend study. BMC Geriatr. 2020;20:63. doi:10.1186/s12877-020-1468-5
35. Brach J, FitzGerald S, Newman A, et al. Physical activity and functional status in community-dwelling older women: a 14-year prospective study. Arch Intern Med. 2003;163:2565–2571. doi:10.1001/archinte.163.21.2565
36. Li Z, Tong X, Ma Y, Bao T, Yue J. Prevalence of depression in patients with sarcopenia and correlation between the two diseases: systematic review and meta-analysis. J Cachexia Sarcopenia Muscle. 2022;13:128–144. doi:10.1002/jcsm.12908
37. Huang X, Yang H, Wang H, et al. The association between physical activity, mental status, and social and family support with five major non-communicable chronic diseases among elderly people: a cross-sectional study of a rural population in southern China. Int J Environ Res Public Health. 2015;12:13209–13223. doi:10.3390/ijerph121013209
38. Lawlor D, Taylor M, Bedford C, Ebrahim S. Is housework good for health? Levels of physical activity and factors associated with activity in elderly women. Results from the British women’s heart and health study. J Epidemiol Community Health. 2002;56:473–478. doi:10.1136/jech.56.6.473
39. Beyer I, Mets T, Bautmans I. Chronic low-grade inflammation and age-related sarcopenia. Curr Opin Clin Nutr Metab Care. 2012;15:12–22. doi:10.1097/MCO.0b013e32834dd297
40. Pan L, Xie W, Fu X, et al. Inflammation and sarcopenia: a focus on circulating inflammatory cytokines. Exp Gerontol. 2021;154:111544. doi:10.1016/j.exger.2021.111544
41. Xia Z, Cholewa J, Zhao Y, et al. Targeting inflammation and downstream protein metabolism in sarcopenia: a brief up-dated description of concurrent exercise and leucine-based multimodal intervention. Front Physiol. 2017;8:434. doi:10.3389/fphys.2017.00434
42. Tuttle C, Thang L, Maier A. Markers of inflammation and their association with muscle strength and mass: a systematic review and meta-analysis. Ageing Res Rev. 2020;64:101185. doi:10.1016/j.arr.2020.101185
43. Liaw F, Huang C, Chen W, et al. Higher platelet-to-lymphocyte ratio increased the risk of sarcopenia in the community-dwelling older adults. Sci Rep. 2017;7:16609. doi:10.1038/s41598-017-16924-y
44. Hu Q, Mao W, Wu T, et al. High neutrophil-to-lymphocyte ratio and platelet-to-lymphocyte ratio are associated with sarcopenia risk in hospitalized renal cell carcinoma patients. Front Oncol. 2021;11:736640. doi:10.3389/fonc.2021.736640
45. Dupont J, Antonio L, Dedeyne L, et al. Inflammatory markers are associated with quality of life, physical activity, and gait speed but not sarcopenia in aged men (40–79 years). J Cachexia Sarcopenia Muscle. 2021;12:1818–1831. doi:10.1002/jcsm.12785
46. Tang T, Xie L, Tan L, Hu X, Yang M. Inflammatory indexes are not associated with sarcopenia in Chinese community- dwelling older people: a cross-sectional study. BMC Geriatr. 2020;20:457. doi:10.1186/s12877-020-01857-5
47. Karakelides H, Nair KS. Sarcopenia of aging and its metabolic impact. Curr Top Dev Biol. 2005;68:123–148.
48. Borges T, Gomes T, Pichard C, et al. High neutrophil to lymphocytes ratio is associated with sarcopenia risk in hospitalized cancer patients. Clin Nutr. 2021;40(1):202–206. doi:10.1016/j.clnu.2020.05.005
49. Li C, Yu K, Shyh-Chang N, et al. Pathogenesis of sarcopenia and the relationship with fat mass: descriptive review. J Cachexia Sarcopenia Muscle. 2022;13:781–794. doi:10.1002/jcsm.12901
50. Nasimi N, Dabbaghmanesh M, Sohrabi Z. Nutritional status and body fat mass: determinants of sarcopenia in community-dwelling older adults. Exp Gerontol. 2019;122:67–73. doi:10.1016/j.exger.2019.04.009
51. Zhang X, Huang L, Peng X, et al. Clinical and experimental hypertension association of handgrip strength with hypertension among middle-aged and elderly people in southern China: a cross-sectional study. Clin Exp Hypertens. 2020;42:190–196. doi:10.1080/10641963.2019.1601206
52. Jung E, Ji W, Lee J, Suh Y, Kim D. Association between sarcopenia and diabetes according to age in Korean adults. Korean J Fam Pract. 2016;6:242–248. doi:10.21215/kjfp.2016.6.4.242
53. Han P, Yu H, Ma Y, et al. The increased risk of sarcopenia in patients with cardiovascular risk factors in suburb-dwelling older Chinese using the awgs definition. Sci Rep. 2017;7:9592. doi:10.1038/s41598-017-08488-8
54. Zhu W, Chi A, Sun Y. Physical activity among older Chinese adults living in urban and rural areas: a review. J Sport Health Sci. 2016;3:281–286. doi:10.1016/j.jshs.2016.07.004
55. Trevisan C, Vetrano D, Calvani R, Picca A, Welmer A. Twelve-year sarcopenia trajectories in older adults: results from a population-based study. J Cachexia Sarcopenia Muscle. 2022;13:254–263. doi:10.1002/jcsm.12875
 © 2022 The Author(s). This work is published and licensed by Dove Medical Press Limited. The
full terms of this license are available at https://www.dovepress.com/terms
and incorporate the Creative Commons Attribution
- Non Commercial (unported, 3.0) License.
By accessing the work you hereby accept the Terms. Non-commercial uses of the work are permitted
without any further permission from Dove Medical Press Limited, provided the work is properly
attributed. For permission for commercial use of this work, please see paragraphs 4.2 and 5 of our Terms.
© 2022 The Author(s). This work is published and licensed by Dove Medical Press Limited. The
full terms of this license are available at https://www.dovepress.com/terms
and incorporate the Creative Commons Attribution
- Non Commercial (unported, 3.0) License.
By accessing the work you hereby accept the Terms. Non-commercial uses of the work are permitted
without any further permission from Dove Medical Press Limited, provided the work is properly
attributed. For permission for commercial use of this work, please see paragraphs 4.2 and 5 of our Terms.
Recommended articles
Prevalence, Clinical Profile and Risk Factors of Nosocomial Infection in Ayder Pediatric Intensive Care Unit, Tigray, Ethiopia
Mohamed AA, Haftu H, Hadgu A, Seyoum D, Gebrekidan G, Ebrahim MM, Yusuf AA, Mustefa M
International Journal of General Medicine 2022, 15:7145-7153
Published Date: 9 September 2022
Factors Associated with Health-Related Quality of Life in Older Persons Residing in Nursing Homes
Boström AM, Cederholm T, Faxén-Irving G, Franzén E, Grönstedt H, Seiger, Vikström S, Wimo A
Journal of Multidisciplinary Healthcare 2022, 15:2615-2622
Published Date: 11 November 2022
Prevalence, General and Periodontal Risk Factors of Gastroesophageal Reflux Disease in China
Liu Z, Gao X, Liang L, Zhou X, Han X, Yang T, Huang K, Lin Y, Deng S, Wang Z, Wang C
Journal of Inflammation Research 2023, 16:235-244
Published Date: 17 January 2023
A Cross-Sectional Analysis to Assess the Role of Atopy in Keratoconus Among Saudi Population
Abuallut II, Alomaish AR, Arishy AM, Mashragi MA, Alfaifi KH, Alnamazi NA, Moafa AM, Mahfouz MS, Moafa MA, Jafaari SA, Alagsam AA, Albalawi HB, Jareebi MA
International Journal of General Medicine 2023, 16:4873-4881
Published Date: 27 October 2023
Prevalence and Associated Factors of Thyroid Nodules Among 52,003 Chinese ‘Healthy’ Individuals in Beijing: A Retrospective Cross-Sectional Study
Xu J, Lau P, Ma Y, Zhao N, Yu X, Zhu H, Li Y
Risk Management and Healthcare Policy 2024, 17:181-189
Published Date: 17 January 2024